Heavy metals in alluvial gold mine spoils in the peruvian amazonManuel Gabriel Velásquez Ramíreza,⁎,1, Juan Antonio Guerrero Barrantesb, Evert Thomasc,Luis Alfredo Gamarra Mirandad, Martin Pillacae, Lily Denise Tello Peramasb,Luis Rubén Bazán Tapiab
a Instituto de Investigaciones de la Amazonía Peruana (IIAP), Proyecto Recuperación de Áreas Degradadas y Manejo Sistémico del Bosque, Jr. Ica N°1162 PuertoMaldonado, Apartado postal 17001, Perub Soil Department, Universidad Nacional Agraria, La Molina, Av. La Molina s/n, apartado postal Lima12, Lima, Peruc Bioversity International, Avenida La Molina 1895, La Molina, Lima, Perud Urb. Ciudad del Pescador Bellavista Callao Mz 02 Lote 27 Calle 49, Apartado postal Callao 02, Callao, Perue Centro de Innovación Científica Amazónica (CINCIA), Jr. Cajamarca s/n, Apartado postal 17001, Madre de Dios, Peru
Alluvial gold mining in the Peruvian Amazon has become a key driver of land degradation and deforestation. Theassociated release of mercury in the environment poses direct human health risks and is likely to engendercascading effects throughout local food chains. We carried out research in an alluvial gold mine concession in theMadre de Dios region to compare the degree of soil-borne pollution of heavy metals in areas where miningoperations were abandoned more and less recently (1–5 and 6–8 years ago, respectively) with non-impacted old-growth forest areas. All heavy metals, were below permissible levels according to Peruvian and Canadian en-vironmental quality standards. Mean As, Ba, Pb, Cu, Cr, Ni, V and Zn concentrations in impacted areas were1.90 ± 1.51, 29.80 ± 22.87, 4.60 ± 2.55, 12.68 ± 8.13, 7.90 ± 3.98, 7.93 ± 3.89, 12.67 ± 6.62, and26.65 ± 13.53 mg kg−1 dry matter (DM), respectively. Heavy metal concentrations were higher in non-im-pacted old growth forest soils than in mining spoils, and tended to increase with time since abandonment ofmining operations. Hg was not detected in any of the sites. Low heavy metal concentrations in mine spoils mightbeexplained because of intense volatilization, reduced metal retention capacity due to the low clay and organicmatter content, and leaching processes related with soil rinsing which is part of the mining operations combinedwith intense rainfall. Our findings suggest that heavy metal concentrations in mining spoils should not beconsidered to constrain forest restoration efforts or the development of similar land uses as in comparable non-impacted high forest soils.
1. Introduction
Global gold extraction has experienced a surge over recent yearslargely owing to booming international prices, reaching 1315.00US $OZ TR−1 in 2017 (World Gold Council, 2017). Peru occupied the 4thplace in the 2017 gold production, and overall mining represented 10%of the GDP. Gold extraction in the Peruvian Amazon has led to largescale deforestation and mercury pollution (Alvarez et al., 2011). In thedepartment of Madre de Dios, also known as the “Peruvian Capital ofBiodiversity”, artisanal and small gold production accounts for 8% ofthe total annual gold production in Peru of approximately 151 metric
tonnes (Ministerio de Minas y Energía, 2018). Gold mining in Madre deDios has resulted in the deforestation of 95,750 ha (Centro deInnovación Científica Amazónica, 2018). In recent years, annual de-forestation rates have fluctuated between 6000 and 11,000 ha (Asneret al., 2013) leading to an estimated topsoil loss of 1.3 t ha−1 year(Gomez, 2013).
Alluvial gold mining in Madre de Dios old growth forest generallyinvolves slash and burn deforestation, sediment extraction, amalga-mation of gold with mercury (Hg), burning, Hg evaporation and goldrecovery (Alvarez et al., 2011; Salinas, 2007). All these stages of goldproduction are typically carried out on site, hence generating an
https://doi.org/10.1016/j.catena.2020.104454Received 2 May 2019; Received in revised form 23 December 2019; Accepted 4 January 2020
importance source of Hg pollution in the local environment. Sedimentextraction is accomplished through the use of heavy machinery or ar-tisanal tools to bring sediment from different depths to the surface.During this process the topsoil -characterized by a fine texture- isscattered and coarse gravel, stones and boulders from deeper soil layersbecome to predominate at the surface (Salinas, 2007).
Hg is a potentially toxic metal which is known to accumulate in theecosystem (Moreno-Brush et al., 2016). In spite of the adoption of theMinamata Convention which to date has been ratified by more than 100countries worldwide, including Peru, to reduce human and environ-mental risk caused by Hg pollution (Ministerio del Ambiente, 2016),global annual production still amounts to 600,000 tonnes (United StatesGeological Survey, 2018). Hg pollution associated with gold mining hasbecome a huge social and environmental problem in Madre de Dios(Alvarez et al., 2011). It is estimated that > 3000 tonnes of Hg haveleaked in Amazonian rivers since 1980 (Webb et al., 2004). Some riverfish sampled registered more than 0.3 ppm of Hg which is the maximumlimit established by USEPA (United States Environmental ProtectionAgency, 1997). Furthermore, children hair sampled showed Hg con-centrations above 2.1 ppm while the maximum permissible level ac-cording to USEPA is 1 ppm (Fernandez et al., 2013).
Recent gold mine spoils are expected to be potential loci of con-tamination with mercury and other heavy metals, but exposure risks arestill not well understood. Here we aimed to reveal heavy metal pollu-tion rates (As, Ba, Pb, Hg, Cu, Cr, Ni, V and Zn) in soils impacted byartisanal alluvial gold mining in the Peruvian Amazon region, Madre deDios to provide baseline information to assess the need for pollutionmanagement strategies (Ministerio del Ambiente, 2018; RedLatinoamericana de Sitios Contaminados, 2016).
2. Materials and methods
2.1. Study area
We carried out research in the community of Fortuna, located in thePeruvian Amazon region of Madre de Dios (Fig. 1), which is one of theoldest areas were artisanal alluvial gold mining has traditionally beenpracticed. Annual precipitation, temperature and relative humidity inFortuna vary between 2000–2610 mm, 18–24 °C and 87–97%, respec-tively (Servicios Generales y Medio Ambiente, 2006). It is located at188 m.a.s.l. and is characterized by a warm, humid climate(Thornthwaite et al., 1949) with a climax vegetation of subtropicalhumid forests (Holdridge, 1967). The soil moisture content is not dry inany part for more than 90 cumulative days per year, classified as Udic
soil moisture regime. The soil temperature regime is classified as hy-perthermic with mean annual soil temperatures above 22 °C (SoilSurvey Staff, 2014).
2.2. Soil sampling
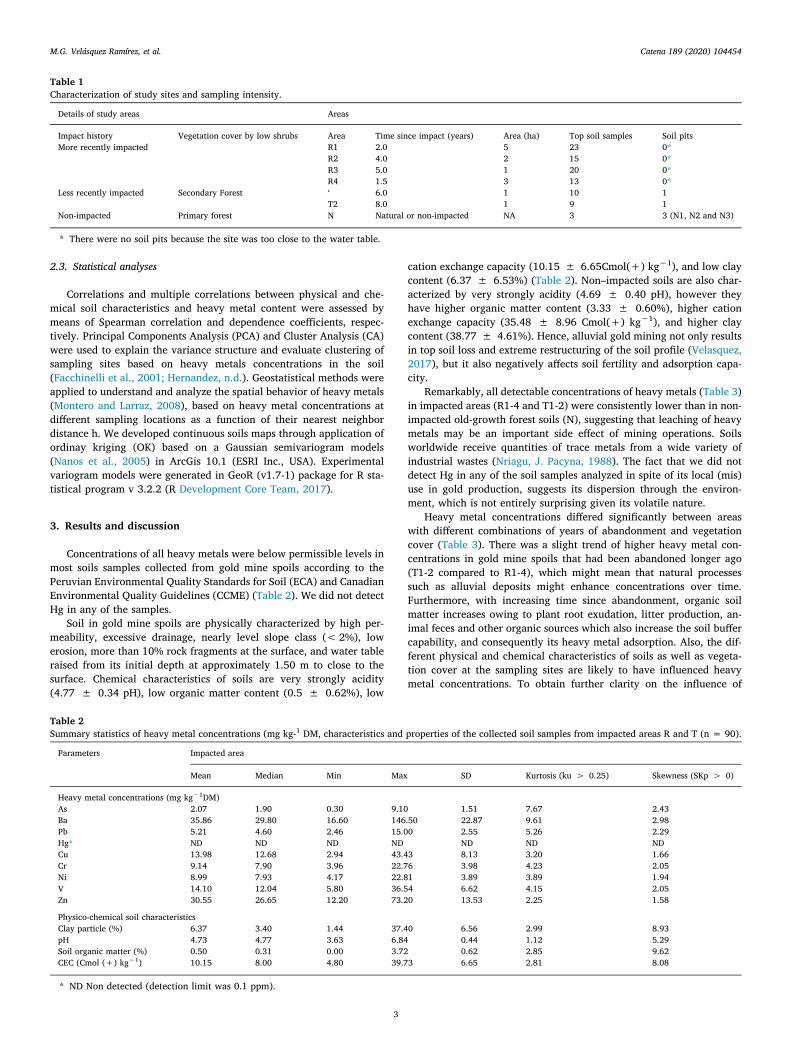
We collected 93 top soil samples (0–20 cm depth) through stratifiedrandom sampling across 13 ha; 90 samples were collected in gold minespoils and 3 in non–impacted forest sites. Samples were located in abroader 100 ha landscape matrix which had been subject to mining.Sampling was carried out in accordance with the Guide for SoilSampling of Peru (Ministerio del Ambiente, 2014), EnvironmentalQuality Standards for Soil of Peru (ECA) (Ministerio del Ambiente,2017) and the Canadian Environmental Quality Guidelines (CanadianCouncil of Ministers of the Environment No. 1299; ISBN 1-896997-34-1, 2007). The sampling design was adjusted to the nature of cover ve-getation and time since the last impact (Table 1). The main objectivewas to compare the degree of soil-borne pollution of heavy metals insoils that were abandoned more and less recently (1–5 and 6–8 yearsago, respectively) with those of non-impacted old growth forest areas.
Each soil sample consisted of approximately 1 kg of topsoil. Sampleswere mixed, stored, air dried, and passed through a 2.0 mm sieve, afterwhich we determined particle size distribution (sedimentationmethod); actual soil acidity in water extract 1:1, organic matter content(Walkley Black Method) and cation exchange capacity (CEC) (effectiveCEC and CEC measured with Ammonium acetate pH = 7). pH, soilorganic matter, cation exchange capacity and clay particle content (%)area the most important chemical characteristic and properties thatexplain the heavy metal distribution in soil (Salomons, 1995). Heavymetal content (As, Ba, Pb, Hg, Cu, Cr, Ni, V and Zn in mg kg−1 DM) wasanalyzed in accordance with the EPA Method 200.7, through the use ofICP-AES. Soil characterization analyses were conducted at the SoilChemical Analysis Laboratory, Universidad Nacional Agraria La Mo-lina. Heavy metal analyses were conducted at a certified privet la-boratory, Servicios Analiticos Generales SAC.
Additionally, we evaluated 2 soil pits in impacted areas (T1 and T2)and 3 soil pits in non – impacted areas (N1, N2 and N3) used asbackground. The soil pits were selected such that they were located inthe same life zone, geological zone (Palacios et al., 1996) and topo-graphical category (all at scale 1:100 000; Soil Science Division Staff2017)). Samples from non–impacted areas were used as references todetermine the impacts of alluvial gold mining on soil characteristicsand heavy metal content.
Fig. 1. Study area located at the community of Fortuna located in the Peruvian Amazon region of Madre de Dios.
M.G. Velásquez Ramírez, et al. Catena 189 (2020) 104454
2
2.3. Statistical analyses
Correlations and multiple correlations between physical and che-mical soil characteristics and heavy metal content were assessed bymeans of Spearman correlation and dependence coefficients, respec-tively. Principal Components Analysis (PCA) and Cluster Analysis (CA)were used to explain the variance structure and evaluate clustering ofsampling sites based on heavy metals concentrations in the soil(Facchinelli et al., 2001; Hernandez, n.d.). Geostatistical methods wereapplied to understand and analyze the spatial behavior of heavy metals(Montero and Larraz, 2008), based on heavy metal concentrations atdifferent sampling locations as a function of their nearest neighbordistance h. We developed continuous soils maps through application ofordinay kriging (OK) based on a Gaussian semivariogram models(Nanos et al., 2005) in ArcGis 10.1 (ESRI Inc., USA). Experimentalvariogram models were generated in GeoR (v1.7-1) package for R sta-tistical program v 3.2.2 (R Development Core Team, 2017).
3. Results and discussion
Concentrations of all heavy metals were below permissible levels inmost soils samples collected from gold mine spoils according to thePeruvian Environmental Quality Standards for Soil (ECA) and CanadianEnvironmental Quality Guidelines (CCME) (Table 2). We did not detectHg in any of the samples.
Soil in gold mine spoils are physically characterized by high per-meability, excessive drainage, nearly level slope class (< 2%), lowerosion, more than 10% rock fragments at the surface, and water tableraised from its initial depth at approximately 1.50 m to close to thesurface. Chemical characteristics of soils are very strongly acidity(4.77 ± 0.34 pH), low organic matter content (0.5 ± 0.62%), low
cation exchange capacity (10.15 ± 6.65Cmol(+) kg−1), and low claycontent (6.37 ± 6.53%) (Table 2). Non–impacted soils are also char-acterized by very strongly acidity (4.69 ± 0.40 pH), however theyhave higher organic matter content (3.33 ± 0.60%), higher cationexchange capacity (35.48 ± 8.96 Cmol(+) kg−1), and higher claycontent (38.77 ± 4.61%). Hence, alluvial gold mining not only resultsin top soil loss and extreme restructuring of the soil profile (Velasquez,2017), but it also negatively affects soil fertility and adsorption capa-city.
Remarkably, all detectable concentrations of heavy metals (Table 3)in impacted areas (R1-4 and T1-2) were consistently lower than in non-impacted old-growth forest soils (N), suggesting that leaching of heavymetals may be an important side effect of mining operations. Soilsworldwide receive quantities of trace metals from a wide variety ofindustrial wastes (Nriagu, J. Pacyna, 1988). The fact that we did notdetect Hg in any of the soil samples analyzed in spite of its local (mis)use in gold production, suggests its dispersion through the environ-ment, which is not entirely surprising given its volatile nature.
Heavy metal concentrations differed significantly between areaswith different combinations of years of abandonment and vegetationcover (Table 3). There was a slight trend of higher heavy metal con-centrations in gold mine spoils that had been abandoned longer ago(T1-2 compared to R1-4), which might mean that natural processessuch as alluvial deposits might enhance concentrations over time.Furthermore, with increasing time since abandonment, organic soilmatter increases owing to plant root exudation, litter production, an-imal feces and other organic sources which also increase the soil buffercapability, and consequently its heavy metal adsorption. Also, the dif-ferent physical and chemical characteristics of soils as well as vegeta-tion cover at the sampling sites are likely to have influenced heavymetal concentrations. To obtain further clarity on the influence of
Table 1Characterization of study sites and sampling intensity.
Details of study areas Areas
Impact history Vegetation cover by low shrubs Area Time since impact (years) Area (ha) Top soil samples Soil pitsMore recently impacted R1 2.0 5 23 0*
Non-impacted Primary forest N Natural or non-impacted NA 3 3 (N1, N2 and N3)
* There were no soil pits because the site was too close to the water table.
Table 2Summary statistics of heavy metal concentrations (mg kg-1 DM, characteristics and properties of the collected soil samples from impacted areas R and T (n = 90).
Parameters Impacted area
Mean Median Min Max SD Kurtosis (ku > 0.25) Skewness (SKp > 0)
M.G. Velásquez Ramírez, et al. Catena 189 (2020) 104454
3
Table3
Ave
rage
heav
ym
etal
conc
entr
atio
nsin
soil
sam
ples
from
impa
cted
area
sR1
-4an
dT1
-2(n
=90
),no
n-im
pact
edar
easN
1-3
(n=
3)an
dre
fere
nce
valu
esac
cord
ing
toPe
ruvi
anEn
viro
nmen
talQ
ualit
ySt
anda
rds
forS
oil
(ECA
)an
dCa
nadi
anEn
viro
nmen
talQ
ualit
yG
uide
lines
(CCM
E).
Para
met
ers
Impa
cted
area
n=
90N
onim
pact
edar
ean
=3
Soil
Peru
vian
Envi
ronm
enta
lQ
ualit
ySt
anda
rds
for
Soil
Soil
Cana
dian
Envi
ronm
enta
lQua
lity
Gui
delin
es
Rang
ehe
avy
met
alco
ncen
trat
ion
inso
ilKa
bata
and
Pend
ias
(201
1)R1
R2R3
R4T1
T2N
Indu
stri
also
ilA
gric
ultu
ral
soil
Indu
stri
also
ilA
gric
ultu
ral
soil
Hea
vym
etal
inso
il(m
gkg
−1 D
M)
As
a0.
93±
0.55
ab1.
57±
0.60
b2.
27±
1.10
bc2.
17±
0.45
c4.
48±
2.65
c2.
54±
1.05
abc
4.60
±1.
8814
050
12a
12a
4.4–
9.3
Bab
29.2
4±
0.16
B28
.19
±17
.31
bc36
.24
+24
.10
bc31
.06
±5.
46c
61.2
0±
42.1
3c
43.
54±
21.1
5ab
c17
7.63
±4.
6920
0075
020
0075
017
5–
520
Cdb
1.98
±0.
61b
2.04
±1.
03bc
2.70
±1.
16c
2.56
±0.
45c
4.44
±2.
28c
3.05
±1.
13ab
c6.
65±
0.42
221.
422
1.4
0.37
–0.
78Pb
a4.
61±
1.33
b4.
05±
2.08
bc5.
03±
2.05
bc4.
55±
0.73
c7.
94±
4.17
c7.
04±
3.48
abc
13.6
7±
0.52
800b
7060
070
22–
44
Hg
ND
ND
ND
ND
ND
ND
ND
246.
650
b6.
6b0.
05–
0.26
Cub
9.33
±4.
84b
12.3
4±
6.41
bc13
.36
±7.
49bc
13.4
4±
3.09
c24
.72
±11
.98
c18
.85
±7.
23ab
c34
.87
±3.
82–
–91
6313
–24
Crb
7.16
±1.
89b
7.75
±3.
38bc
9.38
±3.
52bc
8.83
±2.
12c
14.0
0±
6.64
c11
.04
±3.
98ab
c21
.14
±1.
7510
00–
8764
12–
83
Ni
b7.
73±
2.04
b7.
05±
3.33
bc8.
98±
3.57
bc8.
85±
1.66
c13
.57
±6.
45c
10.6
1±
3.96
abc
22.5
8±
1.32
––
8945
12–
34
Vb
11.4
2±
3.28
b11
.59
±6.
01bc
14.1
1±
5.86
bc13
.72
±2.
59c
21.6
2±
11.2
3c
17.2
7±
6.89
abc
33.7
8±
2.40
––
130
130
18.0
0–
115
Znb
0.93
±6.
78B
24.9
3±
10.3
2bc
30.1
8±
2.40
bc32
.00
±9.
16c
49.5
1±
18.3
0c
36.8
8±
11.7
2A
bc69
.30
±4.
81–
–25
041
045
–10
0
Char
acte
rist
ics
and
prop
ertie
sof
soil
Clay
part
icle
(%)
b5.
12±
1.98
b5.
13±
6.18
b5.
69±
4.87
bc3.
55±
0.55
c14
.80
±12
.78
c7.
40±
6.49
abc
38.7
7±
4.61
––
––
–
pHa
4.70
±0.
40a
4.61
±0.
38a
4.95
±0.
60a
4.74
±0.
28a
4.45
±0.
28a
4.70
±0.
27a
4.69
±0.
40–
––
––
Soil
orga
nic
mat
ter
(%)
a0.
434
±0.
18ab
c0.
28±
0.47
ad0.
51±
0.69
abc
0.20
±0.
12d
1.16
±1.
09d
0.62
±0.
63ab
cd3.
33±
0.60
––
––
–
CEC
(Cm
ol(+
)kg
−1 )
a7.
75±
1.78
ab11
.08
±7.
94ab
9.28
±5.
53ab
8.00
±1.
47ab
17.8
3±
12.2
8ab
10.9
7±
4.70
ab35
.48
±8.
96–
––
––
Sugg
este
dby
Cana
dian
Envi
ronm
enta
lQua
lity
Gui
delin
es(C
CME)
asin
orga
nic
As.
Sugg
este
dby
Cana
dian
Envi
ronm
enta
lQua
lity
Gui
delin
es(C
CME)
asin
orga
nic
Hg.
ND
:Non
ede
tect
ed.
M.G. Velásquez Ramírez, et al. Catena 189 (2020) 104454
4
variability in soil characteristics and vegetation cover future studiesmight focus on more sites with more homogenous soil conditions.
In impacted areas, concentrations of the different detectable heavymetals were strongly correlated (Table 4). We applied PCA to de-terminate the relation between heavy metals and soil characteristic likepH, Cation Exchange Capacity (CEC), Clay content and soil organicmatter (OSM), which are suggested as main factors to determinateheavy metal content in soil (Alloway, 1990; Kabata and Pendias, 2011;Salomons, 1995). The PCA diagram (Fig. 2) and the loadings of thedifferent variables on the first two PCA axes that explain 87.30% of thecumulative variance show that concentrations of all heavy metals arestrongly correlated with CEC and SOM but not pH which was in-dependent of all other variables.
According to the PCA (Fig. 2) CEC, clay particle and organic matter(%) were the soil characteristic most closely related to heavy metalcontent. Pairwise correlations showed that in impacted soil samplesthese variables showed low to moderate correlation coefficients withheavy metal concentrations. On the other hand, the multiple correlationof these features with each concentration of heavy metal showed that at99% of the variability of metal concentration was explained by thesefeatures (Table 4).
According to the correspondence analysis CA (Fig. 3) there was anarrow group of all metals in impacted areas and characteristics andproperties of soil evaluated, except pH. The narrow grouping might becaused because of the soil alluvial origin. It would be the result of mixingand accumulation of different sediments, soils and coarse particles,causing the metals tend to accumulate and present a similar distribution.
Table 4Correlations between difference heavy metal concentration in soil samples from gold mine spoils R1-4 and T1-2 (n = 90).
Parameter As Ba Pb V Cu Cr Ni Zn CEC (Cmol (+)kg−1)
Clay particle (%) OSM (%) CEC + Clay particle + OSM
As +1.00 a 0.40b 0.34b 0.16b 0.99c
Ba +0.83a +1.00a 0.54b 0.50b 0.43b 0.99c
Pb +0.71a +0.84a +1.00a 0.57b 0.42b 0.37b 0.89c
V +0.84a +0.94a +0.85a +1.00a 0.57b 0.56b 0.46b 0.99c
Cu +0.84a +0.89a +0.81a +0.93a +1.00a 0.59b 0.43b 0.39b 0.99c
aPearson correlations between difference heavy metal concentration in soil, significance correlation at p < 0.001.b Spearman Coefficient between soil properties and heavy metal concentration.c Dependence Coefficient between soil properties and heavy metal concentration.
Fig. 2. PCA loading plot showing the relations between heavy metals con-centrations and other soil characteristics. The first two axes explain 87% of thevariance in data.
Ba Zn Cu V Cr
Ni
As
Pb
010
2030
4050
Hei
ght
Fig. 3. Cluster diagram of heavy metals based on site characteristics.
M.G. Velásquez Ramírez, et al. Catena 189 (2020) 104454
5
Fig. 4. Interpolation mapping of heavy metals.
M.G. Velásquez Ramírez, et al. Catena 189 (2020) 104454
6
3.1. Geostatistics and mapping
We constructed semi variograms for all heavy metals (Fig. 4). Thenugget value below 0.05 for all heavy metals suggests some degree ofspatial auto-correlation (Burgess and Webster, 1980). Points weregrouped between 50 and 69 intervals (bins). Gaussian models werefitted to all variograms for interpolation and mapping purposes.
The behavior of metals in soil is influenced by clay, base saturation,Fe and Mn and pH. Heavy metals are present in the soil either as ex-changeable cations with high mobility, associated with iron and man-ganese hydroxide with medium mobility, bound to organic substanceswith medium mobility, or bound to the inside of mineral particles withlow mobility (Salomons, 1995). In addition, heavy metal cations aremost mobile under acid conditions (Alloway, 1990), which explainswhy we found higher heavy metal content under acid pH.
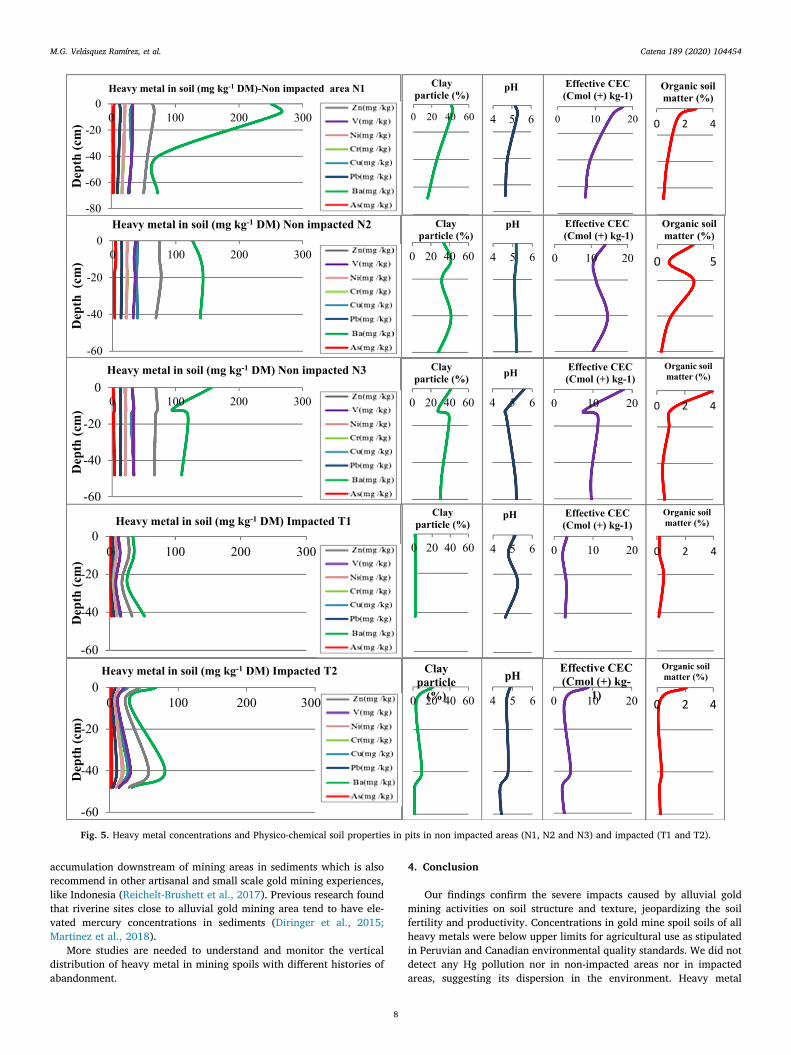
3.2. Vertical distribution of heavy metals
Variation in soil characteristics and heavy metal concentrationsacross a vertical gradient in 5 soil pits (2 in impacted and 3 non-im-pacted areas) are presented in Table 5.
According to Velasquez (2017), alluvial gold mining managementremodels the soil profile putting coarse soils (sandy, loamy sand andsandy clay loam soils) and rock fragments from deeper soil layers to thesurface. After abandonment of mining operations, impacted areas areinfluenced by natural regeneration of vegetation which increases the
organic soil matter in the surface. T1 soil profile is characterized withhigher rock fragments with sand soil texture, while T2 soil profile ischaracterized by sand to sandy clay loam soil texture without rocks(Table 5). In contrast natural soils profile (N1-3) are characterized bysilty clay to loam texture class, higher organic soil matter content fromthe surface to the bottom, and without any rock fragments.
In non-impacted areas (N1-3), higher heavy metal concentrationwere found in the top layer where also the other soil parametersreached their highest values. At deeper layers, both heavy metal con-centrations and soil OSM, ECEC and clay content evaluated tended todecrease. Also, in impacted soils (T1-2) the distribution of heavy metalsacross soil layers showed the same patterns but with remarkable lowercontent of heavy metals and soil OSM, ECEC and clay content (Fig. 5).
Samples from T1 (Impacted area 6–7 years ago) contained only1.4% of clay particles in all soil layers, while T2 (Impacted area7–8 years ago) contained 21.44% in the top layer with decreasing va-lues in deeper layers. The clay particle content was positively associatedwith organic soil matter in all layers (Fig. 5 and Table 5). The low clayand organic matter content in impacted areas is likely to result in in-creased leaching of heavy metals to deeper soil layers and downstreamsediments, but further research is needed to confirm or refute this hy-pothesis.
Particularly the fact that mercury was not detected in the soil pro-files of impacted areas suggests its mobility to other parts of the en-vironment where it might cause toxic effects. Further studies areneeded to evaluate the magnitude of potential heavy metal
Table 5Heavy metals, chemical and properties in soil pits in impacted and non impacted areas.
Horizon Depth (cm) Heavy metal in soil (mg kg−1DM) Soil characteristic
As Ba Pb Hg Cu Cr Ni V Zn Texture pH Organic soilmatter (%)
M.G. Velásquez Ramírez, et al. Catena 189 (2020) 104454
7
accumulation downstream of mining areas in sediments which is alsorecommend in other artisanal and small scale gold mining experiences,like Indonesia (Reichelt-Brushett et al., 2017). Previous research foundthat riverine sites close to alluvial gold mining area tend to have ele-vated mercury concentrations in sediments (Diringer et al., 2015;Martinez et al., 2018).
More studies are needed to understand and monitor the verticaldistribution of heavy metal in mining spoils with different histories ofabandonment.
4. Conclusion
Our findings confirm the severe impacts caused by alluvial goldmining activities on soil structure and texture, jeopardizing the soilfertility and productivity. Concentrations in gold mine spoil soils of allheavy metals were below upper limits for agricultural use as stipulatedin Peruvian and Canadian environmental quality standards. We did notdetect any Hg pollution nor in non-impacted areas nor in impactedareas, suggesting its dispersion in the environment. Heavy metal
-80
-60
-40
-20
00 100 200 300
Dep
th (c
m)
Heavy metal in soil (mg kg-1 DM)-Non impacted area N1
-60
-40
-20
00 100 200 300
Dep
th (
cm)
Heavy metal in soil (mg kg-1 DM) Non impacted N2
-60
-40
-20
00 100 200 300
Dep
th (c
m)
Heavy metal in soil (mg kg-1 DM) Non impacted N3
-60
-40
-20
00 100 200 300
Dep
th (c
m)
Heavy metal in soil (mg kg-1 DM) Impacted T1
-60
-40
-20
00 100 200 300
Dep
th (c
m)
Heavy metal in soil (mg kg-1 DM) Impacted T2
0 20 40 60
Clay particle (%)
4 5 6
pH
0 2 4
Organic soil matter (%)
4 5 6
pH
0 10 20
Effective CEC(Cmol (+) kg-1)
4 5 6
pH
0 2 4
Organic soil matter (%)
0 20 40 60
Clay particle (%)
0 5
Organic soil matter (%)
0 20 40 60
Clay particle (%)
0 10 20
Effective CEC (Cmol (+) kg-1)
0 20 40 60
Clay particle (%)
0 10 20
Effective CEC (Cmol (+) kg-1)
0 2 4
Organic soil matter (%)
0 10 20
Effective CEC(Cmol (+) kg-1)
4 5 6
pH
0 20 40 60
Clay particle
(%) 4 5 6
pH
0 10 20
Effective CEC (Cmol (+) kg-
1)0 2 4
Organic soil matter (%)
Fig. 5. Heavy metal concentrations and Physico-chemical soil properties in pits in non impacted areas (N1, N2 and N3) and impacted (T1 and T2).
M.G. Velásquez Ramírez, et al. Catena 189 (2020) 104454
8
concentrations were higher in non-impacted high forest soils than inmining spoils, but concentrations tended to increase with time ofabandonment of mining operations, according to the changes in soilscharacteristics. Our findings suggest that heavy metal concentrations inmining spoils should not be considered to constrain forest restorationactivities or the development of similar land uses as in comparable non-impacted high forest soils. We hope that our research results will serveas a basis to support further integrate ecological restoration and thedevelopment of polices to promote the recovery of gold mine spoils inthe Amazon.
Funding
This research was supported by the NGO Solidaridad Network SouthAmerica through its “Responsible Gold in Madre de Dios” project,Franco Arista, the project leader, and his collaborators William Moreno,Jhonatan Jaramillo and Diana Wu.
Acknowledgements
The Department of Soil Science, Faculty of Agronomy, UniversidadNacional Agraria La Molina is greatly appreciated for its analytical fa-cilities. This research it’s dedicated to Fortuna Community in Peru, whomight use this research as a tool to manage their land restoration.
Declaration of Competing Interest
The authors declare that they have no known competing financialinterests or personal relationships that could have appeared to influ-ence the work reported in this paper.
References
Alloway, J., 1990. Heavy Metal in Soil. Wiley, New York.Alvarez, J., Solano, V., Brack, A., Ipenza, C., 2011. Minería Aurífera en Madre de Dios y
Contaminación con Mercurio. MINAM, Peru.Asner, G.P., Llactayo, W., Tupayachi, R., Luna, E.R., 2013. Elevated rates of gold mining
in the Amazon revealed through high-resolution monitoring. Proc. Natl. Acad. Sci.110, 18454–18459. https://doi.org/10.1073/pnas.1318271110.
Canadian Council of Ministers of the Environment No. 1299; ISBN 1-896997-34-1, 2007.Canadian soil quality guidelines for the protection of environmental and humanhealth: Summary tables.
Burgess, T., Webster, R., 1980. Optimal interpolation and isarithmic mapping of soilproperties. I. The semi-variogram and punctual kriging. J. Soil Sci. 31, 315–331.https://doi.org/10.1111/ejss.12749. In press.
de Innovación, Centro, Amazónica, Científica, 2018. Tres décadas dendeforestación porminería aurífera en la amazonía suboriental peruana. Serie de resumenes de in-vestigación.
Diringer, S.E., Feingold, B.J., Ortiz, E.J., Gallis, J.A., Araújo-Flores, J.M., Berky, A., Pan,W.K.Y., Hsu-Kim, H., 2015. River transport of mercury from artisanal and small-scalegold mining and risks for dietary mercury exposure in Madre de Dios. Peru. Environ.Sci. Process. Impacts 17, 478–487. https://doi.org/10.1039/C4EM00567H.
Facchinelli, A., Sacchi, E., Mallen, L., 2001. Multivariate statistical and GIS-based ap-proach to identify heavy metal sources in soils. Environ. Pollut. 114, 313–324.https://doi.org/10.1016/S0269-7491(00)00243-8.
Fernandez, L., Ashe, K., Araujo, J., Field, C., 2013. Mercury in Madre de Dios: Mercury
Concentrations in Fish and Humans in Puerto Maldonado. Research Brief Series No.1. Standford.
Gomez, C., 2013. Evaluación de escenarios alternativos en sistemas sociales ecológicosafectados por la minería aluvial en Madre. de Dios. UNALM.
Hernandez, O., n.d. Temas de análisis multivariado, La univers. ed. Costa Rica.Holdridge, L.R., 1967. Life zone ecology.Tropical Science Center. San Jose. Costa Rica.Kabata, A., Pendias, H., 2011. Trace Elements in Soils and Plants, London 4 t. ed. London.Martinez, G., McCord, S., Driscoll, C., Todorova, S., Wu, S., Araújo, J., Vega, C.,
Fernandez, L., 2018. Mercury Contamination in Riverine Sediments and FishAssociated with Artisanal and Small-Scale Gold Mining in Madre de Dios, Peru. Int. J.Environ. Res. Public Health 15, 1584. https://doi.org/10.3390/ijerph15081584.
Ministerio de Minas y Energía, 2018. Anuario Minero 2017 Anual. Colombia.del Ambiente, Ministerio, 2018. Aprueban Criterio para la Gestión de. Sitios
Contaminados.Ministerio del Ambiente, 2017. Estándares de Calidad Ambiental para Suelos D.S 011-
2017-MINAM.Ministerio del Ambiente, 2016. Convenio de Minamata sobre Mercurio: ratificación
peruan. Lima Peru.Ministerio del Ambiente, 2014. Guía para el muestreo de suelos. R.M. 085-2014.Montero, J., Larraz, B., 2008. Introducción a la Geoestadística, Netbiblo. ed. España.Moreno-Brush, M., Rydberg, J., Gamboa, N., Storch, I., Biester, H., 2016. Is mercury from
small-scale gold mining prevalent in the southeastern Peruvian Amazon? Environ.Pollut. 218, 150–159. https://doi.org/10.1016/j.envpol.2016.08.038.
Nanos, N., Pardo, F., Nager, J.A., Pardos, J.A., Gil, L., 2005. Using multivariate factorialkriging for multiscale ordination: a case study. Can. J. For. Res. 35, 2860–2874.https://doi.org/10.1139/x05-211.
Nriagu, J., Pacyna, J., 1988. Quantitative assessment of world-wide contamination of air,water and soils by trace metals. Nature 333, 134–139.
R Development Core Team, 2017. A language and environment for statistical computeing.R Foundation for Statistical Computing. Viena. Austria.
Red Latinoamericana de Sitios Contaminados, 2016. Concepto de sitios contaminados[WWW Document]. URL http://relasc.org/relasc2/index.php/faq-espanol/95-1-caracteristicas-generales/141-11-que-es-un-sitio-contaminado.
Palacios, O., Molina, O., Galloso, A., Reyna, C., 1996. Geología de los cuadrángulos dePuerto Luz, Colorado, Laberinto, Puerto Maldonado, Quincemial, Masuco, Atillero yTambopata. INGEMMET, Peru In press.
Reichelt-Brushett, A.J., Stone, J., Howe, P., Thomas, B., Clark, M., Male, Y., Nanlohy, A.,Butcher, P., 2017. Geochemistry and mercury contamination in receiving environ-ments of artisanal mining wastes and identified concerns for food safety. Environ.Res. 152, 407–418. https://doi.org/10.1016/j.envres.2016.07.007.
Salinas, M., 2007. Impactos económicos y ambientales de la pequeña minería artesanal enel departamento. de Madre de. Dios. UNALM.
Salomons, W., 1995. Environmental impact of metals derived from mining activities:Processes, predictions, prevention. J. Geochemical Explor. 52, 5–23. https://doi.org/10.1016/0375-6742(94)00039-E.
Servicios Generales y Medio Ambiente, 2006. Estudio de Impacto Ambiental yProspección Sísmica 2D, Lotes 111 y 113.
Thornthwaite, C.., Biel, E.R., Church, P.E., Jacobs, W.C., Landsberg, H., Leighly, J.B.,Hafstad, K., 1949. Report of the Committee on Climatology, 1947–1948.Transactions, American Geophysical Union, USA.
United States Environmental Protection Agency, 1997. EPA-452/R-97-003 Mercury StudyReport to Congress Volume VII: Characterization of Human Health and Wildlife Risksfrom Mercury Exposure in the United States.
United States Geological Survey, 2018. Mineral Commodity. Summaries. United States.Velasquez, M., 2017. Metales en suelos explotados por la pequeña minería aurífera aluvial
en Madre de Dios. Perú, UNALM.Webb, J., Mainville, N., Mergler, D., Lucotte, M., Betancourt, O., Davidson, R., Cueva, E.,
Quizhpe, E., 2004. Mercury in Fish-eating Communities of the Andean Amazon. NapoRiver Valley, Ecuador. Ecohealth 1, SU59-SU71. https://doi.org/10.1007/s10393-004-0063-0.
World Gold Council, 2017. Gold Market Primer Mine production Abril [WWWDocument]. URL www.gold.org.
M.G. Velásquez Ramírez, et al. Catena 189 (2020) 104454