+ All Categories
Home > Documents > heidelberg 2011/2012 C ontents...Heidelberg shareholders. The German financial publication manager...

heidelberg 2011/2012 C ontents...Heidelberg shareholders. The German financial publication manager...

Date post: 27-Feb-2021
Category:
Upload: others
View: 1 times
Download: 0 times
Share this document with a friend
52
Q2 INTERIM FINANCIAL REPORT 2011 / 2012 Q 2 //Education & Consulting //Sys- temservice // Saphira // Prinect //Print Media Academy // Systemservice // Saphira // Prinect //Print Media Academy // Education & Consulting //Re- marketed Equipment // System- service // Saphira //Prinect // Print Media Academy // Educa- tion & Consulting //Performance Services // Systemservice // Saphira //Prinect //Print Media Academy //Technical Services
Transcript

Q 2 I n t e r I m F I n a n c I a l r e p o r t 2011 / 2012

Q 2// education & consulting // Sys-temservice // Saphira // prinect // print media academy //

Systemservice // Saphira // prinect // print media academy // education & consulting // re-marketed equipment // System-service // Saphira // prinect // print media academy // educa-tion & consulting // performance Services // Systemservice // Saphira // prinect // print media academy // technical Services

Diana X // Financial Services // Suprasetter // Speedmaster Xl 145 and Xl 162 // anicolor //

Suprasetter // Speedmaster Sm 52 // anicolor // Speedmaster Sm 74 // Speedmaster Xl 75 // Speedmaster Sm 102 // Stahl-folder tH / KH // Speedmaster cD 102 // Speedmaster cX 102 // Stitchmaster // Speedmaster Xl 105 // Speedmaster Xl 145 and Xl 162 // eurobind // Vari-matrix // Dymatrix // easygluer //

Heidelberger Druckmaschinen aG

Kurfuersten-anlage 52 – 60

69115 Heidelberg

Germany

www.heidelberg.com

At a Glance

DaXHeidelberg mDaX

performance of the heidelberg share

compared with the DaX / mDaX (Index: april 1, 2011 = 0 percent)

0

– 10

– 30

– 40

– 50

– 60

– 70

– 20

10

april 2011 may 2011 June 2011 July 2011 august 2011 September 2011

%

1

key performance data

Figures in € millions

Q 1 to Q 2 prior year

Q 1 to Q 2  2011 / 2012

Q 2 prior year

Q 2  2011 / 2012

Incoming orders 1,436 1,333 1) 650 668

Net sales 1,196 1,180 2) 633 636

EBITDA 3) 8 26 19 28

Result of operating activities 4) – 41 – 21 – 6 5

–  in percent of sales – 3.4 % – 1.8 % – 0.9 % 0.8 %

Net loss – 88 – 66 – 36 – 20

–  in percent of sales – 7.4 % – 5.6 % – 5.7 % – 3.1 %

Cash flow  – 61 – 13 – 27 9

–  in percent of sales – 5.1 % – 1.1 % – 4.3 % 1.4 %

Free cash flow  69 – 19 7 – 12

Research and development costs 60 69 30 32

Investments 30 34 15 17

Undiluted earnings per share in € 5) – 1.11 – 0.28 – 0.44 – 0.08

1) Including negative exchange rate effects totaling € – 34 million (adjusted for exchange rate effects: € 1,367 million)2) Including negative exchange rate effects totaling € – 29 million (adjusted for exchange rate effects: € 1,209 million)3) result of operating activities excluding special items and before depreciation and amortization4) excluding special items5) Determined based on the weighted number of outstanding shares

2

Publishing Information

copyright © 2011

Heidelberger Druckmaschinen

Aktiengesellschaft

Kurfuersten-Anlage 52 – 60

69115 Heidelberg

Germany

www.heidelberg.com

[email protected]

This report was published on November 8, 2011.

Photo credits: 

Second Quarter in Review – Archive Heidelberger Druckmaschinen AG

Produced on Heidelberg machines using Heidelberg technology.

All rights and technical changes reserved. 

Printed in Germany.

heidelberg 2011 / 2012

Contents

The Share InTerIm ConSolIdaTed managemenT reporT

3 overall p ICTure

4 underly Ing CondIT IonS

6 BuSIneSS developmenT

8 reSulTS of operaT IonS, neT aSSeTS,

and f InanCIal poSIT Ion

11 d Iv IS IonS

13 regIonS

15 employeeS

15 r ISk and opporTunITy reporT

16 fuTure proSpeCTS

18 SupplemenTary reporT

19 The SeCond QuarTer In rev Iew

22 overvIew CharTS, graphS,

and IlluSTraT IonS

24 InTerIm ConSolIdaTed

InCome STaTemenT

apr Il 1 , 2011 To SepTemBer 30, 2011

25 InTerIm ConSolIdaTed STaTemenT

of ComprehenSIve InCome

apr Il 1 , 2011 To SepTemBer 30, 2011

26 InTerIm ConSolIdaTed

InCome STaTemenT

july 1, 2011 To SepTemBer 30, 2011

27 InTerIm ConSolIdaTed STaTemenT

of ComprehenSIve InCome

july 1, 2011 To SepTemBer 30, 2011

28 InTerIm ConSolIdaTed

STaTemenT of f InanCIal poSIT Ion

30 STaTemenT of ChangeS In

ConSolIdaTed eQuITy

32 InTerIm ConSolIdaTed

STaTemenT of CaSh flowS

33 noTeS

45 reSponSIB Il ITy STaTemenT

46 exeCuTIve BodIeS of The Company

InTerIm ConSolIdaTed f InanCIal STaTemenTS

2 The Share

Stand 10.11.2011 | Q2 e 2011 / 2012 | lagebericht

The Share

Whereas Germany’s two most important share indices – the DAX and the MDAX –

posted slight price increases, respectively, of approximately 5 percent and 6 percent

during the first quarterly reporting period in 2011, a strong bearish tendency set

in at the onset of the second reporting quarter. The debt crises in Europe and the

US and the related uncertainty of investors led to considerable turbulence on the

stock markets during the second reporting quarter, with the DAX declining by

25 percent and the MDAX by approximately 24 percent. The DAX suffered its big-

gest losses in nine years during the period July to September 2011, closing at 5,502

points on September 30, 2011. This downswing in the markets had an impact on

the Heidelberg share, which again suffered a price adjustment of approximately

37 percent. The Heidelberg share closed at € 1.57 on September 30, 2011 and thereby

recovered from the share’s previous all-time low of € 1.23 that had been posted at

the beginning of September.

Heidelberg held numerous discussions with institutional and private inves-

tors as well as with financial analysts at international road shows and conferences

in order to present the Company and its equity story to existing and potential

Heidelberg shareholders. The German financial publication manager magazin hon-

ored Heidelberg’s 2010 / 2011 annual report for the high quality of its financial

reporting. The annual report won third place honors in the MDAX segment in this

year’s overall competition for “Best Annual Report”.

The Annual General Meeting of Heidelberger Druckmaschinen Aktiengesell-

schaft was held during the second reporting quarter, on July 28, 2011. Approxi-

mately 2,000 shareholders attended this year’s presentation in the Rosengarten

Congress Center in Mannheim, representing some 48 percent of Heidelberg’s

share capital. The Annual General Meeting approved all the items on the agenda

by a large majority.

key performance data of the heidelberg share

figures in €

Q 2prior year

Q 22011 / 12

undiluted earnings per share 1) – 0.44 – 0.08

Cash flow per share 1) – 0.33 0.04

weighted number of shares in thousands 81,056 233,693

Share price – high 5.01 2.85

Share price – low 3.41 1.23

Share price – beginning of the quarter 2) 4.52 2.80

Share price – end of the quarter 2) 3.51 1.57

market capital ­ization at the end of the quarter in € millions 819 368

1) determined based on the weighted number of outstanding shares

2) xetra closing price; source for prices: Bloomberg

3

Stand 10.11.2011 | Q2 e 2011 / 2012 | lagebericht

Management Report 3

Interim Consolidated management report

overall picture

Compared with the first quarter, the distortions in the capital markets and the

overall economic slowdown have considerably worsened uncertainties regarding

further economic developments. Incoming orders totaled € 668 million – adjusted

for exchange rate effects: € 677 million – during the second quarter, thereby match-

ing the figure for the first quarter and slightly exceeding the € 650 million posted

during the same quarter the previous year. Net sales amounted to € 636 million dur-

ing the second quarter – the same level as in the previous year. Sales for the first

half-year amounted to € 1,180 million – slightly higher than the pre vious year’s fig-

ure adjusted for exchange rate effects. Heidelberg benefited during the second

quarter not only from the profit contributions resulting from the higher volume,

but also from the favorable product mix as well as the attained boosts in efficiency

resulting from the reorganization. The result of operating activities excluding spe-

cial items was thereby higher, totaling a positive figure of approximately € 5 mil-

lion. The Heidelberg Equipment Division developed favorably during the second

quarter thanks to expanding sales and the cost reductions achieved under the reor-

ganization. Although the less cyclically dependent Heidelberg Services Division con-

tinued to operate on a solid basis, the high pre vious year’s figures could not be

reached. The special items during the first half of the year of € 3 million result largely

from personnel-related expenses. The financial result totaled € – 42 million – up

over the previous year by € 45 million due to the decreased financing expenses under

the successful refinancing operations during the first half of the year. The loss for

the quarter improved during the second quarter from € – 36 million during the same

quarter the previous year to € – 20 million. During the first half of the year, the

loss improved from € – 88 million to € – 66 million. Free cash flow during the second

quarter amounted to approximately € – 12 million. Despite the loss for the first

half of the year of € – 66 million, thanks to consistent asset management, free cash

flow totaled € – 19 million during the first six months of the year. Heidelberg suc-

cessfully undertook comprehensive refinancing during the first quarter with its

successful issue of the high yield bond on April 7, 2011, as well as the simultaneous

approval of the new credit facility. The success of our financial measures is reflected

in the equity ratio and net financial debt. At the end of the reporting quarter, the

equity ratio totaled approximately 30 percent and net financial debt amounted to

€ 279 million.

4 Management Report

Stand 10.11.2011 | Q2 e 2011 / 2012 | lagebericht

underlying Conditions

Growth of the global economy slowed during the first half of 2011. Whereas the

global gross domestic product grew by 3.9 percent in 2010, growth of only 3.1 per-

cent was posted during the first half of 2011. The distortions in the capital markets

and the weaker overall economic vigor once again caused uncertainty concerning

economic developments to increase further compared to the first quarter. The out-

look for the world economy during the second half of the year has worsened, with

growth of only approximately 2.7 percent expected for 2011 as a whole. Because the

above-mentioned sources of uncertainty will continue in the near future, a mod-

est pace of growth can be expected in the industrialized countries. The newly indus-

trializing countries – most importantly, China – have managed to distance them-

selves from the weak growth of the industrialized countries thanks to stronger

growth in their domestic markets. These countries are expected to continue grow-

ing at high, single-digit percentage rates.

This development is reflected in the exchange rates as well. The uncertainties

in the financial markets are triggering a high degree of volatility in the US dollar /

euro exchange rate, whereas the Chinese renmimbi continues to strengthen relative

to the US dollar. The Japanese yen overcame its weakness on the heels of the natu-

ral catastrophes and strengthened vis-à-vis the euro to a greater extent than at any

time since 2001. These exchange rate structures served to improve the competitive-

ness of European suppliers.

Due to the uncertain situation in the US, growth of only 1.6 percent is expected

in 2011. Private consumer spending is showing little vigor as a result of the efforts

to consolidate government budgets as well as a high level of unemployment.

Following a gratifying first quarter, economic growth also continued to weaken

in the euro zone. Forecasts for annual economic growth have decreased to 1.7 per-

cent. The fear that the public debt crisis may lead to a banking crisis is resulting

in the paralysis of economic activity. The directly concerned countries – Greece,

Spain, and Portugal – are not the only ones to already be subject to stagnant or

even weakening economic performance. germany is also unable to avoid this trend.

Although growth during the first half of 2011 was a robust 3.5 percent, the fall in

incoming orders makes the dependence on exports clear, and weakening indicators

change in gdp worldwide

figures in percent

– 2– 3 – 1 0 1 2 3 4

2010

2008

2009

2011 *2.7

3.9

1.6

– 2.1

4

* projected Source: global Insight (wmm); calendar year

eur / usd exchange rate

uSd

1.0

1.25

1.5

09 / 0

3

09 / 0

4

09 / 0

5

09 / 0

6

09 / 0

8

09 / 1

0

09 / 0

9

09 / 0

7

09/ 1

1

1.75

5

Source: Bloomberg

eur / jpy exchange rate

jpy

100

125

150

09 / 0

3

09 / 0

4

09 / 0

5

09 / 0

6

09 / 0

8

09 / 1

0

09 / 0

9

09 / 0

7

09/ 1

1

175

6

Stand 10.11.2011 | Q2 e 2011 / 2012 | lagebericht

Management Report 5

of market sentiment in our industry are resulting in expectations of a slowing of

the growth of investments. Economic growth of 2.8 percent is still expected in

2011 based solely on the order backlog cushion and the solid first half of the year.

asia excluding Japan succeeded in shielding itself from the weak growth of

the industrialized countries. china was particularly successful in reducing its depen-

dency on exports. Domestic demand is becoming increasingly important due to

vigorous investment activity and stable private consumer spending. An approxi-

mately 9 percent rise in GDP is thus again expected in 2011. In japan, due to the

catastrophe in the spring, the economy will contract on an annual basis as well.

Growth in south america continues to be strong, with an increase of approxi-

mately 4 percent expected in Brazil for 2011.

According to the German Printing and Media Industries Federation (bvdm), the

business outlook of the print media industry picked up during the second quarter.

Nevertheless, as the IFO index shows, for example, the business outlook of print

shops is falling far behind the favorable outlook of the industry as a whole. For the

upcoming quarters, the bvdm expects business developments to at best stagnate

at the current level or even to decline slightly.

Growth in the newly industrializing countries is only partially compensating for

the restrained development of the print industry in the industrialized countries.

The export statistics for printing presses available from the Association of printing

and paper technology, which is part of the German Engineering Federation

(VDMA), views China, which accounts for a 17 percent share of exports, as the big-

gest recipient country. Brazil, Turkey, and India have also established themselves

as key markets. The overall development of sales of German printing press manu-

facturers was modestly favorable during the first half of the year, with growth of

2 percent posted over the previous year. Nevertheless, the 6 percent decline of

incoming orders from the previous year points to a weakening in the economy. This

trend intensified from June through August 2011, with incoming orders declining

by 10 percent.

6 Management Report

Stand 10.11.2011 | Q2 e 2011 / 2012 | lagebericht

Business development

As was indicated in an advance release to the press on October 25, 2011, incoming

orders during the second quarter amounted to € 668 million, or adjusted for

exchange rate effects, € 677 million – up by € 18 million over the previous year’s fig-

ure of € 650 million. Incoming orders thereby fell slightly behind our projections.

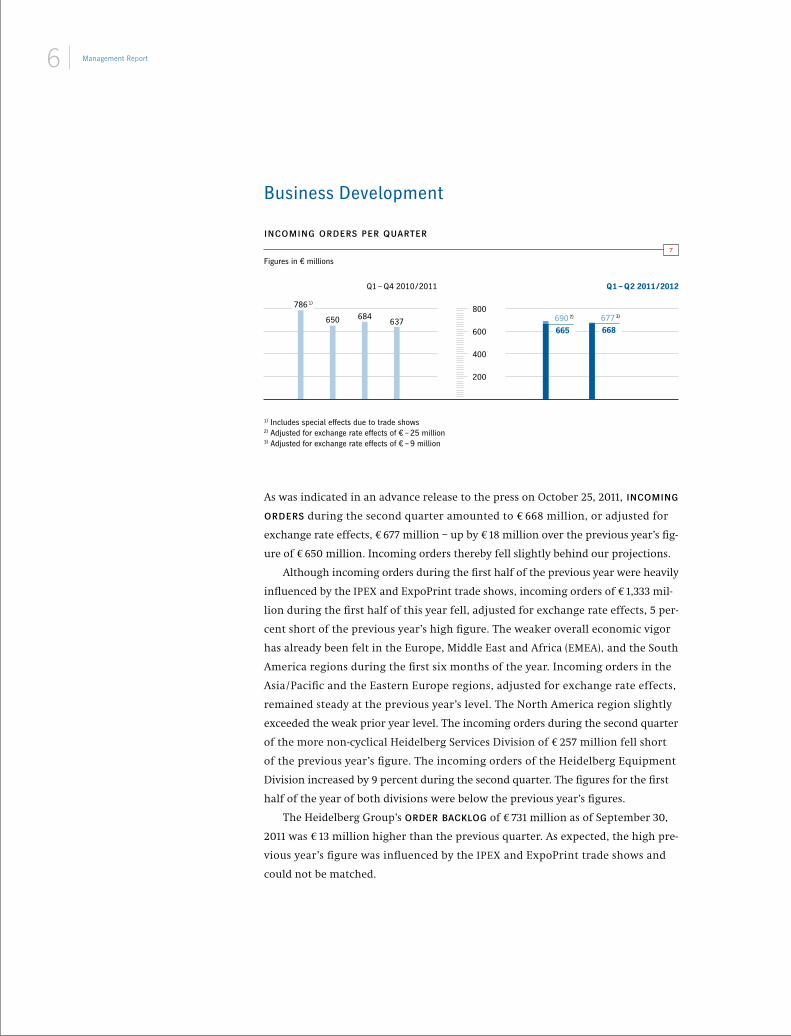
Although incoming orders during the first half of the previous year were heavily

influenced by the IPEX and ExpoPrint trade shows, incoming orders of € 1,333 mil-

lion during the first half of this year fell, adjusted for exchange rate effects, 5 per-

cent short of the previous year’s high figure. The weaker overall economic vigor

has already been felt in the Europe, Middle East and Africa (EMEA), and the South

America regions during the first six months of the year. Incoming orders in the

Asia / Pacific and the Eastern Europe regions, adjusted for exchange rate effects,

remained steady at the previous year’s level. The North America region slightly

exceeded the weak prior year level. The incoming orders during the second quarter

of the more non-cyclical Heidelberg Services Division of € 257 million fell short

of the previous year’s figure. The incoming orders of the Heidelberg Equipment

Division increased by 9 percent during the second quarter. The figures for the first

half of the year of both divisions were below the previous year’s figures.

The Heidelberg Group’s order backlog of € 731 million as of September 30,

2011 was € 13 million higher than the previous quarter. As expected, the high pre-

vious year’s figure was influenced by the IPEX and ExpoPrint trade shows and

could not be matched.

incoming orders per quarter

figures in € millions

650 684637

400

200

800

600

690 2)

Q 1 – Q 4 2010 / 2011 Q 1 – Q 2 2011 / 2012

7

1) Includes special effects due to trade shows 2) adjusted for exchange rate effects of € – 25 million3) adjusted for exchange rate effects of € – 9 million

665

677 3)

668

786 1)

Stand 10.11.2011 | Q2 e 2011 / 2012 | lagebericht

Management Report 7

sales of € 636 million during the second quarter were slightly higher than the pre-

vious year’s figure. Net sales for the first half of the current financial year amounted

to € 1,880 million, thereby matching the previous year’s level when adjusted for

exchange rate effects. While, adjusted for exchange rate effects, the North America,

South America, and Asia / Pacific regions generated considerable growth during

the first half of the year, sales declined from the previous year in the Europe, Middle

East and Africa, and the Eastern Europe regions. The share of international sales

remained unchanged at 85 percent for the first six months of the year compared

with the previous financial year-end. Heidelberg Equipment recorded a 4 percent

increase in sales to € 674 million for the first half-year compared with the previous

year's figure; adjusted for exchange rate effects, growth of 7 percent was posted.

In the Heidelberg Services Division, sales for the half-year decreased by 7 percent

from the previous year to € 498 million; adjusted for exchange rate effects, a 6 per-

cent decline was realized. This was attributable among others to declines in the sale

of remarketed equipment.

sales by division

figures in € millions

Q 1 to Q 2prior year

Q 1 to Q 22011 / 2012

Q 2prior year

Q 22011 / 2012

heidelberg equipment 649 674 352 374

heidelberg Services 538 498 277 257

heidelberg financial Services 9 8 4 5

Heidelberg Group 1,196 1,180 633 636

(adjusted for exchange rate effects 1,209 646)

9

order backlog per quarter

figures in € millions

781 770

634

400

200

800

600

Q 1 – Q 4 2010 / 2011 Q 1 – Q 2 2011 / 2012

8

810731718

8 Management Report

Stand 10.11.2011 | Q2 e 2011 / 2012 | lagebericht

results of operations, net assets, and financial position

ebitda excluding special items reached € 28 million during the second quarter of

the year, with the figure for the first half-year thereby increasing threefold from

the € 8 million posted during the first half of the previous year to € 26 million.

Heidelberg’s result of operating activities excluding special items benefited from

the profit contributions due to the higher volume and a favorable product mix.

Ongoing consistent cost management within the framework of the reorganization

also contributed to the improved result. Following a result of operating activ­

ities excluding special items of € – 25 million for the first quarter, our result was

in the black for the second quarter and amounted to approximately € 5 million.

The figure for the half-year period thereby totaled € – 21 million – in other words,

we succeeded in reducing by half the loss of € – 41 million that had been posted

in the corresponding same period the previous year. The special items totaling

€ 3 million resulted largely from personnel-related expenses. Income of € 22 million

had been posted in the previous year.

The financial result for the first half of the year of € – 42 million was consider-

ably improved, up by € 45 million over the figure for the same period the previous

year. This was attributable largely to the lower charges resulting from the successful

refinancing as well as low financing costs due to the successful asset management.

income before taxes improved from € – 50 million the previous year to

€ – 19 million for the reporting quarter. We realized a substantial boost in this fig-

ure from the € – 106 million generated the preceding year to € – 66 million. The

loss totaled € – 20 million for the second quarter and € – 66 million for the first half

of the year. Undiluted earnings per share amounted to € – 0.28 during the half-

year period, compared with € – 1.11 the previous year.

result of operating activities 1)

figures in € millions

Q 1 to Q 2 prior year

Q 1 to Q 22011 / 2012

Q 2prior year

Q 22011 / 2012

heidelberg equipment – 87 – 56 – 39 – 17

heidelberg Services 37 28 27 18

heidelberg financial Services 9 7 6 4

Heidelberg Group – 41 – 21 – 6 5

1) excluding special items

10

Stand 10.11.2011 | Q2 e 2011 / 2012 | lagebericht

Management Report 9

investments in tangible and intangible assets again totaled € 17 million in the sec-

ond quarter, thereby amounting to € 34 million for the first half of the year – some

14 percent higher than the previous year’s figure. Despite the increase over the pre-

vious year, this figure continues to be low.

The Heidelberg Group’s total assets of € 2,674 million were stable compared

with both the first quarter and the previous financial year-end. Total assets were

down by € 125 million from the corresponding previous year’s figure.

Among assets inventories rose slightly from € 748 million at the end of the pre-

vious financial year to € 860 million. They are at about the same level as the corre-

sponding previous year’s figure. The reduction in trade receivables had an oppo-

site effect.

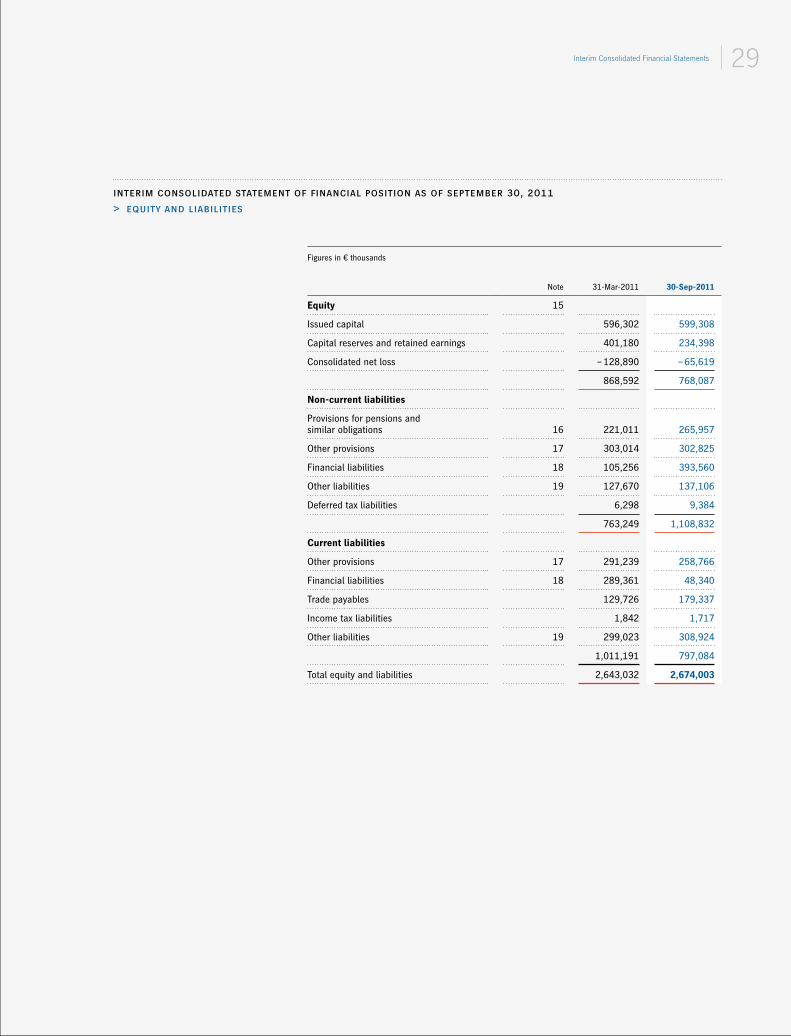
Among equity and liabilities, due among other things to the loss for the

half-year, equity fell to € 768 million as of September 30, 2011. Moreover, actuarial

losses resulting from the calculation of the pension plan assets caused a reduction

of the equity as well as higher pension provisions. The equity ratio remained stable

at approximately 30 percent during the reporting quarter. Financial liabil ities

held steady at the previous quarter’s level of € 442 million as of September 30, 2011.

The success of our financial measures is also reflected in our net financial debt,

which was at the comparatively low level of € 279 million as at the end of the report-

ing quarter, compared to € 695 million at the beginning of the pre vious financial

year. Detailed information concerning our refinancing can be found in the Annual

Report 2010 / 2011 beginning on page 66.

balance sheet structure

figures in € millions

31­mar­2011 in percent of total assets

30-Sep-2011 in percent of total assets

non­current assets 1,115 42.2 1,076 40.2

Current assets 1,527 57.8 1,596 59.7

assets held for sale 1 0.0 2 0.1

Total assets 2,643 100.0 2,674 100.0

equity 869 32.9 768 28.7

non­current liabilities 763 28.9 1,109 41.5

Current liabilities 1,011 38.3 797 29.8

Total equity and liabilities 2,643 100.0 2,674 100.0

11

10 Management Report

Stand 10.11.2011 | Q2 e 2011 / 2012 | lagebericht

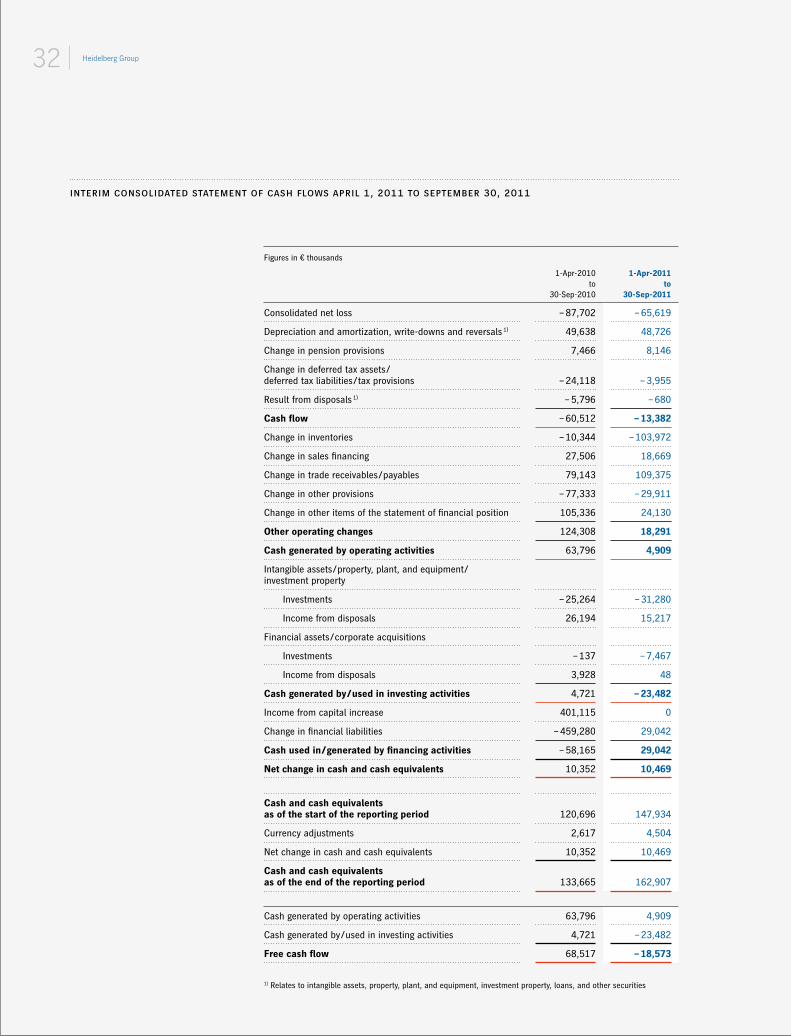
The considerably lower loss for the half-year compared with the previous year

resulted in a € 48 million increase in cash flow to € – 13 million during the first

half of the year.

In the area of other operating changes, cash was generated during the first

half of the year thanks in particular to the additionally optimized net working

capital. Additional factors making a significant contribution to this development

consolidated statement of cash flows

figures in € millions

Q 1 to Q 2 prior year

Q 1 to Q 22011 / 2012

Cash flow – 61 – 13

net working capital 103 20

receivables from customer financing 28 19

other – 6 – 22

Other operating changes 125 17

Cash used in investing activities 5 – 23

Free cash flow 69 – 19

13

development of the financial structure

figures in € millions

financing structure as of 31­mar­2010

financing structure as of 31­dec­2010

financing structure as of 30­sep­2011

~ 550syndicated credit line (from 2005)

~ 550bank guarantee

~ 290kfw loan (initial credit line: 300)

~ 125 other

~ 445syndicated credit line (from 2005)

~ 115 other

~ 445bank guarantee

– ~ 400

– ~ 110

~ 1,005

capital increase (= repayment)

reduction mainly based on voluntary repayment

~ 500new syndicated credit line

~ 100 other

~ 304(nominal) bond

– ~ 101 ~ 904

further reduction of financial requirements

refinancing 2011

~ 1,515

12

695 220 279net financial debt net financial debt

Stand 10.11.2011 | Q2 e 2011 / 2012 | lagebericht

Management Report 11

were the lower trade receivables and higher trade payables. The further reduction

in receivables from sales financing also had a favorable impact.

cash used in investing activities is attributable, among other factors, to

the plant expansion at Qingpu. The outflow of funds from investment activity

amounted to € – 23 million during the half-year period, whereas during the previ-

ous year cash of € 5 million had been generated due to fixed-asset disposals.

free cash flow was a negative, during the first half of the year, amounting

to € – 19 million. This resulted primarily from the loss for the half-year period as

well as the cash used in China due to the plant expansion.

divisions

The incoming orders of the heidelberg equipment Division continued to develop

favorably during the second quarter, growing by € 32 million over the previous

year to € 406 million. Incoming orders in the first half of the year of € 810 million

were 8 percent lower than in the previous year – adjusted for exchange rate effects,

5 percent lower. The especially high incoming orders the previous year were attrib-

utable to the special effects of the IPEX and ExpoPrint trade shows. Despite the

traditionally weaker vacation month of August, incoming orders held steady at the

same level as in the previous quarter.

This division’s net sales developed favorably compared with the previous year.

Whereas net sales increased by 6 percent during the second quarter over the pre-

vious year – adjusted for exchange rate effects, by 8 percent – growth for the first

half of the year over the same period the previous year to € 674 million represented

an increase of 4 percent – adjusted for exchange rate effects, growth of 7 percent.

This division accounted for a 57 percent share of Group sales during the first half

of the year. Particular success was achieved in expanding the sales of large format

sheetfed offset printing presses.

The boost in sales also had an impact on the result of this division’s operating

activities excluding special items. Heidelberg Equipment was successful in con-

siderably reducing its loss for the half-year period from the previous year, which

improved by € 31 million to € – 56 million. Contributing to this development, among

other factors, were the attained cost-reduction measures from the reorganization.

The special items included expenses of € 1 million. Investments by this division of

€ 28 million were maintained at the low previous year’s level.

heidelberg equipment: incoming orders per quarter

figures in € millions

1000 200 300 400 500

Q 3   402

Q 2   374

Q 1   501

Q 4   365

14

fy 2011 / 2012 fy 2010 / 2011

Q 1   404

Q 2   406

12 Management Report

Stand 10.11.2011 | Q2 e 2011 / 2012 | lagebericht

This division had a total of 10,308 employees as of September 30, 2011. The increase

over the previous quarter was attributable for one to the startup of the new train-

ing year. Furthermore, the development of the number of employees of Heidelberg

Equipment reflects the expansion of the production site in China. The number of

employees increased by a total of 54 over the beginning of the financial year.

Although the incoming orders of the heidelberg services Division decreased

during the second quarter by 6 percent to € 257 million compared with the previ-

ous year – adjusted for exchange rate effects, by 5 percent – they remained at the

same level as the previous quarter of the reporting year. The high figure for the

first half of the preceding year could not be matched, with incoming orders of € 515

million down by 7 percent – adjusted for exchange rate effects, by 5 percent.

The net sales of the division developed in line with incoming orders. During

the second quarter, they declined from the previous year by 7 percent to € 257 mil-

lion – adjusted for exchange rate effects, by 6 percent. Compared with the same

period the previous year, net sales fell during the first half of the year by 7 percent –

adjusted for exchange rate effects, by 6 percent – to € 498 million. This develop-

ment resulted primarily from a decline in sales in the remarketed equipment busi-

ness. This division’s sales accounted for a 42 percent share of overall consolidated

sales during the first half of the year.

Primarily due to the development of sales, the result of operating activities

excluding special items fell from € 37 million the previous year to € 28 million dur-

ing the half-year period. The Heidelberg Services Division posted special items of

€ 2 million. The investments of the Heidelberg Services Division totaled € 6 million

during the first half of the year.

This division had a total of 5,421 employees during the reporting quarter – down

by 101 from the beginning of the financial year.

Receivables from sales financing of the heidelberg financial services Division

of € 162 million as of September 30, 2011 continued to be very low and were down

from the figure posted at financial year-end of € 178 million – the result of custom-

ers largely financing their projects with outside financial pro viders. This division’s

result of operating activities excluding special items was again in the black during

the second quarter, generating a gratifying result for the first half of the year of

€ 7 million. The division had a total of 53 employees as of September 30, 2011.

heidelberg services: incoming orders per quarter

figures in € millions

1000 200 300

Q 3   278

Q 2   272

Q 1   280

Q 4   269

15

Q 2   257

fy 2011 / 2012 fy 2010 / 2011

Q 1   258

Stand 10.11.2011 | Q2 e 2011 / 2012 | lagebericht

Management Report 13

regions

The incoming orders of the europe, middle east and africa region totaled

€ 231 million during the second quarter, thereby holding steady at the previous

year’s level. The figure for the first half of the year of € 476 million was 13 percent

lower than during the same period the previous year. This was caused in particular

by the low volume of incoming orders in the UK, because the previous year had

included incoming orders generated at the IPEX trade show. In Germany, incoming

orders remained stable during the first half of the year compared with the same

period the previous year. Sales in this region generated during the second quarter

totaled € 220 million – 12 percent lower than during the same period the preced-

ing year. The figure for the first half of the year of € 438 million was also 7 percent

below the previous year’s figure.

The eastern europe region was successful in generating incoming orders

totaling € 76 million during the second quarter – up by 20 percent over the previous

year. The figure for the first half of the year of € 149 million was at the previous

year’s level. Incoming orders in Poland developed favorably during the second quar-

ter. During the second quarter, this region’s net sales fell by appro xi mately € 5 mil-

lion from the previous year to € 70 million. The net sales of € 130 million during the

first half of the year held steady at the previous year’s level.

During the second quarter, incoming orders adjusted for exchange rate effects

in the north america region grew by 13 percent over the previous year to € 86 mil-

lion. Incoming orders during the first half of the year increased by 9 percent adjusted

for exchange rate effects to € 162 million. Net sales were up by 22 percent over the

previous year – adjusted for exchange rate effects, by 29 percent – to € 82 million

during the second quarter. Growth was also posted during the half-year period to

figures in € millions

Q 1 to Q 2prior year

Q 1 to Q 22011 / 2012

emea 547 476

eastern europe 147 149

north america 161 162

South america 91 81

asia / pacific 490 465

1) Including negative exchange rate effects totaling € – 34 million

incoming orders by region

Shares in the heidelberg group in percent (in parentheses: previous year)

36 (38)

35 (34)

6 (6)

12 (11)

11 (10)

€ 1,333 million 1)

(€ 1,436 million)

16

14 Management Report

Stand 10.11.2011 | Q2 e 2011 / 2012 | lagebericht

€ 149 million, up by 17 percent adjusted for ex change rate effects over the previous

year. This favorable sales trend was attributable largely to business in Mexico and

the US, whereas considerably lower sales were generated in Canada.

In the south america region, incoming orders amounted to € 46 million dur-

ing the second quarter, thereby remaining stable at the previous year’s level. The

incoming orders in this region for the first half of the year fell from the previous

year by € 10 million to € 81 million due to the ExpoPrint trade show the previous

year, at which a considerable volume of orders had been generated. Sales in this

region developed favorably, growing during the second quarter by 14 percent

adjusted for exchange rate effects over the previous year’s figure to € 35 million.

Sales for the first half of the year totaled € 65 million – 11 percent higher than the

previous year’s figure.

The asia / pacific region generated incoming orders totaling € 229 million dur-

ing the second quarter, thereby continuing stable at the previous year’s level.

Incoming orders amounting to € 465 million were generated during the overall

half-year period, thereby slightly exceeding Heidelberg’s own forecast. Adjusted

for exchange rate effects, this figure was stable at the previous year’s level. During

the second quarter, this region was successful in generating a 12 percent growth

in sales over the previous year adjusted for exchange rate effects to € 229 million.

Sales during the first half of the year, which totaled € 398 million, were stable at

the previous year’s level, whereas adjusted for exchange rate effects 6 percent

growth over the preceding year was realized. The increase was generated nearly

exclusively in China, whereas the development of sales in Japan has so far fallen

short of our expectations.

sales by region

figures in € millions

Q 1 to Q 2prior year

Q 1 to Q 22011 / 2012

Q 2prior year

Q 22011 / 2012

europe, middle east and africa 470 438 249 220

eastern europe 130 130 74 70

north america 139 149 67 82

South america 59 65 32 35

asia / pacific 398 398 211 229

Heidelberg Group 1,196 1,180 633 636

(adjusted for exchange rate effects 1,209 646)

17

Stand 10.11.2011 | Q2 e 2011 / 2012 | lagebericht

Management Report 15

employees

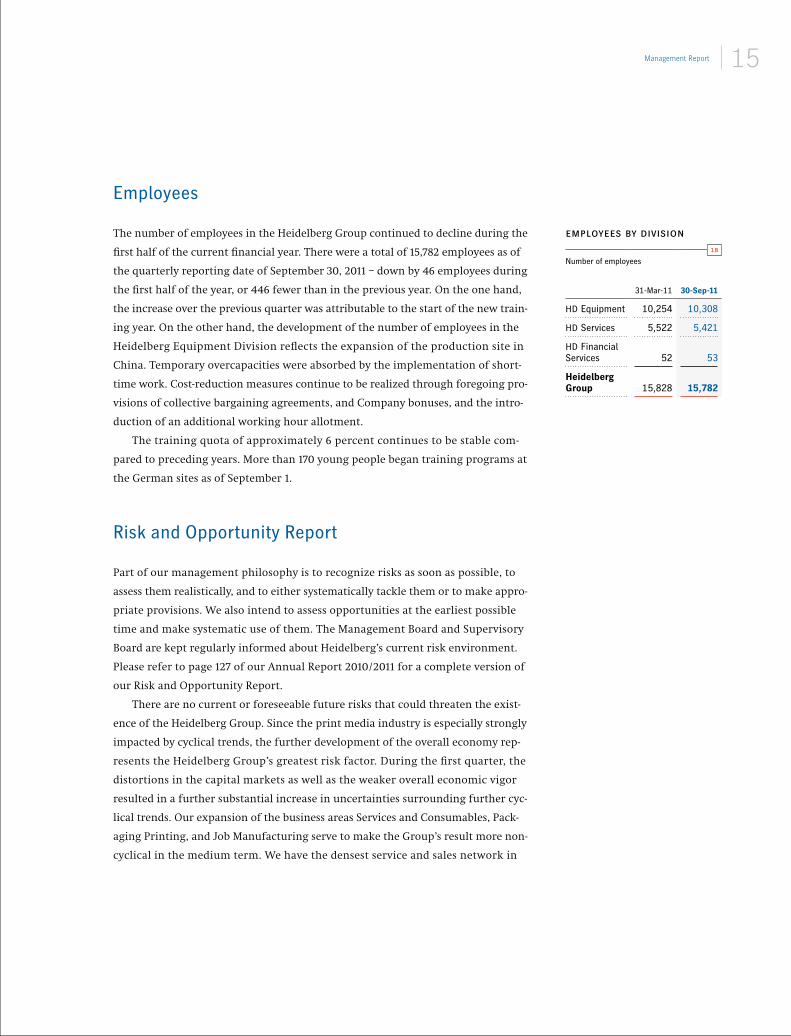
The number of employees in the Heidelberg Group continued to decline during the

first half of the current financial year. There were a total of 15,782 employees as of

the quarterly reporting date of September 30, 2011 – down by 46 employees during

the first half of the year, or 446 fewer than in the previous year. On the one hand,

the increase over the previous quarter was attributable to the start of the new train-

ing year. On the other hand, the development of the number of employees in the

Heidelberg Equipment Division reflects the expansion of the production site in

China. Temporary overcapacities were absorbed by the implementation of short-

time work. Cost-reduction measures continue to be realized through foregoing pro-

visions of collective bargaining agreements, and Company bonuses, and the intro-

duction of an additional working hour allotment.

The training quota of approximately 6 percent continues to be stable com-

pared to preceding years. More than 170 young people began training programs at

the German sites as of September 1.

risk and opportunity report

Part of our management philosophy is to recognize risks as soon as possible, to

assess them realistically, and to either systematically tackle them or to make appro-

priate provisions. We also intend to assess opportunities at the earliest possible

time and make systematic use of them. The Management Board and Supervisory

Board are kept regularly informed about Heidelberg’s current risk environment.

Please refer to page 127 of our Annual Report 2010 / 2011 for a complete version of

our Risk and Opportunity Report.

There are no current or foreseeable future risks that could threaten the exist-

ence of the Heidelberg Group. Since the print media industry is especially strongly

impacted by cyclical trends, the further development of the overall economy rep-

resents the Heidelberg Group’s greatest risk factor. During the first quarter, the

distortions in the capital markets as well as the weaker overall economic vigor

resulted in a further substantial increase in uncertainties surrounding further cyc-

lical trends. Our expansion of the business areas Services and Consumables, Pack-

aging Printing, and Job Manufacturing serve to make the Group’s result more non-

cyclical in the medium term. We have the densest service and sales network in

employees by division

number of employees

31­mar­11 30-Sep-11

hd equipment 10,254 10,308

hd Services 5,522 5,421

hd financial Services 52 53

Heidelberg Group 15,828 15,782

18

16 Management Report

Stand 10.11.2011 | Q2 e 2011 / 2012 | lagebericht

our industry, and we are the only European manufacturer to produce locally in

China. Both of these factors give Heidelberg important com petitive advantages.

Our financial environment risks decreased considerably from the previous

year. The successfully completed refinancing in April 2011 secures the Group’s

liquidity in the medium term.

Other than the risk of a sluggish economic turnaround, there is, of course,

also an opportunity for a more rapid and sustainable growth of the world economy

than has so far been expected. Further opportunities may occur if we are able to

benefit from the currently favorable exchange rate structures – in the medium

term as well – which result in advantages for German manufacturers vis-à-vis their

Japanese competitors.

future prospects

Heidelberg continues to believe that economic uncertainties will have a restraining

influence on investment behavior in our industry during the second half of the

financial year. The distortions in the capital markets and the weaker overall eco-

nomic momentum have increased uncertainties respecting further cyclical trends

compared with the first quarter. According to the German Engineering Federation

(VDMA), the incoming orders of the printing and paper technology sector are in a

general decline, with a 10 percent fall-off posted during the months June – August

2011 compared with the same period the previous year. The order backlog for

Heidelberg is highly differentiated internationally, and is influenced on the one

hand by the continuing uncertainties in the US, Japan, and the Mediterranean

countries, and on the other hand by the favorable business trend in China and

South America.

Due to the economic outlook, it can be expected that demand will be weaker

than anticipated during the second half of the financial year, and that sales and

the operating result will not reach the level aimed at by Heidelberg. As a conse-

quence, the goal of a balanced pre-tax result will probably not be attained. We still

believe that the share in total sales will continue to shift in favor of the heidelberg

equipment Division during the current financial year. Heidelberg intends to keep

Stand 10.11.2011 | Q2 e 2011 / 2012 | lagebericht

Management Report 17

the directly financed portfolio in the heidelberg financial services Division as

low as possible. In an endeavor to increase operating profitability in the current

financial year, measures relating to non-personnel costs and the human resources

area that can be implemented quickly have been introduced. The Company expects

that the operating result excluding special items for financial year 2011 / 2012 will

be noticeably better than that of the previous year. Thanks to the substantial reduc-

tion in debt, the financial result will have a considerably reduced dampening

effect than in the previous year.

Heidelberg’s medium-term profitability goals will continue in effect, even if

the planned sales increase to over € 3 billion is delayed due to weak demand. In

order to attain these profitability targets, Heidelberg is working on a program to

ensure the already established target of a result of operating activities excluding

special items of € 150 million within the next two financial years. Building on the

reorganization of the Company that was implemented in 2010, the focus will be

not only on further capacity and cost adjustments, but also on structural changes

in order to create long-term profitability for this business model. In doing so, we

closely examine all areas, products, and processes.

Heidelberg will prepare itself to effectively satisfy the requirements of a chang-

ing and more volatile environment of the market for professional advertising and

packaging printing. Heidelberg will publish information immediately as soon as

our examination is completed and measures have been approved.

18 Management Report

Stand 10.11.2011 | Q2 e 2011 / 2012 | lagebericht

Supplementary report

No significant events occurred following the financial reporting date.

important note:This Interim report contains forward­looking statements based on assumptions and estimations by

the management Board of heidelberger druckmaschinen aktiengesellschaft. even though the man­

agement Board is of the opinion that these assumptions and estimations are realistic, the actual future

development and results may deviate substantially from these forward­looking statements due to

various factors, such as changes in the macro­economic situation, in the exchange rates, in the inter­

est rates, and in the print media industry. heidelberger druckmaschinen aktiengesellschaft gives no

warranty and does not assume liability for any damages in case the future development and the pro­

jected results do not correspond with the forward­looking statements contained in this Interim report.

heidelberg does not intend, and does not assume any obligation, to update the forward­looking state­

ments contained in this Interim report to reflect events or developments that have occurred after

this Interim report was published.

Stand 10.11.2011 | Q2 e 2011 / 2012 | lagebericht

second quarter 2011 / 2012

In review

july

> Shareholders: annual general meeting of heidelberger druckmaschinen aktiengesellschaft

> acquisitions: heidelberg acquires CSaT gmbh

> products: enhanced functions for the prinect print shop workflow

> Trade Shows: Bernhard Schreier new president of drupa 2012

> Training: 174 young people start professional career

> plant expansion: heidelberg expands Chinese plant

auguST SepTemBer

Q 2 2011

july auguST

2 july 29, 2011

1 ShareholderS

Annual General Meeting of  

Heidelberger Druckmaschinen 

Aktiengesellschaft

July 28, 2011

> Shareholders agree all items on the

agenda with a clear majority

around 2,000 shareholders participate

as the management Board discusses the

balance sheet of the past financial year

and the Company’s strategy. The share­

holders appoint two new members to

the Supervisory Board until 2016: lone

fønss Schrøder and dr. herbert meyer.

robert j. koehler is elected as the new

Chairman of the Supervisory Board while

dr. mark wössner relinquishes his man­

date as planned. dr. werner Brand steps

down as a member of the Supervisory

Board at his own request. approximately

48 percent of the heidelberg share capi­

tal is represented at the meeting.

Heidelberg acquires CSAT GmbH

July 29, 2011

> Strategic acquisition expands the

digital print portfolio in the growth

market of packaging printing

heidelberg takes over CSaT gmbh, a

company specialized in the development,

manufacture, and worldwide sales and

service of digital printing systems, includ­

ing consumables for the packaging in­

dustry. The digital printing experts based

in eggenstein near karlsruhe employ some

70 staff. with this takeover, heidelberg

continues to expand its digital print strat­

egy and gains access to technology and

expertise in the areas of drop­on­demand

inkjet (dod) and electrophotography.

Enhanced functions for the Prinect 

print shop workflow 

August 11, 2011

> In future, prinect will offer a fully

integrated management information

system (mIS)

heidelberg extends the functions of its

prinect print shop workflow in four areas

of growth driving the print media industry:

management information systems (mIS),

web­to­print solutions, as well as digital

and packaging printing. mIS is based

on the technology developed by software

manufacturer Cerm whom heidelberg

acquired at the beginning of the year. The

solution is gradually being introduced

worldwide under the name prinect Busi­

ness manager. The Business manager

has a broad application spectrum and a

modular design, which makes it ideal

for various sizes of print shops.

2 aCQuIS IT IonS 3 produCTS

1july 28, 2011 3august 11, 2011

second quarter 2011 / 2012

In review

Q 2 2011

auguST

5 September 1, 2011

SepTemBer

Bernhard Schreier new president  

of drupa 2012

August 30, 2011

> Bernhard Schreier takes over from

martin weickenmeier

Bernhard Schreier, Ceo of heidelberger

druckmaschinen aktiengesellschaft, is

the new president of drupa, the leading

global trade show for the print media

industry. In this role, he succeeds martin

weickenmeier, managing director of sales,

marketing, and service at körber paper­

link gmbh. The next drupa trade show

takes place in düsseldorf between may

3 and 16, 2012.

174 young people start  

professional career

September 1, 2011

> heidelberg offers training in

13 different occupations and several

degree programs

heidelberg trains more than 170 young

people at its production sites in wies­

loch­walldorf, amstetten, Brandenburg,

leip zig, and ludwigsburg. The training

quota remains stable at around 6 percent

compared to previous years. further­

more, heidelberg presents itself as a

partner for training cooperations. This

year, 17 young people from other cor­

porations are starting their training at

heidelberg – a procedure which enables

these firms to benefit from heidelberg’s

highly awarded training concept.

Heidelberg expands Chinese plant

September 28, 2011

> Third construction phase officially

opened at Qingpu production site

The completion of the third construction

phase at the Qingpu site in China ex­

tends the plant’s production area to some

45,000 square meters – a threefold in­

crease in the area in just four years. at

Qingpu, heidelberg is producing all stan­

dard machines required by the Chinese

market. heidelberg is the only printing

press manufacturer based in either europe

or japan to have its own production fa­

cility in China. as a result, the Company

is further consolidating its leading role

on the world’s strongest growth market

in the print media industry.

4 Trade ShowS 5 Tra In Ing 6 planT expanSIon

4august 30, 2011 6September 28, 2011

22 Heidelberg Group

overview Charts, graphs, and Illustrations

at a glance

1 Performance of the Heidelberg Share C *

2 Key Performance Data C *

the share

3 Key Performance Data of the Heidelberg Share 2

underlying conditions

4 Change in GDP Worldwide 4

5 EUR / USD Exchange Rate 4

6 EUR / JPY Exchange Rate 4

business development

7 Incoming Orders per Quarter 6

8 Order Backlog per Quarter 79 Sales by Division 7

results of operations, net assets, and financial position

10 Result of Operating Activities 8

11 Balance Sheet Structure 9

12 Development of the Financial Structure 10

13 Consolidated Statement of Cash Flows 10

divisions

14 Heidelberg Equipment: Incoming Orders per Quarter 11

15 Heidelberg Services: Incoming Orders per Quarter 12

regions

16 Incoming Orders by Region 13

17 Sales by Region 14

employees

18 Employees by Division 15

* Cover

24 InterimConsolidatedIncomeStatementApril1,2011toSeptember30,2011

25 InterimConsolidatedStatementofComprehensiveIncomeApril1,2011toSeptember30,2011

26 InterimConsolidatedIncomeStatementJuly1,2011toSeptember30,2011

27 InterimConsolidatedStatementofComprehensiveIncomeJuly1,2011toSeptember30,2011

28 InterimConsolidatedStatementofFinancialPosition

30 StatementofChangesinConsolidatedEquity

32 InterimConsolidatedStatementofCashFlows

33 Notes

INtErImCoNSolIdAtEdF INANCIAlStAtEmENtS

heidelberg 2011 / 2012

InterimConsolidatedFinancialStatements

oFHEIdElbErgErdruCkmASCHINENAkt IENgESEllSCHAFtFortHEPErIodAPrIl 1 , 2011toSEPtEmbEr30, 2011

24 Heidelberg Group

Stand11.11.2011|Q2e2011/2012|Anhang

interim consolidated income statement april 1, 2011 to september 30, 2011

Figuresin€thousands

Note

1-Apr-2010to

30-Sep-2010

1-Apr-2011 to

30-Sep-2011

Netsales 1,196,003 1,180,402

Changeininventories 22,917 80,990

otherownworkcapitalized 2,712 4,516

Total operating performance 1,221,632 1,265,908

otheroperatingincome 3 74,026 55,114

Costofmaterials 4 608,015 592,961

Personnelexpenses 5 416,129 456,090

depreciationandamortization 49,240 46,210

otheroperatingexpenses 6 263,399 246,335

Specialitems 7 –21,952 3,276

resultofoperatingactivities –19,173 –23,850

Financialincome 8 13,487 9,929

Financialexpenses 9 100,457 52,094

Financialresult –86,970 –42,165

Income before taxes –106,143 –66,015

taxesonincome –18,441 –396

Consolidated net loss –87,702 – 65,619

Basic earnings per share according to IAS 33 (in € / share) 10 –1.11 – 0.28

Diluted earnings per share according to IAS 33 (in € / share) 10 –1.11 – 0.28

Stand11.11.2011|Q2e2011/2012|Anhang

Interim Consolidated Financial Statements 25

interim consolidated statement of comprehensive income april 1, 2011 to september 30, 2011

Figuresin€thousands

1-Apr-2010to

30-Sep-2010

1-Apr-2011 to

30-Sep-2011

Consolidated net loss –87,702 –65,619

Pensionobligations –117,828 –32,685

Currencytranslation 10,936 13,214

Financialassetsavailableforsale –557 –375

Cashflowhedges 4,695 –15,833

deferredincometaxes 30,796 –6,755

Total other comprehensive income –71,958 –42,434

Total comprehensive income –159,660 – 108,053

26 Heidelberg Group

Stand11.11.2011|Q2e2011/2012|Anhang

interim consolidated income statement july 1, 2011 to september 30, 2011

Figuresin€thousands

1-Jul-2010to

30-Sep-2010

1-Jul-2011 to

30-Sep-2011

Netsales 633,241 636,246

Changeininventories –7,062 10,689

otherownworkcapitalized 1,409 1,898

Total operating performance 627,588 648,833

otheroperatingincome 21,036 23,934

Costofmaterials 306,980 306,124

Personnelexpenses 197,195 219,238

depreciationandamortization 24,735 22,983

otheroperatingexpenses 125,431 119,801

Specialitems –7,388 3,370

resultofoperatingactivities 1,671 1,251

Financialincome 4,275 6,535

Financialexpenses 56,280 26,803

Financialresult –52,005 –20,268

Income before taxes –50,334 –19,017

taxesonincome –14,869 491

Consolidated net loss –35,465 – 19,508

Basic earnings per share according to IAS 33 (in € / share) –0.44 – 0.08

Diluted earnings per share according to IAS 33 (in € / share) –0.44 – 0.08

Stand11.11.2011|Q2e2011/2012|Anhang

Interim Consolidated Financial Statements 27

interim consolidated statement of comprehensive income july 1, 2011 to september 30, 2011

Figuresin€thousands

1-Jul-2010to

30-Sep-2010

1-Jul-2011 to

30-Sep-2011

Consolidated net loss –35,465 –19,508

Pensionobligations –64,396 –57,630

Currencytranslation –52,992 15,448

Financialassetsavailableforsale –557 –458

Cashflowhedges 33,570 –16,534

deferredincometaxes 10,332 –69

Total other comprehensive income –74,043 –59,243

Total comprehensive income –109,508 – 78,751

28 Heidelberg Group

Stand11.11.2011|Q2e2011/2012|Anhang

interim consolidated statement of financial position as of september 30, 2011 > assets

Figuresin€thousands

Note 31-mar-2011 30-Sep-2011

Non-current assets

Intangibleassets 11 266,667 253,831

Property,plant,andequipment 11 569,972 558,899

Investmentproperty 5,664 5,401

Financialassets 19,547 26,862

receivablesfromsalesfinancing 90,419 78,976

otherreceivablesandotherassets 12 42,920 39,777

Incometaxassets 499 1,484

deferredtaxassets 118,927 110,666

1,114,615 1,075,896

Current assets

Inventories 13 747,680 859,702

receivablesfromsalesfinancing 87,582 83,002

tradereceivables 376,928 326,547

otherreceivablesandotherassets 12 153,523 151,168

Incometaxassets 13,862 13,126

Cashandcashequivalents 14 147,934 162,907

1,527,509 1,596,452

Assets held for sale 908 1,655

totalassets 2,643,032 2,674,003

Stand11.11.2011|Q2e2011/2012|Anhang

Interim Consolidated Financial Statements 29

interim consolidated statement of financial position as of september 30, 2011 > equity and liabilities

Figuresin€thousands

Note 31-mar-2011 30-Sep-2011

Equity 15

Issuedcapital 596,302 599,308

Capitalreservesandretainedearnings 401,180 234,398

Consolidatednetloss –128,890 –65,619

868,592 768,087

Non-current liabilities

Provisionsforpensionsandsimilarobligations 16 221,011 265,957

otherprovisions 17 303,014 302,825

Financialliabilities 18 105,256 393,560

otherliabilities 19 127,670 137,106

deferredtaxliabilities 6,298 9,384

763,249 1,108,832

Current liabilities

otherprovisions 17 291,239 258,766

Financialliabilities 18 289,361 48,340

tradepayables 129,726 179,337

Incometaxliabilities 1,842 1,717

otherliabilities 19 299,023 308,924

1,011,191 797,084

totalequityandliabilities 2,643,032 2,674,003

30 Heidelberg Group

Stand11.11.2011|Q2e2011/2012|Anhang

statement of changes in consolidated equity as of september 30, 2011 1)

Figuresin€thousands

Issued capital Capital reserves Retained earnings Total capital reserves and

retained earnings

Consolidated net loss

Total

Pensionobligations

Currencytranslation

Fairvalueofotherfinancialassets

Fairvalueofcashflowhedges

otherretainedearnings

totalretainedearnings

April 1, 2010 198,767 19,025 –114,638 –200,541 –253 –6,685 911,782 589,665 608,690 –228,507 578,950

Capitalincrease 397,535 7,149 0 0 0 0 0 0 7,149 0 404,684

losscarryforward 0 0 0 0 0 0 –228,507 –228,507 –228,507 228,507 0

totalcomprehensiveincome 0 0 –85,707 10,936 –331 3,144 0 –71,958 –71,958 –87,702 –159,660

Consolidationadjustments/otherchanges 0 2,243 0 0 0 0 3,364 3,364 5,607 0 5,607

September 30, 2010 596,302 28,417 –200,345 –189,605 –584 –3,541 686,639 292,564 320,981 –87,702 829,581

April 1, 2011 596,302 27,694 –106,874 –196,284 –893 5,840 671,697 373,486 401,180 –128,890 868,592

Capitalincrease 2,347 325 0 0 0 0 0 0 325 0 2,672

losscarryforward 0 0 0 0 0 0 –128,890 –128,890 –128,890 128,890 0

totalcomprehensiveincome 0 0 –39,427 13,214 –375 –15,846 0 –42,434 –42,434 –65,619 –108,053

Consolidationadjustments/otherchanges 659 –921 0 0 0 0 5,138 5,138 4,217 0 4,876

September 30, 2011 599,308 27,098 – 146,301 – 183,070 – 1,268 – 10,006 547,945 207,300 234,398 – 65,619 768,087

1)Forfurtherinformationseenote15

Stand11.11.2011|Q2e2011/2012|Anhang

Interim Consolidated Financial Statements 31

Figuresin€thousands

Issued capital Capital reserves Retained earnings Total capital reserves and

retained earnings

Consolidated net loss

Total

Pensionobligations

Currencytranslation

Fairvalueofotherfinancialassets

Fairvalueofcashflowhedges

otherretainedearnings

totalretainedearnings

April 1, 2010 198,767 19,025 –114,638 –200,541 –253 –6,685 911,782 589,665 608,690 –228,507 578,950

Capitalincrease 397,535 7,149 0 0 0 0 0 0 7,149 0 404,684

losscarryforward 0 0 0 0 0 0 –228,507 –228,507 –228,507 228,507 0

totalcomprehensiveincome 0 0 –85,707 10,936 –331 3,144 0 –71,958 –71,958 –87,702 –159,660

Consolidationadjustments/otherchanges 0 2,243 0 0 0 0 3,364 3,364 5,607 0 5,607

September 30, 2010 596,302 28,417 –200,345 –189,605 –584 –3,541 686,639 292,564 320,981 –87,702 829,581

April 1, 2011 596,302 27,694 –106,874 –196,284 –893 5,840 671,697 373,486 401,180 –128,890 868,592

Capitalincrease 2,347 325 0 0 0 0 0 0 325 0 2,672

losscarryforward 0 0 0 0 0 0 –128,890 –128,890 –128,890 128,890 0

totalcomprehensiveincome 0 0 –39,427 13,214 –375 –15,846 0 –42,434 –42,434 –65,619 –108,053

Consolidationadjustments/otherchanges 659 –921 0 0 0 0 5,138 5,138 4,217 0 4,876

September 30, 2011 599,308 27,098 – 146,301 – 183,070 – 1,268 – 10,006 547,945 207,300 234,398 – 65,619 768,087

1)Forfurtherinformationseenote15

32 Heidelberg Group

Stand11.11.2011|Q2e2011/2012|Anhang

interim consolidated statement of cash flows april 1, 2011 to september 30, 2011

Figuresin€thousands

1-Apr-2010to

30-Sep-2010

1-Apr-2011 to

30-Sep-2011

Consolidatednetloss –87,702 –65,619

depreciationandamortization,write-downsandreversals1) 49,638 48,726

Changeinpensionprovisions 7,466 8,146

Changeindeferredtaxassets/deferredtaxliabilities/taxprovisions –24,118 –3,955

resultfromdisposals1) –5,796 –680

Cash flow –60,512 – 13,382

Changeininventories –10,344 –103,972

Changeinsalesfinancing 27,506 18,669

Changeintradereceivables/payables 79,143 109,375

Changeinotherprovisions –77,333 –29,911

Changeinotheritemsofthestatementoffinancialposition 105,336 24,130

Other operating changes 124,308 18,291

Cash generated by operating activities 63,796 4,909

Intangibleassets/property,plant,andequipment/investmentproperty

Investments –25,264 –31,280

Incomefromdisposals 26,194 15,217

Financialassets/corporateacquisitions

Investments –137 –7,467

Incomefromdisposals 3,928 48

Cash generated by / used in investing activities 4,721 – 23,482

Incomefromcapitalincrease 401,115 0

Changeinfinancialliabilities –459,280 29,042

Cash used in / generated by financing activities –58,165 29,042

Net change in cash and cash equivalents 10,352 10,469

Cash and cash equivalents as of the start of the reporting period 120,696 147,934

Currencyadjustments 2,617 4,504

Netchangeincashandcashequivalents 10,352 10,469

Cash and cash equivalents as of the end of the reporting period 133,665 162,907

Cashgeneratedbyoperatingactivities 63,796 4,909

Cashgeneratedby/usedininvestingactivities 4,721 –23,482

Free cash flow 68,517 – 18,573

1)relatestointangibleassets,property,plant,andequipment,investmentproperty,loans,andothersecurities

Stand11.11.2011|Q2e2011/2012|Anhang

Interim Consolidated Financial Statements 33

notes

The interim consolidated financial statements as of September 30, 2011 are con-

sistent with and were prepared in line with the regulations of IAS 34 (Interim

Financial Reporting). They should be read in conjunction with the consolidated

financial statements as of March 31, 2011, which were prepared in line with the

International Financial Reporting Standards (IFRS) as endorsed in the EU.

The interim consolidated financial statements were prepared using the same

accounting policies as the consolidated financial statements for the 2010 / 2011

financial year. In accordance with the regulations of IAS 34, a condensed scope of

reporting was chosen as against the consolidated financial statements as of

March 31, 2011. All amounts are stated in € thousands.

The International Accounting Standards Board (IASB) and the IFRS Interpreta-

tions Committee (IFRS IC) have issued the following new standards and interpreta-

tions as well as amendments to existing standards and interpretations, which are

to be applied for the first time in financial year 2011 / 2012:

1 accounting policies

Standard PublicationbytheIASb/IFrSIC

dateofadoption1) PublishedinofficialJournaloftheEu

Effects

Amendments to standards

IAS24:relatedPartydisclosures(revised2009)

4-Nov-2009 1-Jan-2011 20-Jul-2010 > None

AmendmenttoIFrS1:limitedExemptionforFirst-timeAdoptersfromIFrS7andtoIFrS7:FinancialInstruments:disclosures

28-Jan-2010 1-Jul-2010 1-Jul-2010 > None

ImprovementstoInternationalFinancialreportingStandards2010

10-may-2010 Various,1-Jul-2010atearliest

19-Feb-2011 > None2)

Amendments to interpretations

AmendmentstoIFrICInterpretation14:PrepaymentsofaminimumFundingrequirement

26-Nov-2009 1-Jan-2011 20-Jul-2010 > None

New interpretations

IFrICInterpretation19:ExtinguishingFinancialliabilitieswithEquityInstruments

26-Nov-2009 1-Jul-2010 24-Jul-2010 > None

1)Forfinancialyearsbeginningonorafterthisdate2)Effectsonaccountingforbusinessacquisitionsandfortransactionswithnon-controllingintereststhatdidnotoccurinthereportingperiod

andeffectsondisclosuresonfinancialinstrumentsattheendofthefinancialyearthatarecurrentlybeingexamined

34 Heidelberg Group

Stand11.11.2011|Q2e2011/2012|Anhang

The IASB and IFRS IC approved and amended the following standards and inter-

pretations, whose application during financial year 2011 / 2012 is not yet compulsory

or which have not yet been endorsed by the European Union (EU).

> Amendments to IAS 1: Presentation of Financial Statements

> Amendments to IFRS 12: Deferred Tax: Recovery of Underlying Assets

> Amendments to IAS 19: Employee Benefits

> IAS 27: Consolidated and Separate Financial Statements

> IAS 28: Investments in Associates

> Amendments to IFRS 1: Hyperinflation and Deletion of

Fixed Date References for First-time Adopters

> Amendments to IFRS 7: Financial Instruments: Disclosures: Transfers of

Financial Assets

> IFRS 9: Financial Instruments

> IFRS 10: Consolidated Financial Statements

> IFRS 11: Joint Arrangements

> IFRS 12: Disclosure of Interests in Other Entities

> IFRS 13: Fair Value Measurement

> IFRIC Interpretation 20: “Stripping Costs in the Production Phase of

a Surface Mine”

The effects of first-time adoption of the IFRS relevant to Heidelberg on the financial

statements of the Heidelberg Group are currently being examined. Heidelberg is

not currently planning to apply these standards at an early date.

Traditionally, Heidelberg generates more sales in the second half of the finan-

cial year than the first. Income that is generated due to seasonal reasons, economic

reasons, or only occasionally within the financial year is not brought forward or

deferred in the interim consolidated financial statements. Expenses that are incurred

irregularly during the financial year are deferred in cases in which they would

also be deferred at the end of the financial year.

The interim report has neither been audited according to Section 317 HGB, nor

reviewed by the auditors.

Stand11.11.2011|Q2e2011/2012|Anhang

Interim Consolidated Financial Statements 35

The interim consolidated financial statements of Heidelberger Druckmaschinen

Aktiengesellschaft include a total of 75 (March 31, 2011: 75) domestic and foreign

companies in which Heidelberger Druckmaschinen Aktiengesellschaft has a con-

trolling influence as defined by IAS 27. Of these, 64 (March 31, 2011: 64) are located

outside Germany. Subsidiaries that are of minor importance are not included.

The income from hedging / exchange rate gains is offset by expenses for hedging /

exchange rate losses reported under other operating expenses (see note 6).

The cost of materials includes the pro rata interest expense in connection with the

Heidelberg Financial Services segment of € 1,214 thousand (April 1, 2010 to Septem-

ber 30, 2010: € 2,439 thousand); the interest income from sales financing of € 8,461

thousand (April 1, 2010 to September 30, 2010: € 8,731 thousand) is reported in sales.

The increase in staff costs is due, among others, to the reduction of short-time work

at the German locations as against the previous year.

2 scope of consolidation

3 other operating income

1-Apr-2010to

30-Sep-2010

1-Apr-2011to

30-Sep-2011

reversalofotherprovisions/deferredliabilities 16,200 16,553

recoveriesonloansandotherassetspreviouslywrittendown 15,226 11,233

Hedging/exchangerategains 10,261 7,919

Incomefromoperatingfacilities 7,065 5,744

Incomefromdisposalsofintangibleassets,property,plant,andequipment,andinvestmentproperty 7,935 1,349

otherincome 17,339 12,316

74,026 55,114

4 cost of materials

5 staff costs

36 Heidelberg Group

Stand11.11.2011|Q2e2011/2012|Anhang

The expenses for hedging / exchange rate losses are offset by income from hedging /

exchange rate gains reported under other operating income (see note 3).

Special items include expenses and income in connection with both our Heidelberg

2010 program and our efficiency enhancement measures.

The expenses of € 3,276 thousand reported under special items in the period

under review (April 1, 2010 to September 30, 2010: € 21,952 thousand) resulted

predominantly from staff-related expenses which were partially compensated by

the reversal of provisions in Germany due to the agreements between the manage-

ment and employee representatives on the coordination of interests for German

locations.

6 other operating expenses 1-Apr-2010

to30-Sep-2010

1-Apr-2011to

30-Sep-2011

Specialdirectsalesexpensesincludingfreightcharges 51,973 56,437

otherdeliveriesandservicesnotincludedinthecostofmaterials 53,472 55,125

rentandleases 33,765 31,410

travelexpenses 20,234 21,224

baddebtallowancesandimpairmentonotherassets 11,091 12,023

Hedging/exchangeratelosses 17,793 10,864

Insuranceexpense 7,829 6,425

Additionstoprovisionsandaccrualsrelatingtoseveraltypesofexpense 8,726 5,059

Costsofcarfleet(excludingleases) 4,381 4,076

otheroverheads 54,135 43,692

263,399 246,335

7 special items

Stand11.11.2011|Q2e2011/2012|Anhang

Interim Consolidated Financial Statements 37

Earnings per share are calculated by dividing the earnings for the period attributable

to shareholders by the weighted number of shares outstanding in the period. The

weighted number of shares outstanding in the period under review was 233,693,184

(April 1, 2010 to September 30, 2010: 79,349,883). The weighted number of shares

outstanding was influenced by the capital increase to implement the court settle-

ment with the former shareholders of Linotype-Hell Aktiengesellschaft (see note 15)

and the holdings of treasury shares. In the reporting period, 257,081 treasury shares

were issued to employees of Heidelberger Druckmaschinen Aktiengesellschaft

and its subsidiaries as employee shares. As of September 30, 2011, the Company still

held 142,919 treasury shares (March 31, 2011: 400,000).

8 financial income

1-Apr-2010to

30-Sep-2010

1-Apr-2011to

30-Sep-2011

Interestandsimilarincome 9,089 7,499

Incomefromfinancialassets/loans/securities 4,398 2,430

13,487 9,929

9 financial expenses

1-Apr-2010to

30-Sep-2010

1-Apr-2011to

30-Sep-2011

Interestandsimilarexpenses 99,352 50,446

Expensesforfinancialassets/loans/securities 1,105 1,648

100,457 52,094

10 earnings per share

38 Heidelberg Group

Stand11.11.2011|Q2e2011/2012|Anhang

In the period from April 1, 2011 to September 30, 2011, there were additions to intan-

gible assets of € 2,012 thousand (April 1, 2010 to September 30, 2010: € 1,819 thou-

sand) and to property, plant, and equipment of € 32,323 thousand (April 1, 2010 to

September 30, 2010: € 28,329 thousand). In the same period, the carrying amount

of disposals from intangible assets was € 1 thousand (April 1, 2010 to September 30,

2010: € 4 thousand) and € 14,536 thousand (April 1, 2010 to September 30, 2010:

€ 12,574 thousand) for property, plant, and equipment.

The “Other receivables and other assets” item includes receivables from derivative

financial instruments of € 40,159 thousand (March 31, 2011: € 38,818 thousand) and

prepaid expenses of € 23,184 thousand (March 31, 2011: € 14,734 thousand).

Inventories include raw materials, consumables and supplies of € 125,707 thousand

(March 31, 2011: € 113,572 thousand), work in progress of € 379,152 thousand

(March 31, 2011: € 332,086 thousand), finished goods and goods for resale of € 350,068

thousand (March 31, 2011: € 299,160 thousand) and advance payments of € 4,775

thousand (March 31, 2011: € 2,862 thousand).

Restrictions on disposal of cash and cash equivalents due to foreign exchange

restrictions amount to € 80,140 thousand (March 31, 2011: € 70,650 thousand).

As of March 31, 2011, the Company held 400,000 treasury shares (cost: € 13,258

thousand). These shares can only be utilized to reduce the capital of Heidelberger

Druckmaschinen Aktiengesellschaft or for employee share participation programs

and other forms of share distribution to the employees of the Company or a sub sidi-

ary or to individuals who are or were employed by Heidelberger Druckmaschinen

Aktiengesellschaft or one of its associates.

11 intangible assets and property, plant, and equipment

12 other receivables and other assets

13 inventories

14 cash and cash equivalents

15 equity

Stand11.11.2011|Q2e2011/2012|Anhang

Interim Consolidated Financial Statements 39

As part of the agreement reached at the start of the previous year between the

management and employee representatives on the coordination of interests for

German locations it was agreed to set up an employee share participation program.

The issuance of shares is therefore free of charge for employees. In the first quarter

of the 2011 / 2012 financial year, 257,081 treasury shares were used for this employee

share program. As of June 30, 2011, the Company still held 142,919 treasury shares.

Please see note 26 of the consolidated financial statements as of March 31, 2011

for information on the contingent and authorized capitals as of March 31, 2011.

There were significant changes due to the capital increase to implement the

court settlement with the former shareholders of Linotype-Hell Aktiengesellschaft

and the resolutions of the Annual General Meeting of July 28, 2011.

Under the amicable settlement of the court dispute with the former sharehold-

ers of Linotype-Hell Aktiengesellschaft regarding the exchange ratio on March 30,

2011, it was agreed by way of court settlement to compensate the shareholders in

shares of Heidelberger Druckmaschinen Aktiengesellschaft. For this purpose, the

Management Board resolved, with the approval of the Supervisory Board, to increase

the share capital by € 2,346,593.28 by issuing 916,638 new shares. Shareholders’

preemptive subscription rights were disapplied with the approval of the Super-

visory Board. To create new shares, the Management Board partially exercised its

authorization under the resolution of the Annual General Meeting on July 18, 2008

to increase the share capital by issuing new shares against contributions (Authorized

Capital 2008). The capital increase resolution was entered in the commercial reg-

ister on June 6, 2011. The amicable settlement of the court dispute led to a derecog-

nition increasing retained earnings in the reporting period.

As the authorization of the Executive Board to increase share capital by issuing

new shares against contributions granted by the Annual General Meeting of July 18,

2008 expired on July 1, 2011, Authorized Capital 2008 has been irrelevant since

July 2, 2011.

40 Heidelberg Group

Stand11.11.2011|Q2e2011/2012|Anhang

On July 28, 2011, the Annual General Meeting authorized the Management Board,

with the approval of the Supervisory Board, to increase the share capital of the

Company by up to a total of € 119,934,433.28 on one or more occasions against cash

contributions until July 27, 2016 (Authorized Capital 2011). The Management

Board was authorized, with the approval of the Supervisory Board, to determine

the further content of the shares’ rights and the conditions for their issue. This

authorization takes place upon entry of the amendment to the Articles of Associa-

tion in the commercial register, which was effected on August 5, 2011. In addition,

the Annual General Meeting on July 28, 2011 revoked its authorization of the Man-

agement Board resolved on July 23, 2009, which allowed the Management Board,

with the approval of the Supervisory Board, to increase the share capital of the

Company by up to a total of € 39,958,236.16 on one or more occasions against

cash contributions until July 1, 2014 (Authorized Capital 2009), effective from the

date Authorized Capital 2011 is entered in the commercial register.

A discount rate of 5.00 percent (March 31, 2011: 5.00 percent) was used to calcu-

late the actuarial gains and losses of German companies as of September 30, 2011.

Other provisions relate to tax provisions of € 196,564 thousand (March 31, 2011:

€ 203,677 thousand) and other provisions of € 365,027 thousand (March 31, 2011:

€ 390,576 thousand). Other provisions include staff obligations of € 89,407 thou-

sand (March 31, 2011: € 109,436 thousand), sales obligations of € 132,536 thousand

(March 31, 2011: € 134,622 thousand), and miscellaneous other provisions of € 143,084

thousand (March 31, 2011: € 146,518 thousand). Among other things, the latter include

provisions for onerous contracts.

16 provisions for pensions and similar obligations

17 other provisions

Stand11.11.2011|Q2e2011/2012|Anhang

Interim Consolidated Financial Statements 41

On March 25, 2011, Heidelberg agreed a comprehensive refinancing of the credit

lines due in summer 2012. Firstly, this included the high-yield bond of € 304 million

with a term of seven years successfully issued on April 7, 2011. Heidelberg used

the net proceeds for the early repayment of the two partially government-backed

credit lines and for general refinancing of the Company. Secondly, the lines pre-

viously in place were replaced by a new revolving credit facility of € 500 million

from a banking syndicate, maturing at the end of 2014. The agreement on the new

credit facility contains standard financial covenants regarding the financial situation

of the Heidelberg Group.

18 financial liabilities

31-mar-2011 30-Sep-2011

Current Non-current total Current Non-current total

borrower’snoteloans 4,518 50,000 54,518 0 50,000 50,000

Amountsduetobanks 264,679 49,727 314,406 15,362 45,248 60,610

High-yieldbond 0 0 0 11,957 291,263 303,220

Fromfinanceleases 2,152 5,529 7,681 2,445 7,049 9,494

other 18,012 0 18,012 18,576 0 18,576

289,361 105,256 394,617 48,340 393,560 441,900

42 Heidelberg Group

Stand11.11.2011|Q2e2011/2012|Anhang

Other liabilities include advance payments on orders of € 103,102 thousand

(March 31, 2011: € 86,610 thousand), liabilities from derivative financial instruments

of € 41,476 thousand (March 31, 2011: € 25,720 thousand), and deferred income of

€ 66,687 thousand (March 31, 2011: € 70,674 thousand).

As of September 30, 2011, the contingent liabilities for warranties and guaran-

tees amounted to € 4,452 thousand (March 31, 2011: € 3,476 thousand).

The other financial liabilities amounted to € 323,987 thousand as of Septem-

ber 30, 2011 (March 31, 2011: € 328,277 thousand). Of this, € 290,064 thousand

(March 31, 2011: € 285,225 thousand) related to lease and rental obligations and

€ 33,923 thousand (March 31, 2011: € 43,052 thousand) related to investments and

other purchase commitments.

The segment reporting is based on the management approach.

The Heidelberg Group consists of the business segments Heidelberg Equipment,

Heidelberg Services, and Heidelberg Financial Services. Heidelberg Equipment

essentially comprises new machinery business. Services, consumables, and remar-

keted equipment business are bundled in the Heidelberg Services segment. The

Heidelberg Financial Services segment comprises sales financing business. Further

information on the business activities, products, and services of the individual

segments can be found in the sections “Product Porfolio” and “Group Corporate

Structure and Organization” in the Group management report as of March 31, 2011.

19 other liabilities

20 contingent liabilities and other financial liabilities

21 group segment reporting

Stand11.11.2011|Q2e2011/2012|Anhang

Interim Consolidated Financial Statements 43

segment information april 1, 2011 to september 30, 2011 1):

The segment result is reconciled to earnings before taxes as follows:

External sales relate to the different regions as follows:

HeidelbergEquipment HeidelbergServices HeidelbergFinancialServices Heidelberg Group

1-Apr-2010to

30-Sep-2010

1-Apr-2011to

30-Sep-2011

1-Apr-2010to

30-Sep-2010

1-Apr-2011to

30-Sep-2011

1-Apr-2010to

30-Sep-2010

1-Apr-2011to

30-Sep-2011

1-Apr-2010to

30-Sep-2010

1-Apr-2011to

30-Sep-2011

Externalsales 649,023 673,548 538,249 498,393 8,731 8,461 1,196,003 1,180,402

resultofoperatingactivities(segmentresult) –67,968 –57,416 39,624 26,263 9,171 7,303 –19,173 –23,850

Investments 26,748 27,674 3,400 6,649 0 13 30,148 34,336

1-Apr-2010to

30-Sep-2010

1-Apr-2011to

30-Sep-2011

resultofoperatingactivities(segmentresult) –19,173 –23,850

Financialresult –86,970 –42,165

Income before taxes –106,143 – 66,015

1-Apr-2010to

30-Sep-2010

1-Apr-2011to

30-Sep-2011

Europe, Middle East and Africa

germany 174,628 181,254

otherEurope,middleEastandAfricaregions 295,735 256,435

470,363 437,689

Asia / Pacific

China 195,125 215,227

otherAsia/Pacificregions 202,759 183,386

397,884 398,613

Eastern Europe 130,448 129,727

North America 138,449 148,900

South America 58,859 65,473

1,196,003 1,180,402

44

Stand11.11.2011|Q2e2011/2012|Anhang

Heidelberg Group

The members of the Supervisory Board and the Management Board are presented

on pages 46 – 47.

As described in note 41 of the notes to the consolidated financial statements as of

March 31, 2011, business relationships exist between numerous companies and

Heidelberger Druckmaschinen Aktiengesellschaft and its subsidiaries in the course

of ordinary business. This also includes associated companies, which are regarded

as related companies of the Heidelberg Group.

In the reporting period, transactions were performed with related parties that

resulted in liabilities of € 8,826 thousand (March 31, 2011: € 5,101 thousand), receiv-

ables of € 15,839 thousand (March 31, 2011: € 14,157 thousand), expenses of € 8,010

thousand (April 1, 2010 to September 30, 2010: € 4,983 thousand) and income of

€ 8,490 thousand (April 1, 2010 to September 30, 2010: € 8,584 thousand), which

essentially comprises sales. All transactions were again conducted as at arm’s length

and did not differ from relationships with other companies.

Enterprises controlled by a member of the Supervisory Board of Heidelberger

Druckmaschinen Aktiengesellschaft provided advisory services to Heidelberger

Druckmaschinen Aktiengesellschaft and fully consolidated companies amounting

to € 418 thousand (April 1, 2010 to September 30, 2010: € 120 thousand).

There were no significant events after the end of the reporting period.

Heidelberg, November 8, 2011

heidelberger druckmaschinen aktiengesellschaft

The Management Board

22 supervisory board / management board

23 related party transactions

24 significant events after the end of the reporting period

Stand11.11.2011|Q2e2011/2012|Anhang

45Responsibility Statement

responsibilityStatement

To the best of our knowledge, and in accordance with the applicable reporting

principles for interim financial reporting, the Interim Consolidated Financial

Statements give a true and fair view of the assets, financial position, and profit or

loss of the Group, and the Interim Group Management Report includes a fair

review of the development and performance of the business and the position of

the Group, together with a description of the principal opportunities and risks

associated with the expected development of the Group for the remaining months

of the financial year.

Heidelberg, November 8, 2011

heidelberger druckmaschinen aktiengesellschaft

The Management Board

Bernhard Schreier Dirk Kaliebe

Marcel Kiessling Stephan Plenz

46 Executive Bodies of the Company

Stand11.11.2011|Q2e2011/2012|Anhang

theSupervisoryboard

Dr. Mark Wössner

Chairman of the Supervisory Board

– through July 28, 2011 –

Robert J. Koehler

Chairman of the Supervisory Board

– Chairman since July 28, 2011 –

Rainer Wagner*

Deputy Chairman of the

Supervisory Board

Dr. Werner Brandt

– through July 28, 2011 –

Edwin Eichler

Wolfgang Flörchinger*

Martin Gauss*

Mirko Geiger*

Gunther Heller*

Jörg Hofmann*

Dr. Siegfried Jaschinski

Dr. Herbert Meyer

– since July 28, 2011 –

Dr. Gerhard Rupprecht

Beate Schmitt*

Lone Fønss Schrøder

– since July 28, 2011 –

Prof. Dr.-Ing. Günther Schuh

Dr. Klaus Sturany

Peter Sudadse*

* Employeerepresentative

Stand11.11.2011|Q2e2011/2012|Anhang

Executive Bodies of the Company 47

CommitteesoftheSupervisoryboard themanagementboard

Management Committee

Dr. Mark Wössner (Chairman)

– through July 28, 2011 –

Robert J. Koehler (Chairman)

– since July 28, 2011 –

Rainer Wagner

Martin Gauss

Mirko Geiger

Dr. Gerhard Rupprecht

Dr. Klaus Sturany

Mediation Committee

under Article 27 Paragraph 3

of the Codetermination Act

Dr. Mark Wössner, (Chairman)

– through July 28, 2011 –

Robert J. Koehler (Chairman)

– since July 28, 2011 –

Rainer Wagner

Wolfgang Flörchinger

Dr. Gerhard Rupprecht

Committee on Arranging

Personnel Matters of the

Management Board

Dr. Mark Wössner (Chairman)

– through July 28, 2011 –

Robert J. Koehler (Chairman)

– since July 28, 2011 –

Rainer Wagner

Dr. Gerhard Rupprecht

Beate Schmitt

Audit Committee

Dr. Klaus Sturany (Chairman)

Dr. Werner Brandt

– through July 28, 2011 –

Mirko Geiger

Dr. Herbert Meyer

– since July 28, 2011 –

Rainer Wagner

Nomination Committee

Dr. Mark Wössner (Chairman)

– through July 28, 2011 –

Robert J. Koehler (Chairman)

– since July 28, 2011 –

Dr. Klaus Sturany

Bernhard Schreier

Chief Executive Officer

Dirk Kaliebe

Marcel Kiessling

Stephan Plenz

48 Financial Calendar

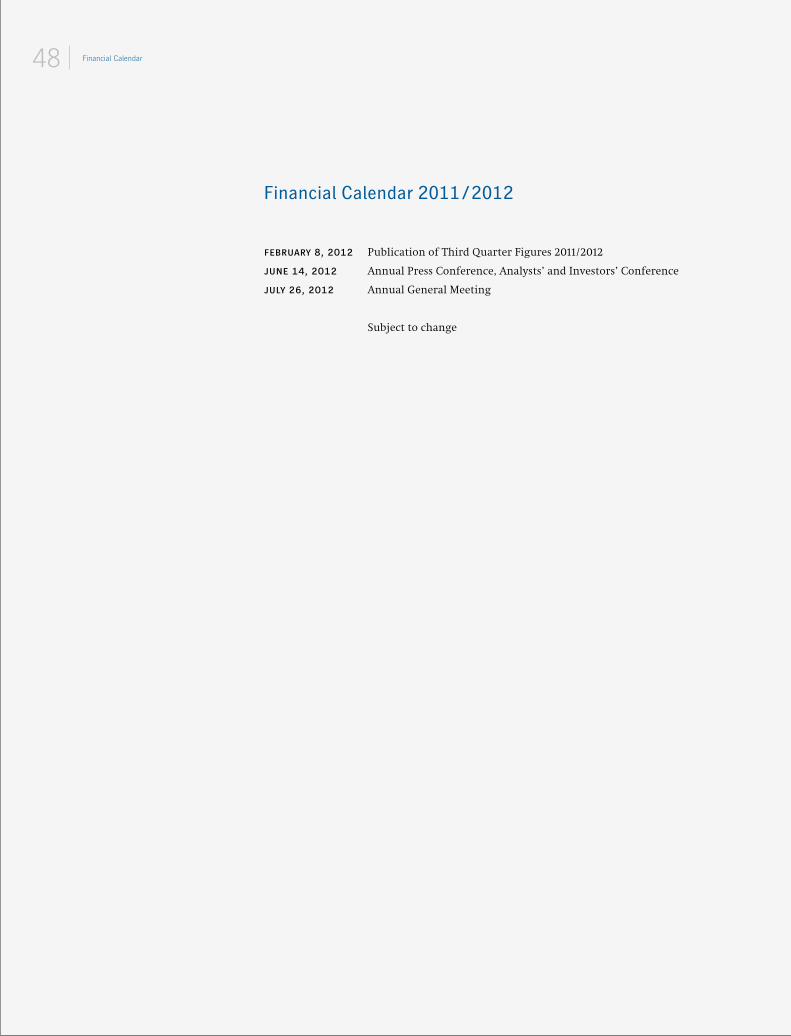
february 8, 2012 Publication of Third Quarter Figures 2011 / 2012

june 14, 2012 Annual Press Conference, Analysts’ and Investors’ Conference

july 26, 2012 Annual General Meeting

Subject to change

FinancialCalendar2011/2012

At a Glance

DaXHeidelberg mDaX

performance of the heidelberg share

compared with the DaX / mDaX (Index: april 1, 2011 = 0 percent)

0

– 10

– 30

– 40

– 50

– 60

– 70

– 20

10

april 2011 may 2011 June 2011 July 2011 august 2011 September 2011

%

1

key performance data

Figures in € millions

Q 1 to Q 2 prior year

Q 1 to Q 2  2011 / 2012

Q 2 prior year

Q 2  2011 / 2012

Incoming orders 1,436 1,333 1) 650 668

Net sales 1,196 1,180 2) 633 636

EBITDA 3) 8 26 19 28

Result of operating activities 4) – 41 – 21 – 6 5

–  in percent of sales – 3.4 % – 1.8 % – 0.9 % 0.8 %

Net loss – 88 – 66 – 36 – 20

–  in percent of sales – 7.4 % – 5.6 % – 5.7 % – 3.1 %

Cash flow  – 61 – 13 – 27 9

–  in percent of sales – 5.1 % – 1.1 % – 4.3 % 1.4 %

Free cash flow  69 – 19 7 – 12

Research and development costs 60 69 30 32

Investments 30 34 15 17

Undiluted earnings per share in € 5) – 1.11 – 0.28 – 0.44 – 0.08

1) Including negative exchange rate effects totaling € – 34 million (adjusted for exchange rate effects: € 1,367 million)2) Including negative exchange rate effects totaling € – 29 million (adjusted for exchange rate effects: € 1,209 million)3) result of operating activities excluding special items and before depreciation and amortization4) excluding special items5) Determined based on the weighted number of outstanding shares

2

Publishing Information

copyright © 2011

Heidelberger Druckmaschinen

Aktiengesellschaft

Kurfuersten-Anlage 52 – 60

69115 Heidelberg

Germany

www.heidelberg.com

[email protected]

This report was published on November 8, 2011.

Photo credits: 

Second Quarter in Review – Archive Heidelberger Druckmaschinen AG

Produced on Heidelberg machines using Heidelberg technology.

All rights and technical changes reserved. 

Printed in Germany.

Q 2 I n t e r I m F I n a n c I a l r e p o r t 2011 / 2012

Q 2// education & consulting // Sys-temservice // Saphira // prinect // print media academy //

Systemservice // Saphira // prinect // print media academy // education & consulting // re-marketed equipment // System-service // Saphira // prinect // print media academy // educa-tion & consulting // performance Services // Systemservice // Saphira // prinect // print media academy // technical Services

Diana X // Financial Services // Suprasetter // Speedmaster Xl 145 and Xl 162 // anicolor //

Suprasetter // Speedmaster Sm 52 // anicolor // Speedmaster Sm 74 // Speedmaster Xl 75 // Speedmaster Sm 102 // Stahl-folder tH / KH // Speedmaster cD 102 // Speedmaster cX 102 // Stitchmaster // Speedmaster Xl 105 // Speedmaster Xl 145 and Xl 162 // eurobind // Vari-matrix // Dymatrix // easygluer //

Heidelberger Druckmaschinen aG

Kurfuersten-anlage 52 – 60

69115 Heidelberg

Germany

www.heidelberg.com


Recommended