Page 1
HELP - LIFE - CHANGE
Four Global Questions Survey
Preliminary Findings
Report #1
October 4, 2012
By,
Rita Agarwal, Optimus Information, Inc.
Dara Barlin, A Big Project
Charles Parker, BigML, Inc.
Page 2
2
Table of Contents
Executive Summary......................................................................................................................3
Introduction & Research Methods...............................................................................................4
Respondent Demographics..........................................................................................................7
Findings........................................................................................................................................8
Responses based on survey questions..............................................................................8
Responses based on region...............................................................................................11
Responses based on gender..............................................................................................12
Trend Analysis..............................................................................................................................13
Appendix A (words omitted in analysis)......................................................................................15
Appendix B (countries alphabetically by corresponding region)................................................16
Page 3
3
Executive Summary
In January of 2012, a group of individuals from 18 countries came together to form A Big Project. These
organizers sought to gain clarity on where people agreed the world could be better – and to share that message
in ways that could open people’s minds and hearts, through art and music. The first part of the project sought to
gain more clarity on the places where we agree. This phase began on August 15th when people around the world
were asked to respond to four questions:
If the world as it currently exists were to radically shift tomorrow, and we had a chance to recreate the world:
What would you NOT want to continue from this world? What WOULD you want to continue from this world?
What could people do differently now to help us get to that better world?
What is one thing that you will commit to do differently now to help us get to that better world?
In the first month of this four-month long survey process 1274 people from 97 countries responded. This report
represents the findings based on the first month’s responses.
Summary of Key Findings
Much of the findings in this report confirm what many already believed a better world might look like. If we had
the opportunity to recreate the world, most people would NOT want to continue things like war, poverty, and
corruption. People would want to continue things like love, peace, and nature.
But when looking deeper into what people would continue into a new better world, a few more interesting ideas
emerge. Included in the top ten things that people would like to ensure are kept from this world are:
technology, music, art, culture, education, diversity and freedom.
When looking at gender-based differences, some very different specific viewpoints surface. When it comes to
making the world a better place, men around the world say that technology, democracy and language are
key ingredients. While women say that love, food, care and community are most critical.
Probably the most interesting aspects of the analysis focus on the regional differences. The top words for each of
the defined regions surface what could be perceived as the top global priorities for people in that region; or what
some would say have highest top-of-mind awareness. A few selected findings include:
Corruption in Africa
Power in North America
Sustainabilityi in Scandinavia
Religion in Middle East and
South/Southeast Asia
Nature in Western Europe and
Central/South America
Arguably, the most surprising finding of the study emerges when looking at the top three words for all
questions and all regions. In looking at the words which had the highest level of agreement across all parts of
the world, the following three words emerged in order of importance (or level of recurrence):
HELP - LIFE - CHANGE
This report represents the first of a four-month long survey process. The four global questions will remain
open until December and can be taken at www.abigproject.org/myanswers. Art and music development are
starting immediately.
Page 4
4
Introduction
In January of 2012, a group of individuals from 18 countries came together to form A Big Project. These
organizers sought to gain clarity on where people agreed the world could be better – and to share that message
in ways that could open people’s minds and hearts (through art and music). Since then the number of
countries where people are supporting the project has grown to 97.
The core group of organizers includes ten teams, one of which is the data synthesis and research team who is
responsible for the collection, analysis and reporting of the data. These individuals represent organizations
which have an expertise in data synthesis and reporting (including Big ML, and Optimus Information, Inc.).
The first part of the project which sought to gain more clarity on the places where we all agree, began on August
15th when people around the world were asked to respond to four questions:
If the world as it currently exists were to radically shift tomorrow, and we had a chance to recreate the world:
What would you NOT want to continue from this world?
What WOULD you want to continue from this world?
What could people do differently now to help us get to that better world?
What is one thing that you will commit to do differently now to help us get to that better world?
In the first month of this four-month long survey process 1274 people from 97 countries responded. This report
represents our preliminary analysis of the first month’s results.
Methods
Types of surveys
To get people to respond to the questions we offered two ways of answering, using Survey Monkey as the
technology platform. The first was to answer the questions directly, on one’s own, by going to the online survey
provided at www.abigproject.org/myanswers. The second way was to answer the four questions in groups.
One survey from each group would be then downloaded online at www.abigproject.org/answers. Surveys were
translated into 16 different languages. All surveys will continue to remain open until December 2012.
Types of outreach
Outreach to engage people in taking the survey was done through a series of strategies including: parties, social
media, personal outreach to friends and family, and street-based canvassing. The lion’s share of
communication for this initiative has been Internet-based. Note: this has meant that there is a
disproportionate number of people with high levels of access to the Internet in our sample. (See demographics
on next page.) The project hopes to partner with groups which provide access to communities without high
levels of access in the coming months.
Page 5
5
Analysis
On September 20, the surveys were analyzed to assess the results of the first month’s responses to the four
global questions. The process included:
1. Downloading all surveys from online platform
2. Translating surveys from other languages into English using machine translation*
3. Working with partners to extract, sort, and analyze data based on two levels:
a. Popularity: words that were cited most often in the responses.
b. Distinctiveness: the level of distinctiveness words had to each region (as well as level of
agreement across regions) **
4. Creation of images that best depicted data (i.e. histograms, wordles, etc.)
5. Translation of data back into all languages on website (in progress)
*It is important to note that machine translation is not ideal for many translation efforts – specifically because
machines often use literal translations and cannot always determine the context of a word in a sentence. In all
other elements of this project volunteer certified translators have been used to support translation. However,
in the case of survey data translation it is believed that machine translation is most effective because a) the
analysis focuses on a key word analysis (not concept or sentence analysis) so a literal translation of each word
is most appropriate and b) because the size of the dataset, there would be no feasible way of translating all
responses with the current capacity of volunteer translators.
We recognize that this is NOT a perfect process. We would like to acknowledge that some concepts may get lost
in translation, and encourage others in similar efforts to find ways to make this process even more accurate in
the future.
**Level of distinctiveness and agreement were determined based on the following formulas:
Suppose we have words and regions . Also define a function that gives the total
number of surveys in region and a function gives the total number of times word occurred
over all surveys from region . Given these, we can calculate a unique importance score for a word,
given a region and word :
for which the value will be more positive when the given word is used more often in the given region
than other regions and more negative otherwise.
We can also calculate an agreement score for a given word , which is simply the sum of the absolute
values of the unique importance scores over all regions:
so that a lower agreement score indicates more agreement about the importance of a word across all
regions. Note that we perform this analysis using only the top 50 words by occurrence, so that words
Page 6
6
that have very low importance across all regions are not considered, even though their agreement score
as given here would be quite high.
Graphics
The report uses graphics to explain much of the results. This is done because we believe it will make
understanding about the information easier for people from different backgrounds and because we value
graphic imagery as a method to express ideas in ways that sometimes numbers and words alone cannot.
There are three types of graphics provided: 1) ‘Worldles’ (www.wordle.net ) which present words in order of
those most recurring based on size; 2) Venn diagram – a Microsoft Word chart which helps represent areas of
distinction and areas of agreement; and 3) histograms from BigML, Inc. database (www.bigml.com) .
Histograms are interactive online and will be made available to the public soon.
Limitations of Study
Because there are always competing ideas for which countries are included in various regions, as well as which
countries are currently recognized as countries, some of our data may be specific to our organization of world
areas. See Appendix B for our breakdown of countries by region. Further, the types of people who filled out
the survey may not represent the ‘typical’ viewpoints of people from that country or region. In some cases we
only have one or a few people filling out the survey from a specific country. Because of our small sample size in
some areas, readers should not seek to generalize the results from any particular region with too much vigor.
More confidence in the data will accrue as the number of people taking the survey continue to build.
Further, because this is a primarily Internet-based initiative (using low or no-cost social media platforms and
other technologies to support global organizing efforts) there is a strong bias of respondents who have access to
the Internet. Approximately 89% of respondents had good or very good access to the Internet, which compares
to statistics which suggest only about a third of the world’s population have good access. It is important to
recognize that many people and communities without good access to the Internet often also have low access to
other key economic resources such as food and safe housing. These findings are therefore not a representative
sample of the global population in terms of economic or technology-based factors. Project leaders are making
efforts to increase representation of these populations in the coming months.
Additionally, this research report is based on an initiative seeking to gain clarity on how people feel the world
could be better, and then to share this data in ways that opens people’s hearts and minds – through art and
music. It also seeks to build buy-in and engagement around the results by inviting as many people to
participate as possible. There is a tension which exists between communicating the results with the utmost
scientific rigor while also garnering interest in the project and making the information accessible to artists,
musicians (and aspiring artists and musicians) who want to create projects based on the data. The authors
have done as best as they could in meeting all of these goals while maintaining the integrity of the data by using
scientific methods wherever feasible, and being as transparent about the process as possible.
The authors acknowledge that this report – as well as this project – is imperfect process. It is hoped that the
data support the process of communication and collaboration, rather than the outcome of it. And it is hoped
that future endeavors which seek to engage the globe in conversations will build on our work, and find
improved ways to do this work.
Page 7
7
Respondent Demographics
Number of total responses for first month’s preliminary analysis: 1274
Number countries represented in first month’s preliminary analysis: 97
Number of responses by Regionii
Age of Respondents
Access to Technology Gender
129 8
119
78
93
177
13
374
100
179
Africa
Australia & Oceania
Central & South America
South & Southeast Asia
Eastern & Central Europe
Western Europe
East Asia
Scandanavia
Middle East
North America
0.87% 3.35% 2.48%
9.07%
31.18%
17.02%
11.30%
11.30%
8.20%
3.73% 1.24% 1 - 10
11 - 15
16 - 19
20 - 29
30 - 39
40 - 49
50 - 59
60 - 69
61.44%
27.62%
7.79% 2.07% 1.09%
Excellent
Good
Fair
Poor
Very Poor
50.51% 49.23%
0.26%
Female
Male
Transgender
Page 8
8
Findings
These findings are broken down into three sections. Responses based on survey questions, responses
based on region, and responses based on gender.
Responses based on survey questions
These responses represent the answers to each of the four survey questions across all world regions. In the
representation below, the words are graphically represented in proportion to the number of times they were
mentioned. For example ‘WAR’ came up as the leading response to what NOT to continue in this world.
Following ‘WAR’ in number of responses were ‘CORRUPTION’ and ‘POVERTY’.
The words represented in these graphic representations include those which registered as most highly
reoccurring. However, some words may not represent the full context in which they were intendediii.
If the world as it currently exists were to radically shift tomorrow, and we had an opportunity to
recreate the world…
Question 1: What would you NOT want to continue from this world?
Top 10 responses across all regions for question #1 include: war poverty
corruption money violence
weapons religion
power pollution greed
Page 9
9
Question #2: What WOULD you want to continue from this world?
Top 10 responses across all regions for question #2 include: love peace nature education culture
music art technology diversity freedom
Question #3: What do people need to do differently now to get to that world?
Top 10 responses across all regions for question #3 include: respect
change education live learn
love
care understand nature life
Page 10
10
Question #4: What is one thing you will do differently now to get to that better world?
Top 10 responses across all regions for question #4 include: try
change live help love
day
educate time life projects
Page 11
11
Responses Based on Region
Below represents findings base on the most popular words which emerged when combining the answers
to all four questions. The content in the outer circles are based on the words that came up most often
within a region, and were most distinct to that region. The words which appear in the middle represent
the words which reoccurred consistently at high levels across all regions - what this project terms the
“Sweet Spot”.
* Words are presented in order of popularity/recurrence in the dataset.
Note on regional representation:
Australia/Oceania and East Asia regions were not analyzed for this section due to low sample size.
Scandinavia was separated from Western Europe because of a disproportionally high sample size, and
its uniqueness of cultural practices relative to the rest of the region.
Page 12
12
Responses Based on Gender
The data were sorted to determine trends by gender. Some words came up at high levels for one
gender, and low levels for the opposite gender.
Words reported at high levels by men, and low levels by women:
Technology
Language
Democracy
Words reported at high levels by women, and low levels by men:
Love
Food
Care
Community
An interactive version of these histograms at BigML will be made public soon at www.bigml.com.
Page 13
13
Trend Analysis
Much of the findings in this report confirm what many already believed about what a better world might
look like. If we had the opportunity to recreate the world, most people would NOT want to continue
things like war, poverty, and corruption. People would want to continue love, peace, and nature.
But when looking deeper into what people would continue into a new better world, a few more
interesting ideas emerge. Included in the top ten things that people would like to continue from this
world are: technology, music, art, culture, education, diversity and freedom.
When looking at gender-based differences, some specific viewpoints surface. When it comes to making
the world a better place, men around the world say that technology, democracy and language are
key ingredients. While women say that love, food, care and community are most critical.
Probably the most interesting aspects of the analysis focus on the regional differences. The top words for
each of the defined regions surface what could be perceived as the top global priorities for people in that
region; or what some would say have highest top-of-mind awareness. These, of course, do not represent
the entire region’s perspective – but might be able to provide a light on some of the things that people in
the region view as important. A few selected findings include:
Corruption in Africa
Power in North America
Sustainability in Scandinavia
Religion in the Middle East and South Asia
Nature in South America
Animals in Western Europe
Money in Eastern Europe
Arguably, the most surprising finding of the study emerges when looking at the top three words for all
questions and all regions. This was the most critical component of the study thus far – as it represents the
project’s “Sweet Spot” – the place where all of our ideas for a better world connect. This is the space where
artists and musicians around the globe will seek to create projects to inspire a better world on December
20th (the day before the Mayan calendar predicts a change in our current way of living, to a more humane
society). In looking at the words which had the highest level of agreement across all parts of the world, the
following three words emerged in order of importance (or level of recurrence in the dataset):
HELP
LIFE
CHANGE
From a research standpoint, these words represent a set of words, which would most accurately be viewed as
independent of one another. However, when the three words are read in order as a sentence, there is a
sentiment that exists which is well-aligned with the goals of the project. Some might consider these words
emerging in this particular order as a coincidence, while others might believe it could represent the
collective consciousness of people from around the world. There is no scientific data to support or deny
Page 14
14
either claim. However, it will be interesting to note the interpretation of the results through the creative
aspects of the project (through art and music) and the additional results which will emerge in the coming
months as more people continue to take the survey.
Final comments
The four global questions survey will remain open until December and can be taken at
www.abigproject.org/myanswers. The results may change based on new survey responses. A second report
is scheduled for November 2012 and final results of all findings will be announced on December 20, 2012.
The creation of art and music to help express the key themes from these findings is beginning immediately,
and will culminate on December 20, 2012. For more information go to www.abigproject.org.
Page 15
15
APPENDIX
Appendix A
WORDS OMMITTED IN THE ANALYSIS
There were a number of words which were omitted from the analysis based on the following criteria:
• Small words/Stop words: “A” “The” etc.
• Words that repeat parts of the four questions asked (i.e. “World” “People” “Continue” “Create”)
• Words that have little value on their own for conceptual purposes: (i.e.“Stop” “Start”)
• Words that have double meanings that would confuse concept: (i.e. “Own” - my own sense of community vs. I want to own more property.)
• Words that were registered in dataset which are not actual words in the English language (i.e. “Don”)
The following represents the full list of words omitted from the analysis:
World, Continue, Shift, Create, Commit, Stop, Start, People, , Don, Own, Human, Better, Person
Page 16
16
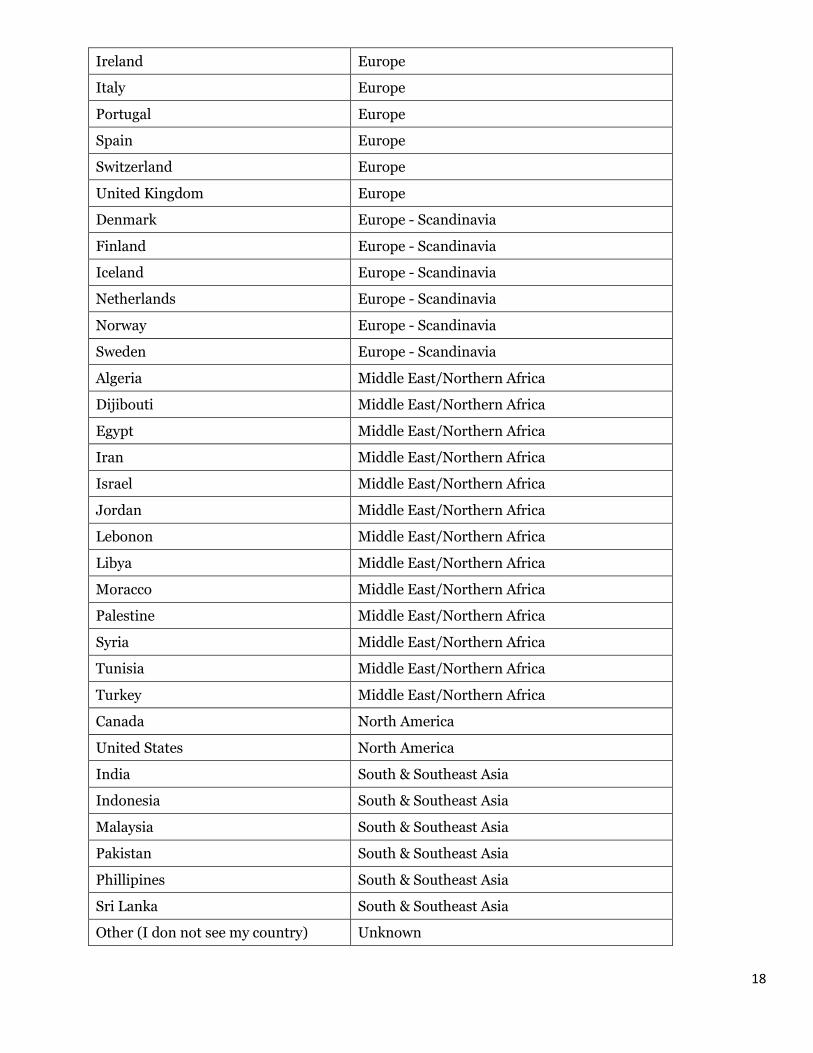
Appendix B
Countries Alphabetically and Corresponding Region*
Country Region
Burundi Africa (Sub-saharan)
Cameroon Africa (Sub-saharan)
Cote d'Ivoire Africa (Sub-saharan)
DRCongo Africa (Sub-saharan)
Eritrea Africa (Sub-saharan)
Ethiopia Africa (Sub-saharan)
Gambia Africa (Sub-saharan)
Ghana Africa (Sub-saharan)
Guinea Africa (Sub-saharan)
Kenya Africa (Sub-saharan)
Liberia Africa (Sub-saharan)
Malawi Africa (Sub-saharan)
Mauritius Africa (Sub-saharan)
Mozambique Africa (Sub-saharan)
Nigeria Africa (Sub-saharan)
Rwanda Africa (Sub-saharan)
Sierra Leone Africa (Sub-saharan)
Somalia Africa (Sub-saharan)
South Africa Africa (Sub-saharan)
Tanzania Africa (Sub-saharan)
Uganda Africa (Sub-saharan)
Zimbabwe Africa (Sub-saharan)
Australia Australia & Oceania
Kiribati Australia & Oceania
New Zealand Australia & Oceania
Argentina Central & South America
Bolivia Central & South America
Brazil Central & South America
Chile Central & South America
Page 17
17
Columbia Central & South America
Dominican Republic Central & South America
Guatemala Central & South America
Guyana Central & South America
Honduras Central & South America
Mexico Central & South America
Nicaragua Central & South America
Suriname Central & South America
Venezuala Central & South America
Cambodia East Asia
China East Asia
Japan East Asia
Laos East Asia
South Korea East Asia
Vietnam East Asia
Armenia Eastern & Central Europe
Bosnia Eastern & Central Europe
Bulgaria Eastern & Central Europe
Croatia Eastern & Central Europe
Georgia Eastern & Central Europe
Hungary Eastern & Central Europe
Kazakhstan Eastern & Central Europe
Lithuania Eastern & Central Europe
Poland Eastern & Central Europe
Romania Eastern & Central Europe
Russia Eastern & Central Europe
Serbia Eastern & Central Europe
Slovakia Eastern & Central Europe
Slovenia Eastern & Central Europe
Ukrain Eastern & Central Europe
Belgium Europe
France Europe
Germany Europe
Greece Europe
Page 18
18
Ireland Europe
Italy Europe
Portugal Europe
Spain Europe
Switzerland Europe
United Kingdom Europe
Denmark Europe - Scandinavia
Finland Europe - Scandinavia
Iceland Europe - Scandinavia
Netherlands Europe - Scandinavia
Norway Europe - Scandinavia
Sweden Europe - Scandinavia
Algeria Middle East/Northern Africa
Dijibouti Middle East/Northern Africa
Egypt Middle East/Northern Africa
Iran Middle East/Northern Africa
Israel Middle East/Northern Africa
Jordan Middle East/Northern Africa
Lebonon Middle East/Northern Africa
Libya Middle East/Northern Africa
Moracco Middle East/Northern Africa
Palestine Middle East/Northern Africa
Syria Middle East/Northern Africa
Tunisia Middle East/Northern Africa
Turkey Middle East/Northern Africa
Canada North America
United States North America
India South & Southeast Asia
Indonesia South & Southeast Asia
Malaysia South & Southeast Asia
Pakistan South & Southeast Asia
Phillipines South & Southeast Asia
Sri Lanka South & Southeast Asia
Other (I don not see my country) Unknown
Page 19
19
*We recognize that there are some arguments about which regions countries belong to. We did our best
to honor these arguments, while still seeking to ensure that countries were included in regions which
best matched with their cultural, geographic and historical perspectives. We acknowledge these lines
are blurry sometimes and this is an imperfect process.
End Notes
i The word that came up was ‘sustainable’. The word was modified to ‘sustainability’ to make the concept easier to understand.
ii See Appendix B for list countries by region. (Note, 1 person suggested their country as “not listed” which is why figures for country are 1 survey short of total number of responses.) iii In the graphic for Question #1, some responses received were phrased as double-negatives. This led to some words occurring often
which had a different or opposite context. For example: if two people responded that they would NOT want to continue “lack of access
to education” and “poor education facilities”, the word “education” would come up as most highly recurring.