| June 2016 “Here Come the Sun” with Its Quality-Adjusted Price Index Tat Unbundling Tarek M. Harchaoui 1 and Niek Scholze 2 1 Department of Economics & Management Groningen Growth & Development Centre University of Groningen 2 Rotterdam School of Management Erasmus University February 2017 1
Transcript
|June 2016
“Here Come the Sun” with Its Quality-Adjusted Price Index
Tat UnbundlingTarek M. Harchaoui1 and Niek Scholze2
1Department of Economics & ManagementGroningen Growth & Development Centre
University of Groningen
2Rotterdam School of ManagementErasmus University
February 2017
1
|June 2016
Motivation2
• Major churning in this business:
Entry of new and highly dynamic firms Industry highly competitive
• Food for thought for industrial organization economists
|June 2016
Motivation3
• Rapid decline in prices related to technical change
|June 2016
Motivation• Merit of Krugman’s article is to bring to the fore some
ideas that have been reasonably well-established amongst engineers and scientists in solar energy Bowden et al. (2010); Naam (2011); Hutchby (2014)
• Moore’s law equivalent seems to be happening in the solar panel manufacturing business
• Somewhat similar to the semiconductors/micro processor chips
4
|June 2016
Motivation• The evidence from the “ground” seems to be
supportive:
• Crude numbers point to fundamental changes which potentially huge impact on the economy
5
Price ($/watt)
Power (watts)
Size (inches)
Conversion factor (%)
1953≥ 2015
1,7850.70
230230
230×13041×25
4.523.5
|June 2016
Scope of the Paper• Construct a quality-adjusted price index for solar
panels Quantify whether green energy has the potential of
generating new sources of economic growth—bring numerical estimates where before there had been none
─ Better understanding of the dynamics of pricing in the business of manufacturing of solar panels
6
|June 2016
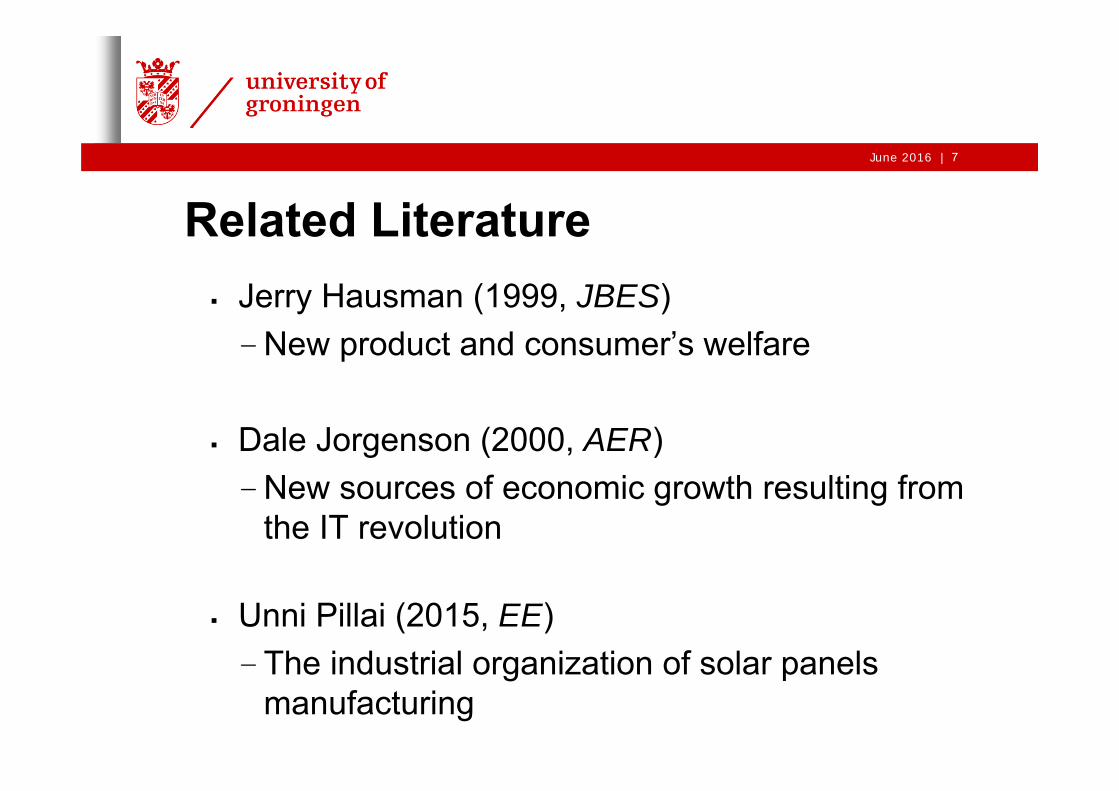
Related Literature Jerry Hausman (1999, JBES)
- New product and consumer’s welfare
Dale Jorgenson (2000, AER)- New sources of economic growth resulting from
the IT revolution
Unni Pillai (2015, EE)- The industrial organization of solar panels
manufacturing
7
|June 2016
Remainder of the Presentation Background information on the industry Framework Source data and broad trends on the industry Empirical results Concluding remarks
8
|June 2016
Milestones in the Development of the Solar Panel Business• 1950s: Development of the blueprints for photovoltaic
cells at Bell Labs• 1960s: Non commercial applications propelled forward
by the space race• 1970s: Commercial applications started with the first
oil shock:• First manufacturers were conglomerates:
• IT sector: Texas instruments, RCA and Sharp• Oil sector: Exxon → Solar Power
ARCO → Solar Technology
9
|June 2016
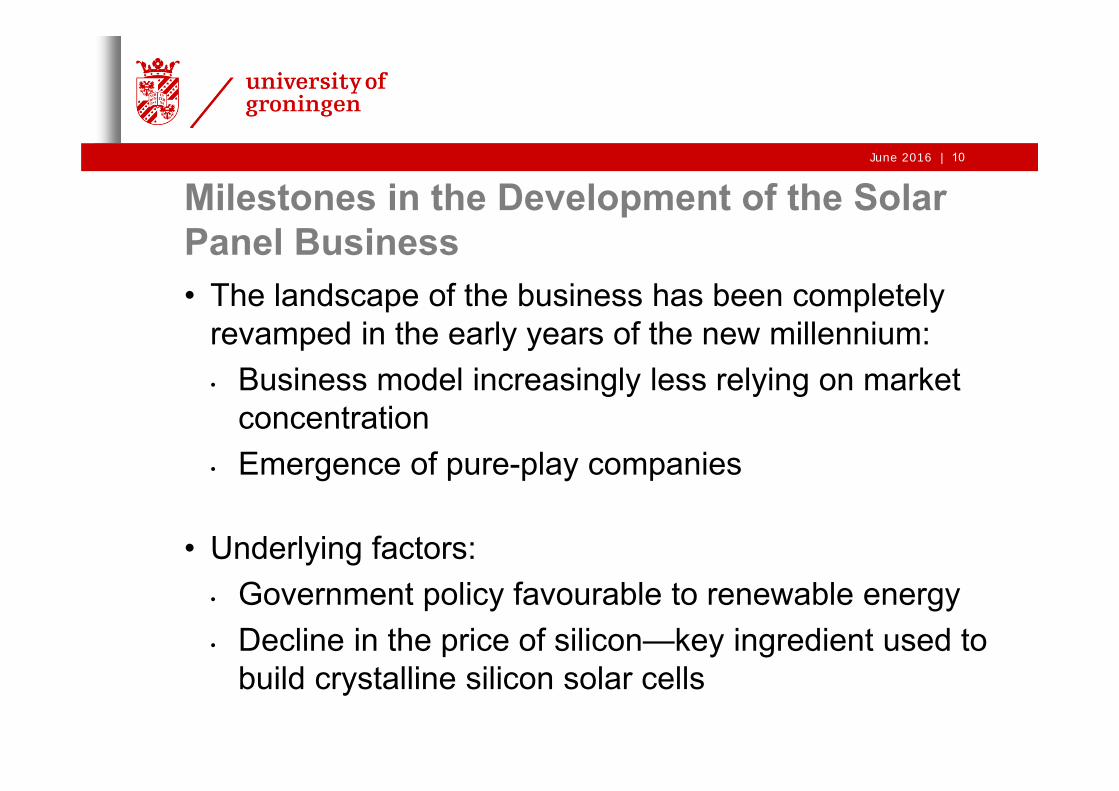
Milestones in the Development of the Solar Panel Business• The landscape of the business has been completely
revamped in the early years of the new millennium:• Business model increasingly less relying on market
concentration• Emergence of pure-play companies
• Underlying factors:• Government policy favourable to renewable energy• Decline in the price of silicon—key ingredient used to
build crystalline silicon solar cells
10
|June 2016 11
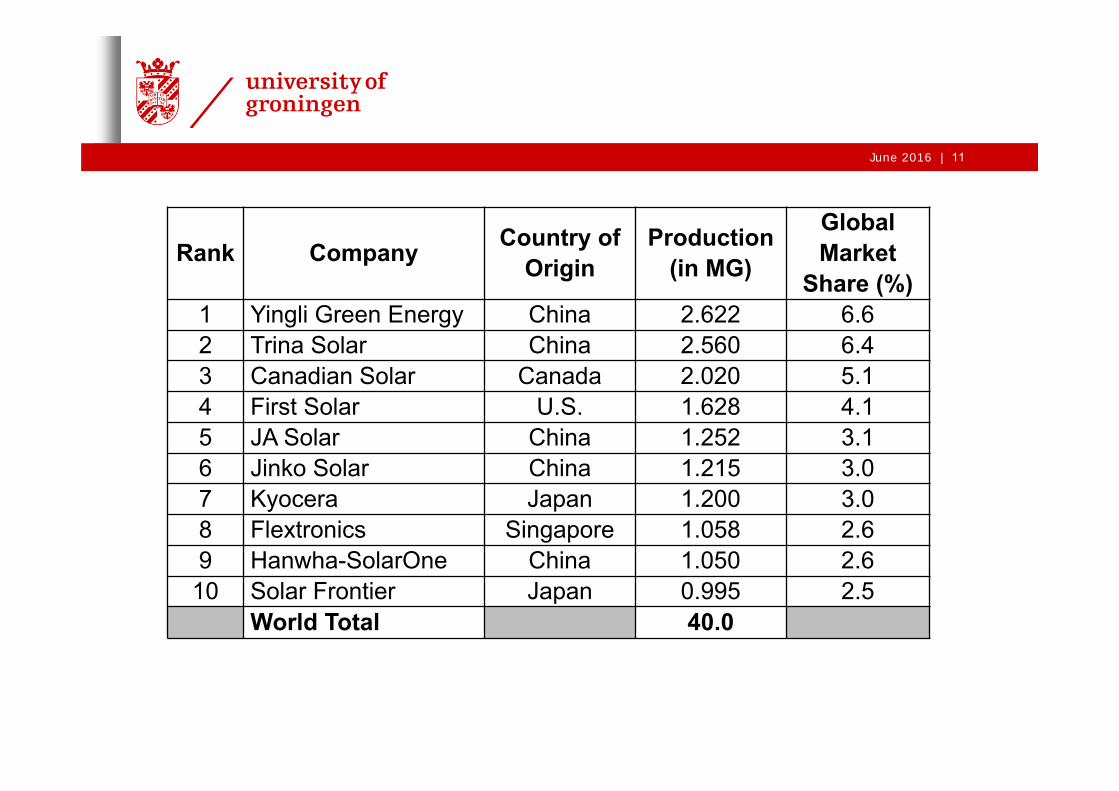
Rank Company Country of Origin
Production (in MG)
Global Market
Share (%)1 Yingli Green Energy China 2.622 6.62 Trina Solar China 2.560 6.43 Canadian Solar Canada 2.020 5.14 First Solar U.S. 1.628 4.15 JA Solar China 1.252 3.16 Jinko Solar China 1.215 3.07 Kyocera Japan 1.200 3.08 Flextronics Singapore 1.058 2.69 Hanwha-SolarOne China 1.050 2.6
10 Solar Frontier Japan 0.995 2.5World Total 40.0
|June 2016
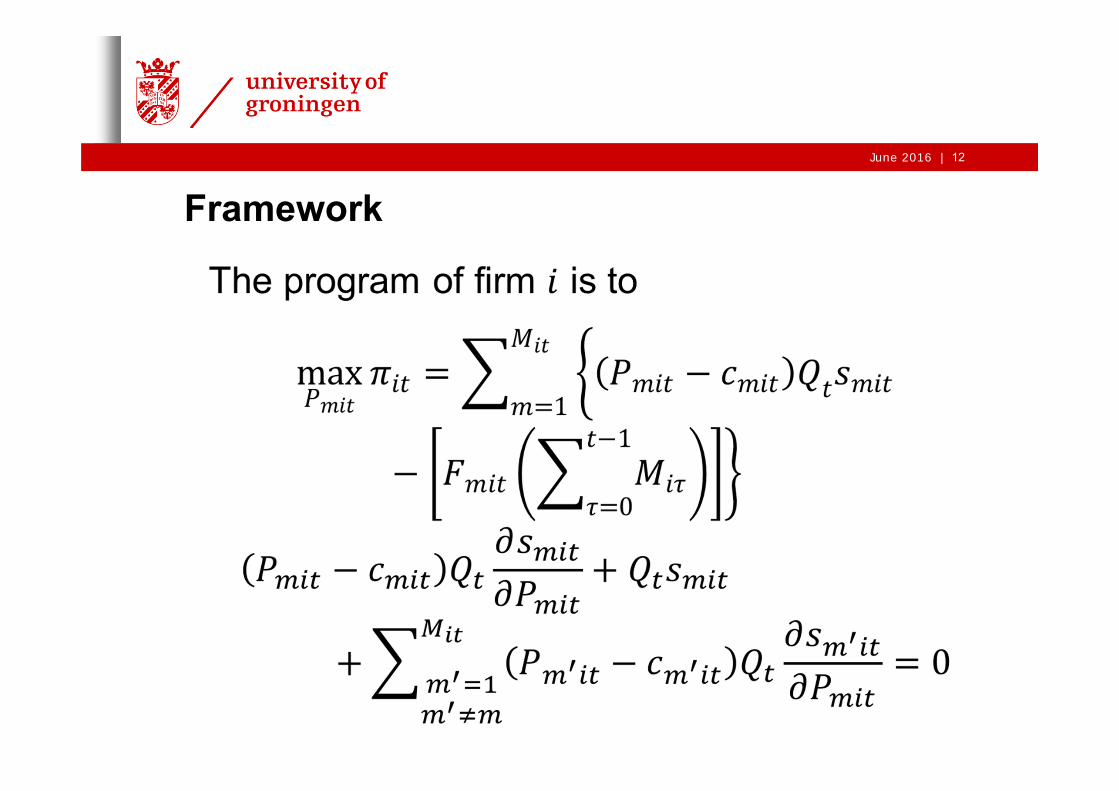
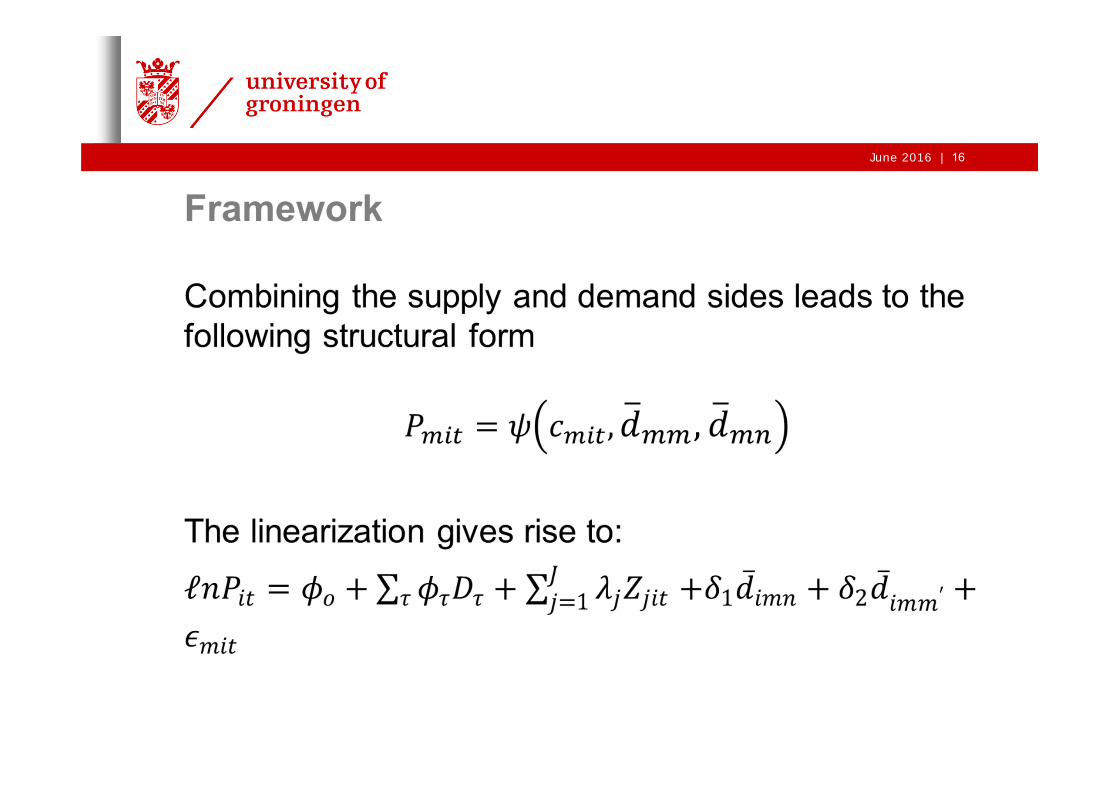
Framework 12
|June 2016
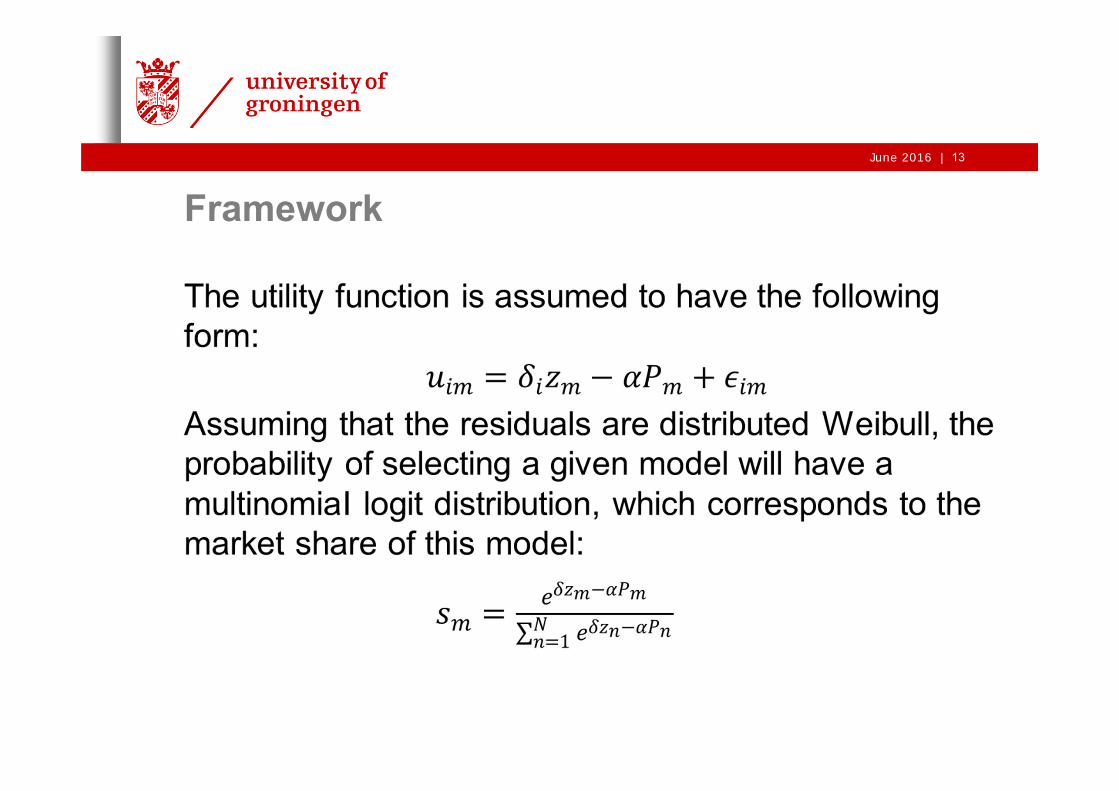
Framework 13
|June 2016
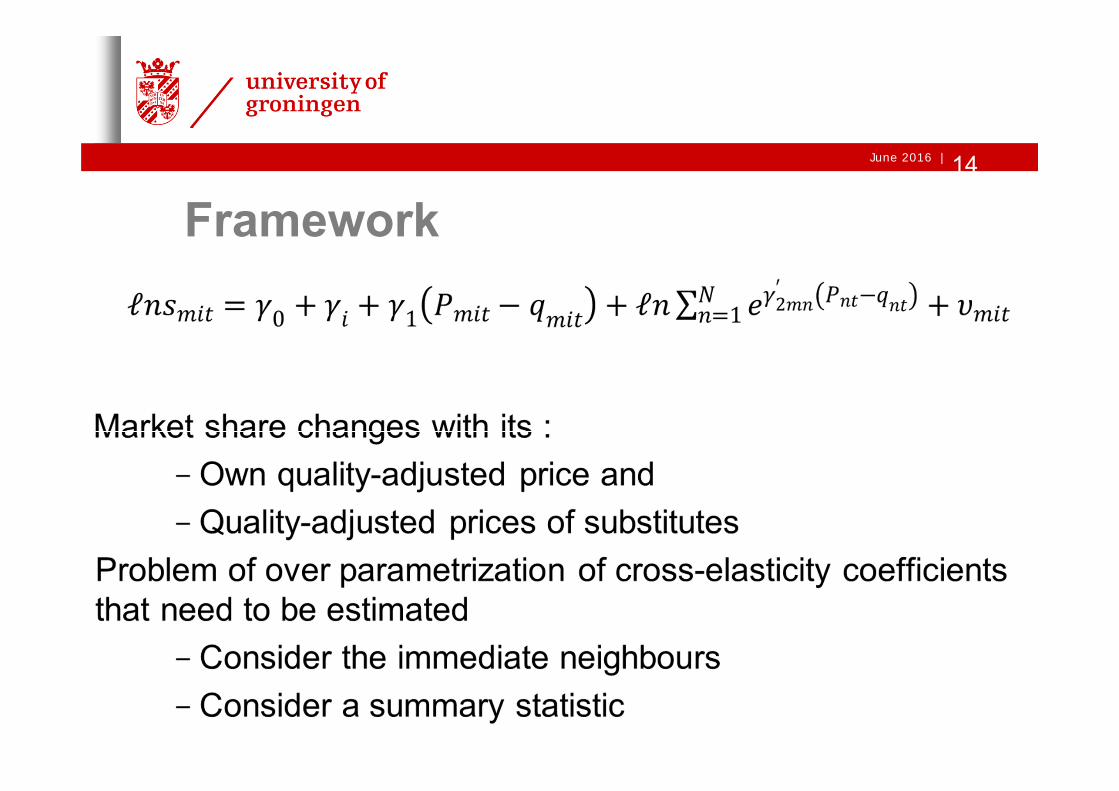
Framework14
|June 2016
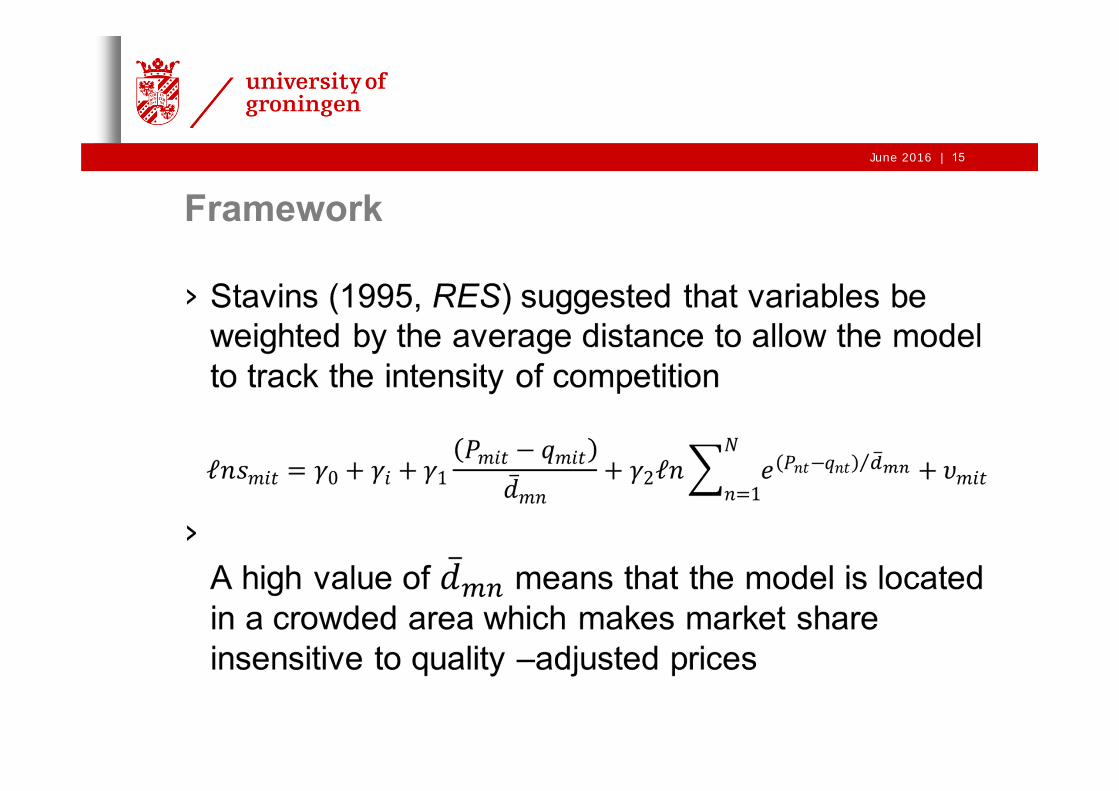
Framework 15
|June 2016
Framework 16
|June 2016
Source Data• Built from scratch with a combination of financial
statements and information on solar panels
• Financial statements:• Data on cost of goods sold, mark-ups, volume of solar
panels produced• This has made possible to construct unit cost, which
combined with the mark-up, led to the direct estimate of the average price
• These data have been compiled for 16 manufacturers over the 2004-13 period
17
|June 2016
Source Data• Photon database:
• Technical performance (efficiency of the panel)• Reliability (years of product warranty) • Size• Vintage
+ Silicon prices
• Of the 2,723 considered only 831 offered a full suite of characteristics. The rest has been dropped
• The next step was to map this information on characteristics with that on prices.
18
|June 2016
Source Data• The two sets of information were matched:
• The information on characteristics had to be aggregated using a geometric mean, an approach widely used by official statistics in the absence of adequate weights
• The aggregation of characteristics were brought to the level where they match the calculated price