26
| Date post: | 13-Apr-2018 |
| Category: |
Documents |
| Upload: | chinmay-mohapatra |
| View: | 221 times |
| Download: | 0 times |
7/27/2019 Heromotorsfinal Fra
http://slidepdf.com/reader/full/heromotorsfinal-fra 1/26
7/27/2019 Heromotorsfinal Fra
http://slidepdf.com/reader/full/heromotorsfinal-fra 2/26
INTRODUCTION
Hero Motors Ltd. is the world's largest manufacturer of two
wheelers, based in India.
The company was a joint venture between India's Hero
Group and Honda Motor Company, Japan that began in 1984
later in 2011 it turn into Hero Motors Limited.
In 2001, the company achieved the coveted position of
being the largest two-wheeler manufacturing company in India
and the “World No.1” two-wheeler company in terms of unit
volume sales in a calendar year by a single company. Herohas retained that coveted position till date.
Today, every second motorcycle sold in the country is a
Hero Honda bike. Every 30 seconds, someone in India buys
Hero splendor which is India‟s selling motor cycle.
7/27/2019 Heromotorsfinal Fra
http://slidepdf.com/reader/full/heromotorsfinal-fra 3/26
ABOUT HERO MOTORS LTD
VISION:
The HERO story began with a simple vision- the vision of a mobile and
an empowered India, powered by Hero. This vision was driven by
Hero‟s commitment to customer, quality and excellence, and while doing
so, maintaining the highest standard of ethics and social respnsibilities.
Hero believes that the fastest way to turn that dream to reality is by
remaining focused on that vision.
STRATEGY:
Hero key strategy has been driven by innovation in every sphere of
activity- building a robost product portfolio across categories, exploringnew markets, aggresively expanding the network and continuing to
invest inbrand building activities.
7/27/2019 Heromotorsfinal Fra
http://slidepdf.com/reader/full/heromotorsfinal-fra 4/26
ABOUT HERO MOTORS LTD
Manufacturing:
Hero Honda bikes are manufactured across three globally benchmarked
manufacturing facilities. Two of these are based at Gurgaon and
Dharuhera which are located in the state of Haryana in northern India.
The third and the latest manufacturing plant is based at Haridwar, in thehill state of Uttarakhand.
Technology:
In the 1980s Hero pioneered the introduction of fuel-efficient,
environment friendly four-stroke motorcycles in the country. Today Hero
continues to be technology pioneer. It became the first company tolaunch the Fuel Injection (FI) technology in Indian motorcycles, with the
launch of the Glamour FI in June2006
7/27/2019 Heromotorsfinal Fra
http://slidepdf.com/reader/full/heromotorsfinal-fra 5/26
ABOUT HERO MOTORS LTD
Products:
Hero product range includes variety of motor cycles that have set the
industry standards across all the market segments. The company
also started manufacturing scooter in2006.Hero offers large no. of
products and caters to wide variety of requirements across allthe segments.
Distribution:
The company's growth in the two wheeler market in India is the result of
an intrinsic ability to increase reach in new geographies and growth
markets. Hero extensive sales and service network now spans closeto 4500 customer touch points. These comprise a mix of authorized
dealerships, Service& Spare Parts outlets, and dealer-appointed outlets
across the country.
7/27/2019 Heromotorsfinal Fra
http://slidepdf.com/reader/full/heromotorsfinal-fra 6/26
Current TrendHero MotoCorp Ltd (HMCL), the world‟s largest two-wheeler
manufacturer, today reported sales of 4,84,217 units of two-wheelers in
the month of July 2012. HMCL had sold 4,91,036 units in the corresponding month last year.
Mr. Anil Dua, Senior Vice-President (Marketing & Sales), Hero MotoCorp
Ltd said, “The two-wheeler industry in the country has been experiencing
sluggish growth for past few months.
We are strengthening our brand and saliency in midst of a challengingenvironment where a patchy monsoon, rising petrol prices and high
interest rates have been affecting retail sales in both rural and urban
markets.
Our brand and models are salient on the current bilateral cricket series
and Olympics. We continue to launch new models, air new campaigns and expand our
network as we look forward to the commencement of the festive season
with cautious optimism.” .
7/27/2019 Heromotorsfinal Fra
http://slidepdf.com/reader/full/heromotorsfinal-fra 7/26
Current Trend :
HMCL recently announced its best-ever turnover (Net Sales & OtherOperating income) of Rs. 6247.28 crores for the first quarter (April-June
2012) of FY‟13.
The company‟s profit before tax for the period stood at Rs 734.88
crore, while profit after tax (PAT) for the period stood at Rs 615.46
crores.
The Company has recorded an EBIDTA margin of 15 per cent. Hero
MotoCorp registered its highest ever quarterly sales of 16,42,292 two-
wheelers in the first quarter this fiscal, fuelled by two consecutive
months of highest-ever monthly sales witnessed by the company in the
months of April (5,51,557) and May (5,56,644).
Hero MotoCorp has strengthened its presence in the deluxe segment
with the launch of its new 125cc motorcycle – Hero “Ignitor ”.
The sporty looking „Ignitor ‟ is loaded with impressive features and is
attractively priced at Rs. 55,900/- for the drum-self-cast variant and Rs
57,900/- for the disc-self-cast variant.
7/27/2019 Heromotorsfinal Fra
http://slidepdf.com/reader/full/heromotorsfinal-fra 8/26
Why Annual Report is important??
One wants to know how well the company is doing , how well it is
upcoming changes projected for the next year, and about the
management staff of the company.
One want to find out whether the company is making more money than
it is spending.
One want to get an idea of management‟s strategic plan for the coming
year.
Shareholders can use the annual report to make important decisions.
7/27/2019 Heromotorsfinal Fra
http://slidepdf.com/reader/full/heromotorsfinal-fra 9/26
What is a Director Report ? Why is it important ?
It is obligatory on the part of the directors to make out and attach to everybalance sheet laid before company in general meeting, a report known as
“directors report”.
The report is intended to report, to all interested stakeholders, the
directors' explanations and interpretations of the profit/loss, the state ofaffairs of the group and any other matters which may be material for the
stakeholders' attention.
7/27/2019 Heromotorsfinal Fra
http://slidepdf.com/reader/full/heromotorsfinal-fra 10/26
Why is Auditor appointed ? What is an Auditor’s report ?
Auditors are appointed to certify whether the financialstatements reflects a true and fair view of an entity or not.
Auditors provide an independent opinion.
The auditor‟s report is a means by which the auditor
communicates the findings of his examination to the readers
of financial statements viz.. Shareholders, creditors, financial
institutions and all others who have a stake in the company or
wish to acquire a stake with the company
7/27/2019 Heromotorsfinal Fra
http://slidepdf.com/reader/full/heromotorsfinal-fra 11/26
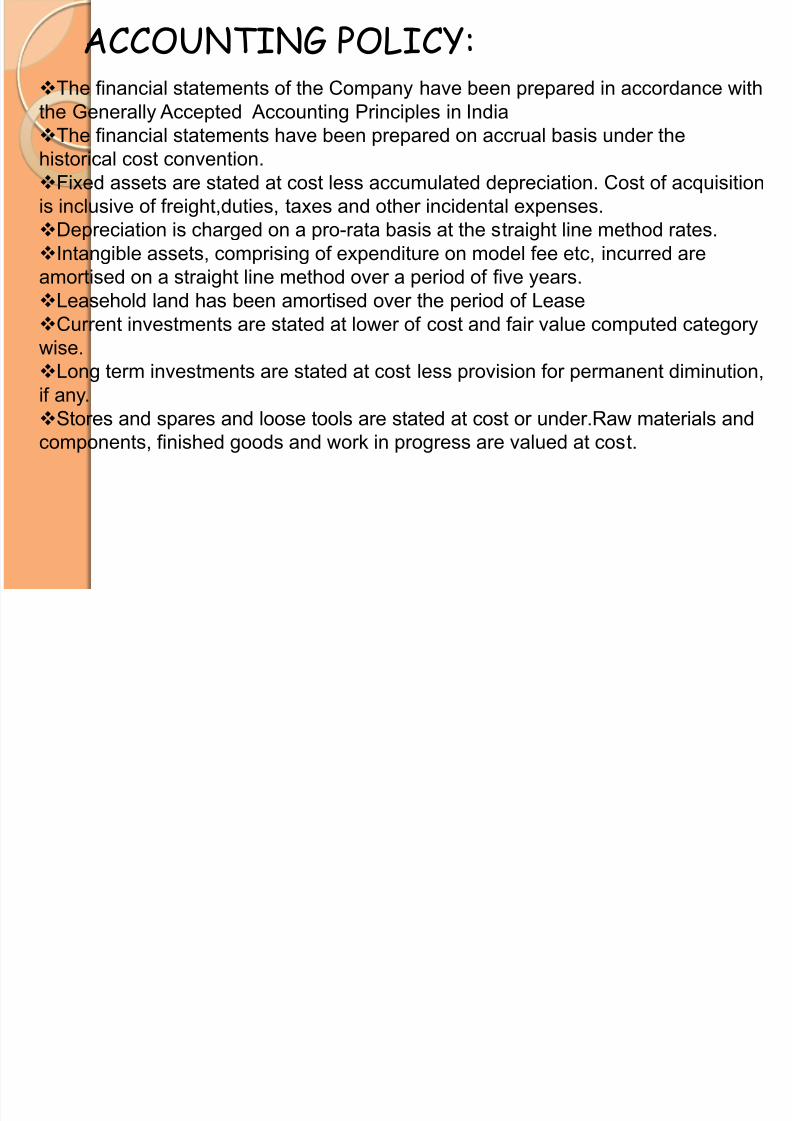
ACCOUNTING POLICY:The financial statements of the Company have been prepared in accordance with
the Generally Accepted Accounting Principles in India
The financial statements have been prepared on accrual basis under thehistorical cost convention.
Fixed assets are stated at cost less accumulated depreciation. Cost of acquisition
is inclusive of freight,duties, taxes and other incidental expenses.
Depreciation is charged on a pro-rata basis at the straight line method rates.
Intangible assets, comprising of expenditure on model fee etc, incurred are
amortised on a straight line method over a period of five years.Leasehold land has been amortised over the period of Lease
Current investments are stated at lower of cost and fair value computed category
wise.
Long term investments are stated at cost less provision for permanent diminution,
if any.
Stores and spares and loose tools are stated at cost or under.Raw materials andcomponents, finished goods and work in progress are valued at cost.
7/27/2019 Heromotorsfinal Fra
http://slidepdf.com/reader/full/heromotorsfinal-fra 12/26
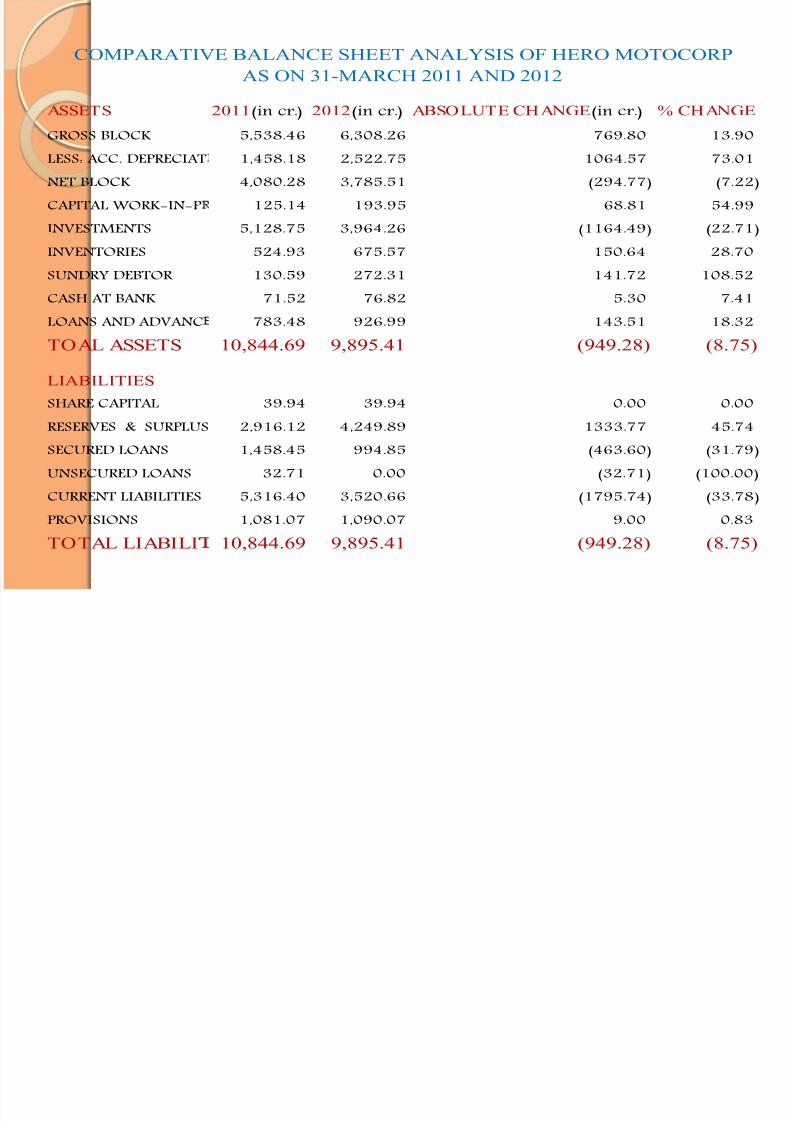
ASSETS 2011(in cr.) 2012(in cr.) ABSOLUTE CHANGE(in cr.) % CHANGE
GROSS BLOCK 5,538.46 6,308.26 769.80 13.90LESS: ACC. DEPRECIAT 1,458.18 2,522.75 1064.57 73.01
NET BLOCK 4,080.28 3,785.51 (294.77) (7.22)
CAPITAL WORK-IN-P 125.14 193.95 68.81 54.99
INVESTMENTS 5,128.75 3,964.26 (1164.49) (22.71)
INVENTORIES 524.93 675.57 150.64 28.70
SUNDRY DEBTOR 130.59 272.31 141.72 108.52CASH AT BANK 71.52 76.82 5.30 7.41
LOANS AND ADVANC 783.48 926.99 143.51 18.32
TOAL ASSETS 10,844.69 9,895.41 (949.28) (8.75)
LIABILITIES
SHARE CAPITAL 39.94 39.94 0.00 0.00
RESERVES & SURPLUS 2,916.12 4,249.89 1333.77 45.74
SECURED LOANS 1,458.45 994.85 (463.60) (31.79)
UNSECURED LOANS 32.71 0.00 (32.71) (100.00)
CURRENT LIABILITIES 5,316.40 3,520.66 (1795.74) (33.78)
PROVISIONS 1,081.07 1,090.07 9.00 0.83
TOTAL LIABILI 10,844.69 9,895.41 (949.28) (8.75)
COMPARATIVE BALANCE SHEET ANALYSIS OF HERO MOTOCORP
AS ON 31-MARCH 2011 AND 2012
7/27/2019 Heromotorsfinal Fra
http://slidepdf.com/reader/full/heromotorsfinal-fra 13/26
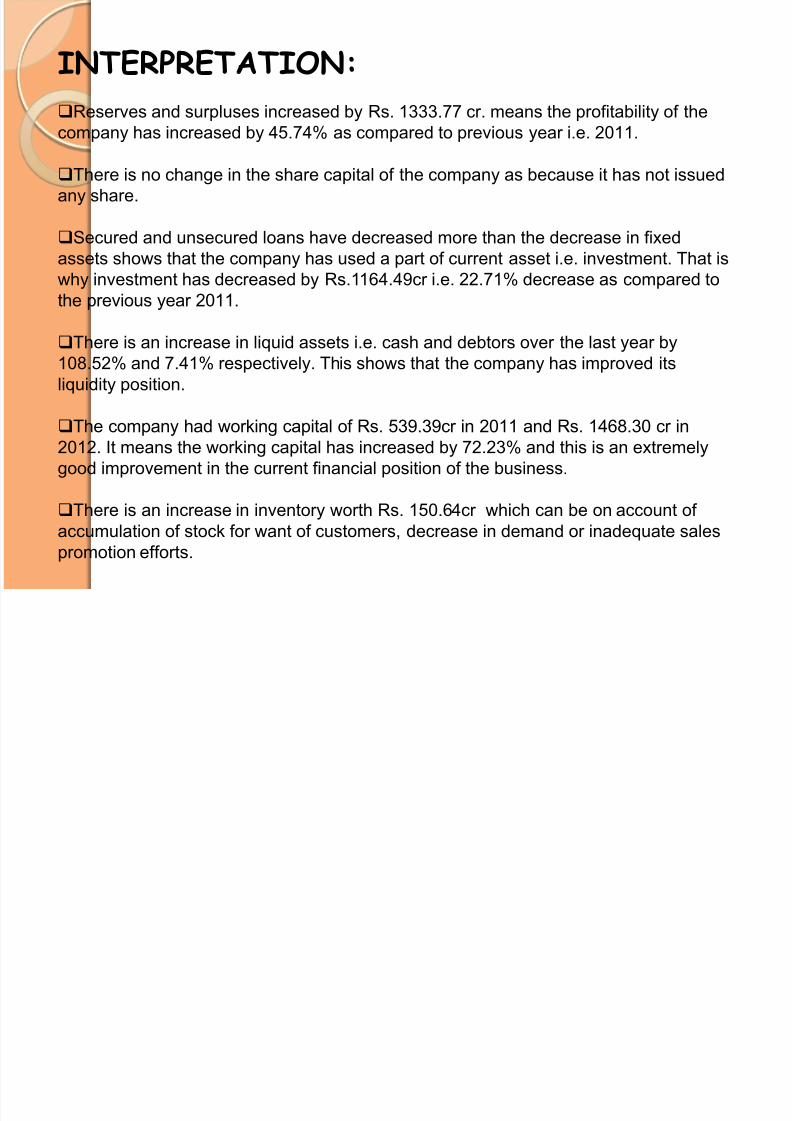
INTERPRETATION:
Reserves and surpluses increased by Rs. 1333.77 cr. means the profitability of the
company has increased by 45.74% as compared to previous year i.e. 2011.
There is no change in the share capital of the company as because it has not issued
any share.
Secured and unsecured loans have decreased more than the decrease in fixed
assets shows that the company has used a part of current asset i.e. investment. That is
why investment has decreased by Rs.1164.49cr i.e. 22.71% decrease as compared tothe previous year 2011.
There is an increase in liquid assets i.e. cash and debtors over the last year by
108.52% and 7.41% respectively. This shows that the company has improved its
liquidity position.
The company had working capital of Rs. 539.39cr in 2011 and Rs. 1468.30 cr in
2012. It means the working capital has increased by 72.23% and this is an extremely
good improvement in the current financial position of the business.
There is an increase in inventory worth Rs. 150.64cr which can be on account of
accumulation of stock for want of customers, decrease in demand or inadequate sales
promotion efforts.
7/27/2019 Heromotorsfinal Fra
http://slidepdf.com/reader/full/heromotorsfinal-fra 14/26
7/27/2019 Heromotorsfinal Fra
http://slidepdf.com/reader/full/heromotorsfinal-fra 15/26
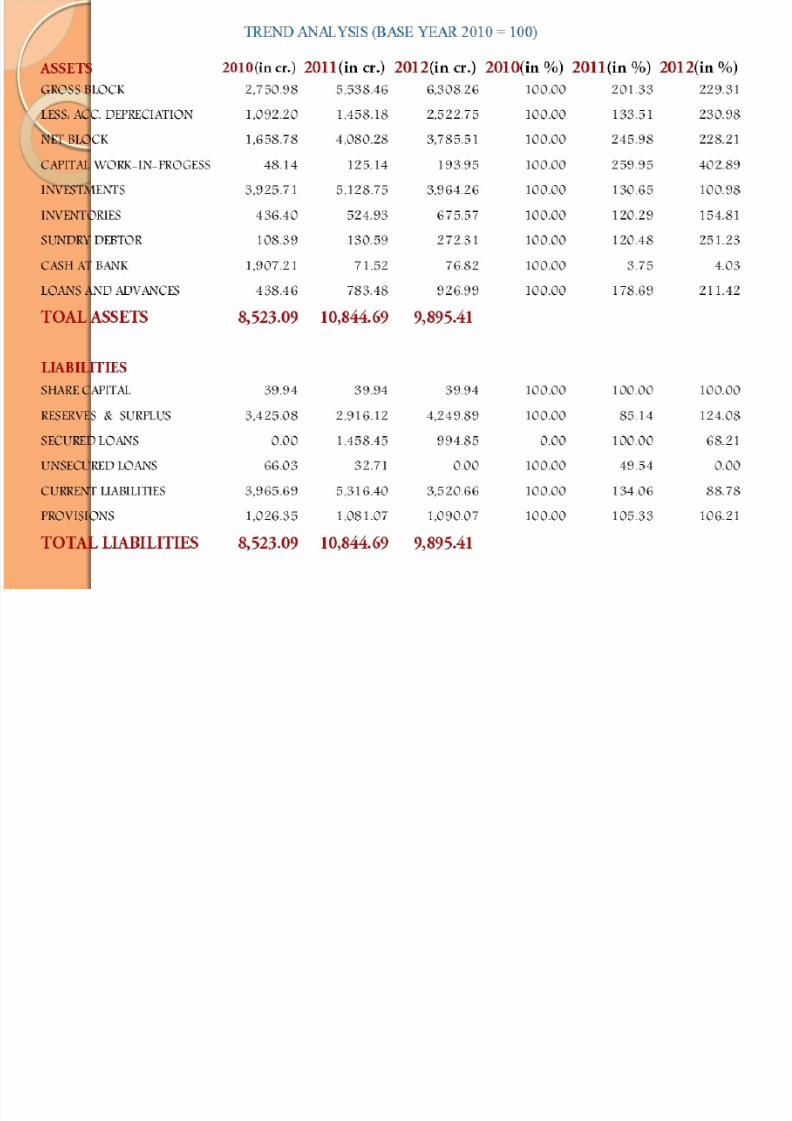
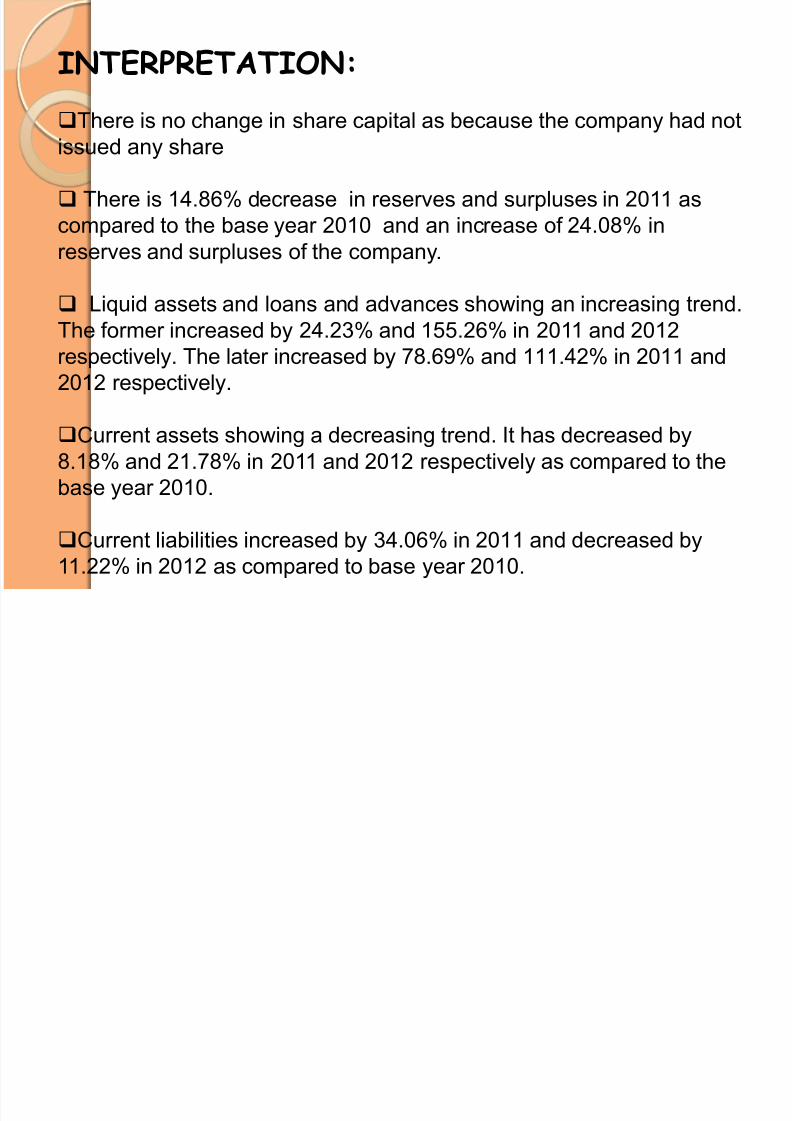
INTERPRETATION:
There is no change in share capital as because the company had not
issued any share
There is 14.86% decrease in reserves and surpluses in 2011 as
compared to the base year 2010 and an increase of 24.08% in
reserves and surpluses of the company.
Liquid assets and loans and advances showing an increasing trend.
The former increased by 24.23% and 155.26% in 2011 and 2012
respectively. The later increased by 78.69% and 111.42% in 2011 and
2012 respectively.
Current assets showing a decreasing trend. It has decreased by
8.18% and 21.78% in 2011 and 2012 respectively as compared to the
base year 2010.
Current liabilities increased by 34.06% in 2011 and decreased by
11.22% in 2012 as compared to base year 2010.
7/27/2019 Heromotorsfinal Fra
http://slidepdf.com/reader/full/heromotorsfinal-fra 16/26
ASSETS 2011(in cr.) % TOTAL 2012(in cr.) % TOTAL
GROSS BLOCK 5,538.46 51.07 6,308.26 63.75
LESS: ACC. DEPRECIATI 1,458.18 13.45 2,522.75 25.49
NET BLOCK 4,080.28 37.62 3,785.51 38.26
CAPITAL WORK-IN-PRO 125.14 1.15 193.95 1.96
INVESTMENTS 5,128.75 47.29 3,964.26 40.06
INVENTORIES 524.93 4.84 675.57 6.83
SUNDRY DEBTOR 130.59 1.20 272.31 2.75
CASH AT BANK 71.52 0.66 76.82 0.78
LOANS AND ADVANCES 783.48 7.22 926.99 9.37
TOAL ASSETS 10844.69 100.00 9895.41 100.00
LIABILITIES
SHARE CAPITAL 39.94 0.37 39.94 0.40
RESERVES & SURPLUS 2,916.12 26.89 4,249.89 42.95
SECURED LOANS 1,458.45 13.45 994.85 10.05
UNSECURED LOANS 32.71 0.30 0.00 0.00
CURRENT LIABILITIES 5,316.40 49.02 3,520.66 35.58
PROVISIONS 1,081.07 9.97 1,090.07 11.02
TOTAL LIABILITI 10844.69 100.00 9895.41 100.00
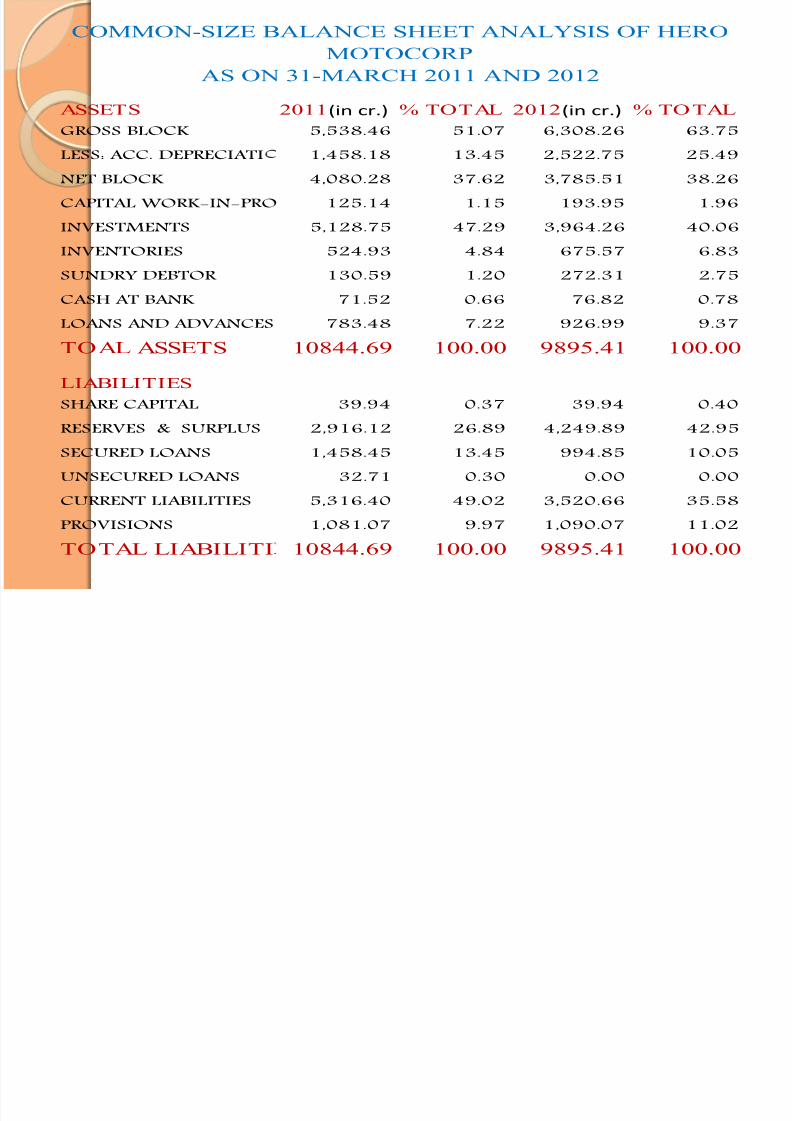
COMMON-SIZE BALANCE SHEET ANALYSIS OF HERO
MOTOCORP
AS ON 31-MARCH 2011 AND 2012
7/27/2019 Heromotorsfinal Fra
http://slidepdf.com/reader/full/heromotorsfinal-fra 17/26
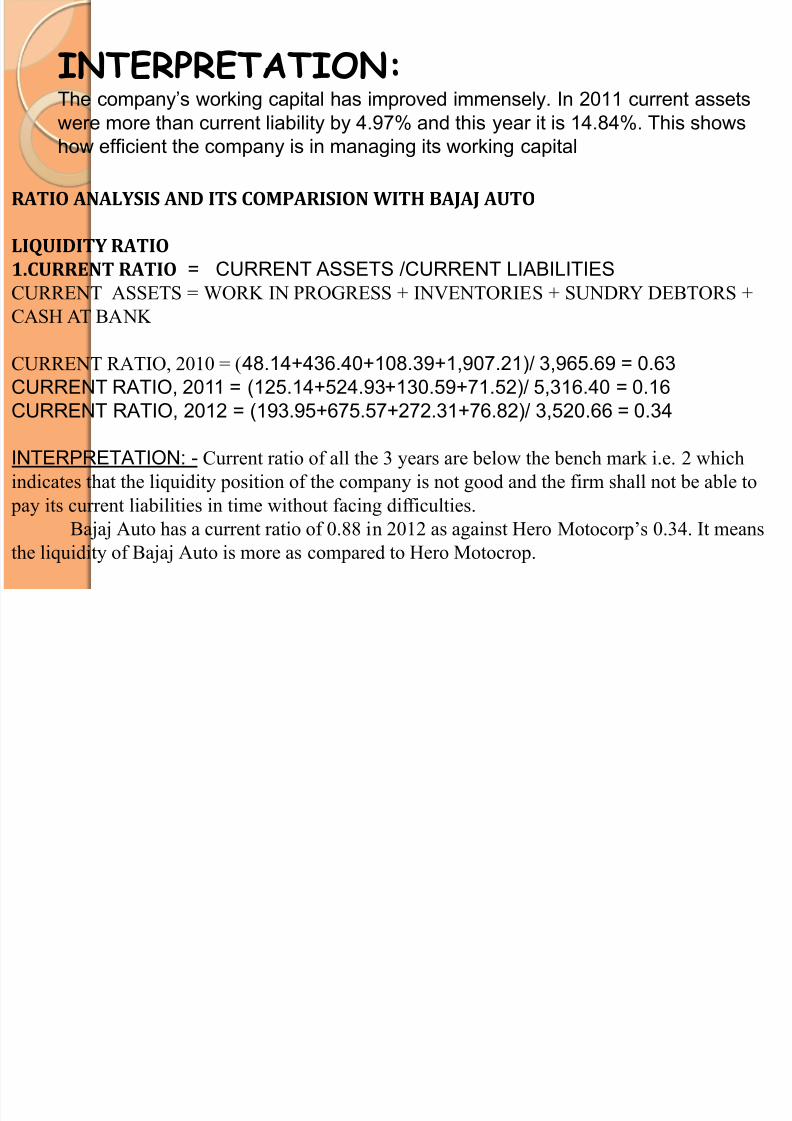
INTERPRETATION:The company‟s working capital has improved immensely. In 2011 current assets
were more than current liability by 4.97% and this year it is 14.84%. This shows
how efficient the company is in managing its working capital
RATIO ANALYSIS AND ITS COMPARISION WITH BAJAJ AUTO
LIQUIDITY RATIO 1.CURRENT RATIO = CURRENT ASSETS /CURRENT LIABILITIESCURRENT ASSETS = WORK IN PROGRESS + INVENTORIES + SUNDRY DEBTORS +
CASH AT BANK
CURRENT RATIO, 2010 = (48.14+436.40+108.39+1,907.21)/ 3,965.69 = 0.63
CURRENT RATIO, 2011 = (125.14+524.93+130.59+71.52)/ 5,316.40 = 0.16
CURRENT RATIO, 2012 = (193.95+675.57+272.31+76.82)/ 3,520.66 = 0.34
INTERPRETATION: - Current ratio of all the 3 years are below the bench mark i.e. 2 which
indicates that the liquidity position of the company is not good and the firm shall not be able to
pay its current liabilities in time without facing difficulties.
Bajaj Auto has a current ratio of 0.88 in 2012 as against Hero Motocorp’s 0.34. It means
the liquidity of Bajaj Auto is more as compared to Hero Motocrop.
7/27/2019 Heromotorsfinal Fra
http://slidepdf.com/reader/full/heromotorsfinal-fra 18/26
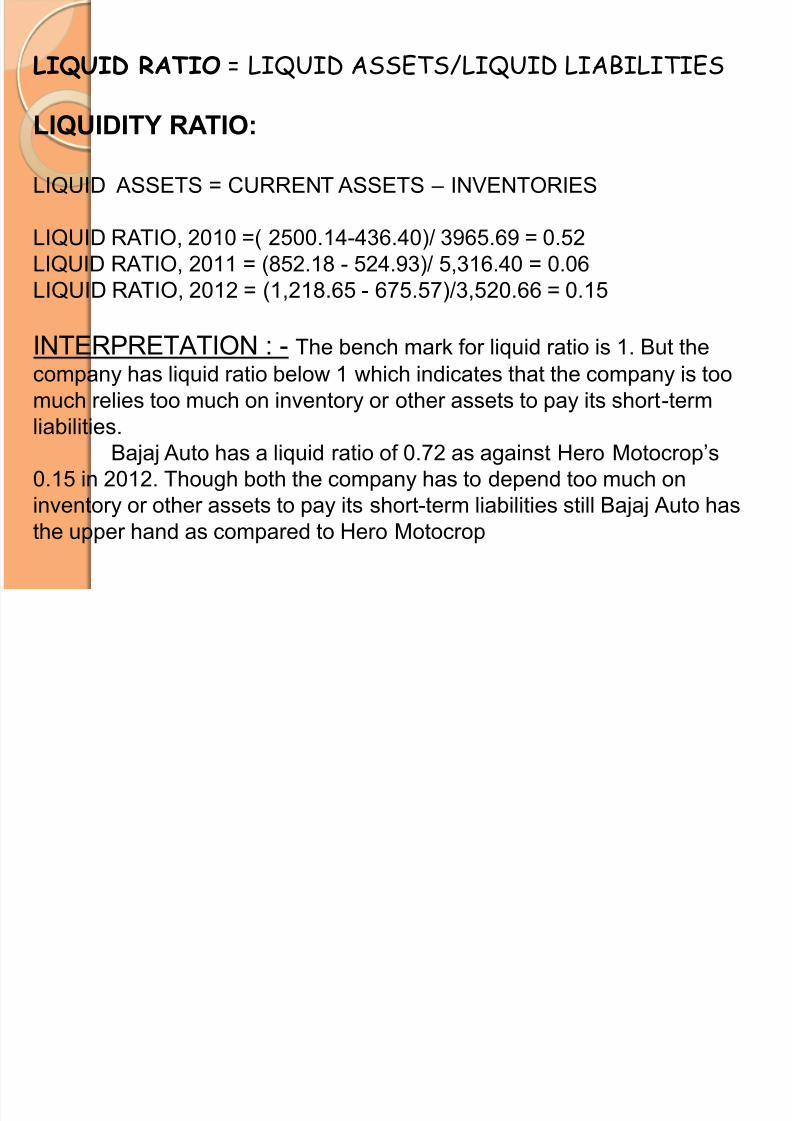
LIQUID RATIO = LIQUID ASSETS/LIQUID LIABILITIES
LIQUIDITY RATIO: LIQUID ASSETS = CURRENT ASSETS – INVENTORIES
LIQUID RATIO, 2010 =( 2500.14-436.40)/ 3965.69 = 0.52
LIQUID RATIO, 2011 = (852.18 - 524.93)/ 5,316.40 = 0.06
LIQUID RATIO, 2012 = (1,218.65 - 675.57)/3,520.66 = 0.15
INTERPRETATION : - The bench mark for liquid ratio is 1. But the
company has liquid ratio below 1 which indicates that the company is too
much relies too much on inventory or other assets to pay its short-term
liabilities.
Bajaj Auto has a liquid ratio of 0.72 as against Hero Motocrop‟s
0.15 in 2012. Though both the company has to depend too much on
inventory or other assets to pay its short-term liabilities still Bajaj Auto has
the upper hand as compared to Hero Motocrop
7/27/2019 Heromotorsfinal Fra
http://slidepdf.com/reader/full/heromotorsfinal-fra 19/26
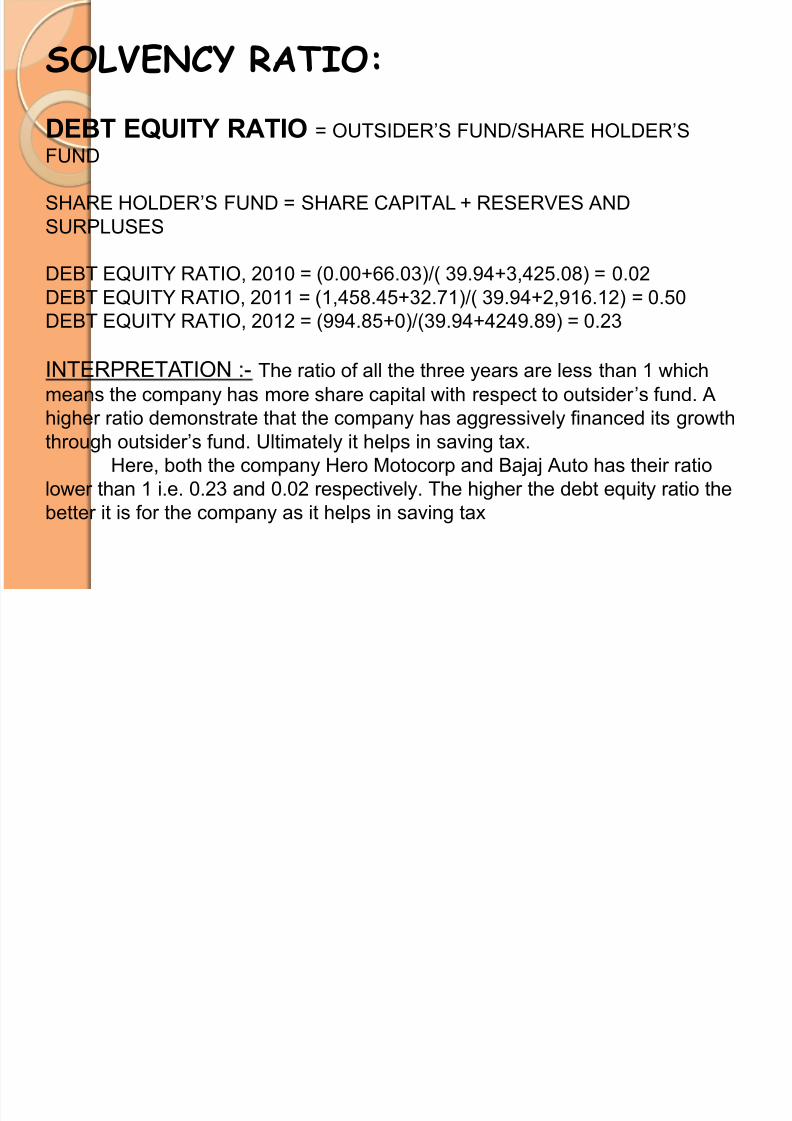
SOLVENCY RATIO:
DEBT EQUITY RATIO = OUTSIDER‟S FUND/SHARE HOLDER‟SFUND
SHARE HOLDER‟S FUND = SHARE CAPITAL + RESERVES AND
SURPLUSES
DEBT EQUITY RATIO, 2010 = (0.00+66.03)/( 39.94+3,425.08) = 0.02DEBT EQUITY RATIO, 2011 = (1,458.45+32.71)/( 39.94+2,916.12) = 0.50
DEBT EQUITY RATIO, 2012 = (994.85+0)/(39.94+4249.89) = 0.23
INTERPRETATION :- The ratio of all the three years are less than 1 which
means the company has more share capital with respect to outsider‟s fund. A
higher ratio demonstrate that the company has aggressively financed its growththrough outsider‟s fund. Ultimately it helps in saving tax.
Here, both the company Hero Motocorp and Bajaj Auto has their ratio
lower than 1 i.e. 0.23 and 0.02 respectively. The higher the debt equity ratio the
better it is for the company as it helps in saving tax
7/27/2019 Heromotorsfinal Fra
http://slidepdf.com/reader/full/heromotorsfinal-fra 20/26
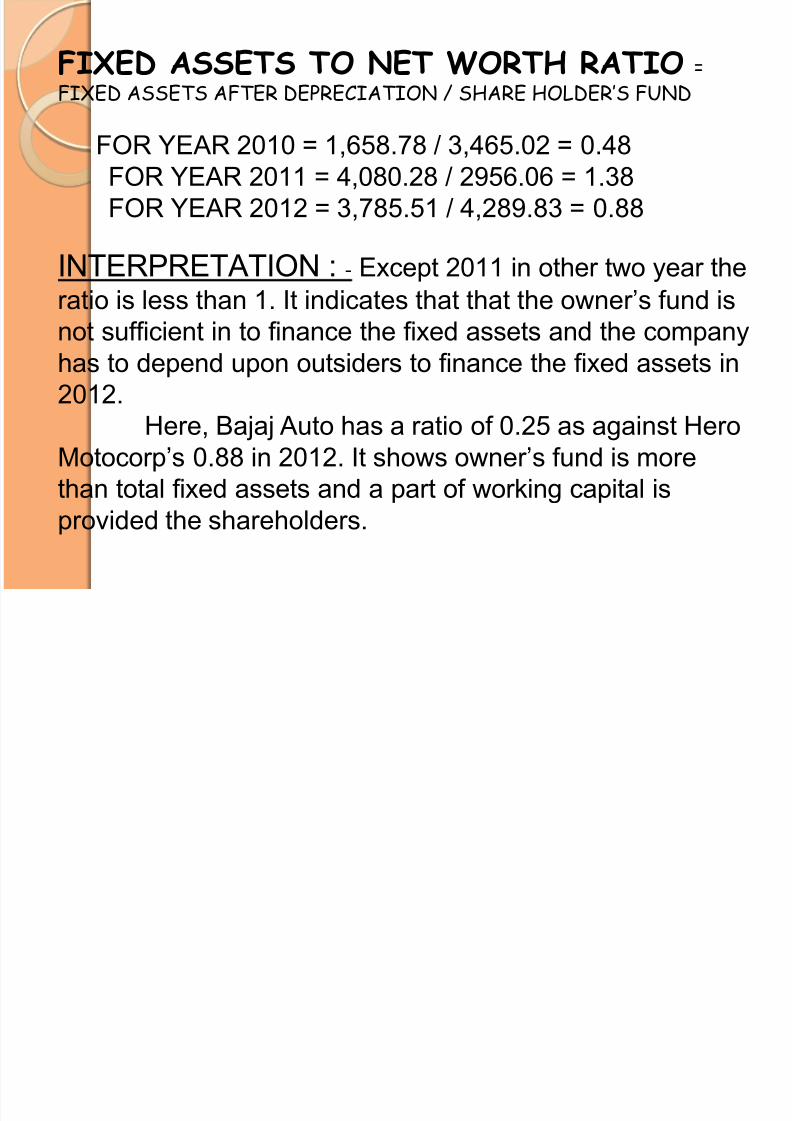
FIXED ASSETS TO NET WORTH RATIO =FIXED ASSETS AFTER DEPRECIATION / SHARE HOLDER’S FUND
FOR YEAR 2010 = 1,658.78 / 3,465.02 = 0.48FOR YEAR 2011 = 4,080.28 / 2956.06 = 1.38
FOR YEAR 2012 = 3,785.51 / 4,289.83 = 0.88
INTERPRETATION : - Except 2011 in other two year theratio is less than 1. It indicates that that the owner‟s fund is
not sufficient in to finance the fixed assets and the company
has to depend upon outsiders to finance the fixed assets in
2012.
Here, Bajaj Auto has a ratio of 0.25 as against HeroMotocorp‟s 0.88 in 2012. It shows owner‟s fund is more
than total fixed assets and a part of working capital is
provided the shareholders.
7/27/2019 Heromotorsfinal Fra
http://slidepdf.com/reader/full/heromotorsfinal-fra 21/26
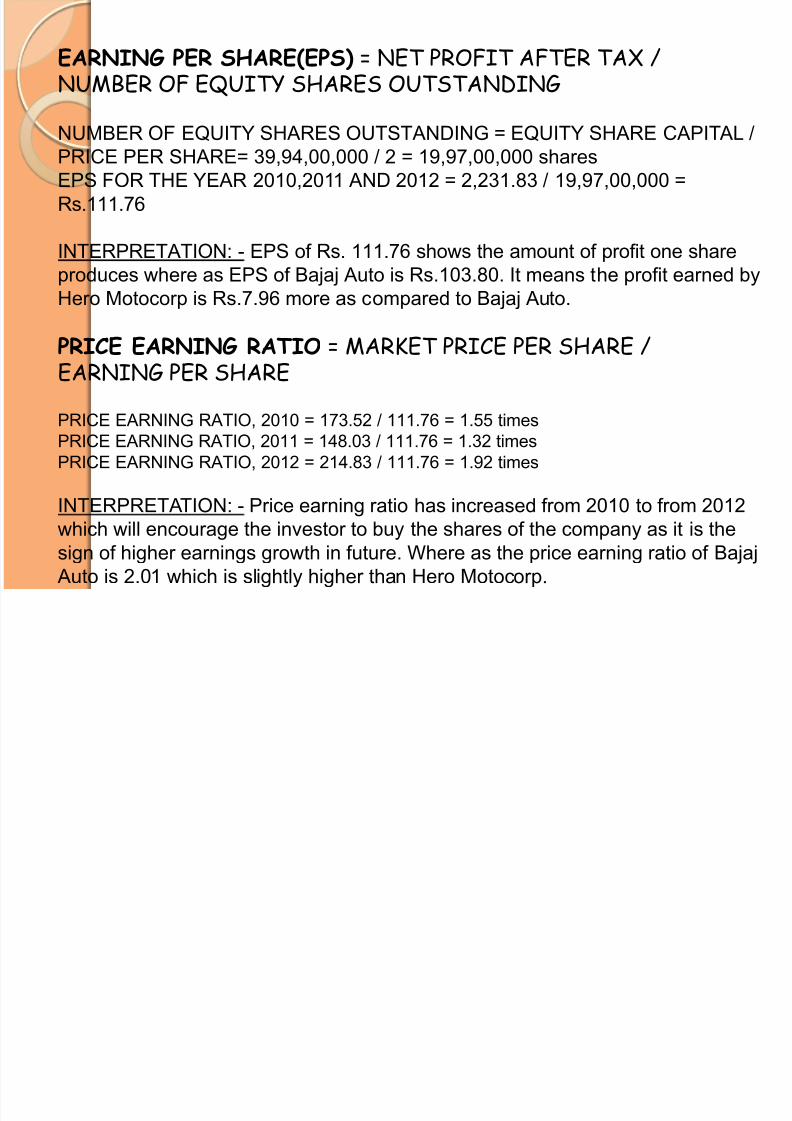
EARNING PER SHARE(EPS) = NET PROFIT AFTER TAX /NUMBER OF EQUITY SHARES OUTSTANDING
NUMBER OF EQUITY SHARES OUTSTANDING = EQUITY SHARE CAPITAL /PRICE PER SHARE= 39,94,00,000 / 2 = 19,97,00,000 shares
EPS FOR THE YEAR 2010,2011 AND 2012 = 2,231.83 / 19,97,00,000 =
Rs.111.76
INTERPRETATION: - EPS of Rs. 111.76 shows the amount of profit one share
produces where as EPS of Bajaj Auto is Rs.103.80. It means the profit earned byHero Motocorp is Rs.7.96 more as compared to Bajaj Auto.
PRICE EARNING RATIO = MARKET PRICE PER SHARE /EARNING PER SHARE
PRICE EARNING RATIO, 2010 = 173.52 / 111.76 = 1.55 timesPRICE EARNING RATIO, 2011 = 148.03 / 111.76 = 1.32 times
PRICE EARNING RATIO, 2012 = 214.83 / 111.76 = 1.92 times
INTERPRETATION: - Price earning ratio has increased from 2010 to from 2012
which will encourage the investor to buy the shares of the company as it is the
sign of higher earnings growth in future. Where as the price earning ratio of Bajaj Auto is 2.01 which is slightly higher than Hero Motocorp.
7/27/2019 Heromotorsfinal Fra
http://slidepdf.com/reader/full/heromotorsfinal-fra 22/26
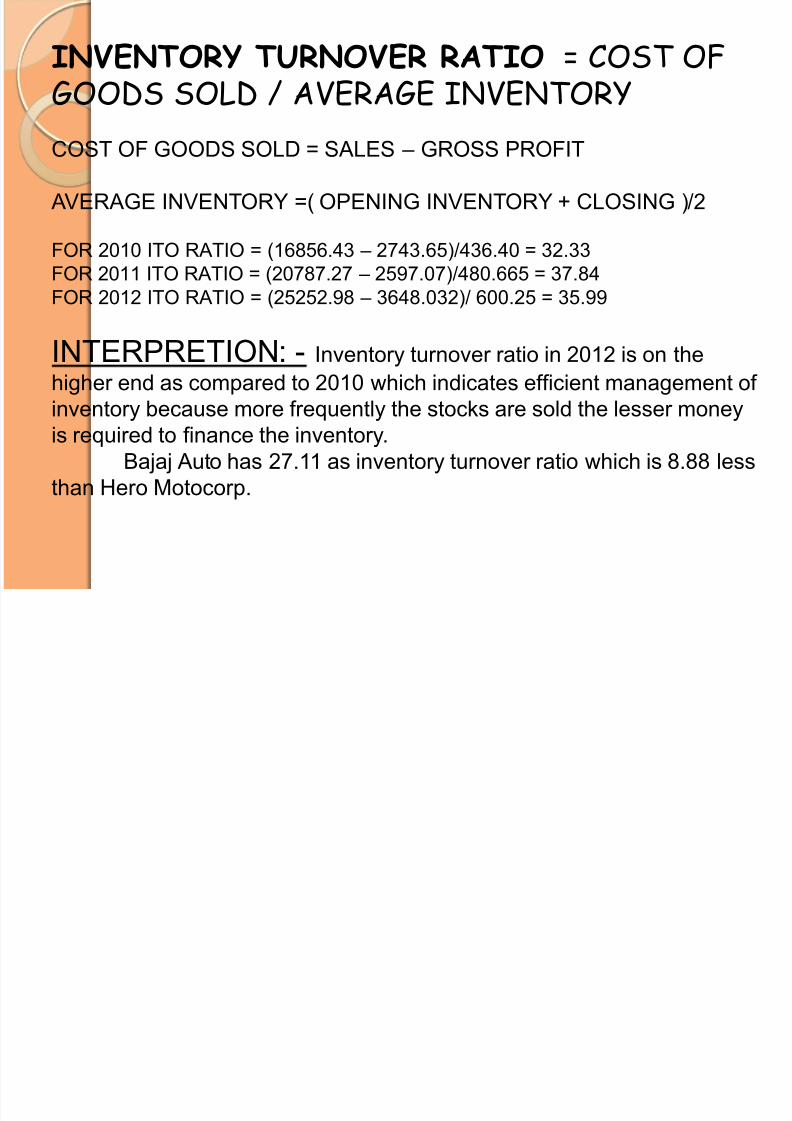
INVENTORY TURNOVER RATIO = COST OFGOODS SOLD / AVERAGE INVENTORY
COST OF GOODS SOLD = SALES – GROSS PROFIT
AVERAGE INVENTORY =( OPENING INVENTORY + CLOSING )/2
FOR 2010 ITO RATIO = (16856.43 – 2743.65)/436.40 = 32.33
FOR 2011 ITO RATIO = (20787.27 – 2597.07)/480.665 = 37.84FOR 2012 ITO RATIO = (25252.98 – 3648.032)/ 600.25 = 35.99
INTERPRETION: - Inventory turnover ratio in 2012 is on the
higher end as compared to 2010 which indicates efficient management of
inventory because more frequently the stocks are sold the lesser moneyis required to finance the inventory.
Bajaj Auto has 27.11 as inventory turnover ratio which is 8.88 less
than Hero Motocorp.
7/27/2019 Heromotorsfinal Fra
http://slidepdf.com/reader/full/heromotorsfinal-fra 23/26
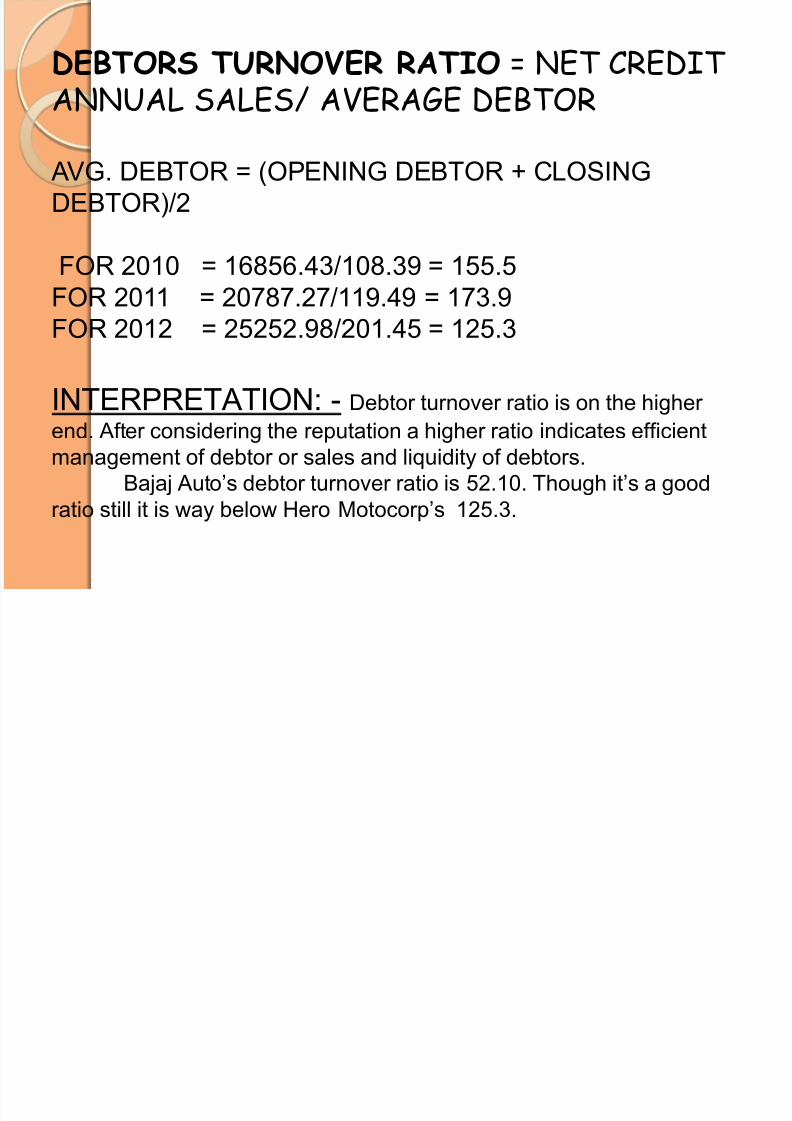
DEBTORS TURNOVER RATIO = NET CREDITANNUAL SALES/ AVERAGE DEBTOR
AVG. DEBTOR = (OPENING DEBTOR + CLOSING
DEBTOR)/2
FOR 2010 = 16856.43/108.39 = 155.5FOR 2011 = 20787.27/119.49 = 173.9
FOR 2012 = 25252.98/201.45 = 125.3
INTERPRETATION: - Debtor turnover ratio is on the higher
end. After considering the reputation a higher ratio indicates efficient
management of debtor or sales and liquidity of debtors.
Bajaj Auto‟s debtor turnover ratio is 52.10. Though it‟s a good
ratio still it is way below Hero Motocorp‟s 125.3.
7/27/2019 Heromotorsfinal Fra
http://slidepdf.com/reader/full/heromotorsfinal-fra 24/26
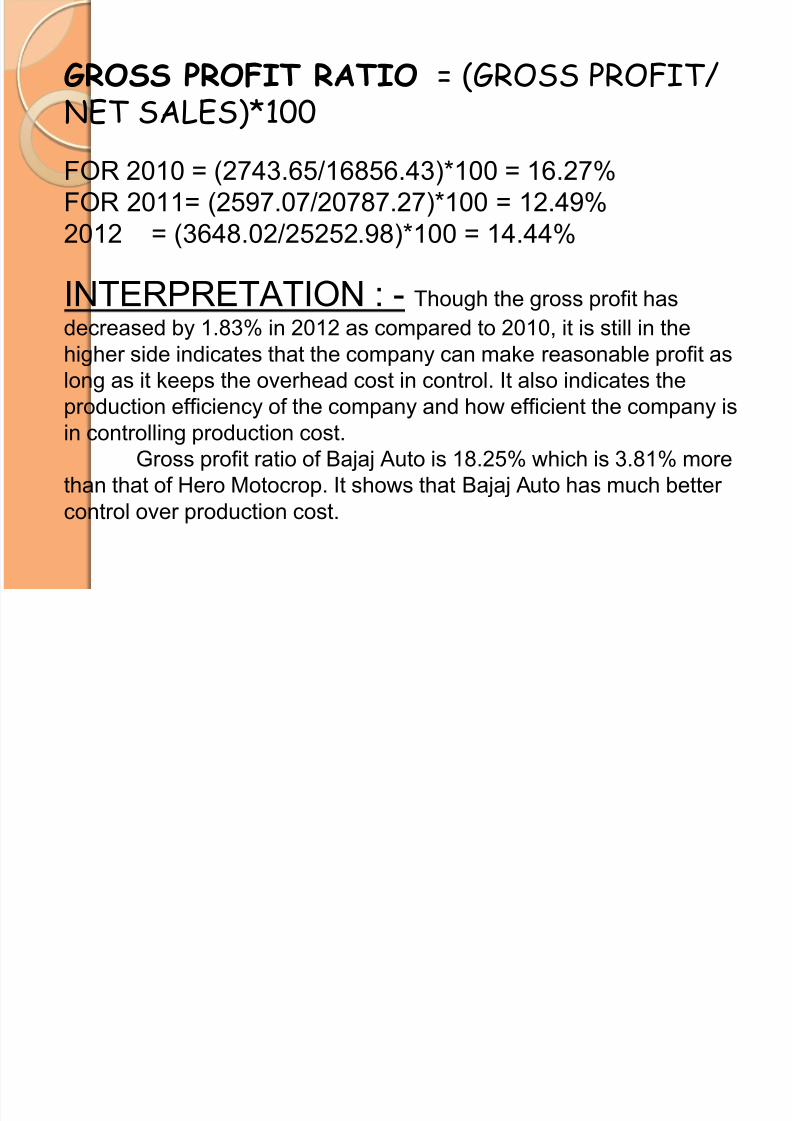
GROSS PROFIT RATIO = (GROSS PROFIT/NET SALES)*100
FOR 2010 = (2743.65/16856.43)*100 = 16.27%
FOR 2011= (2597.07/20787.27)*100 = 12.49%
2012 = (3648.02/25252.98)*100 = 14.44%
INTERPRETATION : - Though the gross profit has
decreased by 1.83% in 2012 as compared to 2010, it is still in the
higher side indicates that the company can make reasonable profit as
long as it keeps the overhead cost in control. It also indicates the
production efficiency of the company and how efficient the company isin controlling production cost.
Gross profit ratio of Bajaj Auto is 18.25% which is 3.81% more
than that of Hero Motocrop. It shows that Bajaj Auto has much better
control over production cost.
7/27/2019 Heromotorsfinal Fra
http://slidepdf.com/reader/full/heromotorsfinal-fra 25/26
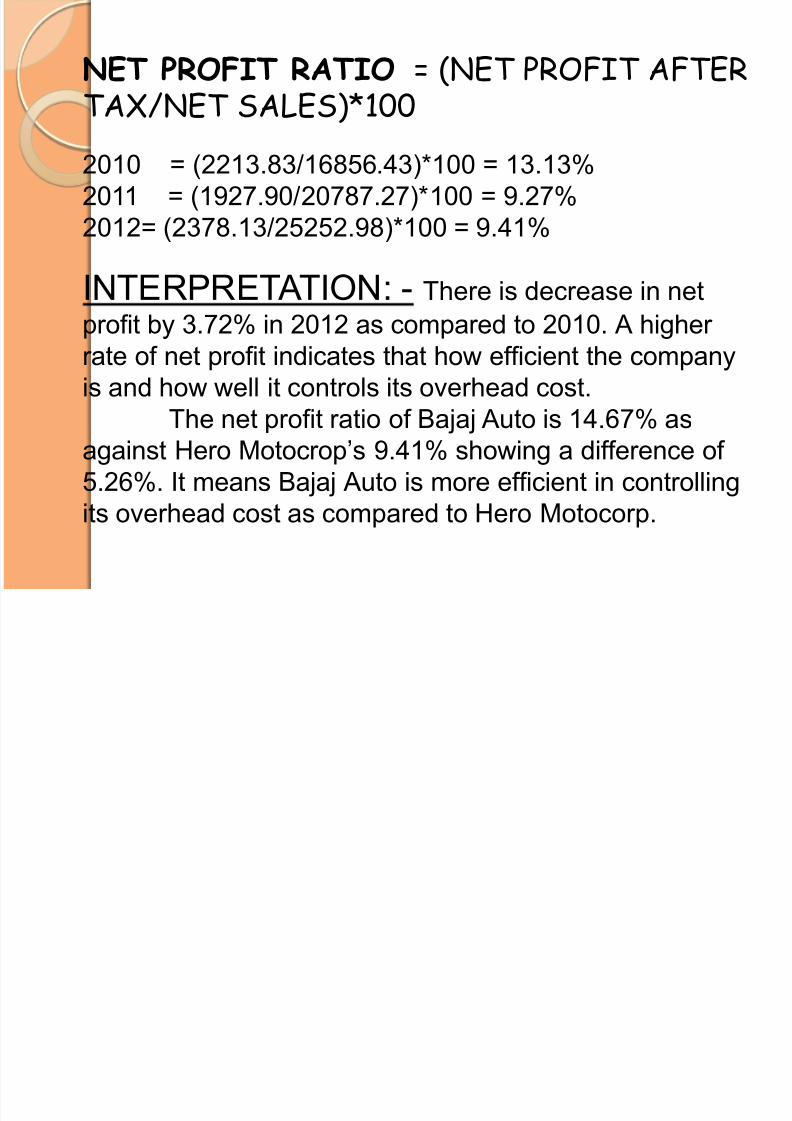
NET PROFIT RATIO = (NET PROFIT AFTERTAX/NET SALES)*100
2010 = (2213.83/16856.43)*100 = 13.13%
2011 = (1927.90/20787.27)*100 = 9.27%
2012= (2378.13/25252.98)*100 = 9.41%
INTERPRETATION: - There is decrease in net
profit by 3.72% in 2012 as compared to 2010. A higher
rate of net profit indicates that how efficient the company
is and how well it controls its overhead cost.
The net profit ratio of Bajaj Auto is 14.67% asagainst Hero Motocrop‟s 9.41% showing a difference of
5.26%. It means Bajaj Auto is more efficient in controlling
its overhead cost as compared to Hero Motocorp.
7/27/2019 Heromotorsfinal Fra
http://slidepdf.com/reader/full/heromotorsfinal-fra 26/26
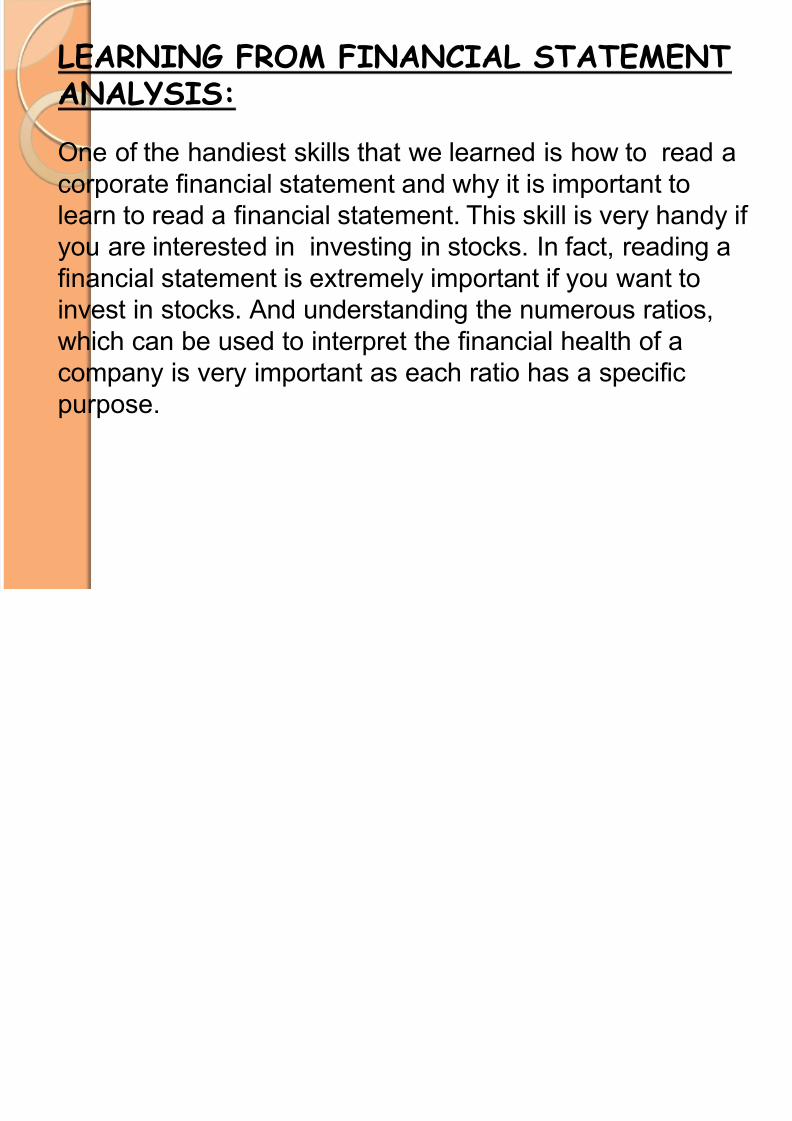
LEARNING FROM FINANCIAL STATEMENTANALYSIS:
One of the handiest skills that we learned is how to read a
corporate financial statement and why it is important to
learn to read a financial statement. This skill is very handy if
you are interested in investing in stocks. In fact, reading a
financial statement is extremely important if you want toinvest in stocks. And understanding the numerous ratios,
which can be used to interpret the financial health of a
company is very important as each ratio has a specific
purpose.


