Page 1
University of ConnecticutOpenCommons@UConn
NERA Conference Proceedings 2010 Northeastern Educational Research Association(NERA) Annual Conference
Fall 10-20-2010
Hierarchical Linear Modeling of Students’Mathematics Self-Efficacy and School Effects onMathematics AchievementXing LiuEastern Connecticut State University, [email protected]
Hari P. KoiralaEastern Connecticut State University, [email protected]
Follow this and additional works at: https://opencommons.uconn.edu/nera_2010
Part of the Education Commons
Recommended CitationLiu, Xing and Koirala, Hari P., "Hierarchical Linear Modeling of Students’ Mathematics Self-Efficacy and School Effects onMathematics Achievement" (2010). NERA Conference Proceedings 2010. 34.https://opencommons.uconn.edu/nera_2010/34
Page 2
Running head: MATHEMATICS SELF-EFFICACY AND ACHIEVEMENT
Hierarchical Linear Modeling of Students’ Mathematics Self-Efficacy and School Effects on
Mathematics Achievement
Xing Liu
Hari Koirala
Education Department
Eastern Connecticut State University
Page 3
1
Abstract
The purpose of this study was to investigate the relationship between mathematics self-efficacy
and mathematics achievement of high school sophomores across the United States, and to
examine the effects of gender, ethnicities, and school characteristics on students’ mathematics
achievement using hierarchical linear modeling (HLM). The base-year data of the Educational
Longitudinal Study (ELS): 2002 were used for analysis. Hierarchical linear models were
developed from the one-way random effects ANOVA model, and the unconditional Model with
mathematics self-efficacy in level 1, to the contextual models with variables in the both levels.
Both fixed effects and random effects were estimated and interpreted for all the models.
Keywords: Mathematics Self-efficacy, Mathematics Achievement, School Effects, Hierarchical
Linear Modeling.
Page 4
2
Hierarchical Linear Modeling of Students’ Mathematics Self-Efficacy and School Effects on
Mathematics Achievement
Introduction
Self-efficacy is an important concept in social cognitive theory, which has been widely
recognized as one of the most prominent theory about human learning (Ormrod, 2008). First
developed by Albert Bandura (1977; 1986), self-efficacy refers to learners’ beliefs about their
ability to accomplish certain tasks. Many researchers, including Bandura, have demonstrated that
self-efficacy affects human motivation, persistence, efforts, action, behavior, and achievement
(Bandura, 1977, 2000; Zimmerman, Bandura, & Martinez-Pons, 1992). Researchers have
indicated that higher self-efficacy is predictive of higher performance (Bong & Skaalvik, 2003).
Bandura (1986) defined self-efficacy as “People’s judgments of their capabilities to
organize and execute courses of action required to attain designated types of performances” (p.
391). Bandura (1977) argued that self-efficacy affects an individual’s choice of activities,
motivation, effort and persistence. People who have a high level of self-efficacy are more likely
to perform an action, while those who have low self-efficacy for accomplishing a specific task
may doubt their capabilities and perform poorly (Bandura, 1977). Randhawa, Beamer and
Lundberg (1993) indicated that self-efficacy is an important predictor for students’ mathematics
achievement.
Research on school effects on students’ academic achievement has been an increasingly
important topic, which mainly focuses on school climate. Previous research (Brand, Felner, Shim,
Seitsinger, & Dumas, 2003; Ma, 2000, 2002; Ma & Willms, 2004) has identified that school
climate played a significant role in affecting student’s academic achievement. Under the No
Child Left Behind (NCLB) Act, states need to develop content and achievement standards in all
Page 5
3
core subjects at every grade level, and assess the basic skills of all students in certain grade levels.
In addition, individual schools and districts need to be held accountable for making adequate
yearly progress on core subjects being assessed. It is common to see some schools and districts
continuously outperform others in subjects, such as mathematics and reading. However, in
addition to school climate, it is unknown what other school level factors contribute to the
effectiveness of these outperforming schools. Therefore, it is important to identify these factors
associated with students’ academic achievement, which could potentially help those
underperforming schools to improve.
The purpose of this study was to investigate the relationship between mathematics self-
efficacy and mathematics achievement of high school sophomores across the United States, and
to examine the effects of gender, ethnicities, and school characteristics on students’ mathematics
achievement using hierarchical linear modeling (HLM). Our research questions mainly focused
on: (1) Could mathematics achievement of high school sophomores be significantly predicted by
their mathematics self-efficacy? (2) Were there achievement gaps in mathematics between
gender and among different ethnic groups? (3) Were school-level factors, such as number of full-
time math teachers, number of students who received remedial math and school urbanicity,
associated with students’ mathematics achievement? (4) Were there any interaction effects
between students’ mathematics self-efficacy and the above school-level factors?
Methodology
Instrumentation and Data Collection
The ELS: 2002 study, conducted by the National Center for Educational Statistics
(NCES), was designed to provide longitudinal data regarding the transitions of 2002 high school
sophomores to postsecondary school education and their future careers. In the 2002 base year of
Page 6
4
the study, more than 15000 high school sophomores, from a national sample of 752 public and
private high schools, participated in the study by taking cognitive tests and responding to surveys.
These 752 schools represented the approximately 25000 public and private schools in the United
States that had a 10th
grade in 2002; the sample students represented approximately three million
10th
graders in the United States attending schools in 2002. The 2002 base year sophomore
cohort was followed at two-year intervals.
Data Analysis
Data were coded and analyzed using SPSS 18.0 and HLM (v. 6.06). Hierarchical linear
modeling (HLM) was used to address the research questions. The HLM technique allows us to
analyze multilevel data when observations at a low level are nested within observations at higher
levels, for example, students are nested in schools in this study. In addition, it is a promising
method of analyzing data with complex sampling design features (O’Connell & McCoach, 2008).
It is a powerful tool used to model cross-level effects and partition variance and covariance
components of fitted models (Hox, 2002; Raudenbush & Bryk, 2002).
The HLM analysis included a two-level hierarchical linear model of mathematics
achievement. Level 1 consisted of the student-level variable, gender, ethnicity and mathematics
self-efficacy. Level 2 included school-level variables such as number of full-time math teachers,
number of students who received remedial math and school urbanicity. Table 1 provides the
descriptive statistics of the variables in both levels. Hierarchical linear models were developed
from the one-way random effects ANOVA model, and the unconditional Model with
mathematics self-efficacy in level 1, to the contextual models with variables in the both levels.
Both fixed effects and random effects were estimated and interpreted for all the models.
Restricted maximum likelihood (REML) estimation was used in HLM (v. 6.06), since it is more
Page 7
5
advantageous than maximum likelihood (ML) in estimating variance components (McCoach,
2010). Models were compared based on the proportion reduction in variance in both levels. To
make the interpretation meaningful, the predictors in the level 1 model were centered around the
group mean, and predictors in the level 2 model were centered around the grand mean.
Insert Table 1 around here
The two-level conventional model (Raudenbush & Bryk, 2002) is expressed as follows:
Level 1 model: Yij = β0j + β1jXij + β2jXij + β3jXij + rij , (1)
where i represents the ith
student and j represents jth
school,
Yij represents the mathematics achievement of ith
student in the jth
school,
β0j is the intercept, the mean mathematics achievement in the jth
school,
β1j, β2j, and β3j are the slopes for gender, ethnicity, and mathematics self-efficacy in the jth
school,
respectively,
Xij represents the values of gender, ethnicity, and mathematics self-efficacy of ith
student in the jth
school, and
rij is the random error of ith
student in the jth
school.
Level 2 model: βqj=γq0 + γq1W1j + γq2W2j + … + uqj (q = 0, 1, 2 …), (2)
where γ00, …, γ22 are level 2 coefficients,
W1j and W2j are level 2 predictors, and
uqj is level 2 random effect.
Hierarchical linear models were developed from the one-way random effects ANOVA
model, the unconditional Model with mathematics self-efficacy, gender and ethnicity in level 1,
to the contextual model with variables in the both levels. Both fixed effects and random effects
were estimated and interpreted for all the models. Models were compared based on the
Page 8
6
proportion reduction in variance in both levels. To make the interpretation meaningful, the
predictors in the level 1 model will be centered around the group mean, and predictors in the
level 2 model will be centered around the grand mean. HLM (v. 6.06) was used for model fitting.
Results
The results of One-way Random Effects ANOVA Model with no level-1 and level-2 variables
The one-way random effects ANOVA model can be expressed like this:
Yij = β0j + rij
β0j = γ00 + u0j
Table 2 presents the results of one-way random effects ANOVA model. Average school
mean mathematics achievement was statistically different from zero (γ00 = 38.91, t = 145.62, df =
573, p = .000). For variance in school means, τ00 = 32.94, χ2
= 3233.09, df = 573, p=.000, so
there were considerable variations in the school means. ICC (intraclass correlation coefficient)
= .23 (32.94/142.02= .23), indicating 23% of the variability in mathematics achievement was
between schools (77% of the variability within school). The total variability was 142.02.
Additional level 1 predictors (student-level) would be chosen to try to reduce the variance within
schools, and additional level 2 predictors (school-level) would be added to explain between-
school variance in the following models.
Insert Table 2 around here
The results of unconditional model with the level-1 predictors
The unconditional model with level-1 predictors can be expressed like this:
Level 1:
Yij = β0j + β1jGenderij + β2jEthn1ij + β3jEthn2ij + β4jEthn3ij +
β5jEthn4ij + β6jEthn5ij + β7jSelf-Efficacyij + rij
Level 2:
Page 9
7
β0j = γ00 + u0j
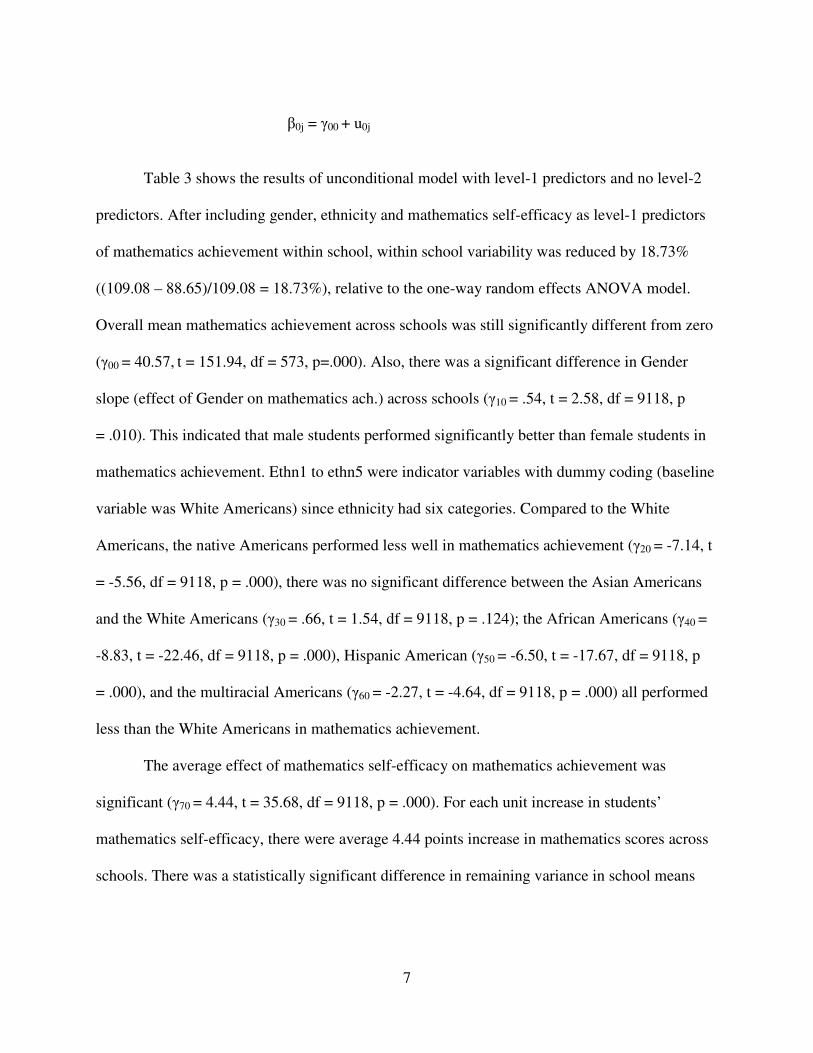
Table 3 shows the results of unconditional model with level-1 predictors and no level-2
predictors. After including gender, ethnicity and mathematics self-efficacy as level-1 predictors
of mathematics achievement within school, within school variability was reduced by 18.73%
((109.08 – 88.65)/109.08 = 18.73%), relative to the one-way random effects ANOVA model.
Overall mean mathematics achievement across schools was still significantly different from zero
(γ00 = 40.57, t = 151.94, df = 573, p=.000). Also, there was a significant difference in Gender
slope (effect of Gender on mathematics ach.) across schools (γ10 = .54, t = 2.58, df = 9118, p
= .010). This indicated that male students performed significantly better than female students in
mathematics achievement. Ethn1 to ethn5 were indicator variables with dummy coding (baseline
variable was White Americans) since ethnicity had six categories. Compared to the White
Americans, the native Americans performed less well in mathematics achievement (γ20 = -7.14, t
= -5.56, df = 9118, p = .000), there was no significant difference between the Asian Americans
and the White Americans (γ30 = .66, t = 1.54, df = 9118, p = .124); the African Americans (γ40 =
-8.83, t = -22.46, df = 9118, p = .000), Hispanic American (γ50 = -6.50, t = -17.67, df = 9118, p
= .000), and the multiracial Americans (γ60 = -2.27, t = -4.64, df = 9118, p = .000) all performed
less than the White Americans in mathematics achievement.
The average effect of mathematics self-efficacy on mathematics achievement was
significant (γ70 = 4.44, t = 35.68, df = 9118, p = .000). For each unit increase in students’
mathematics self-efficacy, there were average 4.44 points increase in mathematics scores across
schools. There was a statistically significant difference in remaining variance in school means
Page 10
8
(τ00 = 23.30, χ2
= 2920.50, df = 573, p = .000). This between school variance might be explained
after incorporating school level (level 2) variables.
Insert Table 3 around here
The results of contextual model (1) with the level-1 and level-2 predictors
The contextual model (1) can be expressed like this:
Level 1:
Yij = β0j + β1jGenderij + β2jEthn1ij + β3jEthn2ij + β4jEthn3ij +
β5jEthn4ij + β6jEthn5ij + β7jSelf-Efficacyij + rij
Level 2:
β0j = γ00 + γ01BYURBANj + γ02BYA14Jj + γ03BYA23Aj + u0j
β1j = γ10
β2j = γ20
β3j = γ30
β4j = γ40
β5j = γ50
β6j = γ60
β7j = γ70
Table 4 provides the results of the contextual model with the level-1 predictors and the
level-2 predictors. At level 2, the intercept was treated as random with the school level predictors,
and the remaining coefficients were specified as fixed with no predictors. Relative to the
unconditional model, 10.30% of the variance in the between school difference in mean
mathematics scores was accounted for by BYURBAN, BYA14J and BYA23A ((23.30-
20.90)/23.30 = 10.30%). However, since τ00 = 20.90, p = .000, there were still considerable
differences between schools that might be accounted for by other level 2 variables.
Insert Table 4 around here
Explaining the Intercepts
Overall mean mathematics achievement across schools was still significant from zero (γ00
= 40.44, t = 138.00, df = 570, p=.000). After controlling for BYA14J (number of remedial math
Page 11
9
students in a school) and BYA23A (number of full-time math teachers in a school), there was no
significant difference in mathematics achievement between students in urban school and
suburban or rural schools (γ01 = .42, t = .88, df = 570, p = .379). However, after accounting for
other variables, the effect of BYA14J on mean school mathematics achievement was statistically
significant (γ02 = -.15, t = -6.40, df = 570, p = .000). This result indicated that schools with larger
number of school receiving remedial mathematics had a negative effect on student mathematics
achievement. After accounting for other variables, the effect of BYA23A on mean school
mathematics achievement was also statistically significant (γ03 = .16, t = 4.27, df = 570, p = .000),
indicating that schools with more full-time mathematics teachers had a positive effect on the
mean school mathematics achievement. As the average number of full-time mathematics
teachers increased by one unit, the mean school mathematics achievement was increased by 0.16.
The results of contextual model (2) with the level-1 and level-2 predictors
The contextual model (2) can be expressed like this:
Level 1:
Yij = β0j + β1jGenderij + β2jEthn1ij + β3jEthn2ij + β4jEthn3ij +
β5jEthn4ij + β6jEthn5ij + β7jSelf-Efficacyij + rij
Level 2:
β0j = γ00 + γ01BYURBANj + γ02BYA14Jj + γ03BYA23Aj + u0j
β1j = γ10
β2j = γ20
β3j = γ30
β4j = γ40
β5j = γ50
β6j = γ60
β7j = γ70 + γ71BYURBANj + γ72BYA14Jj + γ73BYA23Aj + u7j
In the final model (contextual model 2) (Table 5), the intercept and the coefficient of self-
efficacy from level 1 were treated as random, and the other coefficients were fixed at level 2.
Page 12
10
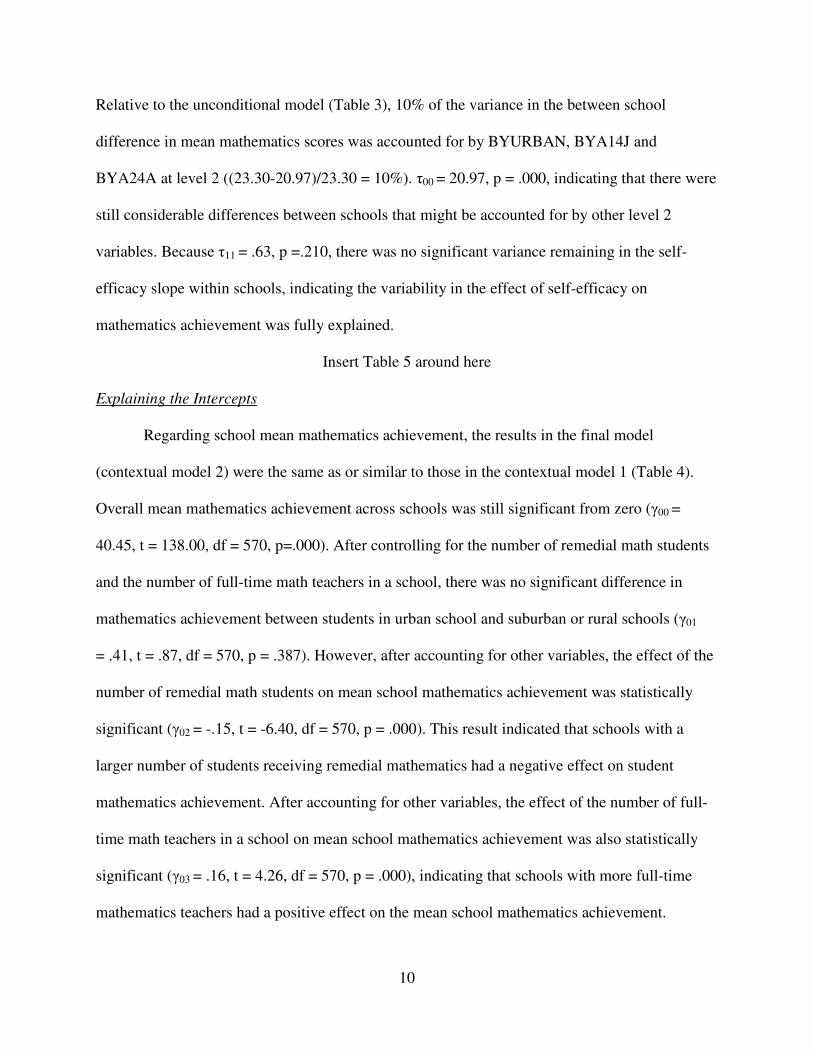
Relative to the unconditional model (Table 3), 10% of the variance in the between school
difference in mean mathematics scores was accounted for by BYURBAN, BYA14J and
BYA24A at level 2 ((23.30-20.97)/23.30 = 10%). τ00 = 20.97, p = .000, indicating that there were
still considerable differences between schools that might be accounted for by other level 2
variables. Because τ11 = .63, p =.210, there was no significant variance remaining in the self-
efficacy slope within schools, indicating the variability in the effect of self-efficacy on
mathematics achievement was fully explained.
Insert Table 5 around here
Explaining the Intercepts
Regarding school mean mathematics achievement, the results in the final model
(contextual model 2) were the same as or similar to those in the contextual model 1 (Table 4).
Overall mean mathematics achievement across schools was still significant from zero (γ00 =
40.45, t = 138.00, df = 570, p=.000). After controlling for the number of remedial math students
and the number of full-time math teachers in a school, there was no significant difference in
mathematics achievement between students in urban school and suburban or rural schools (γ01
= .41, t = .87, df = 570, p = .387). However, after accounting for other variables, the effect of the
number of remedial math students on mean school mathematics achievement was statistically
significant (γ02 = -.15, t = -6.40, df = 570, p = .000). This result indicated that schools with a
larger number of students receiving remedial mathematics had a negative effect on student
mathematics achievement. After accounting for other variables, the effect of the number of full-
time math teachers in a school on mean school mathematics achievement was also statistically
significant (γ03 = .16, t = 4.26, df = 570, p = .000), indicating that schools with more full-time
mathematics teachers had a positive effect on the mean school mathematics achievement.
Page 13
11
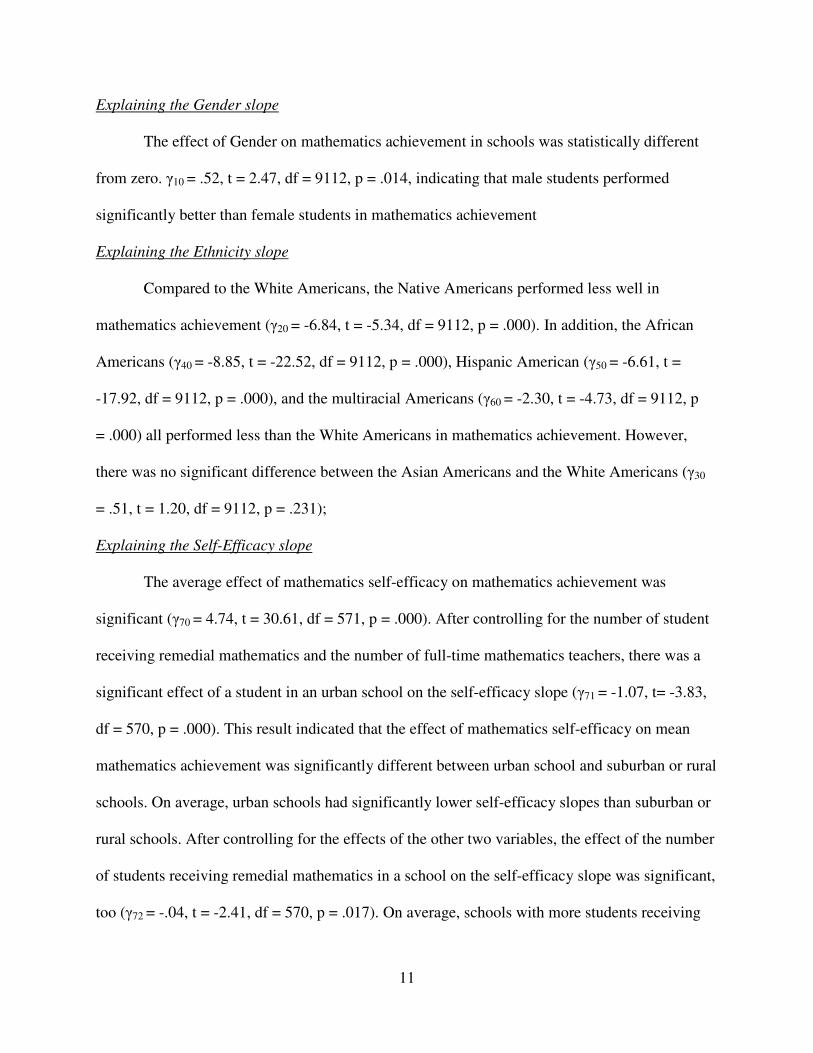
Explaining the Gender slope
The effect of Gender on mathematics achievement in schools was statistically different
from zero. γ10 = .52, t = 2.47, df = 9112, p = .014, indicating that male students performed
significantly better than female students in mathematics achievement
Explaining the Ethnicity slope
Compared to the White Americans, the Native Americans performed less well in
mathematics achievement (γ20 = -6.84, t = -5.34, df = 9112, p = .000). In addition, the African
Americans (γ40 = -8.85, t = -22.52, df = 9112, p = .000), Hispanic American (γ50 = -6.61, t =
-17.92, df = 9112, p = .000), and the multiracial Americans (γ60 = -2.30, t = -4.73, df = 9112, p
= .000) all performed less than the White Americans in mathematics achievement. However,
there was no significant difference between the Asian Americans and the White Americans (γ30
= .51, t = 1.20, df = 9112, p = .231);
Explaining the Self-Efficacy slope
The average effect of mathematics self-efficacy on mathematics achievement was
significant (γ70 = 4.74, t = 30.61, df = 571, p = .000). After controlling for the number of student
receiving remedial mathematics and the number of full-time mathematics teachers, there was a
significant effect of a student in an urban school on the self-efficacy slope (γ71 = -1.07, t= -3.83,
df = 570, p = .000). This result indicated that the effect of mathematics self-efficacy on mean
mathematics achievement was significantly different between urban school and suburban or rural
schools. On average, urban schools had significantly lower self-efficacy slopes than suburban or
rural schools. After controlling for the effects of the other two variables, the effect of the number
of students receiving remedial mathematics in a school on the self-efficacy slope was significant,
too (γ72 = -.04, t = -2.41, df = 570, p = .017). On average, schools with more students receiving
Page 14
12
remedial mathematics tended to have lower self-efficacy slopes than those with less students
receiving remedial mathematics. However, there was no significant effect of the number of full-
time mathematics teacher in a school on the self-efficacy slope (γ73 = .03, t = 1.39, df = 570, p
= .165). This indicated that there was no interaction effect between the number of full-time
mathematics teachers and mathematics self-efficacy on mathematics achievement.
Conclusions and Implications
In this study, multilevel (hierarchical) modeling was used to investigate the effects of
mathematics self-efficacy, other student-level characteristics and school-level variables on
mathematics achievement. The results of the fitted models indicated that there was substantial
variance in students’ mathematics achievement both across schools and within schools. Within
schools variance varied more substantially than between schools variance. Both between schools
variance and with schools variance were significantly accounted for after level 1 and level 2
variables were added to the HLM models.
Regarding school-level effect on student’s mathematics achievement, there was no
significant difference in mathematics achievement between students in urban school and
suburban or rural schools. Another important finding is that schools with a larger number of
students receiving remedial mathematics had a negative effect on student mathematics
achievement. This finding suggests that although remedial math classes could help students who
struggle in mathematics understand basic concepts and keep up with their peers, a great number
of students behind the expected mathematics proficiency level in a school indicated a negative
learning environment, which might have a negative effect on mathematics achievement for a
particular grade. This study also found that schools with more full-time mathematics teachers
had a positive effect on the mean school mathematics achievement. This finding is significant
Page 15
13
since it provides empirical evidence for recruiting full-time mathematics teachers. When school
budget is tight, school administrators are more interested in hiring part-time than full-time
teachers. This study suggests that a larger number of part-time mathematics teachers in a school
would eventually have a negative impact on mathematics achievement.
Results also indicated that there were achievement gaps between gender and among
different ethnic groups. Male students performed significantly better than female students in
mathematics achievement. Compared to the White Americans, the Native Americans, the
African Americans, Hispanic Americans and the multiracial Americans performed less well in
mathematics achievement. No significant difference between the Asian Americans and the White
Americans was identified. Our finding also identified that the average effect of mathematics self-
efficacy on mathematics achievement was significant and positive.
In addition, there was an interaction effect between a school level factor and students’
mathematics self-efficacy. On average, urban schools had significantly lower self-efficacy slopes
than suburban or rural schools and schools with more students receiving remedial mathematics
tended to have lower self-efficacy slopes than those with fewer students receiving remedial
mathematics. No interaction effect between the number of full-time mathematics teachers and
mathematics self-efficacy on mathematics achievement was identified.
Implications
Improving students’ mathematics achievement has been a great concern for mathematics
educators and educational policy makers. They are interested in whether affective factors such as
attitude toward mathematics and mathematics self-efficacy have positive effect on students’
mathematics learning. Further, school-level factors might also influence students’ achievement.
Under the No Child Left Behind Act of 2001 (NCLB), schools are required to achieve adequate
Page 16
14
yearly progress (AYP) for their students. Thus, identifying school-level attributes on students’
mathematics achievement is of great interest to mathematics educators, school administrators,
and policy makers.
This study was significant in three ways. First, this study would help mathematics
educators, administrators, and policy makers to understand whether there was a positive
relationship between mathematics self-efficacy and mathematics achievement of high school
students. Our findings suggest that efforts are needed for promoting mathematics self-efficacy
Second, this study might provide direction for school administrators and policy makers to take
actions to close achievement gaps between gender and among ethnic groups. Finally, this study
found that school factors, such as the number of students who received remedial mathematics
and the number of full-time mathematics teachers had significant effects on students’
mathematics achievement. This result suggests that recruiting full-time rather than part-time
mathematics teachers might be more beneficial to student achievement and school districts in the
long run.
Page 17
15
References
Bandura, A. (1977). Self-efficacy: Toward a unifying theory of behavioral change.
Psychological Review, 84, 191-215.
Bandura, A. (1986). Social foundations of thought and action: A social cognitive theory.
Englewood Cliffs, NJ: Prentice Hall.
Bandura, A. (1997). Self-efficacy: The exercise of control. New York: W. H. Freeman &
Company.
Bandura, A. (2000). Exercise of human agency through collective efficacy. Current Directions in
Psychological Science, 9(3), 75-78.
Bong, M., & Skaalvik, E. M. (2003). Academic self-concept and self-efficacy: How different are
they really? Educational Psychology Review, 15, 1-40.
Brand, S., Felner, R., Shim, M., Seitsinger, A., & Dumas, T. (2003). Middle school improvement
and reform: Development and validation of a school-level assessment of climate, cultural
pluralism, and school safety. Journal of Educational Psychology, 95, 570-588.
Hox, J. (2002). Multilevel analysis: Techniques and applications. Mahwah, NJ: Lawrence
Erlbaum Associates.
Ingels, S. J., Pratt, D. J., Roger, J., Siegel, P. H., & Stutts, E. (2004). ELS: 2002 Base Year Data
File User’s Manual. Washington, DC: NCES (NCES 2004-405).
Ingels, S. J., Pratt, D. J., Roger, J., Siegel, P. H., & Stutts, E. (2005). Education Longitudinal
Study: 2002/04 Public Use Base-Year to First Follow-up Data Files and Electronic
Codebook System. Washington DC: NCES (NCES 2006-346).
Ma, X. (2002). Early acceleration of mathematics students and its effect on growth in self-esteem:
A longitudinal study. International Review of Education, 48, 443-468,
Page 18
16
Ma, X., & Klinger, D. A. (2000). Hierarchical linear modeling of student and school effects on
academic achievement. Canadian Journal of Education, 25, 41-55.
Ma, X., & Willms, J. D. (2004). School disciplinary climate: Characteristics and effects on
eighth grade achievement. Alberta Journal of Educational Research, 50, 169-189.
McCoach, D. B. (2010). Hierarchical linear modeling. In G. R. Hancock and R. O. Muller (Eds.).
The reviewer’s guide to quantitative methods in the social sciences (pp. 123-154). New
York, NY: Routledge.
O’Connell, A. A., & McCoach, D. B. (2008). Pedagogy and context for multilevel models. In A.
A. O’Connell and D. B. McCoach (Eds.). Multilevel modeling of educational data (pp. 3-
10). Charlotte, NC: Information Age Publishing.
Ormrod, J. E. (2008). Human learning (5th
ed.). Upper Saddle River, NJ: Pearson.
Randhawa, B. S., Beamer, J. E., & Lundberg, I. (1991). Role of mathematics self-efficacy in the
structural model of mathematics achievement. Journal of Educational Psychology, 85,
41-48.
Raudenbush, S. W., & Bryk, A. S. (2002). Hierarchical linear models: Applications and data
analysis methods (2nd
ed.). Thousand Oaks, CA: Sage.
Zimmerman, B. J., Bandura, A., & Martinez-Pons. (1992). Self-motivation for academic
attainment: The role of self-efficacy beliefs and personal goal-setting. American
Educational Research Journal, 29(3), 663-676.
Page 19
17
Table 1
Descriptive Statistics of the Variables in Both Levels
Level 1 Variables N Mean SD
Mathematics Achievement 9126 39.27 11.85
Gender 9126 .48 .50
Eth1 (Native American) 9126 .01 .09
Eth2 (Asian American) 9126 .09 .29
Eth3 (African American) 9126 .10 .30
Eth4 (Hispanic American) 9126 .13 .33
Eth5 (Multiracial American) 9126 .05 .21
Eth6 (White American) 9126 .63 .48
Mathematics Self-Efficacy 9126 2.52 .85
Level 2 Variables
BYSURBAN: suburban schools
or not
574 .31 .46
BYA14J: number of students
receiving remedial math in a
school
574 6.05 9.81
BYA23A: number of full-time
mathematics teachers in a
school
574 8.85 5.95
Table 2
One-way Random Effects ANOVA Model
Fixed Effects Coefficient (SE) t (df) p Reliability
Model for mean school
mathematics ach. (β0)
Intercept (γ00) 38.91 (.27) 145.62
(573)
0.000* 0.80
Random Effects Variance df Chi-square
Var. in school means (τ00) 32.94 573 3233.09 (.000)
Var. within school (σ2
) 109.08
142.02
Page 20
18
Table 3
Unconditional Model (group-mean centering of self-efficacy)
Fixed Effects
Coefficient
(SE)
t (df) p Reliability
Model for mean school
mathematics ach. (β0)
Intercept (γ00) 40.57 (.27) 151.94
(573)
.000 0.78
Model for Gender slope
(β1)
Intercept (γ10) .54 (0.21) 2.58 (9118) .010
Model for Ethn1 (Native
American) slope (β2)
Intercept (γ20) -7.14 (1.29) -5.56 (9118) .000
Model for Ethn2 (Asian
American) slope (β3)
Intercept (γ30) .66 (.43) 1.54 (9118) .124
Model for
Ethn3(African
American) slope (β4)
Intercept (γ40) -8.83 (.39) -22.46
(9118)
.000
Model for Ethn4
(Hispanic American)
slope (β5)
Intercept (γ50) -6.50 (.37) -17.67
(9118)
.000
Model for Ethn5
(Multiracial American)
slope (β6)
Intercept (γ60) -2.27 (.49) -4.64 (9118) .000
Model for Self-efficacy
slope (β7)
Intercept (γ70) 4.44 (.12) 35.68
(9118)
.000
Random Effects Variance df Chi-square
Var. in school means(τ00) 23.30 573 2920.50 (.000)
Var. within school (σ2
) 88.65
111.95
Page 21
19
Table 4
Contextual Model (1) with BYSUB, BYRURAL, BYA14J and BYA23A in the Level-1 Random
Intercept
Fixed Effects
Coefficient
(SE)
t (df) p Reliability
Model for mean school
mathematics ach. (β0)
Intercept (γ00) 40.44 (.29) 137.997
(570)
.000 0.76
BYSURBAN (γ01) .42 (.48) .88 (570) .379
BYA14J (γ02) -.15 (.02) -6.40 (570) .000
BYA23A (γ03) .16 (.04) 4.27 (570) .000
Model for Gender slope
(β1)
Intercept (γ10) .55 (0.21) 2.60 (9115) .010
Model for Ethn1 (Native
American) slope (β2)
Intercept (γ20) -6.79 (1.28) -5.30 (9115) .000
Model for Ethn2 (Asian
American) slope (β3)
Intercept (γ30) .50 (.43) 1.17 (9115) .242
Model for
Ethn3(African
American) slope (β4)
Intercept (γ40) -8.91 (.39) -22.65
(9115)
.000
Model for Ethn4
(Hispanic American)
slope (β5)
Intercept (γ50) -6.63 (.37) -17.95
(9115)
.000
Model for Ethn5
(Multiracial American)
slope (β6)
Intercept (γ60) -2.33 (.49) -4.76 (9115) .000
Model for Self-efficacy
slope (β7)
Intercept (γ70) 4.44 (.12) 35.69
(9115)
.000
Random Effects Variance df Chi-square
Var. in school means(τ00) 20.90 570 2689.04 (.000)
Var. within school (σ2
) 88.62
Page 22
20
Table 5
Contextual Model (2) with BYSUB, BYRURAL, BYA14J and BYA23A in the Level-1 Random
Intercept and the Self-Efficacy Slope
Fixed Effects
Coefficient
(SE)
t (df) p Reliability
Model for mean school
mathematics ach. (β0)
Intercept (γ00) 40.45 (.29) 138.00
(570)
.000 0.77
BYURBAN (γ01) .41 (.48) .87 (570) .387
BYA14J (γ02) -.15 (.02) -6.40 (570) .000
BYA23A (γ03) .16 (.04) 4.26 (570) .000
Model for Gender slope
(β1)
Intercept (γ10) .52 (0.21) 2.47 (9112) .014
Model for Ethn1 (Native
American) slope (β2)
Intercept (γ20) -6.84 (1.28) -5.34 (9112) .000
Model for Ethn2 (Asian
American) slope (β3)
Intercept (γ30) .51 (.43) 1.20 (9112) .231
Model for
Ethn3(African
American) slope (β4)
Intercept (γ40) -8.85 (.39) -22.52
(9112)
.000
Model for Ethn4
(Hispanic American)
slope (β5)
Intercept (γ50) -6.61 (.37) -17.92
(9112)
.000
Model for Ethn5
(Multiracial American)
slope (β6)
Intercept (γ60) -2.30 (.49) -4.73 (9112) .000
Model for Self-efficacy
slope (β7)
Intercept (γ70) 4.74 (.16) 30.61 (570) .000
BYURBAN (γ71) -1.06 (.28) -3.83 (570) .000
BYA14J (γ72) -.04 (.01) -2.41 (570) .017
BYA23A (γ73) .03 (.02) 1.39 (570) .165
Page 23
21
Random Effects Variance df Chi-square
Var. in school means (τ00) 20.97 568 2668.50 (.000)
Var. in Self-Efficacy slope
(τ11)
.63 568 593.94 (.210)
Var. within school (σ2
) 88.00
109.60


![Hierarchical Linear Modeling of National Culture within a ...bizresearchpapers.com/14[1].Linda.pdf · Hierarchical Linear Modeling of National Culture within a Remuneration Framework](https://static.documents.pub/doc/80x56/5b2379d87f8b9a234c8b4d5e/hierarchical-linear-modeling-of-national-culture-within-a-1lindapdf-hierarchical.jpg)


