52
1 3/14/2006 © 2005 Hitachi Global Storage Technologies High-Definition Multi-Room DVRs and HDDs Donald Molaro and Jorge Campello San Jose Research Center Hitachi GST
13/14/2006© 2005 Hitachi Global Storage Technologies
High-Definition Multi-Room DVRsand HDDs
Donald Molaro and Jorge Campello
San Jose Research Center
Hitachi GST

23/14/2006© 2005 Hitachi Global Storage Technologies
VCRs vs DVRs (a.k.a. PVR)
What is difference between DVR and VCR?• Digital vs analogue• Easy to program? What about VCR+• Tape vs HDD
– No need to change the tape– Stores many weeks– Not for archival– Simultaneously view and record.– Record multiple – Playback multiple

33/14/2006© 2005 Hitachi Global Storage Technologies
Requirements For Multi-Room PVR Systems
Living Room
Bedroom KitchenKid’s Room
System Requirements
• Support for 4 write streams and 4 read streams, with trick play capability (fast forward and rewind) on each of the read streams.
• Additional support for other “best effort” applications such as: EPG, photo browsing, music playlists, web browsing, CD ripping, IP TV downloads, etc.
Emerging Multi-Room PVR
Main STBwith 4 HD
tuners
At least one HDdisplay
Client boxes
High Definition Satellite or Cable
Home Cable Wiring

43/14/2006© 2005 Hitachi Global Storage Technologies
QoS For AV Streaming Applications
Input AV Streams Output AV Streams
ATA7 Hard Disk Drive
ATA7 Device Driver
Best Effort (IT)Applications(GUI, EPG, photo browsing,music playlists, etc.)
Other IT Data
Wri
teB
uffe
rs
Rea
dB
uffe
rs
Application Layer
Real Time (AV) Applications
File System
Real-Time (AV) Data
OS Scheduler
CommandScheduler
NomenclatureReal-TimeTraffic
Best EffortTraffic
Best Effort (IT) Data

53/14/2006© 2005 Hitachi Global Storage Technologies
Part II: HDD Overview
HDDs as Block devices
Sequential access and skew
Zones and data layout
Command Queues
Write Cache
Read Cache

63/14/2006© 2005 Hitachi Global Storage Technologies
Magnetic Recording: Longitudinal

73/14/2006© 2005 Hitachi Global Storage Technologies
Magnetic Recording: Perpendicular
83/14/2006© 2005 Hitachi Global Storage Technologies
Disk
0 1 …N-1
N N+12N-1
2N2N+1
3N-1
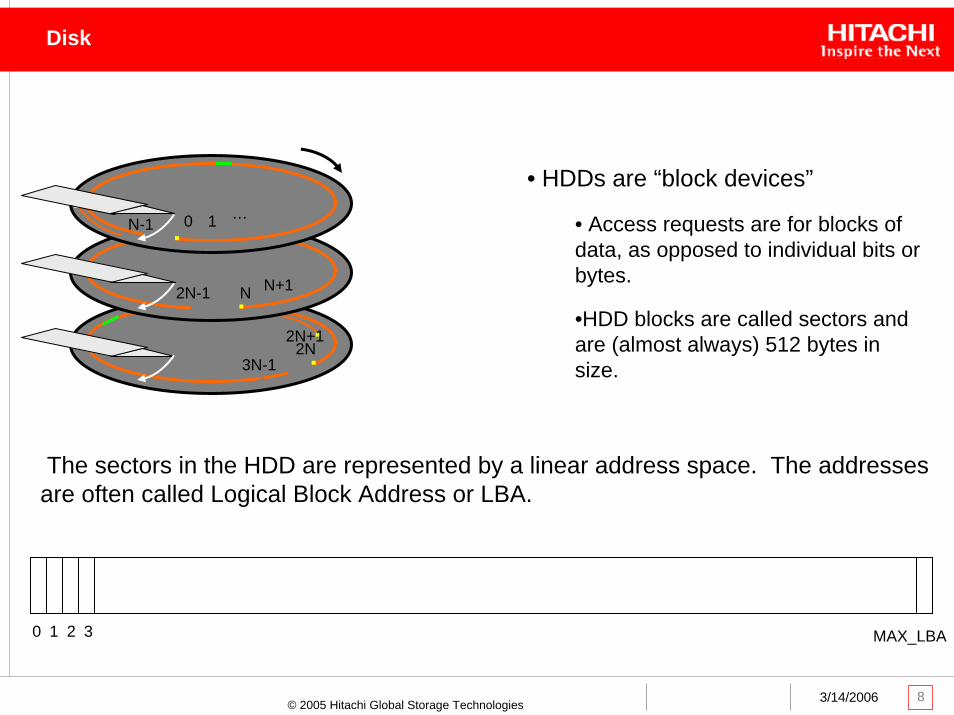
• HDDs are “block devices”
• Access requests are for blocks of data, as opposed to individual bits or bytes.
•HDD blocks are called sectors and are (almost always) 512 bytes in size.
The sectors in the HDD are represented by a linear address space. The addresses are often called Logical Block Address or LBA.
0 1 2 3 MAX_LBA

93/14/2006© 2005 Hitachi Global Storage Technologies
Ordering the Tracks
OD ID

103/14/2006© 2005 Hitachi Global Storage Technologies
HDD Throughput Optimization
HDDs are designed to optimize sequential access. This is done by varying the position of the first sector in the track by an amount (called skew) proportional to the time required to switch tracks.
Example: (these are illustrative simplified numbers for easy computation)
One revolution -> 8ms (7500 rpm). Track switch time -> 1.6-1.9 ms. Use 2ms = ¼ rev.Track size -> 1000 sectors.
Track NSector 0
Track NSector 0
Track NSector 1
Track NSector 1
Track NSector 999
Track NSector 999
Track N+1Sector 0
Track N+1Sector 0
Track N+1Sector 1
Track N+1Sector 1
skewskew

113/14/2006© 2005 Hitachi Global Storage Technologies
Sequential Access
0
250
500
750
1000
1250
1500
1750
2000
2250
0 10 20 30 40
Read-backSustained
Time (ms)
Dat
a (K
B)
Data in one trackData in one track
Time for 1 revolutionTime for 1 revolution
Track skew timeTrack skew time
Data output vs time
8
sMBmsms
KBR
/5028
500
=+
=

123/14/2006© 2005 Hitachi Global Storage Technologies
HDD Throughput Bound
In an HDD, the number of sectors in a track varies from zone to zone. Hence, for each zone, z, we have S(z) sectors per track and therefore
The average data-rate for the entire HDD with Nz zones and C(z) cylinders in zone z we have
)1(
)()(
)()(11
1 sr
N
i iiN
iii TT
DzSzC
zRzCD
R
z
z
+==
∑∑
=
=
Swhere
)1()()(sTTr
zSzR+
=
is the average # of sectors per track and D is the total # of cylinders.
)1(sr TTSR+
=∴

133/14/2006© 2005 Hitachi Global Storage Technologies
HDD Throughput Bound
We will be interested in the special case where all the zones have the same number of cylinders:
For this special case
For a system with M streams, the per stream data-rate bound will be
CNzCCC =−=== )1()1()0( L
z
N
i i
NzS
Sz∑ == 1
)(
MRRM =*

143/14/2006© 2005 Hitachi Global Storage Technologies
Range of HDD Sustained Data-Rates for an Example 400GB HDD

153/14/2006© 2005 Hitachi Global Storage Technologies
Command Time in General
The total time for a read command can be expressed as
Tc = CMD Setup + Seek + Rotational Latency + Read + Re-read
Rotational Latency
Starting position (last LBA of previous command)
diskrotation
Read Data
Seek
163/14/2006© 2005 Hitachi Global Storage Technologies
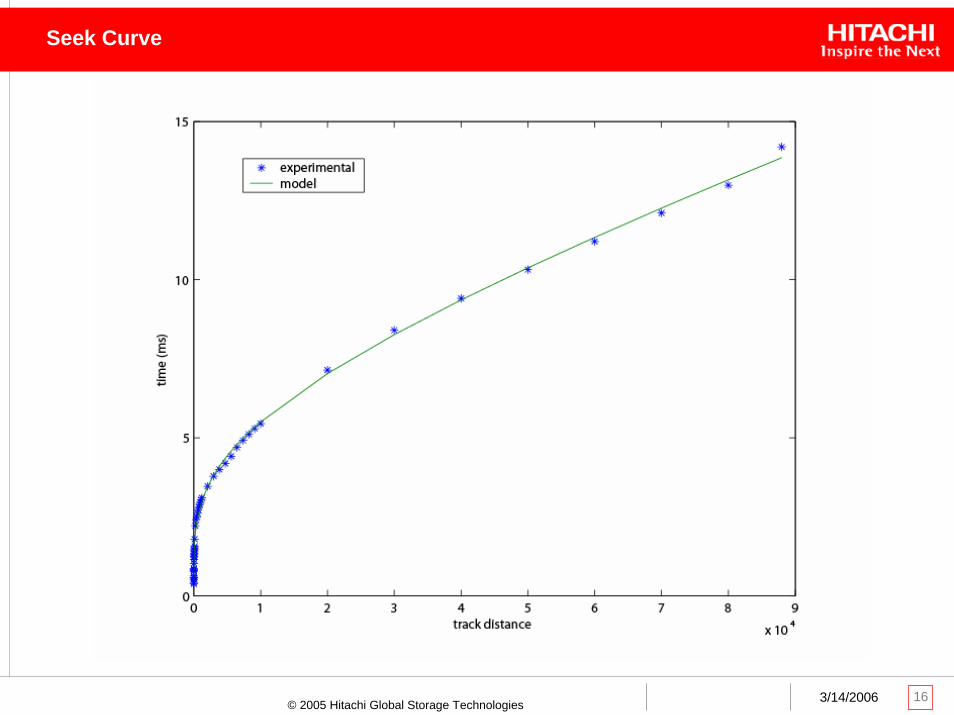
Seek Curve

173/14/2006© 2005 Hitachi Global Storage Technologies
Command Queuing
Command 1
Command 4
Command 3
Command 2
HDDHost
Data 1
Data 2
Data 3
Data 4
Command 1
Command 2
Command 3
Command 4
Main MemoryCommand Queue

183/14/2006© 2005 Hitachi Global Storage Technologies
Queued Commands
Most modern 3.5” HDDs have queues that can be used to improve throughput. Imagine that the commands are received in sequential order, that is, command 1, command 2, command 3 and command4. Only the commands themselves are sent to the HDD. The data for any write commands is still in the host waiting for the command to start executing.
Command 1Command 1
Command 2Command 2Command 4Command 4
Command 3Command 3
4 3 2 1
The figure below illustrates the execution of the commands in the order in which they were received, that is, it is a FIFO queue

193/14/2006© 2005 Hitachi Global Storage Technologies
HDD Throughput Optimization
Command 1Command 1
Command 2Command 2Command 4Command 4
Command 3Command 3
In order to improve throughput, the HDD typically will reorder the execution of the commands in an attempt to minimize the overall time required to execute all the commands.
4 3 2 1
The figure below illustrates the execution of the commands in the throughput optimized order
3 1 4 2Commands reordered to improve throughput
203/14/2006© 2005 Hitachi Global Storage Technologies
Write Cache
Write cache functions similar to a Queue in some respects, but is completely transparent to the host.
When write cache is enabled, • Write commands cause the data to be transferred to the HDD’s buffer and the
command returns “immediately”.• Several commands can be queued up in the HDD’s write cache.• After some a number of commands have been accumulated, or there is some free
time, the HDD transfers (de-stages) the data to the disk.• The Host system has no control over the time when this will happen, other than being
able to send a flush cache command that forces the HDD to de-stage the pending write commands immediately.
• The write commands can be (and often are) reordered in order to improve throughput.

213/14/2006© 2005 Hitachi Global Storage Technologies
Write Cache
Command 1
Command 4
Command 3
Command 2
HDDHost
Data 1
Data 4
Data 3
Data 2
Main MemoryWrite Cache

223/14/2006© 2005 Hitachi Global Storage Technologies
Read Cache
The read cache in an HDD serves the same purpose as the memory caches in microprocessors. In addition, the cache in the HDD is also used for some opportunistic predictive reading.
As shown in the figure below, the HDD can read (configurable) a certain amount of data located immediately before and after the data being requested.
head lands here
ZLR prefetch lookahead prefetchread data

233/14/2006© 2005 Hitachi Global Storage Technologies
Part III: HDD Performance Issues for AV Applications
Measures of Performance
Parameters affecting performance
Methods of access and their impact on performance
Methods of data storage allocation and impact on performance
243/14/2006© 2005 Hitachi Global Storage Technologies
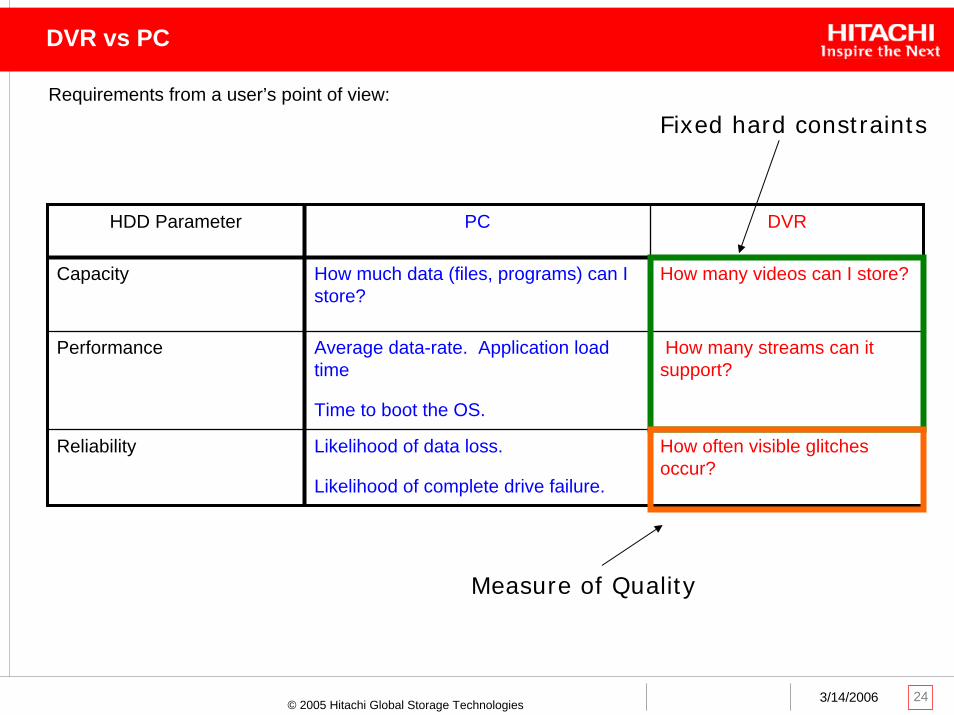
DVR vs PC
Requirements from a user’s point of view:
HDD Parameter PC DVR
Capacity How much data (files, programs) can I store?
How many videos can I store?
Performance Average data-rate. Application load time
Time to boot the OS.
How many streams can it support?
Reliability Likelihood of data loss.
Likelihood of complete drive failure.
How often visible glitches occur?
Fixed hard constraints
Measure of Quality

253/14/2006© 2005 Hitachi Global Storage Technologies
System Performance
Example: How does the system behave in terms of rpm?
10-0
10-1
10-2
10-3
10-4
Glit
ches
-per
-hour
3200 3400 3600 3800 4000 4200
5 streams
4 streams
3 streams
Quality Constraint
rpm

263/14/2006© 2005 Hitachi Global Storage Technologies
Effect of Storing Algorithm
Depending on how files are stored, the stream might get “stuck” at the ID where it is more vulnerable to glitches.
Rea
d b
uff
er lev
el
time
Stream at MD
Stream underflow
Stream at the ID
Buffer Size

273/14/2006© 2005 Hitachi Global Storage Technologies
Buffer Level
0
4
8
12
16
20
24
28
0 20 40 60 80
Buffer Level
Time (ms)
Dat
a (M
B)
Normal operation A glitch occurs and we consume 1 track of redundancy.
Recovery period
Normal operation
283/14/2006© 2005 Hitachi Global Storage Technologies
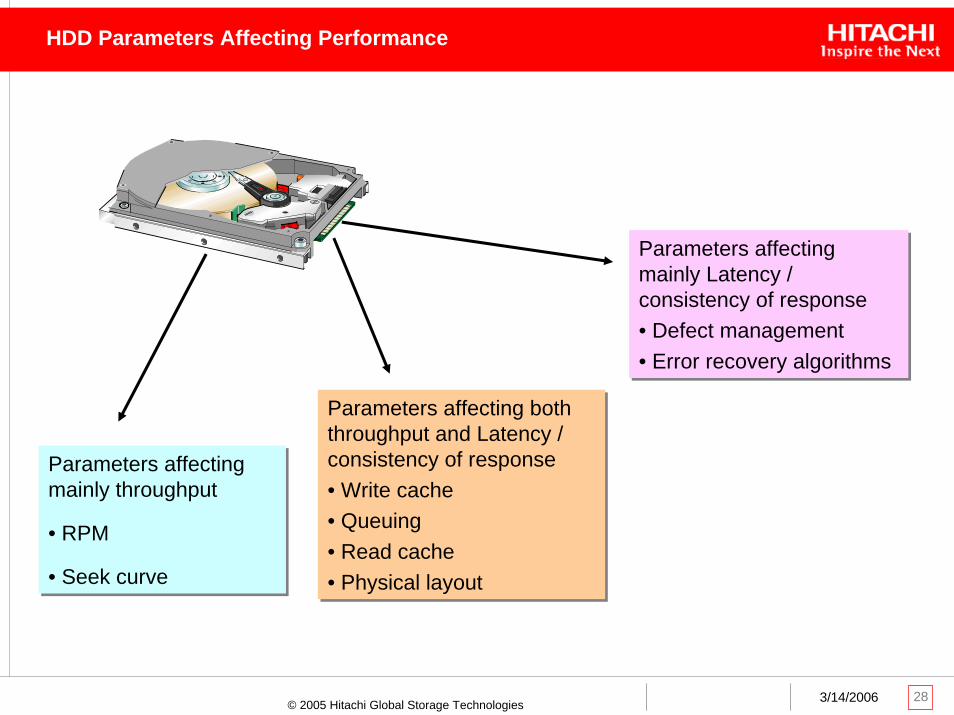
HDD Parameters Affecting Performance
Parameters affecting mainly throughput
• RPM
• Seek curve
Parameters affecting mainly throughput
• RPM
• Seek curve
Parameters affecting both throughput and Latency / consistency of response• Write cache• Queuing• Read cache• Physical layout
Parameters affecting both throughput and Latency / consistency of response• Write cache• Queuing• Read cache• Physical layout
Parameters affecting mainly Latency / consistency of response• Defect management • Error recovery algorithms
Parameters affecting mainly Latency / consistency of response• Defect management • Error recovery algorithms

293/14/2006© 2005 Hitachi Global Storage Technologies
File System and Performance
HDD
Stream Buffers
Read Buffers
Write Buffers • File 1
• File 2
• File 3
• File 4
• File 5
• …
File SystemStorage Device
1 5 3 …
Data Layout•How to organize data on the surface of the disk. •For each new file, decide which free blocks to use for storing the new file.
Scheduling Algorithms•Determines in what order access requests should be satisfied.•Algorithms will control the trade-off between QoS and throughput.
Metadata, File Structures and Interface
•How should files be represented. •Allocation unit size•Size of block access
303/14/2006© 2005 Hitachi Global Storage Technologies
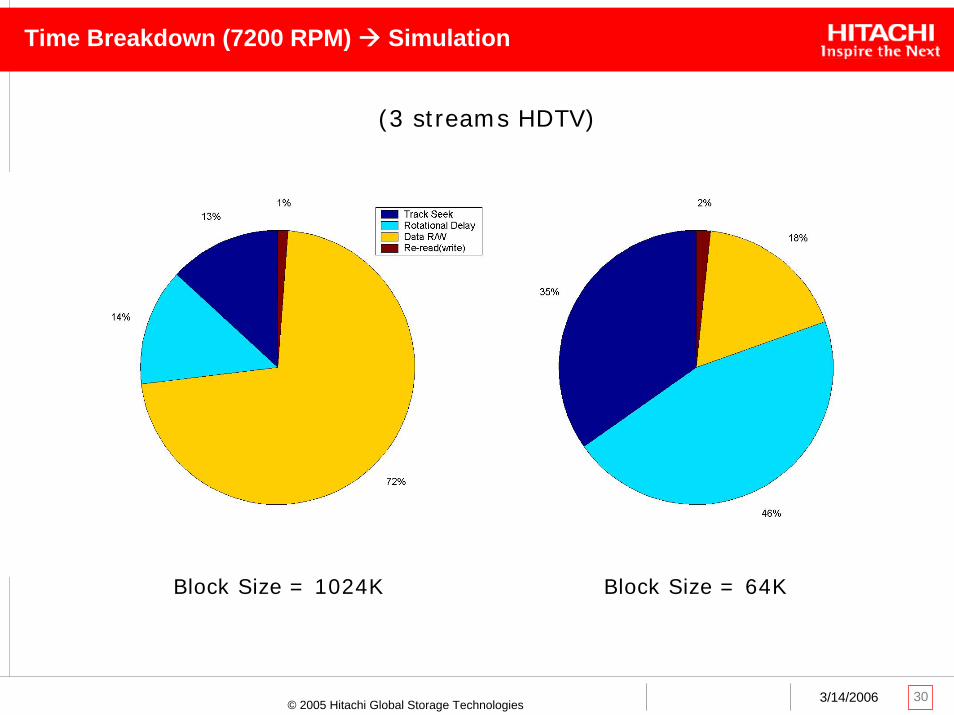
Time Breakdown (7200 RPM) Simulation
Block Size = 1024K Block Size = 64K
(3 streams HDTV)

313/14/2006© 2005 Hitachi Global Storage Technologies
HDTV 2 Streams ID
• Rpm 3600, Sb = 512(sectors)
• Poor performance
• High number of glitches
323/14/2006© 2005 Hitachi Global Storage Technologies
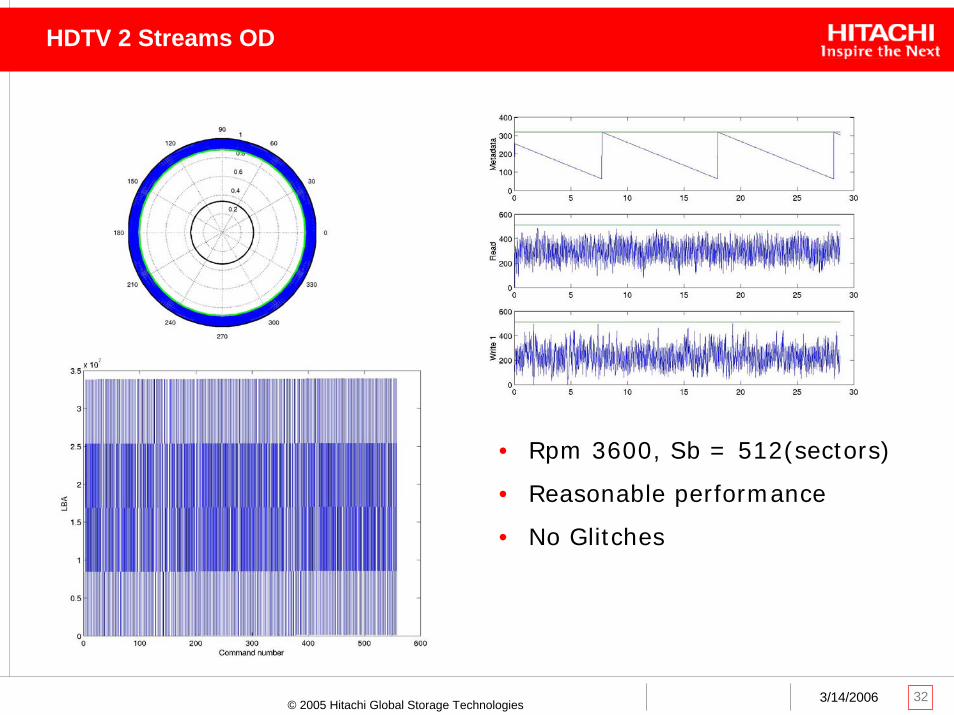
HDTV 2 Streams OD
• Rpm 3600, Sb = 512(sectors)
• Reasonable performance
• No Glitches

333/14/2006© 2005 Hitachi Global Storage Technologies
HDTV 2 Streams ID - OD
• Rpm 3600, Sb = 512(sectors)
• Very Poor performance
• Very large number of glitches

343/14/2006© 2005 Hitachi Global Storage Technologies
Scheduling Algorithms
In order to maximize throughput stream requests can handled in the order that minimizes the intra-stream switching time.• That is, the block requests are sorted in terms of LBA and accesses are made in this
order.• This scheduling is called SCAN.• The latency for a particular stream can be very large and therefore large buffers may
be required.
In order to minimize latency requests can be handled in the order of priority• That is, the stream who’s buffer is about to overflow (underflow) is serviced first, and
so on.• This is called EDF (earliest deadline first).• Since large seeks can be necessary for guaranteeing low latency, this solution may
have low throughput.
There are several algorithms in between the two extremes.• SCAN-EDF• Group Sweep Scheduling (GSS)• Round-robin
ATA-7 can help handle mixed traffic• Put deadlines for best-effort traffic so as to prevent it from disrupting real-time traffic.• Put deadlines in real-time traffic to avoid one stream depleting all streams.

353/14/2006© 2005 Hitachi Global Storage Technologies
Worst-case Analysis: HDD Throughput Upper Bound
In an HDD, the number of sectors in a track varies from zone to zone. Hence, for each zone, z, we have S(z) sectors per track and therefore
The average data-rate for reading the entire HDD from OD to ID. If Nz is the number of zones and C(z) the # of cylinders in zone z we have
)1()1(
)()(
)()(11
1 srsr
N
i iiN
iii TT
STTD
zSzC
zRzCD
R
z
z
+=
+==
∑∑
=
=
Swhere
)1()()(sTTr
zSzR+
=
is the average # of sectors per track and D is the # of cylinders.
)1()(
sr
IDID
TTzSR+
=The data-rate of the slowest zone (ID) is often a practical bound on the performance of several systems.

363/14/2006© 2005 Hitachi Global Storage Technologies
Worst-case Analysis: HDD Throughput “Lower” Bound
If we use the HDD in a “regular” file system, but with the read/write requests always for SB bytes, then the following worst-case data-rate is achieved
⎟⎟⎠
⎞⎜⎜⎝
⎛++++
=
−1*0 )(2
1)()(
*0
zN
BBzsCMD
BB
RS
zRSdTT
SSRτ
where
{ }0
00
)(2maxarg1,,1,0
*0
z
Bzs
Nz RSdTz
z
+=−∈ K

373/14/2006© 2005 Hitachi Global Storage Technologies
Performance Lower Bound for 8 Streams on an Example 400GB HDD

383/14/2006© 2005 Hitachi Global Storage Technologies
HDD Reliability
For desktop HDDs, reliability is usually specified through:• A Hard Error Rate (HER).• A Mean Time Between Failures (MTBF).
The hard error rate indicates the probability of losing a small amount of data (usually a sector) after completion of an error recovery procedure. e.g. One error per 1014 bits read after ERP.
The MTBF specifies the catastrophic failure rate for a population of HDDs.
Another important metric for AV performance is the commandcompletion time distribution. • IT applications require good
average performance, but canhave a wide variance in commandcompletion times.
• AV applications may trade off average performance to achievemore consistent response times.
response time
System optimized for:best average performanceconsistent performance

393/14/2006© 2005 Hitachi Global Storage Technologies
Hard Error Rate
ERP Step Number Completed
Frac
tion
of U
nrea
dabl
e
10−3
0 1 2 … N−1 N
10−6
3 4 5
10−9
10−12
first second read
last ERP step
Sector failure rate on the first read depends on seek settling time.
The principal failure mechanism on the 1st read is typically not repeatable (e.g. TMR), so after the second read the error probability is roughly
Sector hard error rate (usually caused by scratches, HDI events, etc.) must be betterthan ~10−11. (one error in 1014 bits read)
Note: This is an illustration only, not real

403/14/2006© 2005 Hitachi Global Storage Technologies
Mean Time Between Failure (MTBF)
What does it mean to have a MTBF of 1.2M hours (137 years)?During the period of useful life of the HDD, we assume an exponential failure density function f(t) = λ exp (−λx) with a constant failure rate λ.The average time to failure is MTBF = 1/λ = 1.2M hours.In reality, we do not expect the HDD to be in use for 1.2 M hrs, so the MTBF is used to provide the expected rate for a large population of HDDs.For example, with 1000 HDDs with 1.2M hour MTBF running for one year, the expected number of failures is 1000 x 365 x 24 / 1.2M = 7.3.
early failures
wearout failures
random failures
useful lifeHDD test
Reliability "Bathtub" Curve
Time
failu
re ra
te

413/14/2006© 2005 Hitachi Global Storage Technologies
Power Consumption And Thermal Management
Additional power states:• Unload Idle
– 7200 rpm, head unloaded– Recovers in ~0.7 sec.
• Low RPM Idle– 4500 rpm, head unloaded– Recovers in ~4 sec.
Quiet seek mode saves about 2.4 W.
SATA power consumption is worse than PATA by about 0.6W.Expected improvement throughSATA link power management.
Thermal management will impact HDD reliability.• Thermal specification typically 5 to 55 degrees C (operating).
Top cover can be at 60 degrees C.• Mounting and airflow are extremely important.
Deskstar 7K250 (PATA) PowerPower Mode Power (W)
Idle 5.24
Low RPM Idle 2.72
Unload Idle 4.04
Random R/W30% seek, 45% R/W, 25% idle
9.7
Silent Random R/W 7.3
Standby 0.93
Sleep 0.68

423/14/2006© 2005 Hitachi Global Storage Technologies
HDD Acoustics Measurements
Anechoic sound chamber
Sound intensity mapping locates noise
Binaural head forsound quality
Scanning LDV for mode analysis

433/14/2006© 2005 Hitachi Global Storage Technologies
HDD Acoustics Specifications
Mobile Desktop Server
Idle 23 dBA 31 dBA 34 dBA
Seek 27 dBA 35 dBA 44 dBA
Acoustic Environment Sound Pressure
Threshold of hearing 0 dBA
Rustling Leaves 10 dBA
Quiet Library 35 dBA
Business Office 65 dBA
Busy Street 85 dBA
Threshold of Pain 140 dBA
Typical Sound Levels (A-Weighted Pressure)
Typical HDD Acoustic Specifications (A-Weighted Power)
In a hemisphericanechoic chamber at 1m from the noise source,subtract 8 dBAto get the sound pressure
443/14/2006© 2005 Hitachi Global Storage Technologies
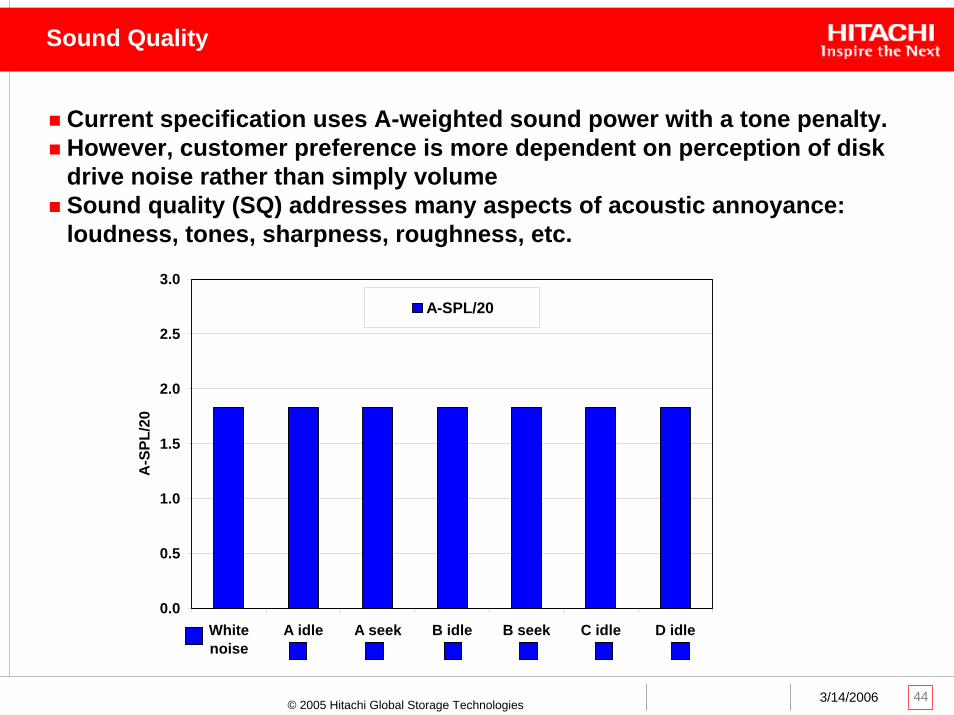
Sound Quality
0.0
0.5
1.0
1.5
2.0
2.5
3.0
Whitenoise
A idle A seek B idle B seek C idle D idle
A-S
PL/2
0
A-SPL/20
Current specification uses A-weighted sound power with a tone penalty.However, customer preference is more dependent on perception of disk drive noise rather than simply volumeSound quality (SQ) addresses many aspects of acoustic annoyance:loudness, tones, sharpness, roughness, etc.

453/14/2006© 2005 Hitachi Global Storage Technologies
Quiet Seek
Seek Length Versus Seek Time(Data for Illustration Only)
Depending on the specific product, quiet seek provides an improvementof up to 5 dBA in emitted sound power compared to performance seek mode, in addition to a significant improvement in sound quality.
Use of quiet seek may also reduce power consumption by ~2.5 W compared to performance seek.
Quiet seek also increases full volume seek times by about a factor of two.
For AV applications, with large block IOs, quiet seek providesa significant benefits with minimal reduction in performance.

463/14/2006© 2005 Hitachi Global Storage Technologies
System Level Acoustics Measurements
Amplify
Attenuate
Example: Impact of a system box on sound pressure level.
HDD by itself is normalized to 0dBA
Incorrect mounting of the HDD can cause the system box to act as a resonator for the HDD acoustic noise. Careful mounting and system design are required in order to create a low noise system.

473/14/2006© 2005 Hitachi Global Storage Technologies
Hemi-Anechoic Chamber Measurements
Source Sound Power (dBA)
VCR slow FF (from play) 40.8small cheap TV 44VCR fast FF (from stop) 55.7
background noise level 26.2CD player (playing) 26.4DVD player (playing) 27.5VCR (playing) 36.9PVR (playing) 37PVR (rewinding at 15x) 37.3PVR (skipping at 300x) 38.2
Measurements from typical CE devices in a hemi-anechoic chamber.
Typical desktop HDD 30-35 dBA

483/14/2006© 2005 Hitachi Global Storage Technologies
New Emerging High Performance Multi-Stream Applications• Multi head DVR systems.• DLNA compliant Digital Media Servers.• AV streaming combined with IT traffic.
Performance Metrics:• Stream Performance: How many streams can you support, at what bit rate,
with what trick-play features?• Quality of Service: How frequently do your streams get interrupted (i.e. how
often do video glitches occur in the system)?
Objectives:• Minimize the probability of stream
buffer underflows and overflows.• Achieve a reasonable throughput &
latency tradeoff with IT traffic,without allowing the IT traffic tointerfere with AV traffic.
• Increase system margin to allow theuse of quiet seek.
Performance For AV Streaming Applications
response time
System optimized for:best average performanceconsistent performance
493/14/2006© 2005 Hitachi Global Storage Technologies
Specify Time Limits on Commands• Can either abort or suspend the command if the time limit is not met.• If the command is suspended, it can be resumed at a later time.
Read Continuous Mode• The HDD will attempt to read data once, and will return with a list of sectors
which it read and which it failed to read.• The system can decide whether to attempt to re-read data which was missed on
the previous attempt.
The commands provide a mechanism for ensuring Quality of Service(QoS) in streaming applications.
ATA-7 AV Streaming Commands

503/14/2006© 2005 Hitachi Global Storage Technologies
QoS For AV Streaming Applications
Input AV Streams Output AV Streams
ATA7 Hard Disk Drive
ATA7 Device Driver
Best Effort (IT)Applications(GUI, EPG, photo browsing,music playlists, etc.)
Other IT Data
Wri
teB
uffe
rs
Rea
dB
uffe
rs
Application Layer
Real Time (AV) Applications
File System
Real-Time (AV) Data
OS Scheduler
CommandScheduler
NomenclatureReal-TimeTraffic
Best EffortTraffic
Best Effort (IT) Data

513/14/2006© 2005 Hitachi Global Storage Technologies
Security For Embedded HDDs In CE Devices
All data (AV content and non-AV data) is stored in encrypted form.Non AV-data may include:• Encrypted digital rights information (licenses, permissions, pay-per-view credits).• Other types of state information, depending on STB features.• Software modules and system configuration data.Security concerns• Attacker may attach HDD to a PC and read or write all of the data.• Easy to mount offline attack against CA scheme.• May attack state information on the HDD.
Requirements• Mutual authentication between HDD and host, and secure session.
encrypted content from satellite or cable
hacker’s PCembedded HDD
otherencrypted
encryptecontent
secret key(s) knownonly to STB
STB HWsmart card
STB
encr
ypt &
de
cryp
t
TRM

523/14/2006© 2005 Hitachi Global Storage Technologies
Summary


