Page 1
1
High Resolution Site Characterization of a PAH
contamination in Gent, BelgiumBy application of the Optical Image Profiler (OIP)
Martijn Naert, EnISSA, Belgium, Pieter Buffel, EnISSA, Belgium
Wim Vansina, Witteveen+Bos; Annelies van Gucht, OVAM
Page 2
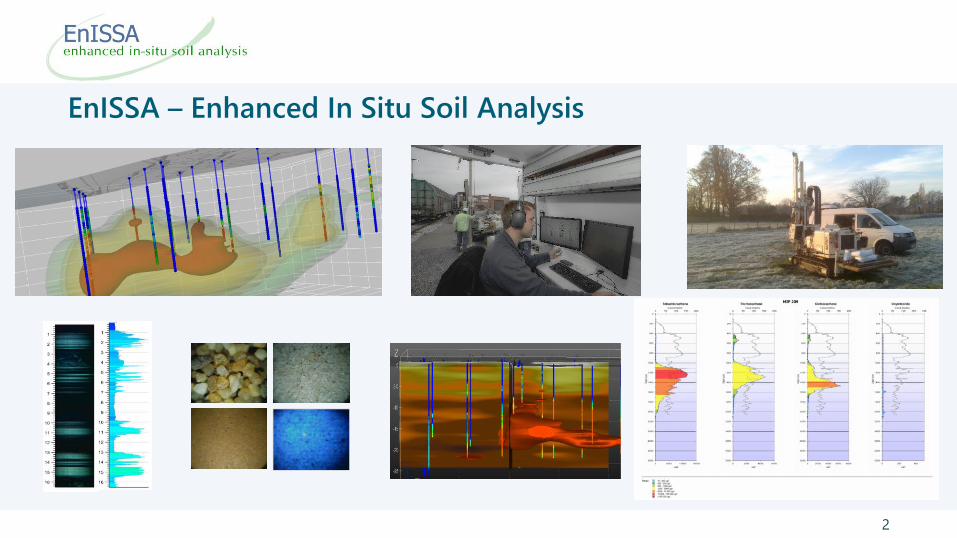
EnISSA – Enhanced In Situ Soil Analysis
2
Page 3
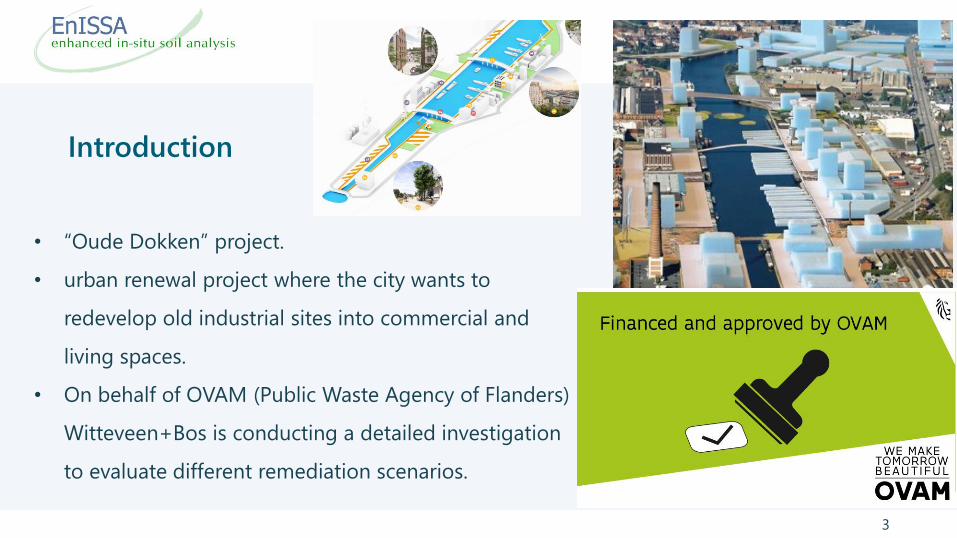
Introduction
3
• “Oude Dokken” project.
• urban renewal project where the city wants to
redevelop old industrial sites into commercial and
living spaces.
• On behalf of OVAM (Public Waste Agency of Flanders)
Witteveen+Bos is conducting a detailed investigation
to evaluate different remediation scenarios.
Page 5
History
5
˗ Industrial activities starting from late 19
century
˗ Starting with a treatment facility for
railway sleepers
˗ To a storage yard for fuels and coal with
a repair shop, including a pit for oil
changes
˗ And finally a metal scrapyard
Page 6
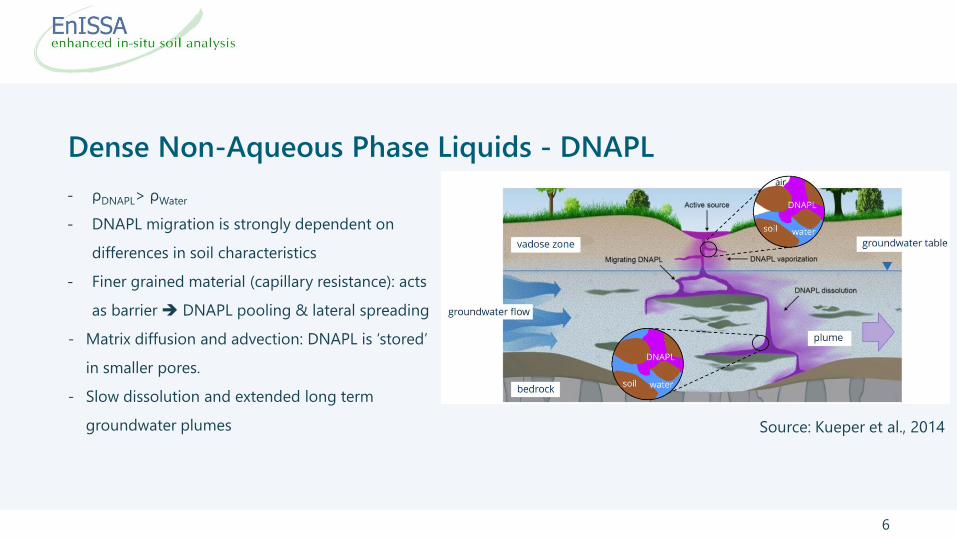
Dense Non-Aqueous Phase Liquids - DNAPL
6
˗ ρDNAPL> ρWater
˗ DNAPL migration is strongly dependent on
differences in soil characteristics
˗ Finer grained material (capillary resistance): acts
as barrier ➔ DNAPL pooling & lateral spreading
- Matrix diffusion and advection: DNAPL is ‘stored’
in smaller pores.
- Slow dissolution and extended long term
groundwater plumes Source: Kueper et al., 2014
Page 7
Hight resolution site characterization - HRSC
7
˗ Previous attempts at characterizing the contamination on
site were unsuccessful.
˗ A HRSC approach was proposed with an initial grid layout
using the Optical Image Profiler (OIP).
˗ The results from this initial screening, guided the
subsequent soil and groundwater sampling campaign.
Page 8
OIP probe (© Geoprobe)
8
˗ The OIP probe uses a 275-nm UV LED
light source and optimized CMOS
camera to excite and capture in-situ
contaminants at 30fps.
˗ Visible light LED is present to view and
inspect subsurface lithology.
˗ Also included is an EC dipole to indicate
what type of lithology is present.
Page 9
UV fluorescence, how does it work?
9
˗ Fluorescence works on the principle that photons of
a certain wavelength are absorbed by a molecule,
thereby exciting an electron. When this electron
changes back to its ground state another photon is
released.
˗ The absorption and emission patterns are
different for each molecule.
Page 10
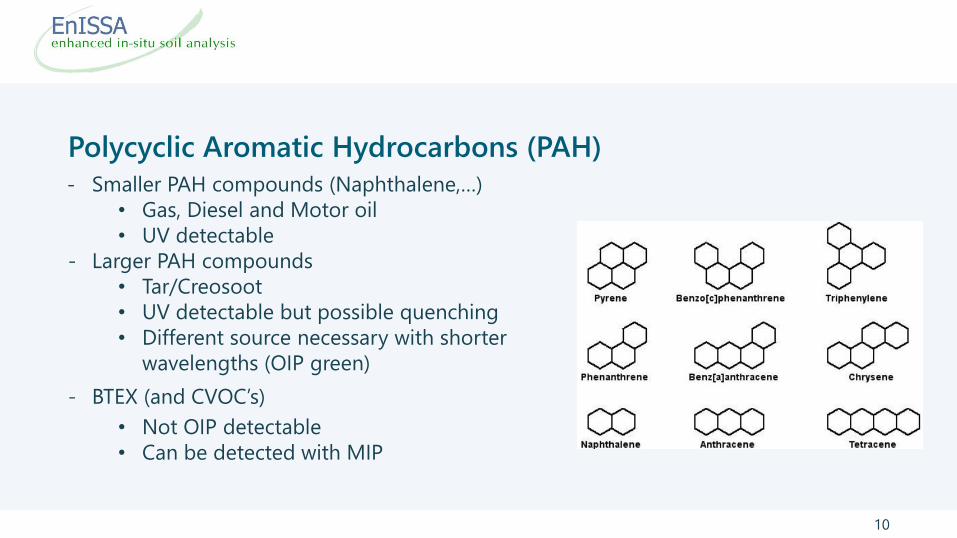
Polycyclic Aromatic Hydrocarbons (PAH)
10
˗ Smaller PAH compounds (Naphthalene,…)
• Gas, Diesel and Motor oil
• UV detectable
- Larger PAH compounds
• Tar/Creosoot
• UV detectable but possible quenching
• Different source necessary with shorter
wavelengths (OIP green)
- BTEX (and CVOC’s)
• Not OIP detectable
• Can be detected with MIP
Page 11
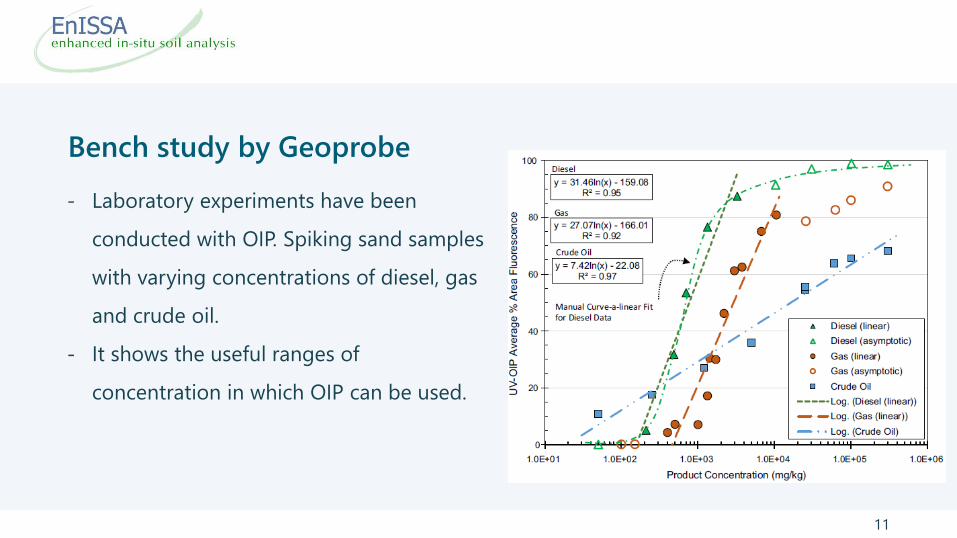
Bench study by Geoprobe
11
˗ Laboratory experiments have been
conducted with OIP. Spiking sand samples
with varying concentrations of diesel, gas
and crude oil.
˗ It shows the useful ranges of
concentration in which OIP can be used.
Page 12
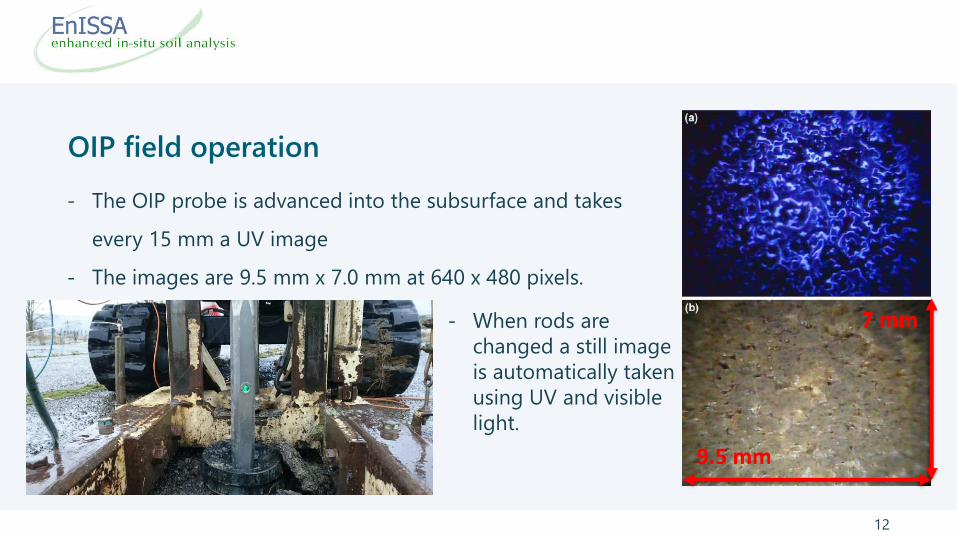
OIP field operation
12
˗ The OIP probe is advanced into the subsurface and takes
every 15 mm a UV image
˗ The images are 9.5 mm x 7.0 mm at 640 x 480 pixels.
7 mm
9.5 mm
˗ When rods are
changed a still image
is automatically taken
using UV and visible
light.
Page 13
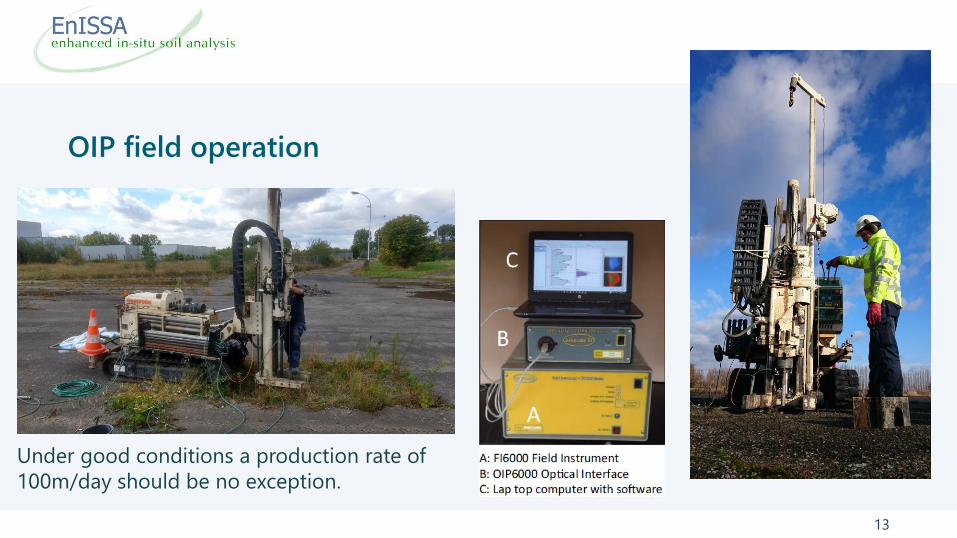
13
Under good conditions a production rate of
100m/day should be no exception.
OIP field operation
Page 14
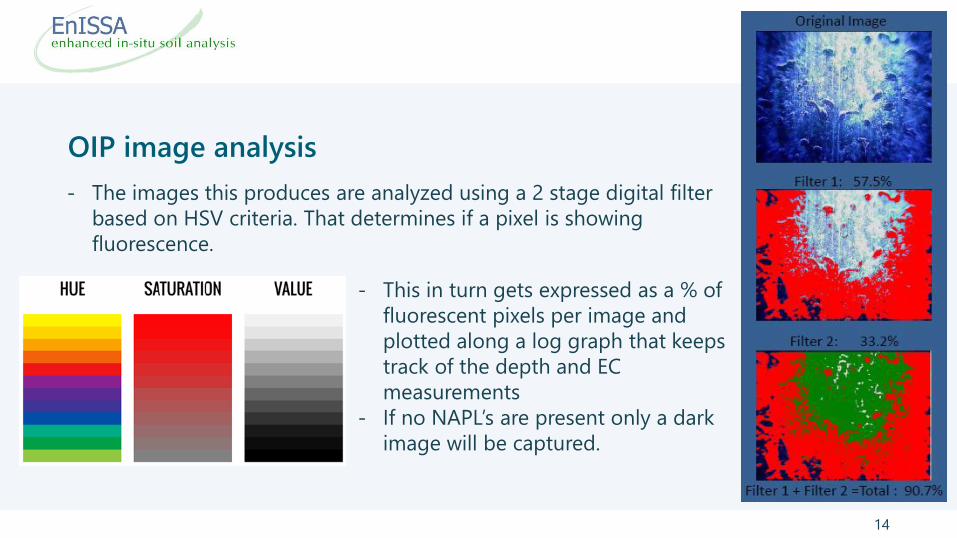
OIP image analysis
14
˗ The images this produces are analyzed using a 2 stage digital filter
based on HSV criteria. That determines if a pixel is showing
fluorescence.
˗ This in turn gets expressed as a % of
fluorescent pixels per image and
plotted along a log graph that keeps
track of the depth and EC
measurements
˗ If no NAPL’s are present only a dark
image will be captured.
Page 15
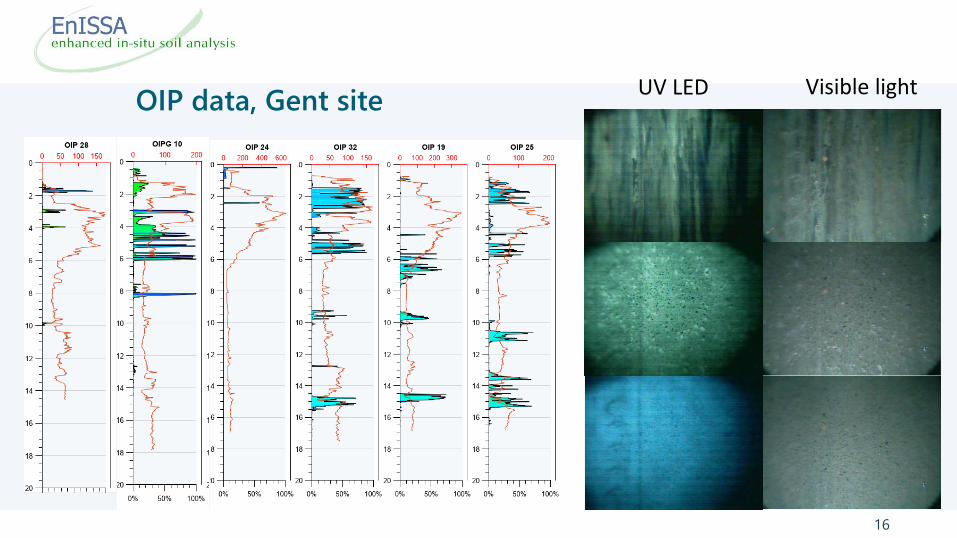
OIP profile
15
˗ On de right is an example profile with
EC (Electrical Conductivity) and UV
fluorescence %.
˗ The red dots on the right indicate
locations that have still images using
alternating UV and visible light.
˗ EC generally is an indicator for grain
size.
Page 16
16
UV LED Visible lightOIP data, Gent site
Page 17
www.EnISSA.com
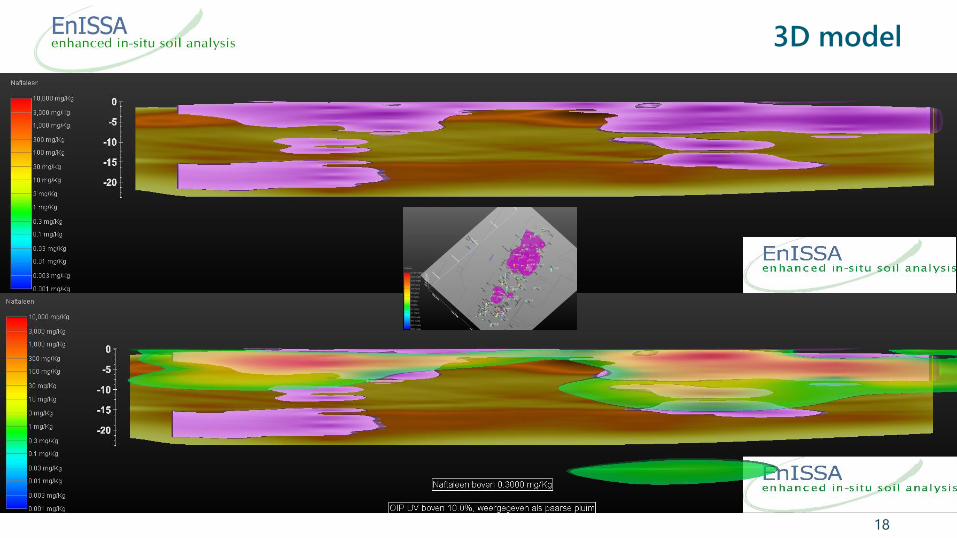
OIP data, Gent site
Page 20
20
Time and cost efficient collection of horizontal and vertical qualitative information on
the contaminant distribution.
OIP profiles help to understand and explain the very heterogeneous dispersion of this
type of contaminants
Approaching a contaminated site from different technological angles helps to cover
the weaknesses inherent to each data type. Multiple lines of evidence will get us
closer to the ground truth
Page 21
www.enissa.com
@EnISSA -Enhanced in Situ Soil Analysis
Gorislaan 491820 SteenokkerzeelTel +32 2/759.59.30
[email protected] [email protected]