1 Travis Perkins plc Full year results for the twelve months ended 31st December 2020 Resilient trading amidst significant uncertainty Highlights ● Continued progress on strategic agenda across digital enablement, customer fulfilment, process simplification and branch network rationalisation despite the challenges of Covid-19 ● Toolstation strong outperformance maintained with like-for-like growth of 22.2%; branch rollout continues at pace in UK and Europe ● Robust H2 recovery in Merchanting and P&H driven by RMI demand ● Wickes taking market share in core DIY with like for like revenue growth of 19.3%**; demerger process recommenced ● Strong free cashflow generation; covenant net debt reduced by £304m to £40m; successful refinancing of September 2021 bond £m (unless otherwise stated) Note FY 2020 FY 2019 Change Revenue 6,158 6,956 (11.5)% Like-for-like revenue growth 1 18 (7.1)% 3.8% (10.9)ppt Adjusted operating profit 1 6a 227 442 (48.6)% Adjusted earnings per share 1 12b 42.4p 112.7p (62.4)% ROCE 1 16f 5.5% 10.1% (4.6)ppt Covenant net debt 1 15a 40 344 (304) Dividend per share 13 0.0p 15.5p Operating profit 77 232 Total (loss) / profit after tax (22) 123 Basic (loss) / earnings per share 12a (8.8)p 48.9p (1) Alternativ e perf ormance measures are used to prov ide a guide to underly ing perf ormance. Details of calculations can be f ound in the notes listed Financial headlines ● Total revenue from continuing businesses returned to growth in H2 at 1.4%*, demonstrating the resilience of the Group’s business models ● Adjusted operating profit of £227m reflecting lower volumes partially offset by actions to reduce operating costs, including both short term controls and acceleration of longer term plans, coupled with appropriate government support in the merchant businesses ● Delivered £120m annualised cost savings with the focus on strengthening the core business by closing smaller, subscale branches and delayering management ● Net adjusting items of £140m, primarily relating to the restructuring programme *Total Group rev enue excluding Tile Giant and Primaf low F&P which were disposed during 2020. Toolstation Europe is included as if f ully consolidated f or both 2019 and 2020. ** On a calendar y ear basis. For the 52 weeks to 26th December 2020 Wickes Core like-f or-like sales were +18.8%
Transcript
1
Travis Perkins plc
Full year results for the twelve months ended 31st December 2020
Resilient trading amidst significant uncertainty
Highlights
● Continued progress on strategic agenda across digital enablement, customer fulfilment, process simplification and branch network rationalisation despite the challenges of Covid-19
● Toolstation strong outperformance maintained with like-for-like growth of 22.2%; branch rollout continues at pace in UK and Europe
● Robust H2 recovery in Merchanting and P&H driven by RMI demand ● Wickes taking market share in core DIY with like for like revenue growth of 19.3%**;
demerger process recommenced ● Strong free cashflow generation; covenant net debt reduced by £304m to £40m;
Adjusted earnings per share1 12b 42.4p 112.7p (62.4)%
ROCE1 16f 5.5% 10.1% (4.6)ppt
Covenant net debt1 15a 40 344 (304)
Dividend per share 13 0.0p 15.5p
Operating profit 77 232
Total (loss) / profit after tax (22) 123
Basic (loss) / earnings per share 12a (8.8)p 48.9p
(1) Alternativ e perf ormance measures are used to prov ide a guide to underly ing perf ormance. Details of calculations can be f ound in the notes listed
Financial headlines
● Total revenue from continuing businesses returned to growth in H2 at 1.4%*,
demonstrating the resilience of the Group’s business models
● Adjusted operating profit of £227m reflecting lower volumes partially offset by actions to
reduce operating costs, including both short term controls and acceleration of longer
term plans, coupled with appropriate government support in the merchant businesses
● Delivered £120m annualised cost savings with the focus on strengthening the core
business by closing smaller, subscale branches and delayering management
● Net adjusting items of £140m, primarily relating to the restructuring programme
*Total Group rev enue excluding Tile Giant and Primaf low F&P which were disposed during 2020. Toolstation Europe is included as if f ully consolidated
f or both 2019 and 2020.
** On a calendar y ear basis. For the 52 weeks to 26th December 2020 Wickes Core like-f or-like sales were +18.8%
2
Nick Roberts, Chief Executive Officer, commented:
“2020 was a year of unprecedented challenges and I am full of admiration for the energy and
determination of our colleagues to ensure the safety of our customers, suppliers and each
other.
Despite these challenges, we have shown great agility and versatility in adapting our working
practices, further digitalising our engagement with customers and reshaping our business to suit
the changing demands of our markets.
Our teams have also been able to make excellent progress on a number of key initiatives
supporting our strategic objectives, particularly around simplifying commercial deals and refining
our pricing architecture, which will drive future benefits.
In addition, I am pleased today to be able to confirm that the process to demerge Wickes has
recommenced. The Wickes digitally-led model has proved highly effective during the pandemic
and the business is in great shape to embark on its journey as a standalone entity.
Whilst uncertainty remains, we have seen a good recovery through the second half which gives
us confidence that the fundamental drivers in our markets are robust. The continuing progress
against our strategic plans leaves the Group well placed to outperform in those markets.”
Management are hosting a virtual results presentation at 10.00am. Please register at the following link: https://www.investis-live.com/travis-perkins/602407799a13881000ca64fe/nmsl
This announcement contains “f orward-looking statements” with respect to Trav is Perkins’ f inancial condition, results of operations and business and
details of plans and objectiv es in respect to these items. Forward-looking statements are sometimes, but not alway s, identif ied by their use of a date in
the f uture or such words as “anticipates”, “aims”, “due”, “could”, “may ”, “will”, “should”, “expects”, “believ es”, “seeks”, “ intends”, “plans”, “potential”, “reasonably possible”, “targets”, “goal” or “estimates”, and words of similar meaning. By their v ery nature f orward -looking statements are inherently
unpredictable, speculativ e and inv olv e risk and uncertainty because they relate to ev ents and depend on circumstances that will occur in the f uture.
There are a number of f actors that could cause actual results and dev elopments to dif f er materially f rom those expressed or implied by these f orward-
looking statements. These f actors include, but are not limited to, the Principal Risks and Uncertainties disclosed in the Group’s Annual Report and as updated in this statement, changes in the economies and markets in which the Group operates; changes in the legislativ e, regu latory and competition
f rameworks in which the Group operates; changes in the capital markets f rom which the Group raises f inance; the impact of legal or other proceedings
against or which af f ect the Group; and changes in interest and exchange rates. All f orward-looking statements, made in this announcement or made subsequently , which are attributable to Trav is Perkins or any other member of the Group or persons acting on their behalf are expressly qualif ied in
their entirety by the f actors ref erred to abov e. No assurances can be giv en that the f orward-looking statements in this document will be realised.
Subject to compliance with applicable law and regulations, Trav is Perkins does not intend to update these f orward-looking statements and does not
undertake any obligation to do so. Nothing in this document should be regarded as a prof its f orecast.
Without prejudice to the abov e:
(a) neither Trav is Perkins plc nor any other member of the Group, nor persons acting on their behalf shall otherwise hav e any liability whatsoev er f or
loss howsoev er arising, directly or indirectly , f rom the use of the inf ormation contained within this announcement; and
(b) neither Trav is Perkins plc nor any other member of the Group, nor persons acting on their behalf makes any representation or warranty , express or implied, as to the accuracy or completeness of the inf ormation contained within this announcement.
This announcement is current as of 2 March 2021, the date on which it is giv en. This announcement has not been and will not be updated to ref lect
any changes since that date.
Past perf ormance of the shares of Trav is Perkins plc cannot be relied upon as a guide to the f uture perf ormance of the shares of Trav is Perkins plc.
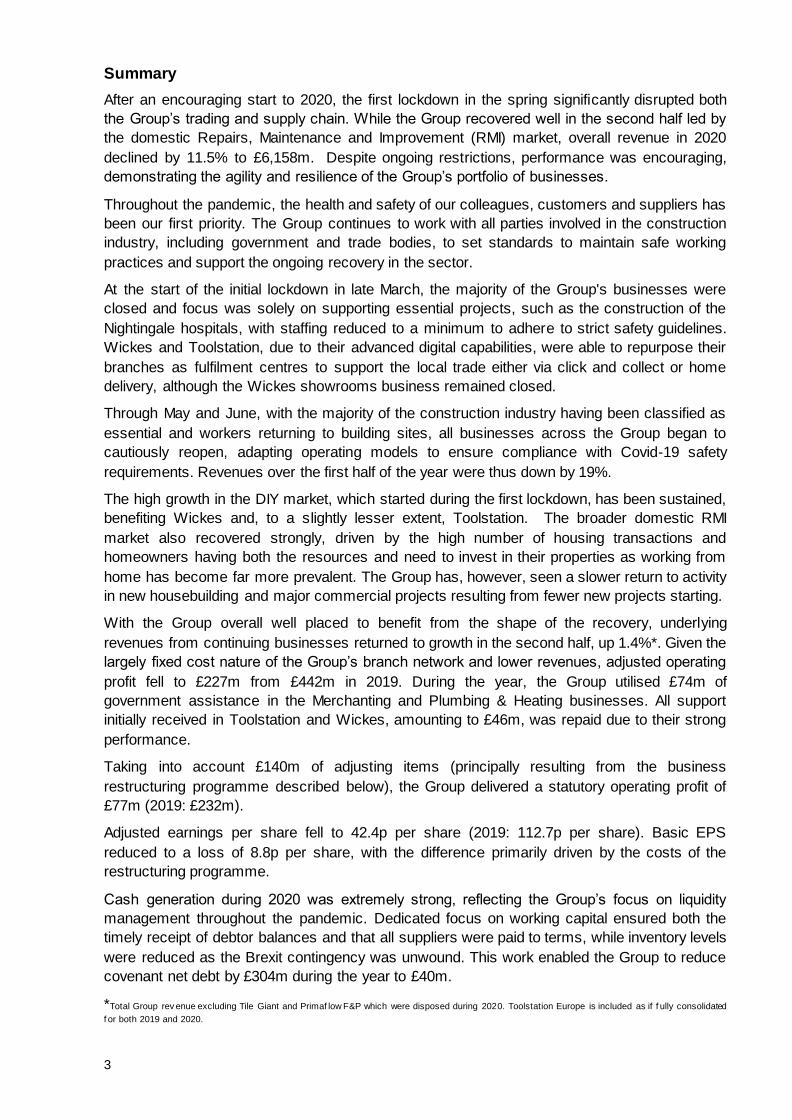
After an encouraging start to 2020, the first lockdown in the spring significantly disrupted both
the Group’s trading and supply chain. While the Group recovered well in the second half led by
the domestic Repairs, Maintenance and Improvement (RMI) market, overall revenue in 2020
declined by 11.5% to £6,158m. Despite ongoing restrictions, performance was encouraging,
demonstrating the agility and resilience of the Group’s portfolio of businesses.
Throughout the pandemic, the health and safety of our colleagues, customers and suppliers has
been our first priority. The Group continues to work with all parties involved in the construction
industry, including government and trade bodies, to set standards to maintain safe working
practices and support the ongoing recovery in the sector.
At the start of the initial lockdown in late March, the majority of the Group's businesses were
closed and focus was solely on supporting essential projects, such as the construction of the
Nightingale hospitals, with staffing reduced to a minimum to adhere to strict safety guidelines.
Wickes and Toolstation, due to their advanced digital capabilities, were able to repurpose their
branches as fulfilment centres to support the local trade either via click and collect or home
delivery, although the Wickes showrooms business remained closed.
Through May and June, with the majority of the construction industry having been classified as
essential and workers returning to building sites, all businesses across the Group began to
cautiously reopen, adapting operating models to ensure compliance with Covid-19 safety
requirements. Revenues over the first half of the year were thus down by 19%.
The high growth in the DIY market, which started during the first lockdown, has been sustained,
benefiting Wickes and, to a slightly lesser extent, Toolstation. The broader domestic RMI
market also recovered strongly, driven by the high number of housing transactions and
homeowners having both the resources and need to invest in their properties as working from
home has become far more prevalent. The Group has, however, seen a slower return to activity
in new housebuilding and major commercial projects resulting from fewer new projects starting.
With the Group overall well placed to benefit from the shape of the recovery, underlying
revenues from continuing businesses returned to growth in the second half, up 1.4%*. Given the
largely fixed cost nature of the Group’s branch network and lower revenues, adjusted operating
profit fell to £227m from £442m in 2019. During the year, the Group utilised £74m of
government assistance in the Merchanting and Plumbing & Heating businesses. All support
initially received in Toolstation and Wickes, amounting to £46m, was repaid due to their strong
performance.
Taking into account £140m of adjusting items (principally resulting from the business
restructuring programme described below), the Group delivered a statutory operating profit of
£77m (2019: £232m).
Adjusted earnings per share fell to 42.4p per share (2019: 112.7p per share). Basic EPS
reduced to a loss of 8.8p per share, with the difference primarily driven by the costs of the
restructuring programme.
Cash generation during 2020 was extremely strong, reflecting the Group’s focus on liquidity
management throughout the pandemic. Dedicated focus on working capital ensured both the
timely receipt of debtor balances and that all suppliers were paid to terms, while inventory levels
were reduced as the Brexit contingency was unwound. This work enabled the Group to reduce
covenant net debt by £304m during the year to £40m.
*Total Group rev enue excluding Tile Giant and Primaf low F&P which were disposed during 2020. Toolstation Europe is included as if f ully consolidated
f or both 2019 and 2020.
4
Strategic and operational progress
At a Capital Markets event in December 2018, the Group laid out its plans for the years ahead,
with two overarching strategic aims being (i) to focus on best serving trade customers, and (ii) to
simplify the business to increase agility, speed up decision making and enable a leaner cost
base.
During 2020, the Group has accelerated progress on a number of strategic initiatives, in some
cases driven by the need to adapt quickly and effectively to the challenges presented by the
Covid-19 pandemic but also as part of the overall drive for business process simplification.
Customer interaction
The Group has set out the objective of creating a “modern merchant” capable of omni-channel
interaction with customers in all of its businesses. The initial lockdown required a move to
predominantly remote transactions and, to support that shift, a number of projects were
delivered as outlined below:
● The Travis Perkins General Merchant website was rebuilt to significantly improve
information on product availability and facilitate a notable rise in web-based transactions;
● Portals to allow online account management were developed to enable customers to
obtain invoices or proof of delivery and make credit account payments;
● Good progress has been made on the development of customer apps that will enable
customers to interact via smartphone;
● Toolstation, which already had strong digital capability, was able to quickly move its IT
infrastructure to a new platform to support significantly more traffic and future proof the
business as it continues to grow at pace;
● The Benchmarx kitchens and joinery brand was integrated into the Travis Perkins
General Merchant to enable customers to purchase from either business via the same
credit account. Internal structures and incentive schemes have been adjusted to drive
cross-selling and win a greater share of existing customers’ spend;
● The rollout of a new delivery management system commenced, initially in Keyline and
CCF, which will optimise route planning and allow customers to track their deliveries.
Whilst a large proportion of trade has returned to traditional methods of purchase, these
developments have highlighted the significant opportunity presented by digitally led service,
reinforcing the requirement to continue to develop the Group’s digital capability across all
businesses.
Process simplification
In order to protect short term liquidity and also bring forward planned activity, the Group
commenced a programme working with suppliers which led to the netting out of over half of the
fixed price discount from current commercial arrangements across the Merchanting and
Plumbing & Heating businesses.
These changes form a key part of the ongoing work to improve cost price visibility in branch and
support local decision making. Conversations are well advanced with other key suppliers
regarding further significant netting of fixed price discounts into the invoiced price during 2021.
Alongside the changes to cost pricing outlined above, the Merchant businesses have simplified
selling price guidance available to the branch teams. These improvements provide greater
consistency of pricing and also more relevant shelf-edge pricing on lightside products, further
improving customer experience.
5
Restructuring Programme
In June 2020, reflecting the challenging outlook for the Group’s end markets and the fixed cost
nature of an extensive branch network, the Group announced a significant restructuring
programme which will result in the closure of around 190 branches across the Merchanting and
Plumbing & Heating segments. In addition, a number of support function roles were removed
across the business and head office resulting in a reduction of around 2,500 roles, equivalent to
9% of the workforce.
In the Travis Perkins General Merchant, branch closures targeted smaller, subscale branches
where either there were difficulties in operating safe social distancing practices, or where the
scale of the branch meant that profitability would be difficult in a lower volume environment. In
the specialist merchants, where the majority of sales are delivered to customer sites, the branch
closures were also focused on branches limited by size, geography or operational layout.
Across all merchant businesses, the restructuring programme has accelerated plans to close
these sites and, over time as demand rebuilds, establish larger branches that offer a greater
depth and range of stock, alongside more efficient warehousing and delivery operations.
Where branches have closed, sales retention has been in line with expectations, ranging from
around a third in smaller general merchant branches to over two-thirds in the specialist
merchants where the customer base comprises larger regional contractors allowing an easier
transfer of business to remaining branches.
The June restructuring programme will deliver gross cost savings of approximately £120m on
an annualised basis, with the majority of actions completed by the end of August 2020. As
volumes recover from the 2020 level, some variable overhead will be reinvested to support
increased activity. An adjusting item of £121m has been recognised in 2020 in relation to the
restructuring programme. Against the potential maximum cash restructuring costs of £85m
identified in June, around half is expected to be offset by freehold disposals and, since June,
this figure has been further reduced by satisfactory exit of around £10m of lease obligations.
Portfolio Actions
Having completed the vast majority of the work on the Wickes demerger, on 20 March 2020 the
Group announced that it had placed the process on hold in order to focus on managing through
the pandemic and to maximise liquidity across the Group. With the Group, and Wickes in
particular, having demonstrated the resilience of their operating models, the Board has taken
the decision to recommence the demerger process which is expected to complete in Q2 2021.
Wickes delivered an excellent performance during 2020 with like-for-like sales up 5.5%**, driven
by the strength of the Core DIY segment which saw like for like growth of 19.3%**, a trend
which has continued into 2021. Showroom closures have had a marked impact on Kitchen &
Bathroom sales, down (27.4)%** on a like-for-like basis over the year, and this has been
exacerbated in the early weeks of 2021 by the third national lockdown. Web-based leads
remain strong and indicate a level of pent up demand once restrictions are eased.
In line with previous plans, Wickes will have a capitalisation of around £130m as at the year
end, funded by Travis Perkins.
Allied to the Group’s stated objectives of simplifying the portfolio and focusing on the trade
customer, the Tile Giant business was sold in September 2020.
** On a calendar year basis. For the 52 w eeks to 26th December 2020 Wickes like-for-like sales w ere +5.0% with Core +18.8% and Kitchens & Bathrooms dow n (27.8)%
6
Although market conditions to date have not supported the sale of the core P&H segment, the
Group did take the opportunity to dispose of the low margin Primaflow F&P wholesale activity in
January 2020. It remains the intention of the Board to sell the remaining P&H business when
the time is right whilst in the short term continuing to drive operational improvements to enhance
returns further and to optimise value for shareholders.
Capital Markets Update
Travis Perkins’ aim post demerger is to continue its focus on delivering best-in-class service to
its trade customers and leveraging the market leading positions of its portfolio of businesses.
Management will frame the Group’s future ambitions with a Capital Markets Update in the
summer.
Dividend
Given the significant impact of the pandemic on financial performance and the risk to the
Group’s liquidity, the Board took the decision in March 2020 to suspend the dividend. The
Board recognises the importance of dividend distributions and intends to reinstate dividend
distributions in 2021 assuming there is no further deterioration in the external environment.
Outlook
The long term fundamentals of the Group’s end markets remain robust with ongoing demand for
new housing and underinvestment in the repair, maintenance and improvement of the existing
UK housing stock. This is further underpinned by the UK Government’s commitment to
infrastructure investment, alongside stimulus measures such as green home improvement
schemes.
End markets recovered well during the second half of 2020 with robust RMI activity outstripping
a lag in the commercial and housebuilding sectors. Performance to date in 2021 has followed a
similar trend despite the stricter lockdown conditions.
The Group continues to focus on strengthening its core business and investing to develop a
modern merchanting proposition which will leave the Group well placed to continue to
outperform its markets and generate value for shareholders.
Technical guidance
The Group’s technical guidance for 2021 is as follows:
● Effective tax rate of 20%
● Base capital expenditure of around £90m to £100m, excluding Wickes
● Property profits of around £20m
7
Segmental performance
Merchanting
FY 2020 FY 2019 Change
Total revenue £3,065m £3,703m (17.2)%
Like-for-like growth (14.0)% 3.3% (17.3)ppt
Adjusted operating profit* £152m £284m (46.5)%
Adjusted operating margin 5.0% 7.7% (270)bps
ROCE 7% 12% (5)ppt
Branch network 846 984 (138)
*Segmental adjusted operating profit figures are presented excluding property profits
After a solid start to the year, Trade Merchanting sales were severely impacted by the initial lockdown period with the majority of branches closed and focus on support only for essential projects, including the building of the network of Nightingale hospitals. Following the classification of the majority of construction activities as essential, branches progressively re-opened from late April onwards although the disruption to the supply chain caused by the lockdown was significant and took several months to unwind, particularly in the specialist merchants.
The second half recovery was very encouraging though, particularly in the Travis Perkins General Merchant, led by domestic RMI demand where volumes were approaching 2019 levels by the end of the year. Housebuilding and commercial construction, to which the specialist merchants are primarily exposed, were slower to recover with volumes still down by between 10% and 15% during the fourth quarter.
During the crisis, in order to continue to support customers safely, all of the Merchant businesses moved to pre arranged collection models, organised either by phone or online. This has proven successful across the full range of customers and work continues to develop this offer as a permanent part of the customer proposition.
Gross margins in the Merchanting segment were modestly lower than 2019, primarily reflecting a reduction in annual volume rebates. Input cost inflation was low for the year as a whole although there were increases in certain product categories in the second half of the year. Prices were adjusted to mitigate the impact of these increases, while investments were made predominantly in lightside categories to ensure relevant shelf edge pricing.
With significant uncertainty regarding near term volumes, as part of the restructuring plans 140 Merchanting branches were closed. These closures, together with the restructuring of sales and above-branch support teams, are expected to generate around £90m of annualised cost savings. These changes have accelerated the planned network strategy to exit subscale branches, leading to an increase of 7% in the average turnover per branch across Merchanting which, complemented by investment in larger branches as the businesses rebuild, will drive longer term operational efficiencies.
These cost actions helped to soften the impact of lost sales volume but, with social distancing regulations driving inefficiencies, a relatively high fixed cost base and gross margins down as described above, operating margin for the year reduced by 270bps.
Throughout the pandemic the Merchant businesses have had a clear focus on cash, in particular the collection of monies due from credit customers. A successful collaboration between the credit, sales and branch teams to leverage the businesses’ strong customer relationships has resulted in excellent cash collections throughout the year with the sales ledger in good shape going into 2021.
8
Toolstation
FY 2020 FY 2019 Change
Total revenue £633m £445m 42.1%
Like-for-like growth 22.2% 16.3% 5.9ppt
Adjusted operating profit* £8m £25m (68.0)%
Adjusted operating margin 1.2% 5.5% (430)bps
ROCE 2% 7% (5)ppt
Branch network (UK) 460 400 60
Branch network (Europe) 83 66 17
Memo:
Adjusted operating profit - UK £24m £29m (17.2)%
*Segmental adjusted operating profit figures are presented excluding property profits
Toolstation revenues increased by £188m in the year, up 42.1%, with the consolidation of Toolstation Europe (following the acquisition in Q4 2019) accounting for £48m of the increase. Like-for-like growth in Toolstation UK of 20.9% represented an exceptional performance, especially when considering the level of disruption from the lockdown in late March and April.
Alongside the ongoing work to continue to ensure a truly compelling customer proposition, the Toolstation UK business also made significant progress in developing the infrastructure of the business. With branches unable to serve customers directly during the initial lockdown, the branches operated as click & collect fulfilment centres. To support this the Toolstation website was rebuilt in a matter of days, before the wider IT infrastructure of the business was then replatformed over the following weeks in order to be scalable and more resilient as the business grows.
The pivot to digital trading required a significant increase in direct-to-customer deliveries, and to satisfy this demand the Redditch distribution centre was successfully expanded and repurposed from store replenishment to customer fulfilment.
Despite a pause in the network expansion programme between March and June as fitters could not access sites, 60 new branches were opened in the UK during the year as planned. New formats continue to be trialled, including smaller footprint branches and variations on the click & collect model to improve both the customer experience and operational efficiency. The number of new stores for 2021 is expected to be broadly similar to 2020.
The costs involved in adapting and running the distribution network on a socially distanced basis, as well as the higher proportion of delivered sales and the costs to make the necessary improvements to the business’ digital capabilities, increased the operating costs of the business during the year, more than offsetting the growth in gross profit generation in the UK.
For Toolstation Europe, the response to Covid-19 has differed across the countries in which the business operates but, in all cases, the strength of the customer proposition has driven further market share gains. The combination of the multichannel offering and consistent availability of stock has been extremely well received by tradespeople across the Netherlands, Belgium and France and has allowed branches to trade effectively throughout the pandemic when competitors have been forced to close.
These competitive advantages have seen underlying revenue* increase by 79% in the Netherlands and Belgium (60% on a like for like basis) where 9 new branches were opened, taking the total to 64. In France underlying revenue* grew by 92% with like-for-like sales up 75%. 8 new branches were added, taking the total to 19, and a new distribution centre in Lyon is now operational, laying the foundations for future expansion.
9
With the European business very much at the initial rollout stage, and with the disruption of the pandemic, a loss of £(16)m was recorded for 2020. Losses in 2021 are expected to be at a similar level as the rollout of new branches continues at pace.
*A controlling interest was acquired in Toolstation Europe on 30 September 2019. Underly ing rev enues ref lect the perf ormance of the business f or the
whole of the f inancial y ear including the period January to September 2019.
Retail
FY 2020 FY 2019 Change
Total revenue £1,391m £1,342m 3.6%
Like-for-like growth 5.0% 8.6% (3.6)ppt
Adjusted operating profit* £77m £97m (20.6)%
Adjusted operating margin 5.5% 7.2% (170)bps
ROCE 6% 7% (1)ppt
Store network - Wickes 233 235 (2)
Store network - Tile Giant 0 94 (94)
2019 figures include £47m of revenue and £0.1m of adjusted operating profit from Tile Giant, w hich w as sold in September 2020.
2020 f igures include £31m of revenue and an adjusted operating loss of £0.2m, plus the £1.4m profit on sale of the business.
*Segmental adjusted operating profit f igures are presented excluding property profits
Demonstrating the strength of its balanced business model, Wickes delivered a highly credible
5.5%** like for like sales growth for the full year, despite periods of lockdown and disruption to
trading operations throughout the year.
This performance was driven by strong Core sales growth of 19.3%** on a like for like basis,
leveraging Wickes’ well developed digital and flexible fulfilment capability and increasing market
share across the year. Sales also benefited from heightened DIY customer demand across a
broad range of categories as customers renewed their interest in home improvement.
Do-It-For-Me sales were significantly impacted by restrictions in trading operations, ending the
year down (27.4)%** on a like-for-like basis. In-store kitchen and bathroom showrooms were, at
times, completely closed and customers remained cautious throughout the year to progress installation projects in their homes. A fully digitally enabled virtual customer journey was
developed and launched in the second half of the year, enabling Wickes to continue to trade
despite ongoing showroom closures.
Gross profit margin was marginally higher year-on-year as a reduction in promotional activity
outweighed an unfavourable shift in product mix, principally as a result of the loss of showroom
driven business. The significant change in fulfilment methods, with delivery to customer order
volumes more than doubling across the year and click and collect volumes increasing by over 450%, increased fulfilment costs. Work is underway to drive efficiencies in distribution overhead
given the expectation that digital sales participation will continue to grow over time.
Overheads were impacted by £9m of costs directly as a result of the Covid-19 pandemic to ensure customers and colleagues remained safe. The business also had to carry around £7m of
unproductive labour costs during the first lockdown period, principally relating to Kitchen &
Bathroom sales, delivery and installation colleagues.
Following the strong sales performance of Wickes, the decision was taken in December 2020 to repay all government support, which is therefore excluded from the Retail segment results.
With the continued strong performance of the Wickes business and more stable market
conditions, the Board has re-commenced the demerger process with a view to completion in Q2 2021.
In September 2020, the Group completed the sale of its Tile Giant business.
** On a calendar year basis. For the 52 w eeks to 26th December 2020 Wickes like-for-like sales w ere +5.0% with Core +18.8% and Kitchens & Bathrooms dow n (27.8)%
10
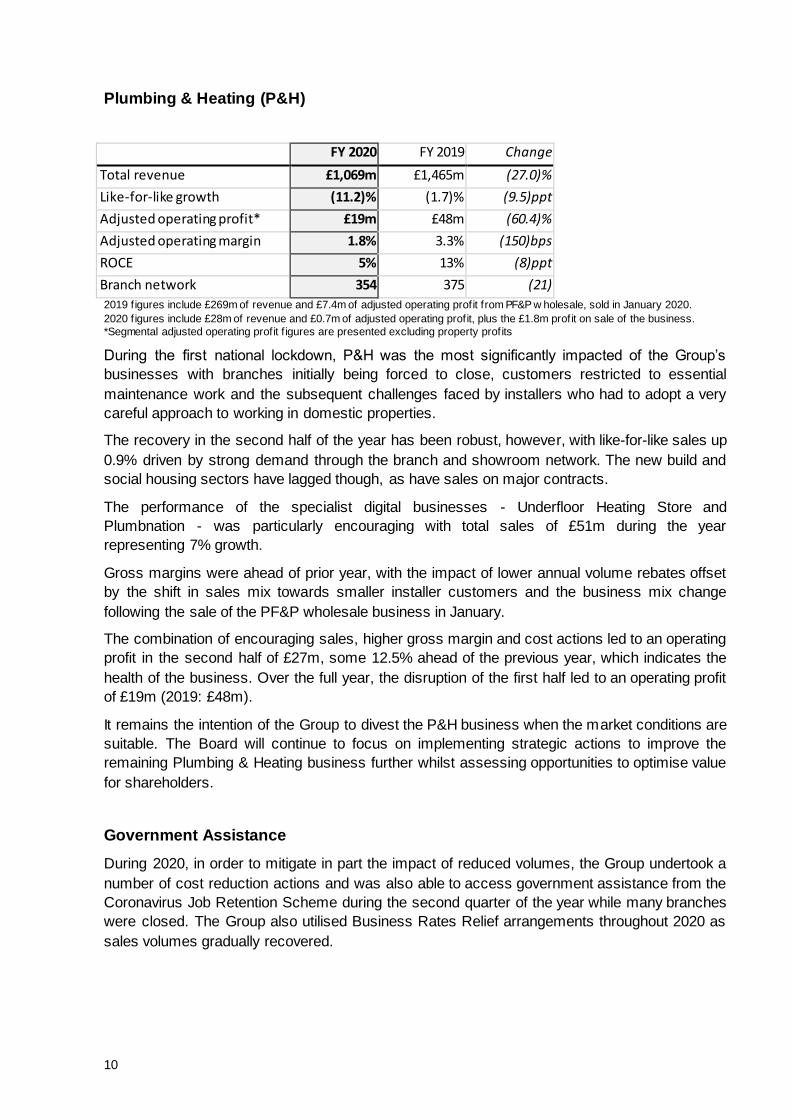
Plumbing & Heating (P&H)
FY 2020 FY 2019 Change
Total revenue £1,069m £1,465m (27.0)%
Like-for-like growth (11.2)% (1.7)% (9.5)ppt
Adjusted operating profit* £19m £48m (60.4)%
Adjusted operating margin 1.8% 3.3% (150)bps
ROCE 5% 13% (8)ppt
Branch network 354 375 (21)
2019 figures include £269m of revenue and £7.4m of adjusted operating profit from PF&P w holesale, sold in January 2020.
2020 f igures include £28m of revenue and £0.7m of adjusted operating profit, plus the £1.8m profit on sale of the business.
*Segmental adjusted operating profit f igures are presented excluding property profits
During the first national lockdown, P&H was the most significantly impacted of the Group’s
businesses with branches initially being forced to close, customers restricted to essential
maintenance work and the subsequent challenges faced by installers who had to adopt a very
careful approach to working in domestic properties.
The recovery in the second half of the year has been robust, however, with like-for-like sales up
0.9% driven by strong demand through the branch and showroom network. The new build and
social housing sectors have lagged though, as have sales on major contracts.
The performance of the specialist digital businesses - Underfloor Heating Store and
Plumbnation - was particularly encouraging with total sales of £51m during the year
representing 7% growth.
Gross margins were ahead of prior year, with the impact of lower annual volume rebates offset
by the shift in sales mix towards smaller installer customers and the business mix change
following the sale of the PF&P wholesale business in January.
The combination of encouraging sales, higher gross margin and cost actions led to an operating
profit in the second half of £27m, some 12.5% ahead of the previous year, which indicates the
health of the business. Over the full year, the disruption of the first half led to an operating profit
of £19m (2019: £48m).
It remains the intention of the Group to divest the P&H business when the market conditions are
suitable. The Board will continue to focus on implementing strategic actions to improve the
remaining Plumbing & Heating business further whilst assessing opportunities to optimise value
for shareholders.
Government Assistance
During 2020, in order to mitigate in part the impact of reduced volumes, the Group undertook a
number of cost reduction actions and was also able to access government assistance from the
Coronavirus Job Retention Scheme during the second quarter of the year while many branches
were closed. The Group also utilised Business Rates Relief arrangements throughout 2020 as
sales volumes gradually recovered.
11
Given the surge in DIY demand, having initially made claims under both schemes for the
Wickes and Toolstation businesses, the decision was taken in December to repay government
assistance to those businesses of £46m. Government assistance to the Merchanting and
Plumbing and Heating businesses in 2020 totalled approximately £74m. No further claims are
anticipated under either scheme in 2021.
Central costs
Unallocated central costs rose by £7m in 2020, driven by £15m of stranded costs relating to the
separation of Wickes and P&H from the Group as disclosed in March 2020. This increase was
partially offset by savings from the restructuring programme and substantially reduced
management incentive charges.
Property transactions
Given the impact of the pandemic, fewer property transactions were completed in the year than
in 2019. After a quiet first half, good progress was made on disposing of surplus freehold
assets in the second half of the year, generating £11m of property profits for the year as a
whole (2019: £21m). Significant progress has already been made in exiting both freehold and
leasehold sites vacated as part of the restructuring programme announced in June.
12
Financial Performance
Revenue analysis
Sales across the Merchanting and P&H businesses were hit hard by the initial lockdown but recovered well through the second half of the year. As described above, Toolstation was able to adapt its business model during lockdown to maintain trade and subsequently to build on those changes to drive exceptional growth during the balance of the year.
Retail was impacted by the closure of Kitchen & Bathroom showrooms during the first lockdown, which account for around one third of sales. The Wickes core business, however, was ideally placed to benefit from the surge in DIY demand and delivered excellent growth from June onwards.
Volume, price and mix analysis
Total revenue Merchanting Toolstation Retail Plumbing &
Heating Group
Volume (13.4)% 23.6% 5.3% (15.0)% (7.2)%
Price and mix (0.6)% (1.4)% (0.3)% 3.8% 0.1%
Like-for-like revenue
growth (14.0)% 22.2% 5.0% (11.2)% (7.1)%
Network changes and
acquisitions /
disposals (3.5)% 19.6% (1.7)% (16.2)% (4.7)%
Trading days 0.3% 0.3% 0.3% 0.4% 0.3%
Total revenue
growth (17.2)% 42.1% 3.6% (27.0)% (11.5)%
At a Group level, price inflation was neutral across the year reflecting a benign input cost environment. There was one extra trading day in the year but the merchant businesses closed earlier than usual in December, as management teams wished to ensure that colleagues could take a longer break after a challenging year. This is reflected in the December like-for-like sales which saw a slight dip after a strong upward trajectory in the second half.
Toolstation total sales include fully consolidated sales from Toolstation Europe from 1 October 2019, partly driving the significant step up in growth between LFL and total sales alongside expansion of the Toolstation network. Conversely, P&H total sales figures were impacted by the disposal of the PF&P Wholesale business in January 2020 and Retail by the sale of Tile Giant in September 2020.
Quarterly like-for-like revenue analysis
Like-for-like revenue
growth Merchanting Toolstation Retail
Plumbing &
Heating Total
Group
Q1 2020 (8.7)% 9.1% 4.5% (1.9)% (3.8)%
Q2 2020 (42.8)% 16.5% (19.8)% (48.4)% (34.8)%
Q3 2020 (3.1)% 25.5% 18.3% 0.4% 3.9%
Q4 2020 1.3% 34.7% 20.0% 1.4% 7.7%
H1 2020 (25.8)% 12.9% (8.2)% (22.8)% (19.3)%
H2 2020 (1.0)% 30.4% 19.6% 0.9% 5.9%
FY 2020 (14.0)% 22.2% 5.0% (11.2)% (7.1)%
13
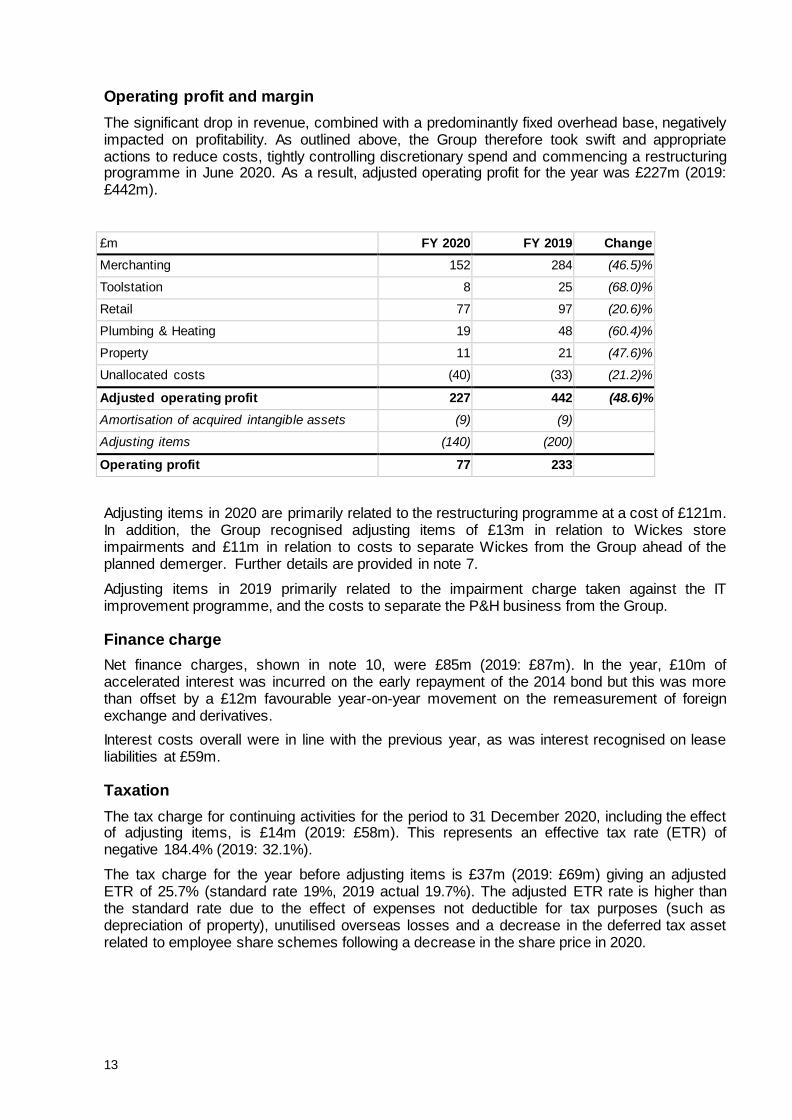
Operating profit and margin
The significant drop in revenue, combined with a predominantly fixed overhead base, negatively impacted on profitability. As outlined above, the Group therefore took swift and appropriate actions to reduce costs, tightly controlling discretionary spend and commencing a restructuring programme in June 2020. As a result, adjusted operating profit for the year was £227m (2019: £442m).
£m FY 2020 FY 2019 Change
Merchanting 152 284 (46.5)%
Toolstation 8 25 (68.0)%
Retail 77 97 (20.6)%
Plumbing & Heating 19 48 (60.4)%
Property 11 21 (47.6)%
Unallocated costs (40) (33) (21.2)%
Adjusted operating profit 227 442 (48.6)%
Amortisation of acquired intangible assets (9) (9)
Adjusting items (140) (200)
Operating profit 77 233
Adjusting items in 2020 are primarily related to the restructuring programme at a cost of £121m. In addition, the Group recognised adjusting items of £13m in relation to Wickes store impairments and £11m in relation to costs to separate Wickes from the Group ahead of the planned demerger. Further details are provided in note 7.
Adjusting items in 2019 primarily related to the impairment charge taken against the IT improvement programme, and the costs to separate the P&H business from the Group.
Finance charge
Net finance charges, shown in note 10, were £85m (2019: £87m). In the year, £10m of accelerated interest was incurred on the early repayment of the 2014 bond but this was more than offset by a £12m favourable year-on-year movement on the remeasurement of foreign exchange and derivatives.
Interest costs overall were in line with the previous year, as was interest recognised on lease liabilities at £59m.
Taxation
The tax charge for continuing activities for the period to 31 December 2020, including the effect of adjusting items, is £14m (2019: £58m). This represents an effective tax rate (ETR) of negative 184.4% (2019: 32.1%).
The tax charge for the year before adjusting items is £37m (2019: £69m) giving an adjusted ETR of 25.7% (standard rate 19%, 2019 actual 19.7%). The adjusted ETR rate is higher than the standard rate due to the effect of expenses not deductible for tax purposes (such as depreciation of property), unutilised overseas losses and a decrease in the deferred tax asset related to employee share schemes following a decrease in the share price in 2020.
14
Earnings per share
The Group reported a statutory loss after tax of £22m (2019: profit of £123m) resulting in a basic loss per share of 8.8 pence (2019: earnings of 48.9 pence). There is no difference between basic and diluted basic earnings per share.
Adjusted profit after tax was £105m resulting in adjusted earnings per share (note 12(b)) of 42.4p (2019: 112.7 pence). There is no difference between adjusted basic and adjusted diluted earnings per share.
Cash flow and balance sheet
Throughout the pandemic, the Group has maintained a close focus on cash flow and its liquidity
position. The actions taken by the Group have protected liquidity throughout, generating
significant cash from working capital during the year and maintaining a strong balance sheet.
As a result of the Government’s decision, driven by the Covid-19 crisis, to allow deferral of VAT payments due on or before 30 June 2020, the Group received a deferred cash benefit on tax payments of £107m in H1 2020. This amount was required to be paid to HMRC on or before 31 March 2021 but, given the strength of the Group’s liquidity position, this amount was paid in full during December 2020.
Free cash flow
(£m) FY 2020 FY 2019
Group adjusted operating profit excluding property profits 215 421
Depreciation of PPE and other non-cash movements 122 141
Change in working capital 195 (129)
Net interest paid (excluding lease interest) (28) (26)
Interest on lease liabilities (59) (57)
Tax paid (45) (53)
Adjusted operating cash flow 400 297
Capital investments
Capex excluding freehold transactions (108) (121)
Proceeds from disposals excluding freehold transactions 12 19
Free cash flow before freehold transactions 304 195
The key driver of the improvement in free cash flow was a significant reduction in working
capital during the year, partially offset by the decline in adjusted operating profits previously
outlined.
The significant cash inflow from working capital was driven primarily by a reduction in inventory
of £97m, principally the result of the utilisation of around £60m of additional stock held at the
end of 2019 to mitigate a possible no-deal exit from the EU. The remainder of the working
capital movement largely related to the efficient use of stock from branches closed as part of the
restructuring and tight controls in place to manage stock holding over the second half of the
year, offsetting increases from the expansion of the Toolstation network; and lower receivables
balances, driven by an ongoing focus on cash collections throughout the second half of the year
and building on the excellent work of the credit teams during the first phase of the pandemic.
15
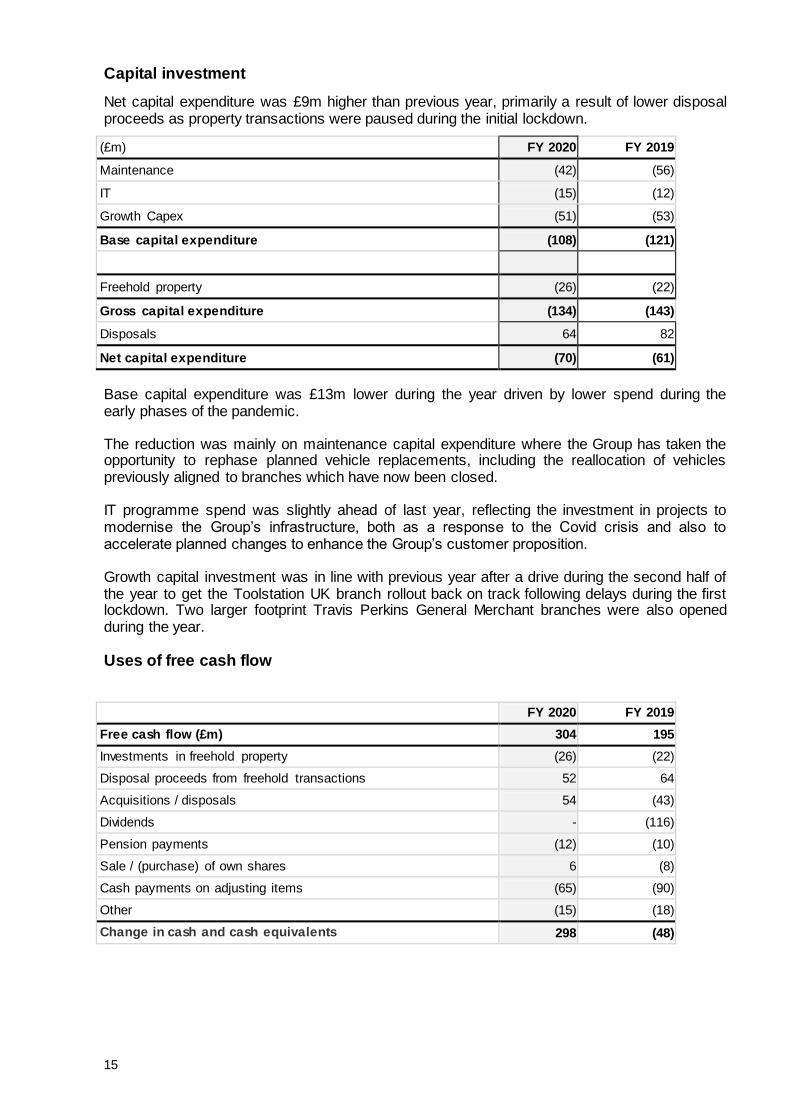
Capital investment
Net capital expenditure was £9m higher than previous year, primarily a result of lower disposal proceeds as property transactions were paused during the initial lockdown.
(£m) FY 2020 FY 2019
Maintenance (42) (56)
IT (15) (12)
Growth Capex (51) (53)
Base capital expenditure (108) (121)
Freehold property (26) (22)
Gross capital expenditure (134) (143)
Disposals 64 82
Net capital expenditure (70) (61)
Base capital expenditure was £13m lower during the year driven by lower spend during the early phases of the pandemic.
The reduction was mainly on maintenance capital expenditure where the Group has taken the opportunity to rephase planned vehicle replacements, including the reallocation of vehicles previously aligned to branches which have now been closed.
IT programme spend was slightly ahead of last year, reflecting the investment in projects to modernise the Group’s infrastructure, both as a response to the Covid crisis and also to accelerate planned changes to enhance the Group’s customer proposition.
Growth capital investment was in line with previous year after a drive during the second half of the year to get the Toolstation UK branch rollout back on track following delays during the first lockdown. Two larger footprint Travis Perkins General Merchant branches were also opened during the year.
Uses of free cash flow
FY 2020 FY 2019
Free cash flow (£m) 304 195
Investments in freehold property (26) (22)
Disposal proceeds from freehold transactions 52 64
Acquisitions / disposals 54 (43)
Dividends - (116)
Pension payments (12) (10)
Sale / (purchase) of own shares 6 (8)
Cash payments on adjusting items (65) (90)
Other (15) (18)
Change in cash and cash equivalents 298 (48)
16
During the year, the focus on protecting the liquidity position of the Group was highly successful and led to an increase in cash and cash equivalents of £298m. The key drivers of the improvement were:
● Strong free cash flow from tight working capital management ● Suspension of dividend payments during the year ● £50m from the sale of Primaflow F&P
Net debt and funding
The strong focus on cash and liquidity, and the resulting cash position of the Group, has driven a significant improvement in the net debt position.
FY 2020 FY 2019 Change
Covenant net debt £40m £344m £(304)m
Covenant net debt / adjusted EBITDA 0.1x 0.7x (0.6)x
Net debt under IFRS16 £1,397m £1,788m £(391)m
Net debt / adjusted EBITDA 2.8x 2.5x 0.3x Note - the covenant test under f inancing agreements is based on ‘frozen GAAP’ before the introduction of IFRS16. Leverage
covenant for June 2020 w as relaxed from 3.0x to 3.5x. It w as w aived for December 2020 and w ill be reinstated at 3.0x at June 2021.
Covenant net debt reduced by £304m from 31 December 2019 to £40m. As described above, this movement was a result of increased cash balances primarily due to excellent working capital management through the year. This was also the principal driver of the corresponding reduction in net debt under IFRS16.
Despite the significant step down in profitability of the Group, the reduction in IFRS16 net debt caused the rolling 12-month Net debt / adjusted EBITDA ratio to increase only modestly year-on-year to 2.8x. The medium term leverage target for the Group remains 2.5x.
In May 2020 the Group took the prudent step to agree with its lenders a relaxation of its financial covenants for the test dates at the end of June and December 2020:
● The interest cover covenant was waived for both June and December 2020
● The net leverage covenant was relaxed to 3.5x for June 2020
● The net leverage covenant was waived for December 2020
● A minimum liquidity headroom covenant was established for September and December
2020
Funding
As at 31 December 2020, the Group’s committed funding of £950m comprised:
● £300m guaranteed notes due September 2023, listed on the London Stock Exchange
● £250m guaranteed notes due February 2026, listed on the London Stock Exchange.
These notes were issued in November 2020 at a coupon of 3.75%. Proceeds were
used to buy in notes due to mature in September 2021
● A revolving credit facility of £400m, refinanced in January 2019, of which £54m matures
in 2024 and the remaining £346m matures in 2025.
As at 31 December 2020, the Group had undrawn committed facilities of £400m (2019: £400m) and deposited cash of £455m (2019: £140m), giving overall liquidity headroom of £855m.
The Group’s credit rating, issued by Standard and Poor’s, was maintained at BB+ negative watch following its review in April 2020. In November 2020, Fitch Ratings assigned the Group an investment grade rating of BBB- with stable outlook.
17
Building a sustainable business framework
During the year, despite the challenges of the pandemic, the Group made good progress on its broader Environmental, Social and Governance agenda, ensuring that Travis Perkins continues to enhance its reputation as a responsible employer with both strategy and policies driven by well established core values.
The Group developed and launched a new Code of Conduct during the year, and implemented new policies and minimum standards to support the Group’s businesses on matters including diversity and inclusion, people development, sustainable products and services, and responsible sourcing.
Travis Perkins has set the objective of being Net Zero for carbon by 2035 for Scope 1 and 2 emissions, and by June 2021 the Group will set a target for reducing Scope 3 indirect emissions in the creation and use of products throughout the supply chain.
Staying close to colleagues in a year where physical distancing was essential has been one of the Group’s top priorities, and weekly “check-in” surveys, with over 35,000 responses during the year, have given clear and timely insight to enable support and training to be directed to colleagues that needed it most, particularly around mental health.
The Group has significantly enhanced its family leave policies, as well as ensuring that our frontline colleagues received pay increases and recognition of their great work with the Merchanting and Plumbing & Heating businesses both now real living wage employers.
The Group continues to invest heavily in its apprenticeship programmes, taking on 783 apprentices in 2020 with plans for an additional 1,000 in 2021. The TP Women, LGBTQ+ and BAME networks are also now active with sponsorship from the leadership team. All of these changes will support further improvements in building a more diverse workforce for the future.
Principal risks and uncertainties
The risk environment in which the Group operates does not remain static. The coronavirus pandemic has required an ongoing and agile assessment of risks, uncertainties and issues, adjusting to the development of Covid-19 in real time. The pandemic and its wider economic effects continue to bring uncertainty to our operations and the delivery of our strategic objectives. Even with a mass vaccination programme, this uncertainty is likely to persist.
During the year, the Directors have regularly reviewed the Group’s principal risks. Whilst a number of the principal risks faced by the business remain aligned to those listed on pages 40 to 51 of the 2019 Annual Report and Accounts, the Board has made the following key changes to the principal risk set in 2020:
● Pandemic risk, specifically in relation to Covid-19, is recognised as a new principal risk due to the inherent associated uncertainty.
● Environmental, social, and governance (“ESG”) matters have been added as a principal risk as the Group recognises its impact and potential influence on the environment, the construction industry and wider society.
● Brexit is no longer considered to be a principal risk. Management prepared for, and will continue to implement, the required changes to customs procedures, product standards and the recruitment of EU citizens, which remain the more significant areas of Brexit impact for the Group.
● The risks in relation to Portfolio Management and Capital Allocation have been combined.
Accordingly the 2020 Annual Report and Accounts will report risks under the following captions: market conditions, pandemic, changing customer & competitor landscape, supplier risks, portfolio management, change management, ESG, IT systems & infrastructure, cyber threat & data security, people, health, safety & wellbeing and legal compliance.
In relation to the principal risks brought forward from 2019, the Board considers the risk trend to now be increasing in relation to market conditions, supplier risks and the changing customer & competitor landscape. All other risk trends are unchanged.
18
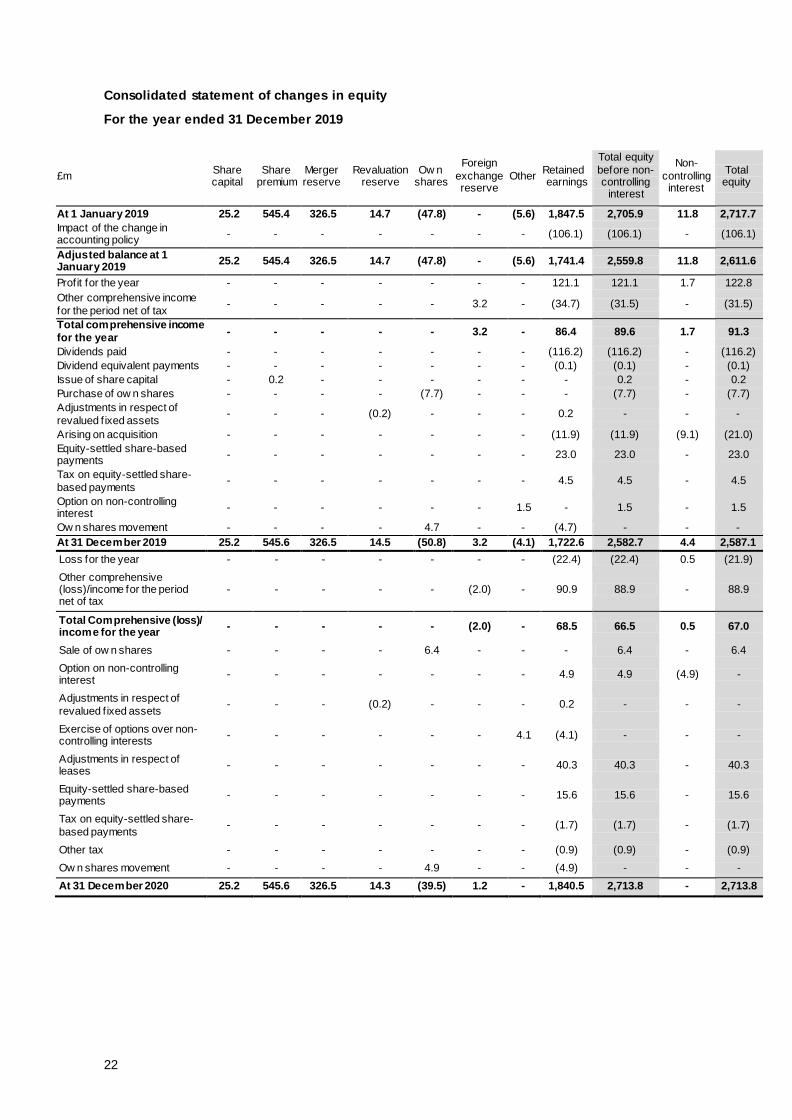
Consolidated income statement
For the year ended 31 December 2020
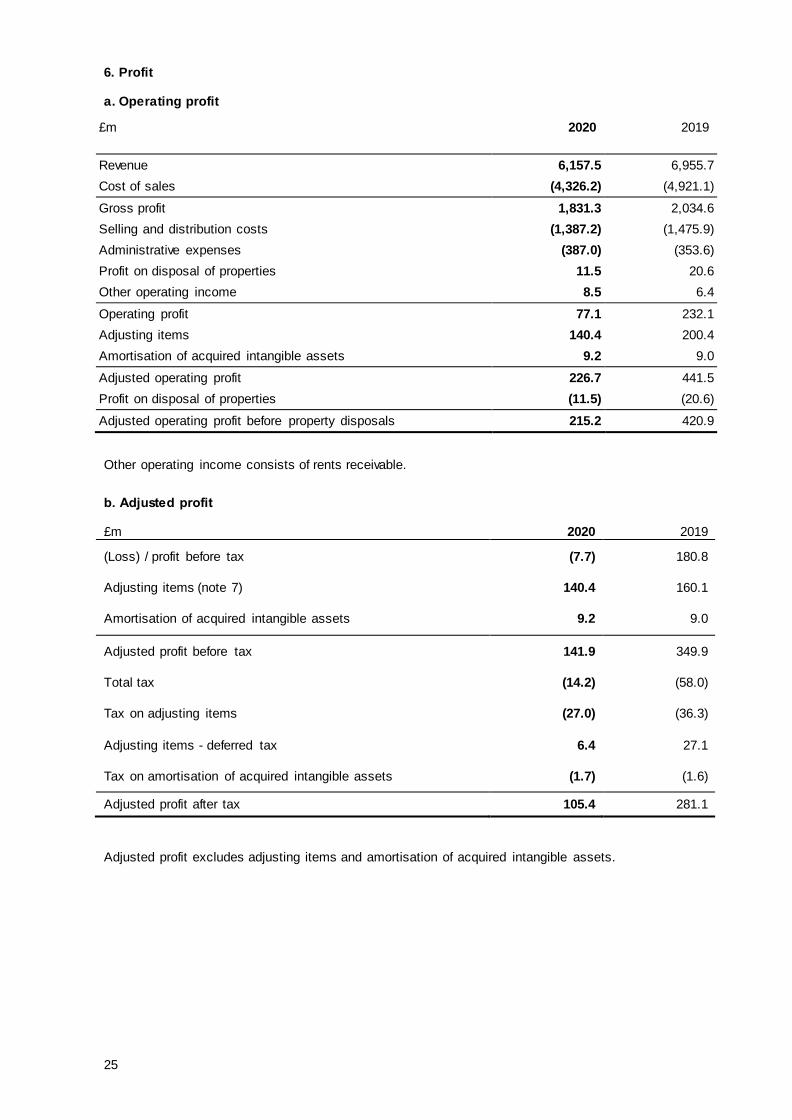
£m 2020 2019
Revenue 6,157.5 6,955.7
Adjusted operating profit (note 6) 226.7 441.5
Amortisation of acquired intangible assets (9.2) (9.0)
Exercise of options over non-controlling interests
- - - - - - 4.1 (4.1) - - -
Adjustments in respect of leases
- - - - - - - 40.3 40.3 - 40.3
Equity-settled share-based payments
- - - - - - - 15.6 15.6 - 15.6
Tax on equity-settled share-
based payments - - - - - - - (1.7) (1.7) - (1.7)
Other tax - - - - - - - (0.9) (0.9) - (0.9)
Ow n shares movement - - - - 4.9 - - (4.9) - - -
At 31 December 2020 25.2 545.6 326.5 14.3 (39.5) 1.2 - 1,840.5 2,713.8 - 2,713.8
23
Consolidated cash flow statement
For the year ended 31 December 2020
£m 2020 2019
Cash flows from operating activities
Adjusted operating profit 226.7 441.5
Adjustments for:
Depreciation of property, plant and equipment 89.6 97.5
Depreciation of right-of-use assets* 171.7 174.3
Lease terminations and impairments* - 2.2
Amortisation and impairment of internally-generated intangibles 16.6 23.5
Share-based payments 15.6 19.9
Foreign exchange 2.0 4.1
Other non-cash movements - 4.2
Gain on disposal of subsidiaries (3.2) -
Gain on disposal of property, plant and equipment (11.5) (20.6)
Purchase of toolhire assets (6.4) (9.2)
Adjusted operating cash flows 501.1 737.4
Decrease/(increase) in inventories 97.1 (104.2)
Decrease in receivables 481.0 12.5
Decrease in payables
Decrease in supplier f inancing arrangements
(383.6)
-
(36.4)
(0.1)
Payments in respect of adjusting items (65.2) (90.0)
Pension payments in excess of the income statement charge (11.5) (9.9)
Cash generated from operations 618.9 509.1
Interest paid (29.5) (27.0)
Interest on lease liabilities
Debt arrangement fees
(59.0)
-
(57.0)
(2.9)
Current income taxes paid (44.5) (52.9)
Net cash from operating activities 485.9 369.4
Cash flows from investing activities
Interest received 1.3 0.8
Proceeds on disposal of property, plant and equipment 64.2 82.0
Development of computer softw are (5.4) (8.4)
Purchases of property, plant and equipment (121.5) (125.2)
Interest in associates - (20.6)
Acquisition of businesses - (23.0)
Disposal of business 53.7 -
Net cash used in investing activities (7.7) (94.4)
Cash flows from financing activities
Proceeds from the issue of share capital - 0.2
Bank facility fee (2.9) -
Sale/purchase of ow n shares 6.4 (7.7)
Repayment of lease liabilities (163.1) (175.6)
Payments to pension scheme (3.4) (3.4)
Dividends paid - (116.2)
Purchase of non-controlling interest (6.0) (19.8)
Bond issue 248.5 -
Repayment of bond (260.0) -
Draw dow n of bank facilities 400.0 -
Repayment of borrow ings (400.0) -
Net cash from financing activities (180.5) (322.5)
Net increase / (decrease) in cash and cash equivalents 297.7 (47.5)
Cash and cash equivalents at 1 January 207.9 255.4
Cash and cash equivalents at 31 December 505.6 207.9
24
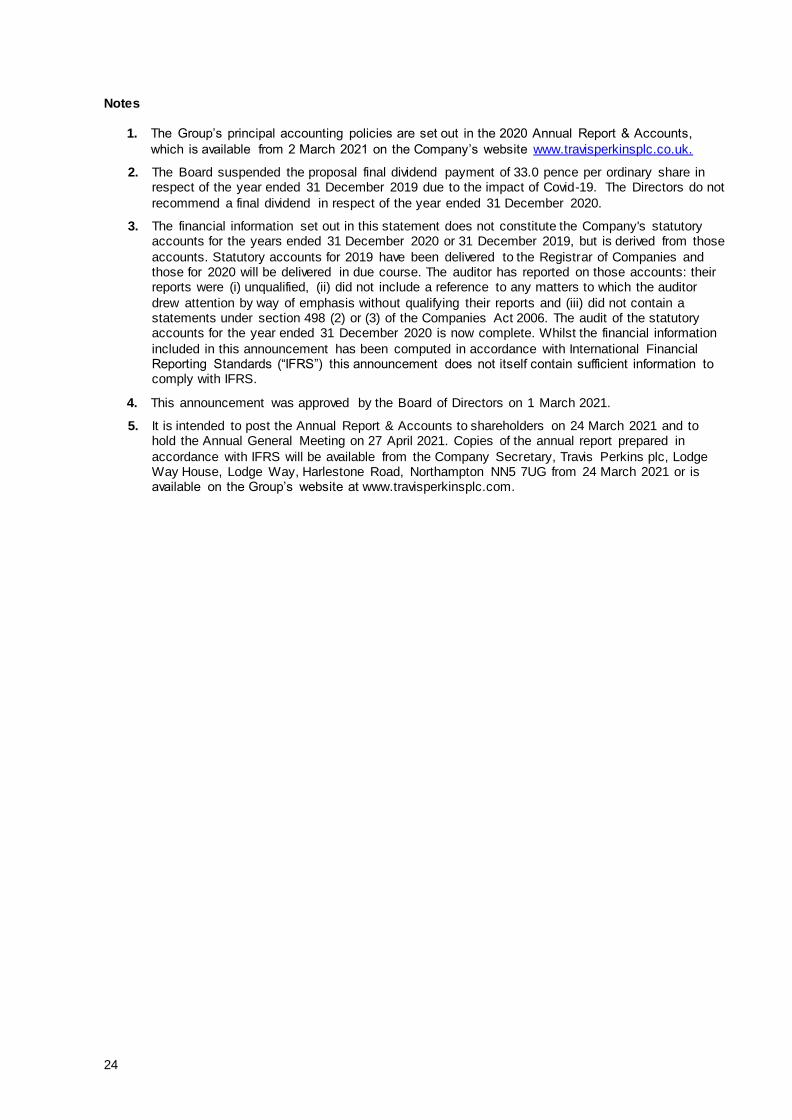
Notes
1. The Group’s principal accounting policies are set out in the 2020 Annual Report & Accounts,
which is available from 2 March 2021 on the Company’s website www.travisperkinsplc.co.uk.
2. The Board suspended the proposal final dividend payment of 33.0 pence per ordinary share in respect of the year ended 31 December 2019 due to the impact of Covid-19. The Directors do not
recommend a final dividend in respect of the year ended 31 December 2020.
3. The financial information set out in this statement does not constitute the Company's statutory accounts for the years ended 31 December 2020 or 31 December 2019, but is derived from those
accounts. Statutory accounts for 2019 have been delivered to the Registrar of Companies and those for 2020 will be delivered in due course. The auditor has reported on those accounts: their reports were (i) unqualified, (ii) did not include a reference to any matters to which the auditor
drew attention by way of emphasis without qualifying their reports and (iii) did not contain a statements under section 498 (2) or (3) of the Companies Act 2006. The audit of the statutory accounts for the year ended 31 December 2020 is now complete. Whilst the financial information
included in this announcement has been computed in accordance with International Financial Reporting Standards (“IFRS”) this announcement does not itself contain sufficient information to comply with IFRS.
4. This announcement was approved by the Board of Directors on 1 March 2021.
5. It is intended to post the Annual Report & Accounts to shareholders on 24 March 2021 and to hold the Annual General Meeting on 27 April 2021. Copies of the annual report prepared in
accordance with IFRS will be available from the Company Secretary, Travis Perkins plc, Lodge Way House, Lodge Way, Harlestone Road, Northampton NN5 7UG from 24 March 2021 or is available on the Group’s website at www.travisperkinsplc.com.
In response to Covid-19 and an expectation of reduced sales volumes in 2020 and 2021, and in response to changing customer requirements and a shift to delivered sales, in June 2020 the Group commenced a
significant programme of branch closures and the restructuring of distribution, administrative and sales functions.
This will result in the closure of around 190 branches across the overall branch estate, representing
approximately 10% of the Group’s network. The branch closures are concentrated in the merchant businesses and in particular on small branches in the Travis Perkins General Merchant and on branches in the Plumbing and Heating contracts businesses. In total, the Group reduced the number of roles by
around 2,500 or approximately 9% of the workforce. Costs recognised in relation to these closures are as follows:
● £66.4m of property costs arising on the closure of branches and office locations, including a
£26.5m impairment charge in respect of right-of-use assets
● £27.2m of redundancy and other restructuring costs
● £13.3m of fixed asset impairments
● £14.0m of inventory provisions in respect of closed branches and associated restructuring
Wickes separation and demerger
The Group incurred costs preparing to demerge the Wickes business. This was paused in March 2020 given the uncertainty of the impact of coronavirus and volatility in the equity market and the demerger is now expected to complete in April 2021. The costs disclosed as adjusting consist of:
● £7.6m of costs related to the separation of IT functions from the Group
● £3.5m of professional service fees incurred in preparation for the demerger
Wickes store impairment
An impairment charge of £12.6m was recognised in respect of five Wickes stores where the impacts of coronavirus have made it more challenging to implement the performance improvement plans necessary
to generate cash flows that support the stores’ value-in-use. The remaining lease term was used as the remaining useful life. The impairment has been recognised against the right -of-use assets associated with these stores, which are the only material assets.
IT-related impairment charge
The gain of £4.2m is the result of the full and final settlement of claims in relation to the cancelled replacement of the Group’s merchant ERP system.
27
Deferred tax rate change
The tax charge includes an adjusting charge of £6.4m arising from the increase in the rate of UK
corporation tax effective on 1 April 2020 from 17% to 19%.
2019
The following items were disclosed as adjusting in 2019:
● An impairment charge of £107.6m after the previous programme to develop a replacement ERP for the Merchant businesses was halted
● Costs of £46.5m incurred in relation to separation of the Plumbing & Heating business from the Group’s central IT infrastructure and support functions to enable the business to operate autonomously and support any future disposal
● £11.7m of Wickes separation and demerger costs were disclosed as adjusting following the Group’s announcement of its intention to demerge the Wickes business
● Restructuring costs of £21.5m relating to cost reduction activities in the supply chain and support
centre of the merchant business, including the costs of closure of the Group’s range centre and timber network
● Losses recognised following the closure of the Built business in April 2019
● A fair value gain on the acquisition of Toolstation Europe of £40.3m following the remeasurement of the investment at fair value
● A deferred tax charge of £27.1m following the Group’s change in property strategy and therefore
its assessment of its ability to use rollover relief indefinitely on capital gains in 2019
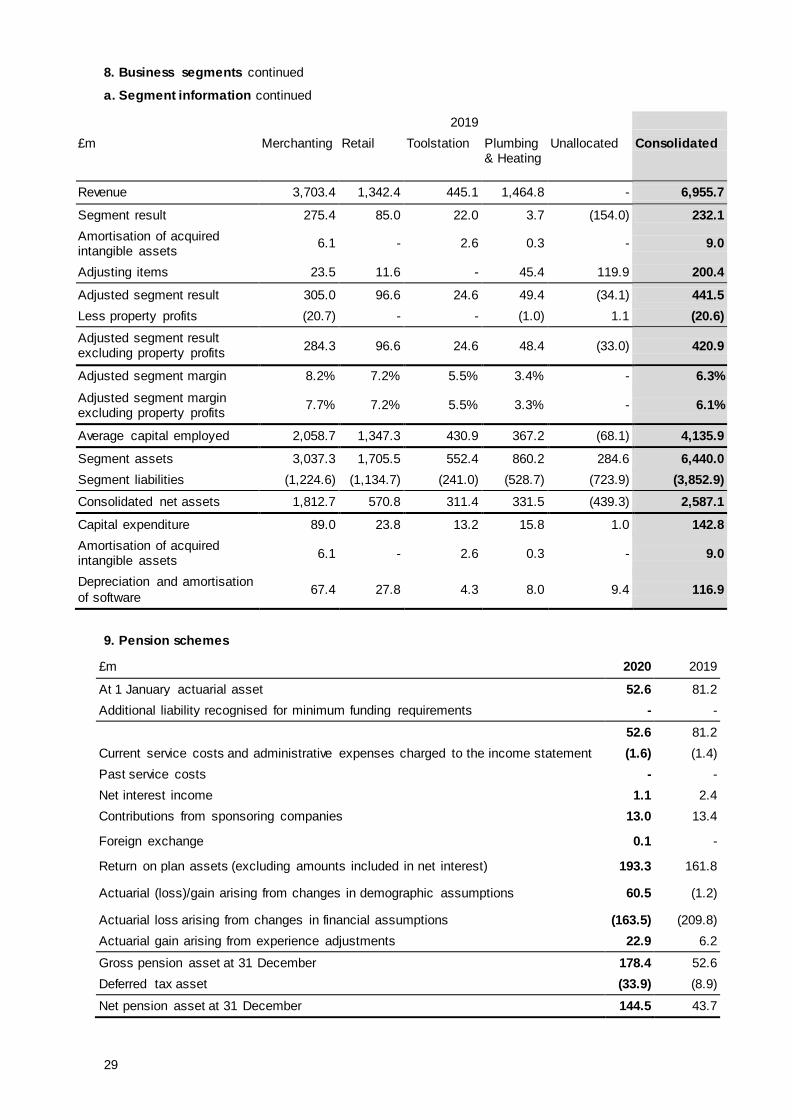
8. Business segments
The operating segments are identified on the basis of internal reports about components of the Group
that are regularly reviewed by the Chief Operating Decision Maker (“CODM”), which is considered to be the Board, to assess performance and allocate capital. The Group has four operating segments:
● Merchanting
● Retail ● Toolstation ● Plumbing & Heating
These segments reflect the Group’s organisation around differences in products (general building versus plumbing & heating), customers (trade versus consumer) and price and range flexibility (fixed range and fixed price versus variable and variable range).
All operating segments sell building materials to a wide range of customers, none of which are dominant, and operate almost exclusively in the United Kingdom. The information previously reported under the business segments note has been restated to reflect the new operating segments.
Segment result represents the result of each segment without allocation of certain central costs, finance income and costs and tax. Unallocated segment assets and liabilities comprise financial instruments, current and deferred tax, cash and borrowings and pension scheme assets and liabilities.
28
8. Business segments continued
a. Segment information
2020
£m Merchanting Retail
Toolstation Plumbing &
Heating
Unallocated Consolidated
Revenue 3,064.8 1,391.2 632.7 1,068.8 - 6,157.7
Segment result 65.7 51.1 4.3 (1.0) (43.0) 77.1
Amortisation of acquired intangible assets
6.2 - 2.4 0.6 - 9.2
Adjusting items 89.1 26.9 0.9 20.8 2.7 140.4
Adjusted segment result 161.0 78.0 7.6 20.4 (40.3) 226.7
Less property profits (9.2) (0.9) - (1.4) - (11.5)
Adjusted segment result excluding property profits
Consolidated net assets 1,812.7 570.8 311.4 331.5 (439.3) 2,587.1
Capital expenditure 89.0 23.8 13.2 15.8 1.0 142.8
Amortisation of acquired intangible assets
6.1 - 2.6 0.3 - 9.0
Depreciation and amortisation
of software 67.4 27.8 4.3 8.0 9.4 116.9
9. Pension schemes
£m 2020 2019
At 1 January actuarial asset 52.6 81.2
Additional liability recognised for minimum funding requirements - -
52.6 81.2
Current service costs and administrative expenses charged to the income statement (1.6) (1.4)
Past service costs - -
Net interest income 1.1 2.4
Contributions from sponsoring companies 13.0 13.4
Foreign exchange 0.1 -
Return on plan assets (excluding amounts included in net interest) 193.3 161.8
Actuarial (loss)/gain arising from changes in demographic assumptions 60.5 (1.2)
Actuarial loss arising from changes in financial assumptions (163.5) (209.8)
Actuarial gain arising from experience adjustments 22.9 6.2
Gross pension asset at 31 December 178.4 52.6
Deferred tax asset (33.9) (8.9)
Net pension asset at 31 December 144.5 43.7
30
10. Net finance costs
£m 2020 2019
Interest on bank loans and overdrafts (3.1) (2.0)
Interest on bonds (19.5) (21.0)
Accelerated interest on repayment of 2014 bond (10.0) -
Unwinding of discounts – property provisions (0.2) (0.2)
Unwinding of discounts – pension SPV loan (2.1) (2.2)
Issue costs of bank loans* (2.3) (2.9)
Other interest - (2.3)
Net loss on remeasurement of foreign exchange - (3.3)
Net loss on remeasurement of derivatives at fair value - (1.3)
Finance costs before lease interest (37.2) (35.2)
Interest on lease liabilities (59.0) (57.0)
Finance costs (96.2) (92.2)
Net gain on remeasurement of derivatives at fair value 1.4 -
Net gain on remeasurement of foreign exchange 6.4 -
Other finance income - pension scheme 1.1 2.4
Interest receivable 2.0 2.5
Finance income 10.9 4.9
Net finance costs (85.3) (87.3)
The charge caused by the unwinding of discounts relates to the property provisions and the pension
scheme SPV loan.
11. Tax
£m 2020 2019
Current tax:
Current year 24.1 44.0
Prior year 0.3 (3.1)
Total current tax 24.4 40.9
Deferred tax:
Current year (9.2) (12.1)
Prior year (1.0) 29.2
Total deferred tax (10.2) 17.1
Total tax charge / (credit) 14.2 58.0
31
12. Earnings per share
a. Basic and diluted earnings per share
£m 2020 2019
Earnings for the purposes of earnings per share (21.9) 121.1
Weighted average number of shares for the purposes of basic earnings per share
248,566,317 247,957,050
Dilutive effect of share options on potential ordinary shares - 2,293,525
Weighted average number of ordinary shares for the purposes of diluted earnings per share
248,566,317 250,250,575
(Loss) / earnings per share (8.8)p 48.9p
Diluted (loss) / earnings per share (8.8)p 48.4p
382,770 share options (2019: 1,878,458 share options) had an exercise price in excess of the average market value of the shares during the year. As a result, these share options were excluded from the calculation of diluted earnings per share. Share options that would be anti-dilutive due to the Group
generating a loss have also been excluded from the calculation.
b. Adjusted earnings per share
Adjusted earnings per share are calculated by excluding the effect of the exceptional items and amortisation acquired intangible assets from earnings.
£m 2020 2019
Earnings for the purposes of earnings per share (21.9) 121.1
Adjusting items 140.4 160.1
Amortisation of acquired intangible assets 9.2 9.0
Tax on adjusting items (27.0) (36.3)
Adjusting deferred tax 6.4 27.1
Tax on amortisation of acquired intangible assets (1.7) (1.6)
Adjusted earnings 105.4 279.4
Adjusted earnings per share 42.4p 112.7p
Adjusted diluted earnings per share 42.4p 111.6p
32
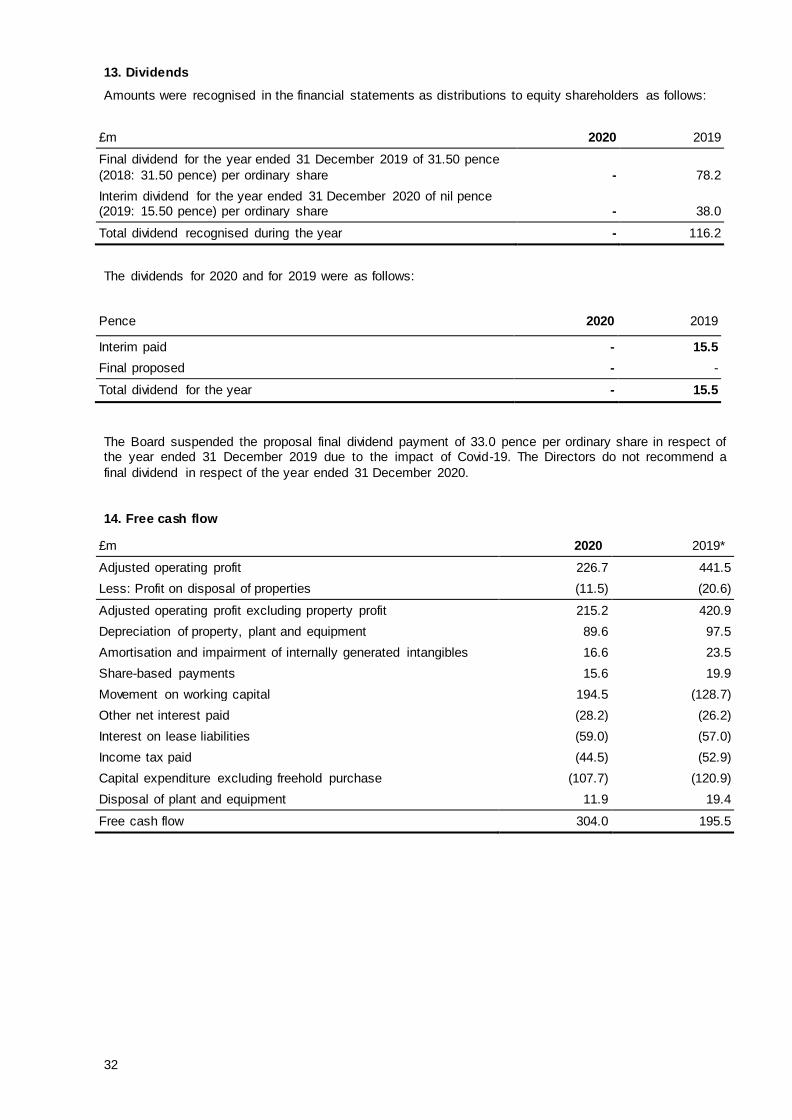
13. Dividends
Amounts were recognised in the financial statements as distributions to equity shareholders as follows:
£m 2020 2019
Final dividend for the year ended 31 December 2019 of 31.50 pence
(2018: 31.50 pence) per ordinary share - 78.2
Interim dividend for the year ended 31 December 2020 of nil pence (2019: 15.50 pence) per ordinary share - 38.0
Total dividend recognised during the year - 116.2
The dividends for 2020 and for 2019 were as follows:
Pence 2020 2019
Interim paid - 15.5
Final proposed - -
Total dividend for the year - 15.5
The Board suspended the proposal final dividend payment of 33.0 pence per ordinary share in respect of the year ended 31 December 2019 due to the impact of Covid-19. The Directors do not recommend a
final dividend in respect of the year ended 31 December 2020.
14. Free cash flow
£m 2020 2019*
Adjusted operating profit 226.7 441.5
Less: Profit on disposal of properties (11.5) (20.6)
Depreciation of property, plant and equipment 89.6 97.5
Amortisation and impairment of internally generated intangibles 16.6 23.5
Share-based payments 15.6 19.9
Movement on working capital 194.5 (128.7)
Other net interest paid (28.2) (26.2)
Interest on lease liabilities (59.0) (57.0)
Income tax paid (44.5) (52.9)
Capital expenditure excluding freehold purchase (107.7) (120.9)
Disposal of plant and equipment 11.9 19.4
Free cash flow 304.0 195.5
33
15. Net debt
a. Covenant net debt
Following the implementation of IFRS 16 - Leases, the Group has started reporting covenant net debt, a new KPI that matches the definition of net debt in the Group’s banking and bond covenants. The Group has stopped reporting lease adjusted net debt as the implementation of IFRS 16 - Leases means that the
effect of leases is already reflected in net debt.
£m 2020 2019
Cash and cash equivalents 505.6 207.9
Non-current interest bearing loans and borrowings (575.7) (583.3)
Non-current lease liabilities (1,168.3) (1,253.6)
Current lease liabilities (158.8) (158.7)
Net debt (1,397.2) (1,787.7)
Less: Liability to pension scheme 30.1 31.5
Less: Lease liabilities 1,327.1 1,412.3
Covenant net debt (40.0) (343.9)
b. Movement in net debt
£m
Cash and cash
equivalents
Leases Term loan and revolving credit
facility and loan notes
Sterling bonds
Liability to pension
scheme
Total
At 1 January 2019 (255.4) 21.0 (1.4) 556.6 32.8 353.6
Recognition of lease liability - 1,566.9 - - - 1,566.9
Cash flow 47.5 (232.6) (2.9) - (3.4) (191.4)
Finance charges movement - - 2.2 0.7 - 2.9
Amortisation of swap cancellation receipt
- - - (3.4) - (3.4)
Discount unwind on liability to pension scheme
-
- - - 2.1 2.1
Discount unwind on lease
liability
- 57.0 - - - 57.0
At 1 January 2020 (207.9) 1,412.3 (2.1) 553.9 31.5 1,787.7
Additions to leases - 99.3 - - - 99.3
Disposals of leases - (21.4) - - - (21.4)
Cash flow (297.7) (222.1) (0.5) - (3.4) (523.7)
Finance charges movement - - 0.6 (0.5) - 0.1
Amortisation of swap cancellation receipt
- - - (5.8) - (5.8)
Discount unwind on liability to pension scheme
-
- - - 2.0 2.0
Discount unwind on lease liability
- 59.0 - - - 59.0
31 December 2020 (505.6) 1,327.1 (2.0) 547.6 30.1 1,397.2
34
16. Return on capital ratios
Group return on capital employed is calculated as follows:
£m 2020 2019
Operating profit 77.1 232.1
Amortisation of acquired intangible assets 9.2 9.0
Adjusting items 140.4 200.4
Adjusted operating profit 226.7 441.5
Opening net assets 2,587.1 2,611.6
Net pension surplus (43.7) (65.8)
Net debt, including opening adjustment for change in accounting policy 1,787.7 1,876.9
Opening capital employed 4,331.1 4,422.7
Closing net assets 2,713.8 2,587.1
Net pension surplus (144.5) (43.7)
Net debt 1,397.2 1,787.7
Closing capital employed 3,966.5 4,331.1
Average capital employed 4,148.8 4,376.9
Group return on capital employed is calculated as follows:
£m 2020 2019
Adjusted operating profit 226.7 441.5
Average capital employed 4,148.8 4,376.9
Return on capital employed 5.5% 10.1%
17. Net debt to adjusted EBITDA
£m 2020 2019
Operating profit 77.1 232.1
Depreciation and amortisation 287.1 300.2
EBITDA 364.2 532.3
Adjusting operating items 140.4 200.4
Share of associates’ results 0.5 (4.3)
Adjusted EBITDA 505.1 728.4
Net debt 1,397.2 1,787.7
Net debt to adjusted EBITDA 2.8x 2.5x
35
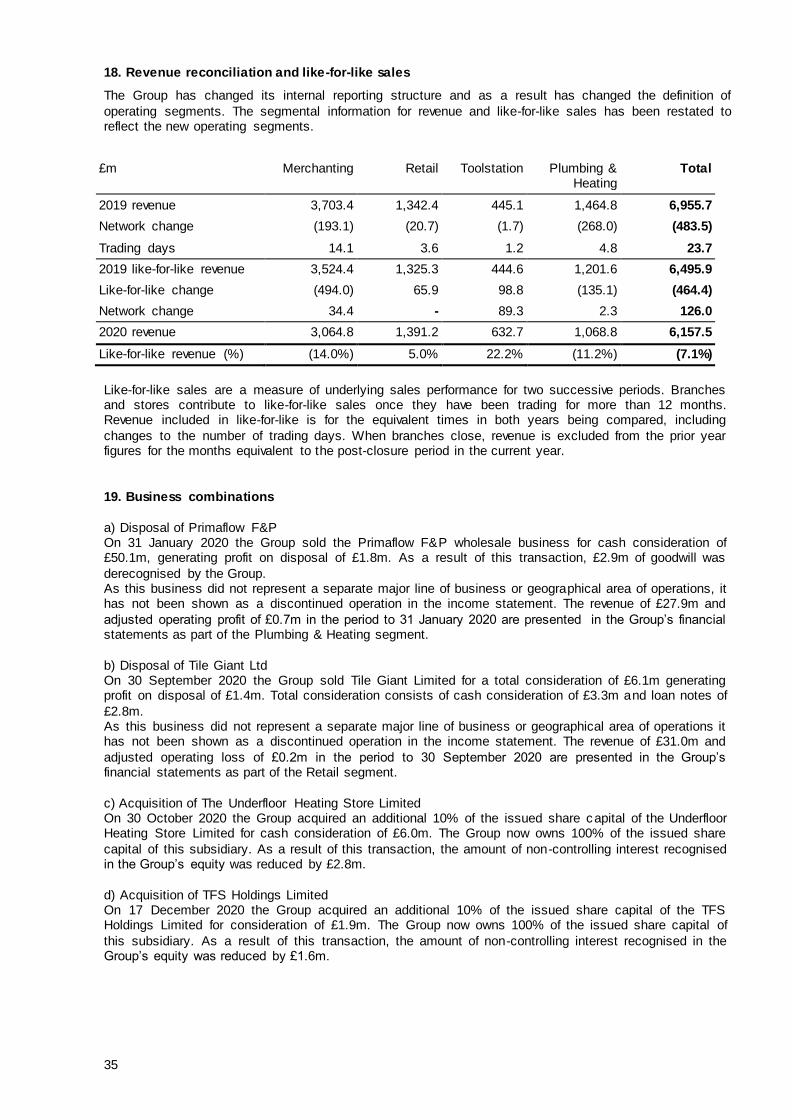
18. Revenue reconciliation and like-for-like sales
The Group has changed its internal reporting structure and as a result has changed the definition of
operating segments. The segmental information for revenue and like-for-like sales has been restated to reflect the new operating segments.
Like-for-like sales are a measure of underlying sales performance for two successive periods. Branches and stores contribute to like-for-like sales once they have been trading for more than 12 months. Revenue included in like-for-like is for the equivalent times in both years being compared, including
changes to the number of trading days. When branches close, revenue is excluded from the prior year figures for the months equivalent to the post-closure period in the current year.
19. Business combinations
a) Disposal of Primaflow F&P On 31 January 2020 the Group sold the Primaflow F&P wholesale business for cash consideration of £50.1m, generating profit on disposal of £1.8m. As a result of this transaction, £2.9m of goodwill was
derecognised by the Group. As this business did not represent a separate major line of business or geographical area of operations, it has not been shown as a discontinued operation in the income statement. The revenue of £27.9m and
adjusted operating profit of £0.7m in the period to 31 January 2020 are presented in the Group’s financial statements as part of the Plumbing & Heating segment.
b) Disposal of Tile Giant Ltd On 30 September 2020 the Group sold Tile Giant Limited for a total consideration of £6.1m generating profit on disposal of £1.4m. Total consideration consists of cash consideration of £3.3m and loan notes of
£2.8m. As this business did not represent a separate major line of business or geographical area of operations it has not been shown as a discontinued operation in the income statement. The revenue of £31.0m and
adjusted operating loss of £0.2m in the period to 30 September 2020 are presented in the Group’s financial statements as part of the Retail segment.
c) Acquisition of The Underfloor Heating Store Limited On 30 October 2020 the Group acquired an additional 10% of the issued share capital of the Underfloor Heating Store Limited for cash consideration of £6.0m. The Group now owns 100% of the issued share
capital of this subsidiary. As a result of this transaction, the amount of non-controlling interest recognised in the Group’s equity was reduced by £2.8m.
d) Acquisition of TFS Holdings Limited On 17 December 2020 the Group acquired an additional 10% of the issued share capital of the TFS Holdings Limited for consideration of £1.9m. The Group now owns 100% of the issued share capital of
this subsidiary. As a result of this transaction, the amount of non-controlling interest recognised in the Group’s equity was reduced by £1.6m.
36
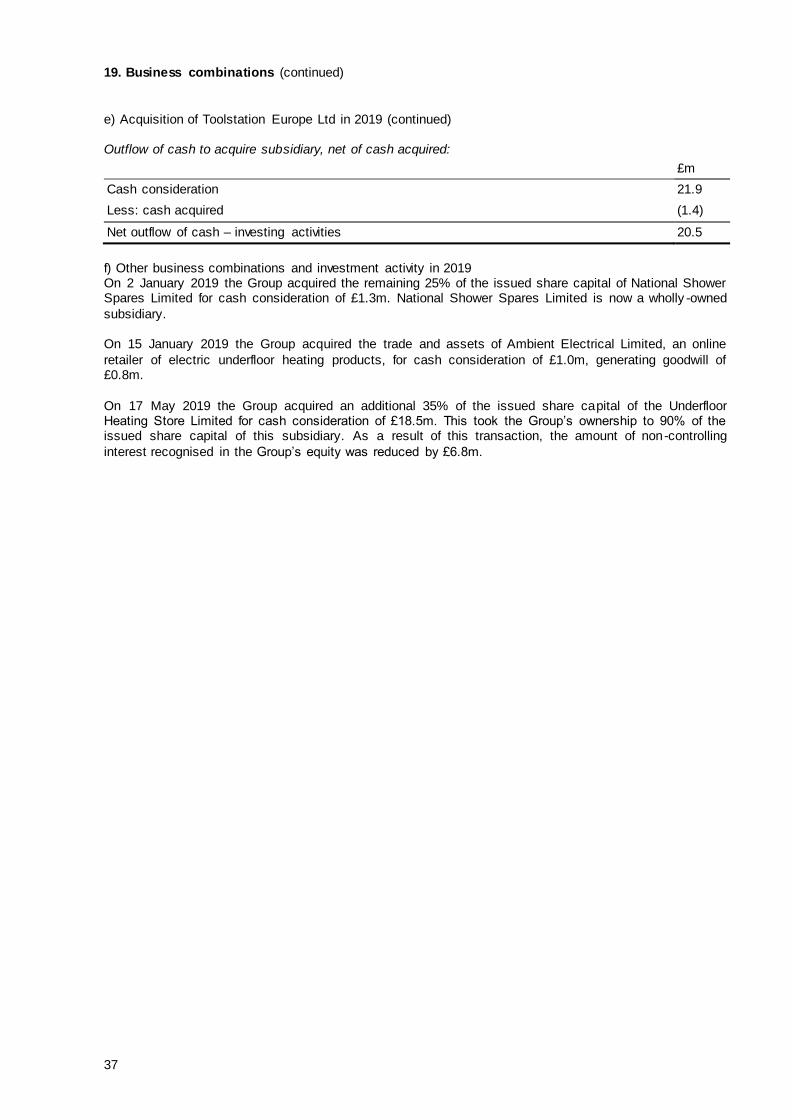
19. Business combinations (continued)
e) Acquisition of Toolstation Europe Ltd in 2019 On 30 September 2019 the Group acquired an additional 49.5% of the ordinary share capital of Toolstation Europe Limited for transferred cash consideration of £21.9m, giving the Group a controlling
97.1% share of the business. In accordance with the requirements of the acquisition accounting method, the existing 47.5% investment in associate was remeasured to fair value. This fair value was calculated based on the amount paid for the additional 49% acquired, creating a gain of £40.3m that was credited to
the consolidated income statement as an adjusting item (see note 3). Consideration and assets and liabilities acquired
The consideration was as follows:
£m
Consideration transferred: cash paid 21.9
Fair value of pre-existing equity investment 21.0
Settlement of pre-existing loans and preference shares 66.7
Total consideration 109.6
Fair values ascribed to the identifiable assets and liabilities acquired and the goodwill recognised were:
The goodwill recognised is principally made up of the value of the assembled workforce and the value to
be derived from recently-opened stores that have not yet reached maturity. It will not be deductible for tax purposes.
Measurement of non-controlling interest The Group has elected to recognise the non-controlling interest in Toolstation Europe Limited at its proportionate share of the acquired identifiable assets and liabilities.
37
19. Business combinations (continued)
e) Acquisition of Toolstation Europe Ltd in 2019 (continued) Outflow of cash to acquire subsidiary, net of cash acquired:
£m
Cash consideration 21.9
Less: cash acquired (1.4)
Net outflow of cash – investing activities 20.5
f) Other business combinations and investment activity in 2019 On 2 January 2019 the Group acquired the remaining 25% of the issued share capital of National Shower Spares Limited for cash consideration of £1.3m. National Shower Spares Limited is now a wholly -owned
subsidiary. On 15 January 2019 the Group acquired the trade and assets of Ambient Electrical Limited, an online
retailer of electric underfloor heating products, for cash consideration of £1.0m, generating goodwill of £0.8m.
On 17 May 2019 the Group acquired an additional 35% of the issued share capital of the Underfloor Heating Store Limited for cash consideration of £18.5m. This took the Group’s ownership to 90% of the issued share capital of this subsidiary. As a result of this transaction, the amount of non-controlling
interest recognised in the Group’s equity was reduced by £6.8m.