1 For immediate release (Press Release No.17/2020) Information Note to the Press TELECOM REGULATORY AUTHORITY OF INDIA New Delhi, 25 th February, 2020 (www.trai.gov.in) Highlights of Telecom Subscription Data as on 31 st December, 2019 ❖ In the month of December, 2019, 3.46 million subscribers submitted their requests for Mobile Number Portability (MNP). With this, the cumulative MNP requests increased from 466.62 million at the end of Nov-19 to 470.08 million at the end of Dec-19, since implementation of MNP. ❖ Number of active wireless subscribers (on the date of peak VLR # ) in December, 2019 was 982.57 million. ________________________________________________________________________________________________________________________________________ Note: - Information in this Press Release is based on the data provided by the Service Providers * Based on the population projections from Census data published by the Office of Registrar General & Census Commissioner of India. # VLR is acronym of Visitor Location Register. The dates of peak VLR for various TSPs are different in different service areas. Particulars Wireless Wireline Total (Wireless+ Wireline) Total Telephone Subscribers (Million) 1151.44 21.00 1172.44 Net Addition in December, 2019 (Million) -3.15 -0.29 -3.44 Monthly Growth Rate -0.27% -1.34% -0.29% Urban Telephone Subscribers (Million) 643.97 18.47 662.45 Net Addition in December, 2019 (Million) -3.36 -0.18 -3.54 Monthly Growth Rate -0.52% -0.97% -0.53% Rural Telephone Subscribers (Million) 507.46 2.53 509.99 Net Addition in December, 2019 (Million) 0.21 -0.10 0.10 Monthly Growth Rate 0.04% -3.95% 0.02% Overall Tele-density*(%) 86.98% 1.59% 88.56% Urban Tele-density*(%) 151.90% 4.36% 156.26% Rural Tele-density*(%) 56.39% 0.28% 56.67% Share of Urban Subscribers 55.93% 87.95% 56.50% Share of Rural Subscribers 44.07% 12.05% 43.50% Broadband Subscribers (Million) 642.80 19.14 661.94
Transcript
1
For immediate release (Press Release No.17/2020) Information Note to the Press
TELECOM REGULATORY AUTHORITY OF INDIA New Delhi, 25th February, 2020
(www.trai.gov.in)
Highlights of Telecom Subscription Data as on 31st December, 2019
❖ In the month of December, 2019, 3.46 million subscribers submitted their
requests for Mobile Number Portability (MNP). With this, the cumulative
MNP requests increased from 466.62 million at the end of Nov-19 to 470.08
million at the end of Dec-19, since implementation of MNP.
❖ Number of active wireless subscribers (on the date of peak VLR#) in
Overall Tele-density (Circle/State Wise) – As on 31st December, 2019
• As may be seen in the above chart, nine states have less tele-density than
the all India average tele-density at the end of Dec-19. Delhi service area
has maximum tele-density of 237.11 and the Bihar service area has
minimum tele-density of 58.92 at the end of Dec-19.
Notes:
1. Population data/projections are available state wise only.
2. Tele-density figures are derived from the telephone subscriber data provided by the access service
providers and the projections of population published by the Office of the Registrar General &
Census Commissioner, India.
3. Telephone subscriber data for Delhi, includes, apart from the data for the State of Delhi, wireless
subscriber data for the areas served by the local exchanges of Ghaziabad & Noida (in Uttar
Pradesh) and Gurgaon & Faridabad (in Haryana).
4. Data/information for West Bengal includes Kolkata, Maharashtra includes Mumbai, Tamil Nadu
includes Chennai and Uttar Pradesh includes UPE & UPW service area(s).
5. Data/information for Andhra Pradesh includes Telengana, Madhya Pradesh includes
Chhatishgarh, Bihar includes Jharkhand, Maharashtra includes Goa, Uttar Pradesh includes
Uttarakhand, West Bengal includes Sikkim and North-East includes Arunachal Pradesh,
Manipur, Meghalaya, Mizoram, Nagaland & Tripura States.
4
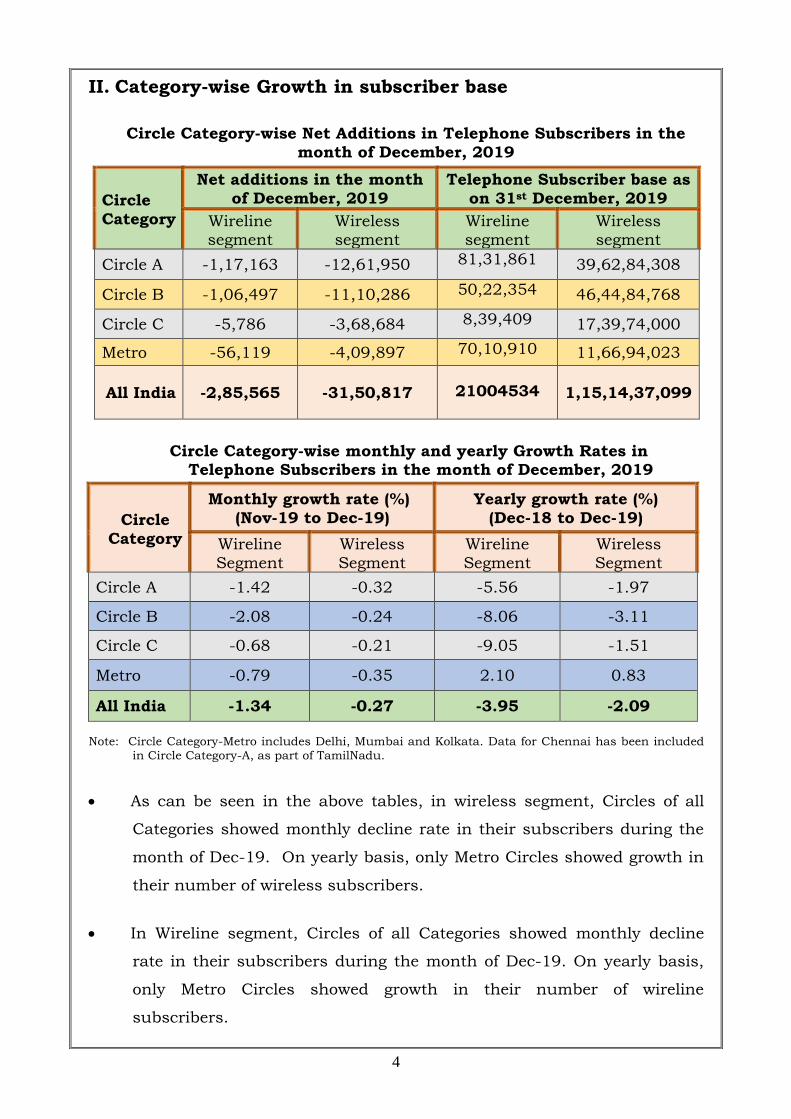
II. Category-wise Growth in subscriber base
Circle Category-wise Net Additions in Telephone Subscribers in the
month of December, 2019
Circle
Category
Net additions in the month
of December, 2019
Telephone Subscriber base as
on 31st December, 2019
Wireline segment
Wireless segment
Wireline segment
Wireless segment
Circle A -1,17,163 -12,61,950 81,31,861 39,62,84,308
Circle B -1,06,497 -11,10,286 50,22,354 46,44,84,768
Circle C -5,786 -3,68,684 8,39,409 17,39,74,000
Metro -56,119 -4,09,897 70,10,910 11,66,94,023
All India -2,85,565 -31,50,817
21004534
1,15,14,37,099
Circle Category-wise monthly and yearly Growth Rates in Telephone Subscribers in the month of December, 2019
Circle
Category
Monthly growth rate (%)
(Nov-19 to Dec-19)
Yearly growth rate (%)
(Dec-18 to Dec-19)
Wireline
Segment
Wireless
Segment
Wireline
Segment
Wireless
Segment
Circle A -1.42 -0.32 -5.56 -1.97
Circle B -2.08 -0.24 -8.06 -3.11
Circle C -0.68 -0.21 -9.05 -1.51
Metro -0.79 -0.35 2.10 0.83
All India -1.34 -0.27 -3.95 -2.09
Note: Circle Category-Metro includes Delhi, Mumbai and Kolkata. Data for Chennai has been included in Circle Category-A, as part of TamilNadu.
• As can be seen in the above tables, in wireless segment, Circles of all
Categories showed monthly decline rate in their subscribers during the
month of Dec-19. On yearly basis, only Metro Circles showed growth in
their number of wireless subscribers.
• In Wireline segment, Circles of all Categories showed monthly decline
rate in their subscribers during the month of Dec-19. On yearly basis,
only Metro Circles showed growth in their number of wireline
subscribers.
5
III. Wireless Subscribers
• Total wireless subscribers (2G, 3G &
4G) declined from 1,154.59 million at
the end of Nov-19 to 1,151.44 million
at the end of Dec-19, thereby
registering a monthly decline rate of
0.27%. Wireless subscription in urban
areas declined from 647.33 million at
the end of Nov-19 to 643.97 million at
the end of Dec-19, however wireless
subscription in rural areas increased
from 507.26 million at the end of
Nov-19 to 507.46 million at the end of
Dec-19. Monthly growth rates of
urban and rural wireless subscription
were -0.52% and 0.04% respectively.
• The Wireless Tele-density in India
declined from 87.29 at the end of Nov-19
to 86.98 at the end of Dec-19. The
Urban Wireless Tele-density declined
from 152.92 at the end of Nov-19 to
151.90 at the end of Dec-19 and Rural
Wireless Tele-density also declined from
56.40 to 56.39 during the same period.
The share of urban and rural wireless
subscribers in total number of wireless
subscribers was 55.93% and 44.07%
respectively at the end of Dec-19.
Detailed statistics of wireless subscriber
base is available at Annexure-I.
6
• As on 31st December, 2019, the private access service providers held
89.45% market share of the wireless subscribers whereas BSNL and MTNL, the
two PSU access service providers, had a market share of only 10.55%.
• The graphical representation of access service provider-wise market share
and net additions in wireless subscriber base are given below:
Access Service Provider-wise Market Shares in term of Wireless Subscribers as on 31st December, 2019
Net Additions in Wireless Subscribers of Access Service Providers in the month of December, 2019
Note: 1. M/s Bharti Airtel Ltd has reported the wireless subscribers including the subscribers of M/s Tata Teleservices Ltd. However, DoT has not yet approved merger of them.
2. Virtual Network Operator (VNO) of BSNL has started reporting of its subscribers from the month of October, 2018 and the same has been included in the subscriber base of BSNL.
7
IV. Active Wireless Subscribers (VLR Data)
• Out of the total wireless
subscribers (1,151.44 million),
982.57 million wireless subscribers
were active on the date of peak
VLR in the month of Dec-19. The
proportion of active wireless
subscribers was approximately
85.33% of the total wireless
subscriber base.
• The detailed statistics on
proportion of active wireless
subscribers (also referred to as
VLR subscribers) on the date of
peak VLR in the month of Dec-19
is available at Annexure-II and the
methodology used for reporting
VLR subscribers is available at
Annexure-IV.
Access Service Provider-wise Percentage of VLR Subscribers
in the month of December, 2019
• Bharti Airtel has the maximum
proportion (96.14%) of its active
wireless subscribers (VLR) as
against its total wireless
subscribers (HLR) on the date of
peak VLR in the month of Dec-19
and MTNL has the minimum
proportion of VLR (26.86%) of its
HLR during the same period.
8
Service Area wise percentage of VLR Subscribers
in the Month of December, 2019
V. Growth in Wireless Subscribers
Access Service Provider-wise Monthly Growth Rate of Wireless
Subscribers in the month of December, 2019
Note: BSNL includes its Virtual Network Operator (VNO).
9
Service Area-wise Monthly Growth Rate of Wireless Subscribers in the month of December, 2019
• All service areas showed decline
except J&K, Madhya Pradesh and
U.P.(East) in their wireless
subscribers during the month of
Dec-19. Jammu & Kashmir
service area showed maximum
growth of 4.99% in their wireless
subscriber during the month.
VI. Mobile Number Portability (MNP)
• Intra-service area Mobile number
portability (MNP) was implemented
first in Haryana service area w.e.f.
25.11.2010 and in the rest of the
country w.e.f. 20.01.2011. Inter-
Service Area MNP has been
implemented in the country w.e.f.
03.07.2015. Now, the wireless
telephone subscribers can retain
their mobile numbers when they
relocate from one service area to
another.
• During the month of Dec-19, a
total of 3.46 million requests were
received for MNP. Out of total 3.46
million new requests, 1.76 million
requests received from Zone-I and
1.70 million requests received from
Zone-II. The cumulative MNP
requests increased from 466.62
million at the end of Nov-19 to
470.08 million at the end of
Dec-19, since the implementation
of MNP.
10
• In MNP Zone-I (Northern and
Western India), the highest number
of requests till date have been
received in Rajasthan (about 36.45
million) followed by Maharashtra
(about 35.88 million) service area.
• In MNP Zone-II (Southern and
Eastern India), the highest
number of requests till date have
been received in Karnataka (about
42.77 million) followed by Andhra
Pradesh (about 39.58 million).
Service Area Wise MNP Status
Zone -1 Zone - 2
Service Area
Number of Porting Requests (in
Million) Service Area
Number of Porting Requests
(in Million)
Nov-19 Dec-19 Nov-19 Dec-19
Delhi 24.06 24.23 Andhra Pradesh 39.28 39.58
Gujarat 31.10 31.33 Assam 3.59 3.61
Haryana 16.88 16.97 Bihar 19.05 19.23
Himachal Pradesh 2.28 2.29 Karnataka 42.55 42.77
Jammu & Kashmir 1.13 1.14 Kerala 11.73 11.86
Maharashtra 35.44 35.88 Kolkata 11.04 11.11
Mumbai 23.43 23.55 Madhya Pradesh 30.90 31.16
Punjab 18.06 18.15 North East 1.40 1.40
Rajasthan 36.28 36.45 Orissa 9.31 9.39
U.P.(East) 26.10 26.36 Tamil Nadu 38.98 39.27
U.P.(West) 21.11 21.27 West Bengal 22.92 23.06
Total 235.87 237.63 Total 230.74 232.44
Total (Zone-1 + Zone-2) 466.62 470.08
Net Addition (December, 2019) 3.46
VII. Wireline Subscribers
• Wireline subscribers declined from
21.29 million at the end of Nov-19
to 21.00 million at the end of
Dec-19. Net decline in the wireline
subscriber base was 0.29 million
with a monthly decline rate of
1.34%. The share of urban and
rural subscribers in total wireline
subscribers were 87.95% and
12.05% respectively at the end of
Dec-19.
11
• The Overall Wireline Tele-density
declined from 1.61 at the end of
Nov-19 to 1.59 at the end of
Dec-19. Urban and Rural Wireline
Tele-density were 4.36 and 0.28
respectively during the same
period.
• BSNL and MTNL, the two PSU
access service providers, held
60.47% of the wireline market
share as on 31st December, 2019.
Detailed statistics of wireline
subscriber base are available at
Annexure-III.
Access Service Provider-wise Market Shares of Wireline Subscribers
as on 31st December, 2019
Access Service Provider-wise Net Additions/declines in Wireline
Subscribers during the month of December, 2019
12
VIII. Broadband (≥ 512 Kbps download)
• As per the reports received from
341 operators in the month of
December, 2019, the number of
broadband subscribers increased
from 661.27 million at the end of
Nove-19 to 661.94 million at the
end of Dec-19 with a monthly
growth rate of 0.10%. Segment-
wise broadband subscribers and
their monthly growth rates are as
below:
Segment–wise Broadband Subscribers and Monthly Growth Rate in the