Highlights of the Main Results Department of Population Ministry of Immigration and Population May 2015 Census Report Volume 2 – A THE REPUBLIC OF THE UNION OF MYANMAR The 2014 Myanmar Population and Housing Census
A. Size and Spatial Distribution of the Population ..................................................................................2
B. Age and Sex Composition of the Population ......................................................................................8
C. Households ......................................................................................................................................11
Chapter 2: Social Characteristics ...............................................................................................................13
A. Marital Status ...................................................................................................................................13
A. Literacy .............................................................................................................................................18
B. School Attendance ...........................................................................................................................20
Chapter 9: Housing Conditions and Household Amenities .......................................................................29
A. Ownership of Housing Unit ..............................................................................................................29
B. Sources of Energy .............................................................................................................................30
C. Sources of Water ..............................................................................................................................34
D. Toilet Facilities ..................................................................................................................................36
E. Communication Facilities .................................................................................................................39
F. Transportation Equipment ................................................................................................................40
Concluding Remarks: Data Use and Data Access ......................................................................................41
In April 2014, the Government of the Republic of the Union of Myanmar conducted its latest census, after three decades without a Population and Housing Census. The last Census was conducted in 1983. Despite the absence of censuses, several household based surveys such as Fertility and Reproductive Health Surveys, Family and Youth Surveys, Population Change and Fertility Surveys, among others, have regularly been carried out to guide programming and policy development in the country.
Censuses are an important source of benchmark information on the characteristics of the population and households in every country. One unique feature of a census is its ability to provide information down to the lowest administrative level. Such information is vital for planning and evidence-based decision making at every level. Additional data uses include allocation of national resources; review of administrative boundaries; positioning of social infrastructures such as schools, health facilities and roads; and research. Furthermore, censuses provide a rich source of data for monitoring national and international development initiatives such as the Millennium Development Goals (MDG) and the International Conference on Population and Development (ICPD). All these objectives made it imperative for Myanmar to conduct the 2014 Population and Housing Census (2014 MPHC).
The 2014 MPHC results are being released in three phases comprising several publications. Phase one was the publishing and launch of the provisional results (Census Volume 1) in August 2014. Phase two is the publishing and launch of the main results in May 2015 comprising two series of publications: Census Volume 2, which contains detailed information at the Union and State/Region levels, and Census Volume 3, which includes a report for each of the 15 States and Regions in Myanmar. The publication of main census results that require manual coding and further consultations is planned for early 2016. Phase three of the publications will be the thematic analysis reports on the major topics covered in the census. This phase is planned to be implemented from June 2015 onwards.
This publication, the Highlights of the Main Results, is designed to provide a quick reference for those interested to learn about the important highlights of the 2014 Population and Housing Census. It may also serve as a guide for policy makers, media and other data users. It contains basic data and interpretations of the main results (Census Volume 2) in the form of simple texts, tables, graphs and maps on the size and geographical distribution of the population by sex and age, marital status, education, economic characteristics, fertility, mortality, migration and the characteristics of housing units and household amenities.
More detailed information and data are available in the Union Report of the Main Results (Census Volume 2) and the State/Region specific reports (Census Volume 3), which are available in printed copies and electronically online at www.dop.gov.mm and http://countryoffice.unfpa.org/myanmar/census/ as well as on CD.
A. Size and Spatial Distribution of the Population
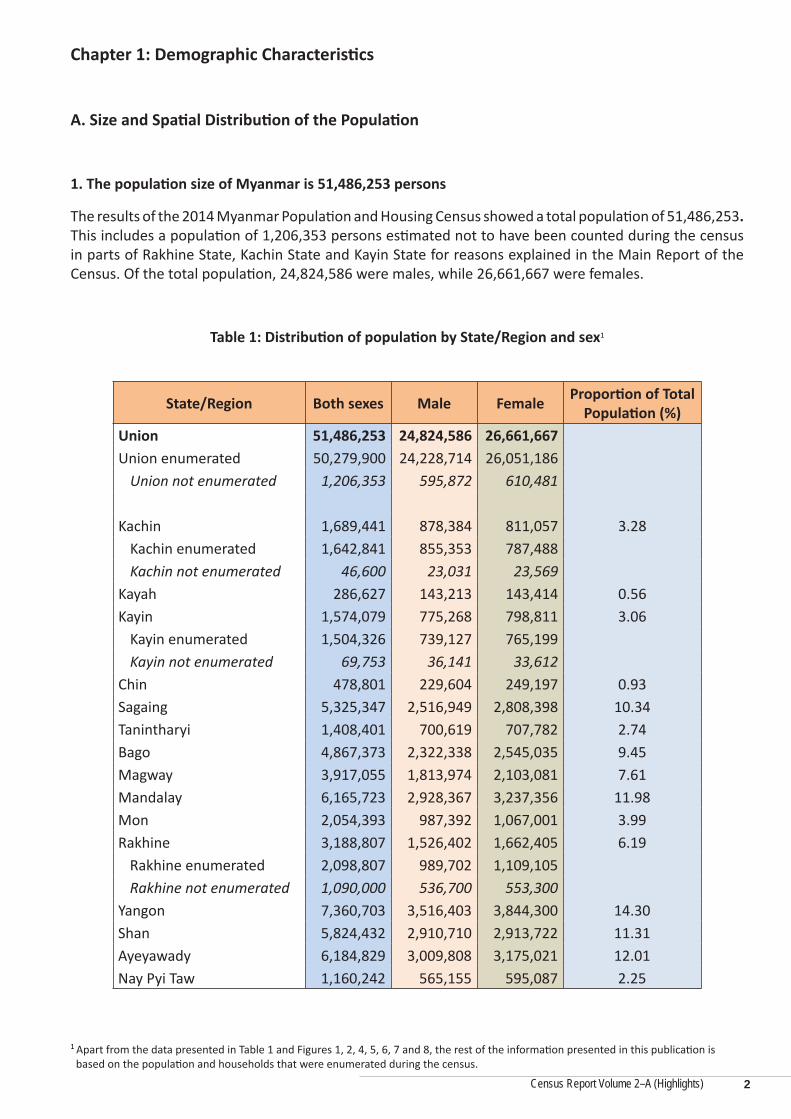
1. The population size of Myanmar is 51,486,253 persons
The results of the 2014 Myanmar Population and Housing Census showed a total population of 51,486,253. This includes a population of 1,206,353 persons estimated not to have been counted during the census in parts of Rakhine State, Kachin State and Kayin State for reasons explained in the Main Report of the Census. Of the total population, 24,824,586 were males, while 26,661,667 were females.
Table 1: Distribution of population by State/Region and sex1
State/Region Both sexes Male Female Proportion of Total Population (%)
Union 51,486,253 24,824,586 26,661,667Union enumerated 50,279,900 24,228,714 26,051,186
1 Apart from the data presented in Table 1 and Figures 1, 2, 4, 5, 6, 7 and 8, the rest of the information presented in this publication is based on the population and households that were enumerated during the census.
2
Census Report Volume 2–A (Highlights)
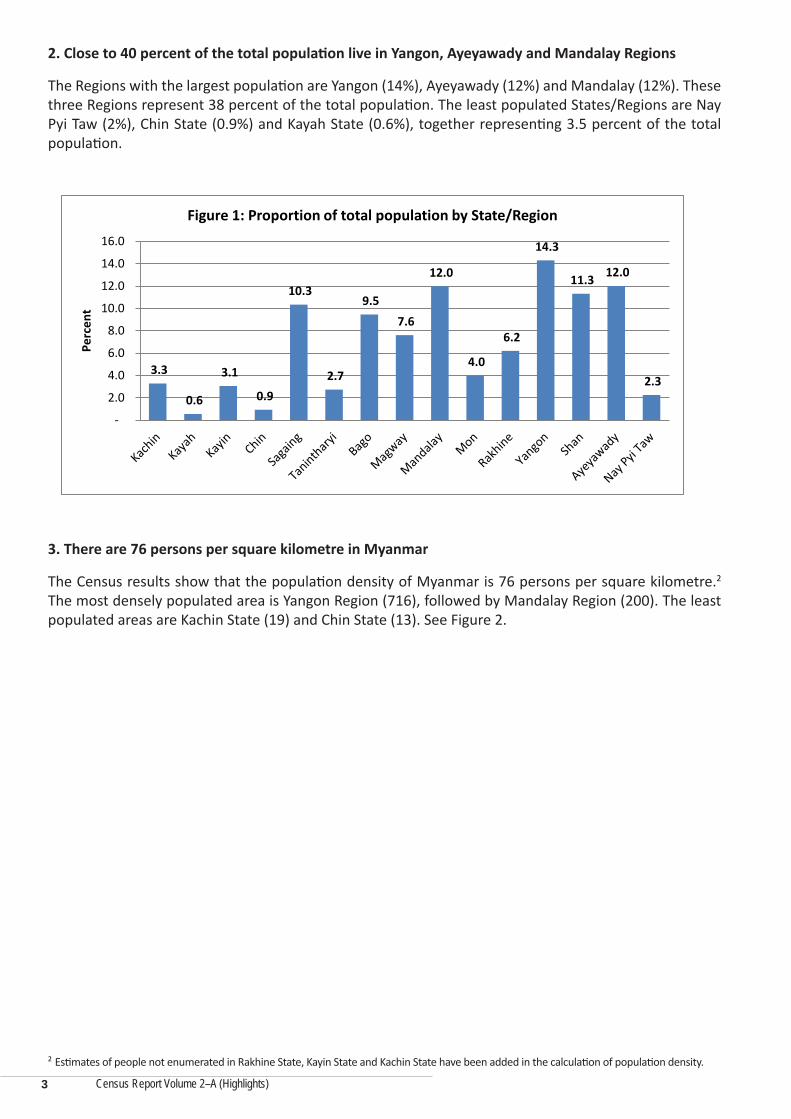
2. Close to 40 percent of the total population live in Yangon, Ayeyawady and Mandalay Regions
The Regions with the largest population are Yangon (14%), Ayeyawady (12%) and Mandalay (12%). These three Regions represent 38 percent of the total population. The least populated States/Regions are Nay Pyi Taw (2%), Chin State (0.9%) and Kayah State (0.6%), together representing 3.5 percent of the total population.
3.3
0.6
3.1
0.9
10.3
2.7
9.5 7.6
12.0
4.0
6.2
14.3
11.3 12.0
2.3
-
2.0
4.0
6.0
8.0
10.0
12.0
14.0
16.0
Perc
ent
Figure 1: Proportion of total population by State/Region
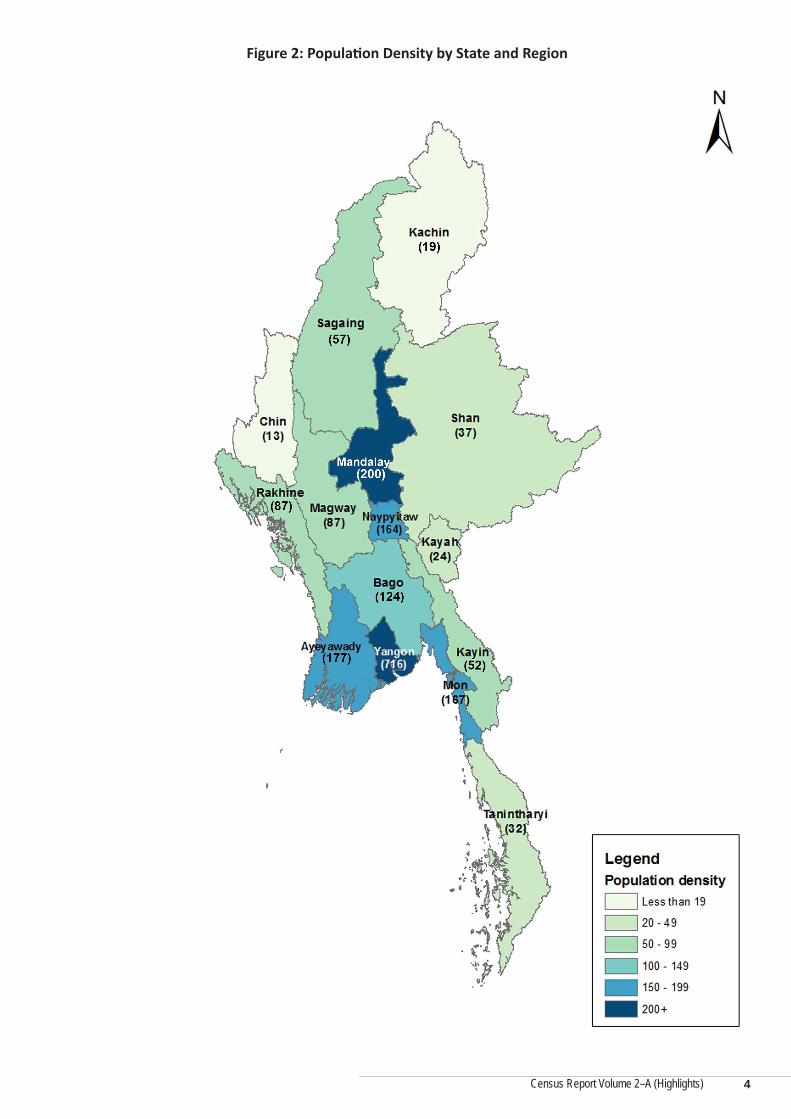
3. There are 76 persons per square kilometre in Myanmar
The Census results show that the population density of Myanmar is 76 persons per square kilometre.2 The most densely populated area is Yangon Region (716), followed by Mandalay Region (200). The least populated areas are Kachin State (19) and Chin State (13). See Figure 2.
2 Estimates of people not enumerated in Rakhine State, Kayin State and Kachin State have been added in the calculation of population density.
3
Census Report Volume 2–A (Highlights)
Figure 2: Population Density by State and Region
4
Census Report Volume 2–A (Highlights)
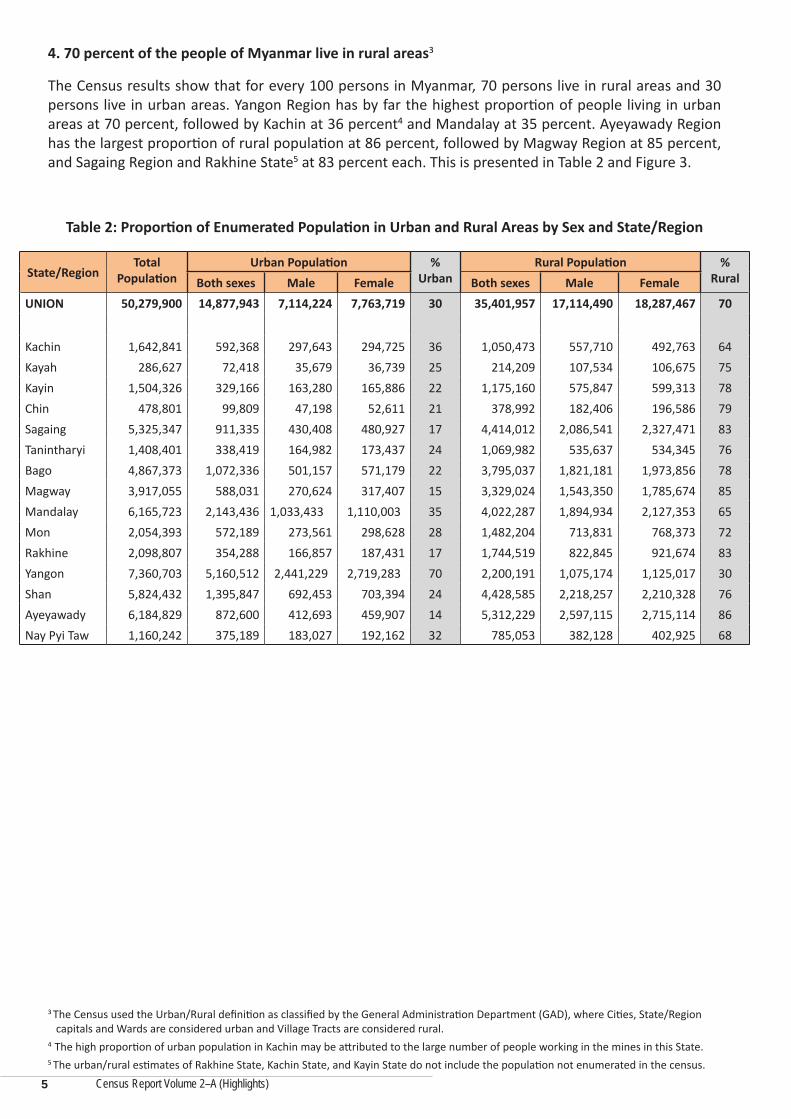
4. 70 percent of the people of Myanmar live in rural areas3
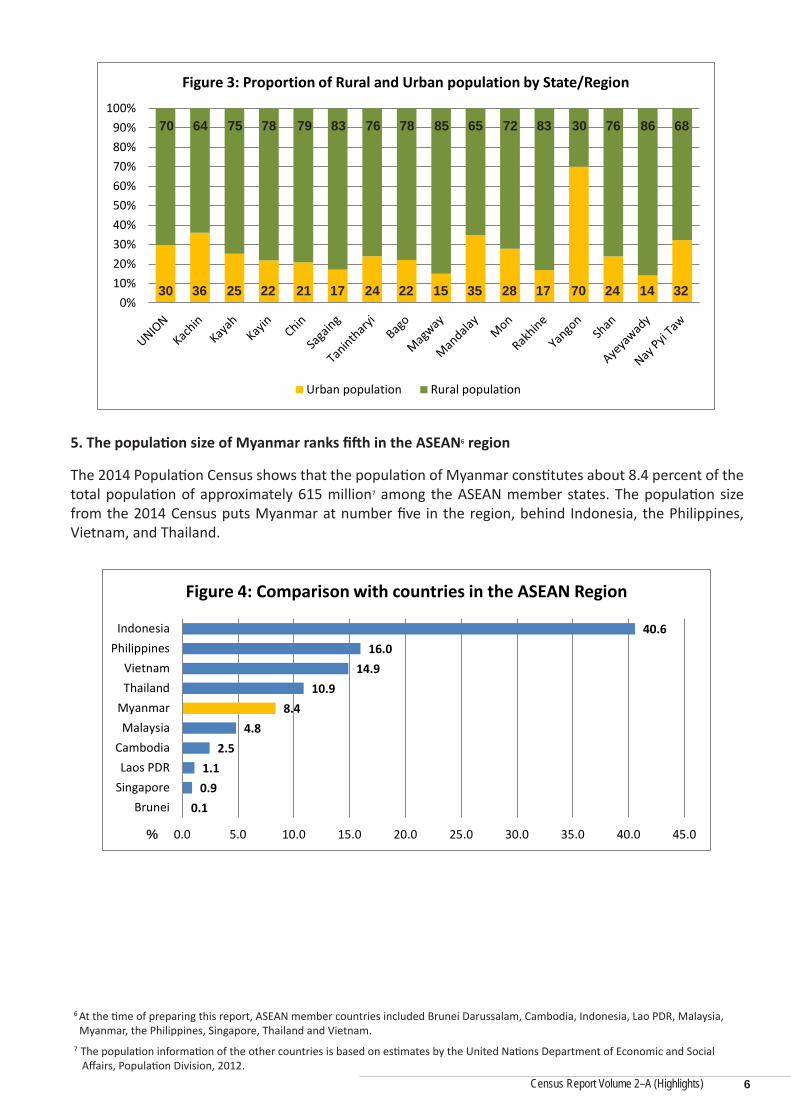
The Census results show that for every 100 persons in Myanmar, 70 persons live in rural areas and 30 persons live in urban areas. Yangon Region has by far the highest proportion of people living in urban areas at 70 percent, followed by Kachin at 36 percent4 and Mandalay at 35 percent. Ayeyawady Region has the largest proportion of rural population at 86 percent, followed by Magway Region at 85 percent, and Sagaing Region and Rakhine State5 at 83 percent each. This is presented in Table 2 and Figure 3.
Table 2: Proportion of Enumerated Population in Urban and Rural Areas by Sex and State/Region
State/RegionTotal
PopulationUrban Population %
UrbanRural Population %
RuralBoth sexes Male Female Both sexes Male FemaleUNION 50,279,900 14,877,943 7,114,224 7,763,719 30 35,401,957 17,114,490 18,287,467 70
3 The Census used the Urban/Rural definition as classified by the General Administration Department (GAD), where Cities, State/Region capitals and Wards are considered urban and Village Tracts are considered rural. 4 The high proportion of urban population in Kachin may be attributed to the large number of people working in the mines in this State. 5 The urban/rural estimates of Rakhine State, Kachin State, and Kayin State do not include the population not enumerated in the census.
5
Census Report Volume 2–A (Highlights)
5. The population size of Myanmar ranks fifth in the ASEAN6 region
The 2014 Population Census shows that the population of Myanmar constitutes about 8.4 percent of the total population of approximately 615 million7 among the ASEAN member states. The population size from the 2014 Census puts Myanmar at number five in the region, behind Indonesia, the Philippines, Vietnam, and Thailand.
6 At the time of preparing this report, ASEAN member countries included Brunei Darussalam, Cambodia, Indonesia, Lao PDR, Malaysia, Myanmar, the Philippines, Singapore, Thailand and Vietnam.
7 The population information of the other countries is based on estimates by the United Nations Department of Economic and Social Affairs, Population Division, 2012.
0.1 0.9 1.1
2.5 4.8
8.4 10.9
14.9 16.0
40.6
0.0 5.0 10.0 15.0 20.0 25.0 30.0 35.0 40.0 45.0
BruneiSingaporeLaos PDR
CambodiaMalaysia
MyanmarThailandVietnam
PhilippinesIndonesia
Figure 4: Comparison with countries in the ASEAN Region
6
%
0%10%20%30%40%50%60%70%80%90%
100%
Figure 3: Proportion of Rural and Urban population by State/Region
Urban population Rural population
70 64 75 78 79 83 76 78 85 65 72 83 30 76 86 68
30 36 25 22 21 17 24 22 15 35 28 17 70 24 14 32
Census Report Volume 2–A (Highlights)
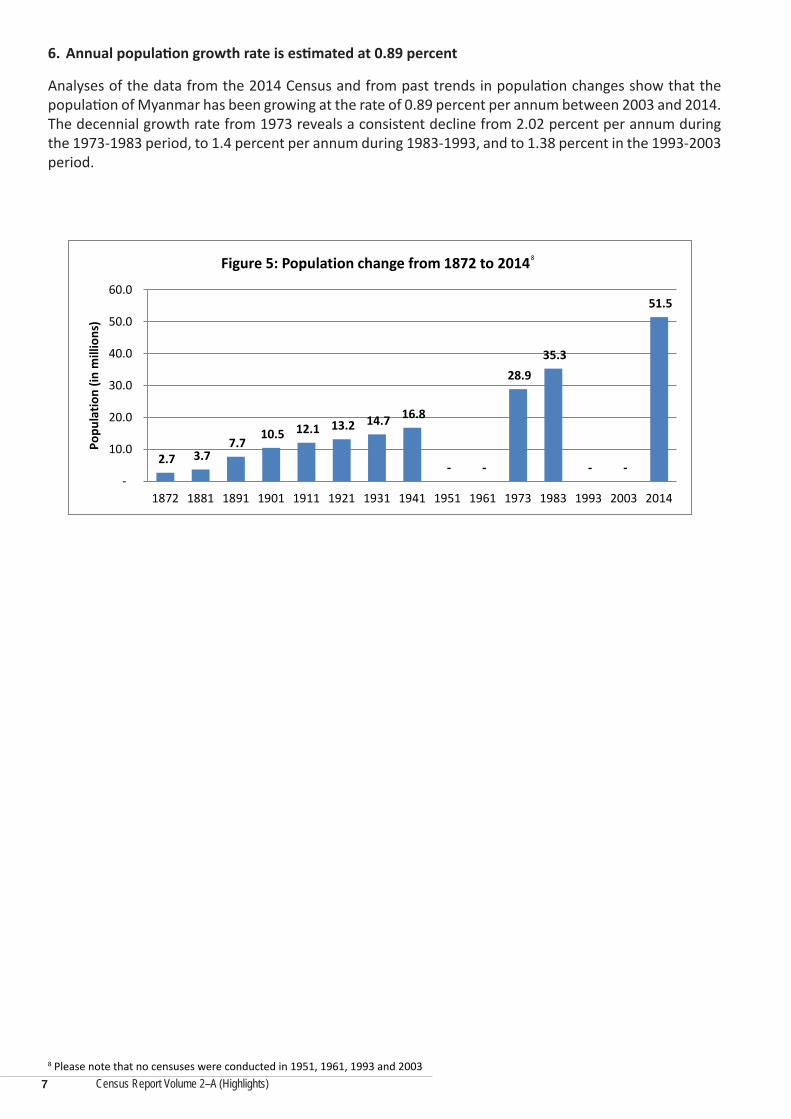
6. Annual population growth rate is estimated at 0.89 percent
Analyses of the data from the 2014 Census and from past trends in population changes show that the population of Myanmar has been growing at the rate of 0.89 percent per annum between 2003 and 2014. The decennial growth rate from 1973 reveals a consistent decline from 2.02 percent per annum during the 1973-1983 period, to 1.4 percent per annum during 1983-1993, and to 1.38 percent in the 1993-2003 period.
8 Please note that no censuses were conducted in 1951, 1961, 1993 and 2003
8
Census Report Volume 2–A (Highlights)
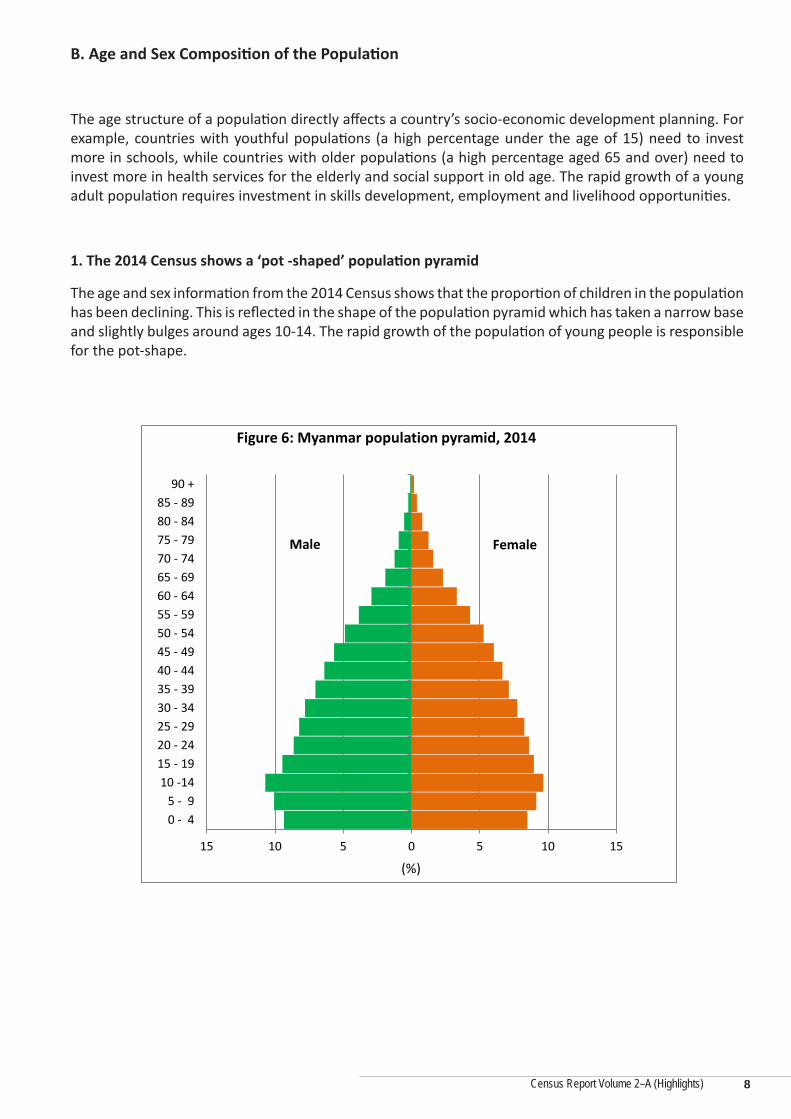
B. Age and Sex Composition of the Population
The age structure of a population directly affects a country’s socio-economic development planning. For example, countries with youthful populations (a high percentage under the age of 15) need to invest more in schools, while countries with older populations (a high percentage aged 65 and over) need to invest more in health services for the elderly and social support in old age. The rapid growth of a young adult population requires investment in skills development, employment and livelihood opportunities.
1. The 2014 Census shows a ‘pot -shaped’ population pyramid
The age and sex information from the 2014 Census shows that the proportion of children in the population has been declining. This is reflected in the shape of the population pyramid which has taken a narrow base and slightly bulges around ages 10-14. The rapid growth of the population of young people is responsible for the pot-shape.
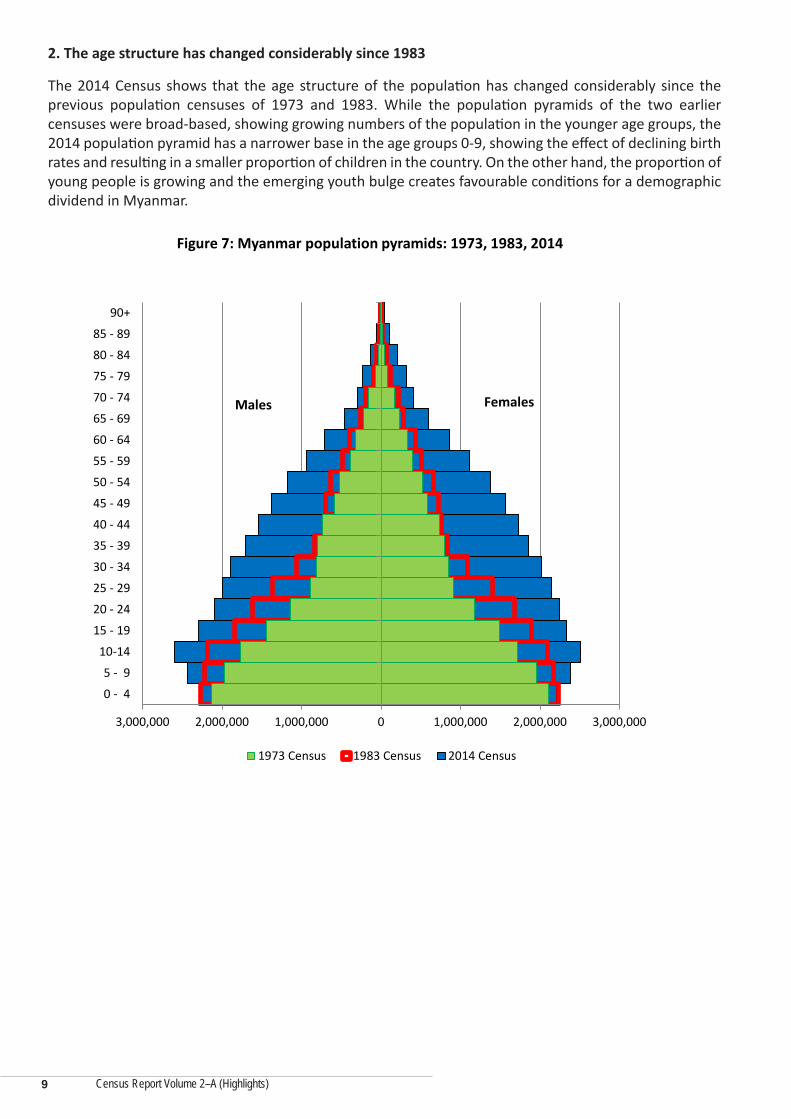
2. The age structure has changed considerably since 1983
The 2014 Census shows that the age structure of the population has changed considerably since the previous population censuses of 1973 and 1983. While the population pyramids of the two earlier censuses were broad-based, showing growing numbers of the population in the younger age groups, the 2014 population pyramid has a narrower base in the age groups 0-9, showing the effect of declining birth rates and resulting in a smaller proportion of children in the country. On the other hand, the proportion of young people is growing and the emerging youth bulge creates favourable conditions for a demographic dividend in Myanmar.
Figure 7: Myanmar population pyramids: 1973, 1983, 2014
1973 Census 1983 Census 2014 Census
Males Females
9
Census Report Volume 2–A (Highlights)
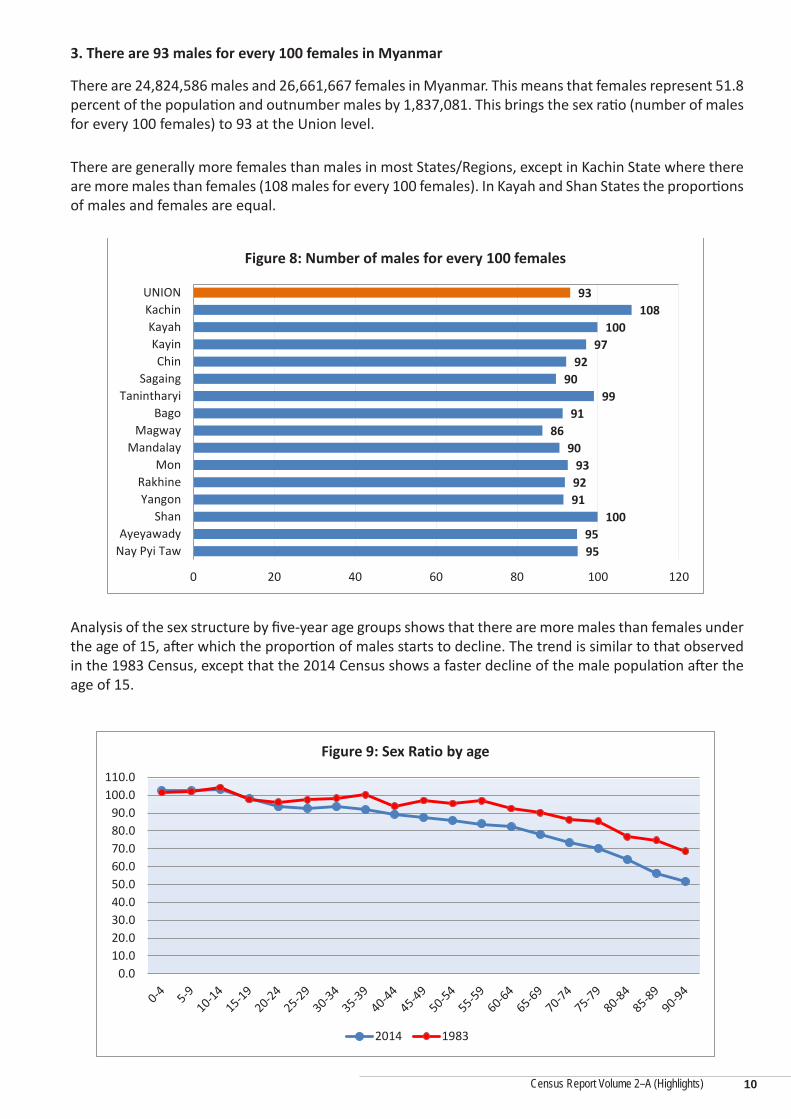
3. There are 93 males for every 100 females in Myanmar
There are 24,824,586 males and 26,661,667 females in Myanmar. This means that females represent 51.8 percent of the population and outnumber males by 1,837,081. This brings the sex ratio (number of males for every 100 females) to 93 at the Union level.
There are generally more females than males in most States/Regions, except in Kachin State where there are more males than females (108 males for every 100 females). In Kayah and Shan States the proportions of males and females are equal.
Analysis of the sex structure by five-year age groups shows that there are more males than females under the age of 15, after which the proportion of males starts to decline. The trend is similar to that observed in the 1983 Census, except that the 2014 Census shows a faster decline of the male population after the age of 15.
93 108
100 97
92 90
99 91
86 90
93 92 91
100 95 95
0 20 40 60 80 100 120
UNIONKachinKayahKayinChin
SagaingTanintharyi
BagoMagway
MandalayMon
RakhineYangon
ShanAyeyawady
Nay Pyi Taw
Figure 8: Number of males for every 100 females
0.010.020.030.040.050.060.070.080.090.0
100.0110.0
Figure 9: Sex Ratio by age
2014 1983
10
Census Report Volume 2–A (Highlights)
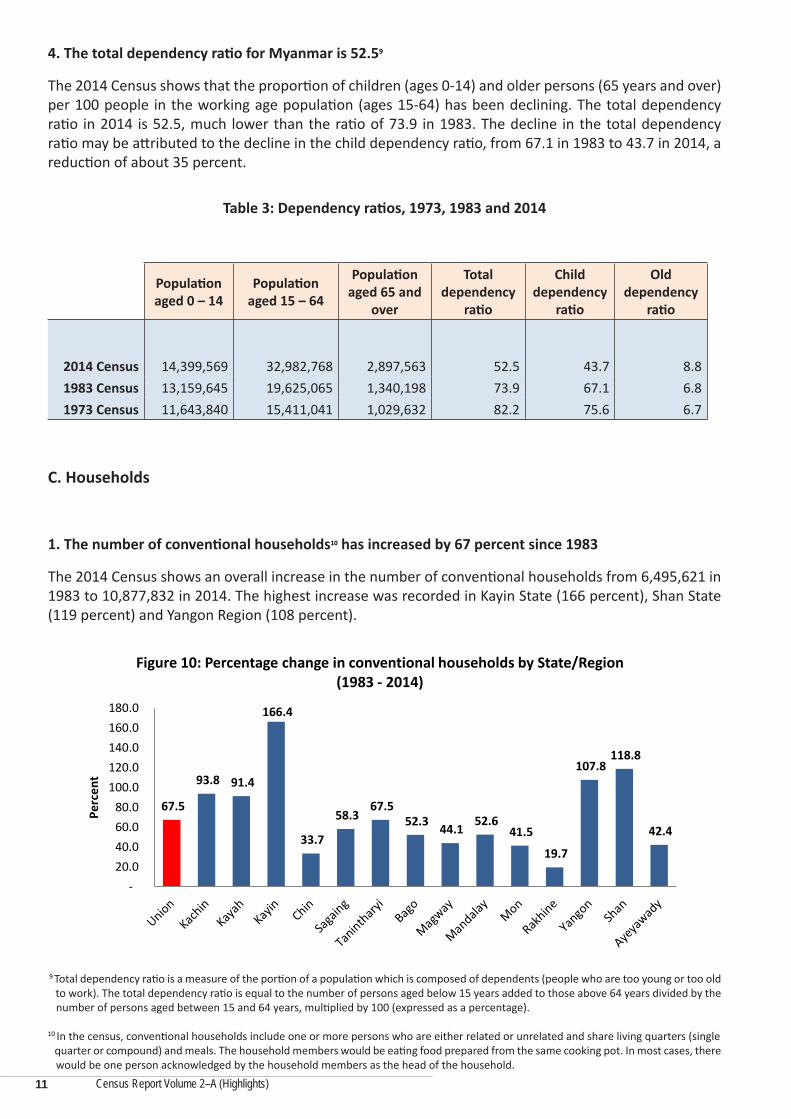
4. The total dependency ratio for Myanmar is 52.59
The 2014 Census shows that the proportion of children (ages 0-14) and older persons (65 years and over) per 100 people in the working age population (ages 15-64) has been declining. The total dependency ratio in 2014 is 52.5, much lower than the ratio of 73.9 in 1983. The decline in the total dependency ratio may be attributed to the decline in the child dependency ratio, from 67.1 in 1983 to 43.7 in 2014, a reduction of about 35 percent.
Table 3: Dependency ratios, 1973, 1983 and 2014
Population aged 0 – 14
Population aged 15 – 64
Population aged 65 and
over
Total dependency
ratio
Child dependency
ratio
Old dependency
ratio
2014 Census 14,399,569 32,982,768 2,897,563 52.5 43.7 8.81983 Census 13,159,645 19,625,065 1,340,198 73.9 67.1 6.81973 Census 11,643,840 15,411,041 1,029,632 82.2 75.6 6.7
C. Households
1. The number of conventional households10 has increased by 67 percent since 1983
The 2014 Census shows an overall increase in the number of conventional households from 6,495,621 in 1983 to 10,877,832 in 2014. The highest increase was recorded in Kayin State (166 percent), Shan State (119 percent) and Yangon Region (108 percent).
9 Total dependency ratio is a measure of the portion of a population which is composed of dependents (people who are too young or too old to work). The total dependency ratio is equal to the number of persons aged below 15 years added to those above 64 years divided by the number of persons aged between 15 and 64 years, multiplied by 100 (expressed as a percentage).
10 In the census, conventional households include one or more persons who are either related or unrelated and share living quarters (single quarter or compound) and meals. The household members would be eating food prepared from the same cooking pot. In most cases, there would be one person acknowledged by the household members as the head of the household.
67.5
93.8 91.4
166.4
33.7
58.3 67.5
52.3 44.1 52.6 41.5
19.7
107.8 118.8
42.4
- 20.0 40.0 60.0 80.0
100.0 120.0 140.0 160.0 180.0
Perc
ent
Figure 10: Percentage change in conventional households by State/Region (1983 - 2014)
11
Census Report Volume 2–A (Highlights)
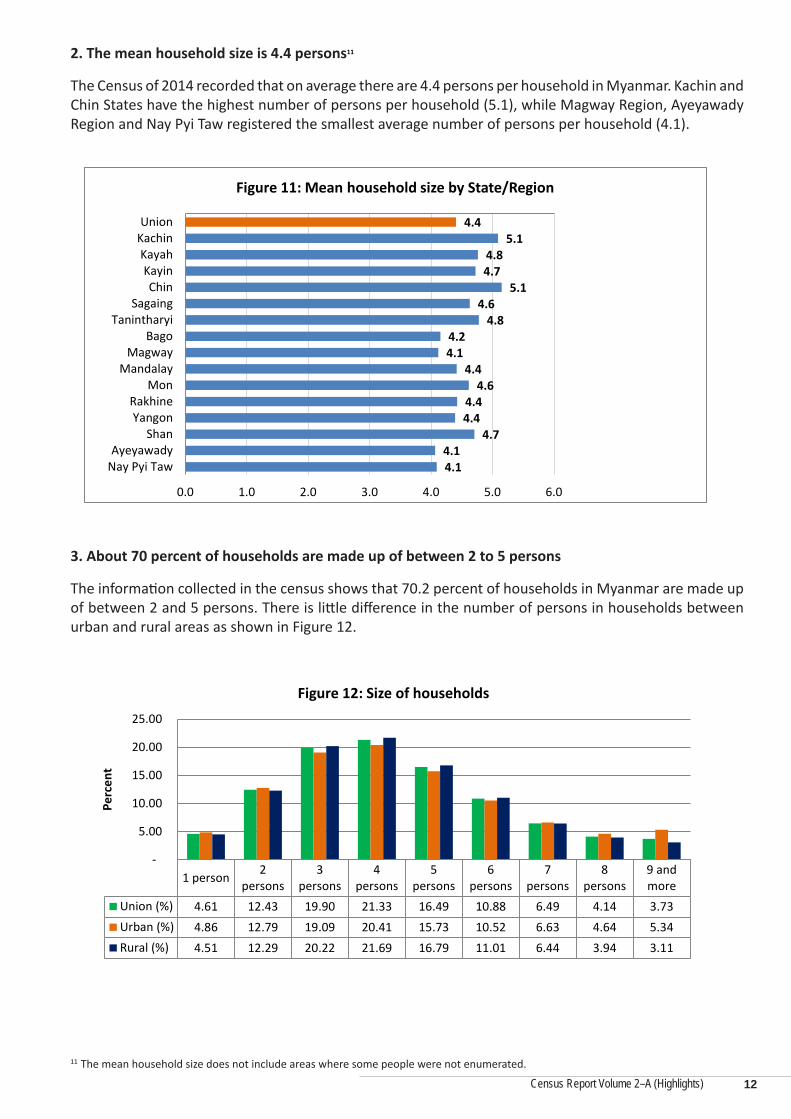
2. The mean household size is 4.4 persons11
The Census of 2014 recorded that on average there are 4.4 persons per household in Myanmar. Kachin and Chin States have the highest number of persons per household (5.1), while Magway Region, Ayeyawady Region and Nay Pyi Taw registered the smallest average number of persons per household (4.1).
3. About 70 percent of households are made up of between 2 to 5 persons
The information collected in the census shows that 70.2 percent of households in Myanmar are made up of between 2 and 5 persons. There is little difference in the number of persons in households between urban and rural areas as shown in Figure 12.
11 The mean household size does not include areas where some people were not enumerated.
1. The proportion of married females is lower than that of married males
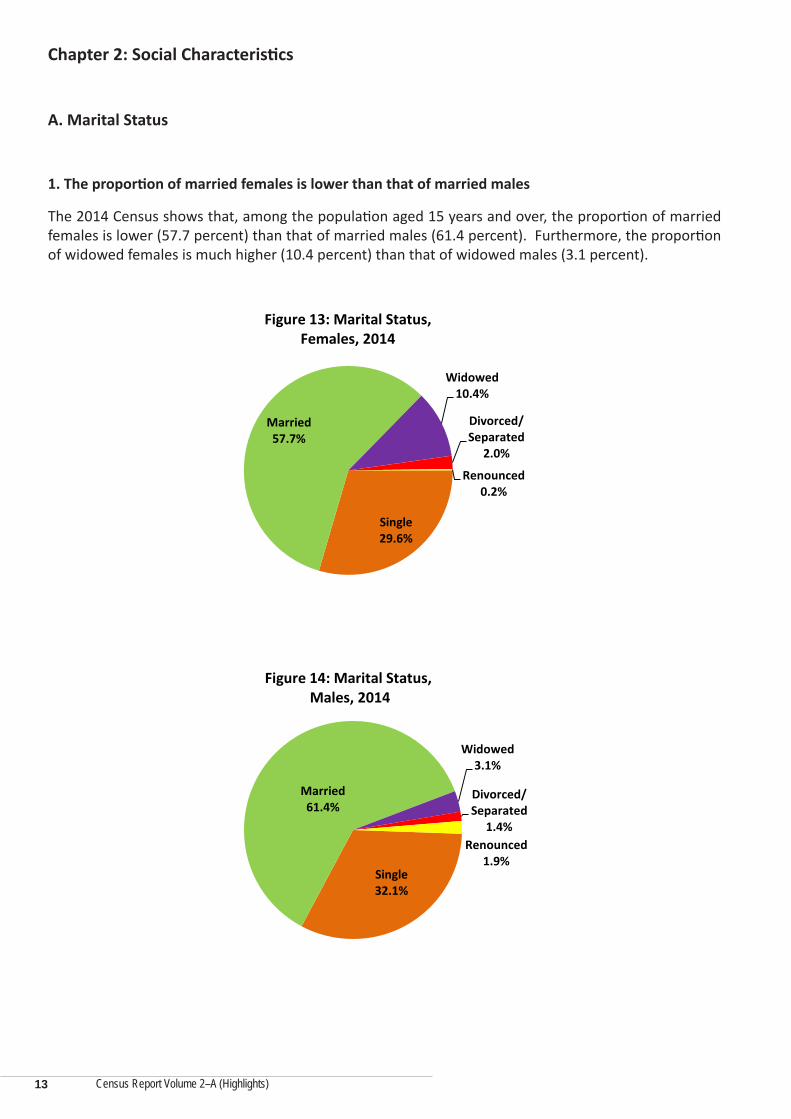
The 2014 Census shows that, among the population aged 15 years and over, the proportion of married females is lower (57.7 percent) than that of married males (61.4 percent). Furthermore, the proportion of widowed females is much higher (10.4 percent) than that of widowed males (3.1 percent).
Single 32.1%
Married 61.4%
Widowed 3.1%
Divorced/ Separated
1.4% Renounced
1.9%
Figure 14: Marital Status, Males, 2014
Single 29.6%
Married 57.7%
Widowed 10.4%
Divorced/ Separated
2.0%
Renounced 0.2%
Figure 13: Marital Status, Females, 2014
13
Single 32.1%
Married 61.4%
Widowed 3.1%
Divorced/ Separated
1.4% Renounced
1.9%
Figure 14: Marital Status, Males, 2014
Single 29.6%
Married 57.7%
Widowed 10.4%
Divorced/ Separated
2.0%
Renounced 0.2%
Figure 13: Marital Status, Females, 2014
Single 32.1%
Married 61.4%
Widowed 3.1%
Divorced/ Separated
1.4% Renounced
1.9%
Figure 14: Marital Status, Males, 2014
Single 29.6%
Married 57.7%
Widowed 10.4%
Divorced/ Separated
2.0%
Renounced 0.2%
Figure 13: Marital Status, Females, 2014
Census Report Volume 2–A (Highlights)
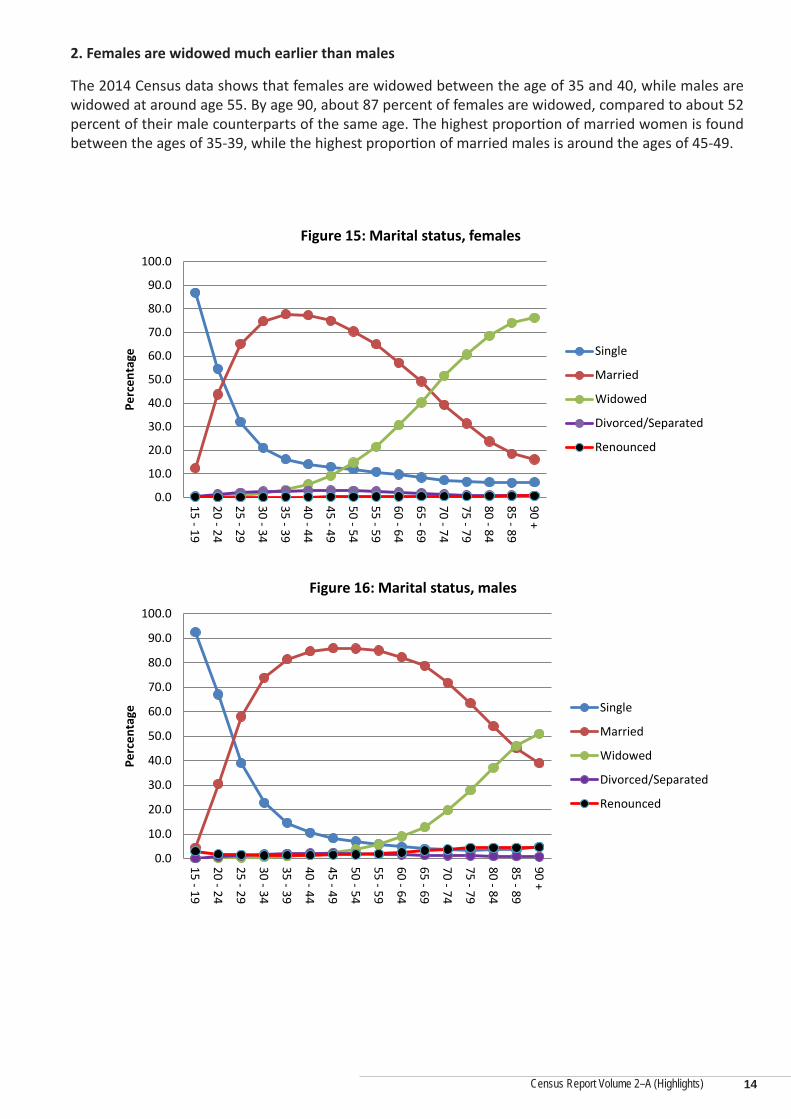
2. Females are widowed much earlier than males
The 2014 Census data shows that females are widowed between the age of 35 and 40, while males are widowed at around age 55. By age 90, about 87 percent of females are widowed, compared to about 52 percent of their male counterparts of the same age. The highest proportion of married women is found between the ages of 35-39, while the highest proportion of married males is around the ages of 45-49.
0.0
10.0
20.0
30.0
40.0
50.0
60.0
70.0
80.0
90.0
100.0
15 - 19
20 - 24
25 - 29
30 - 34
35 - 39
40 - 44
45 - 49
50 - 54
55 - 59
60 - 64
65 - 69
70 - 74
75 - 79
80 - 84
85 - 89
90 +
Perc
enta
ge
Figure 15: Marital status, females
Single
Married
Widowed
Divorced/Separated
Renounced
0.0
10.0
20.0
30.0
40.0
50.0
60.0
70.0
80.0
90.0
100.015 - 19
20 - 24
25 - 29
30 - 34
35 - 39
40 - 44
45 - 49
50 - 54
55 - 59
60 - 64
65 - 69
70 - 74
75 - 79
80 - 84
85 - 89
90 +
Perc
enta
ge
Figure 16: Marital status, males
Single
Married
Widowed
Divorced/Separated
Renounced
14
Census Report Volume 2–A (Highlights)
Chapter 3: Migration
The 2014 Census collected information on migration of people within Myanmar and on former household members living abroad at the time of the census.
A. Internal Migration
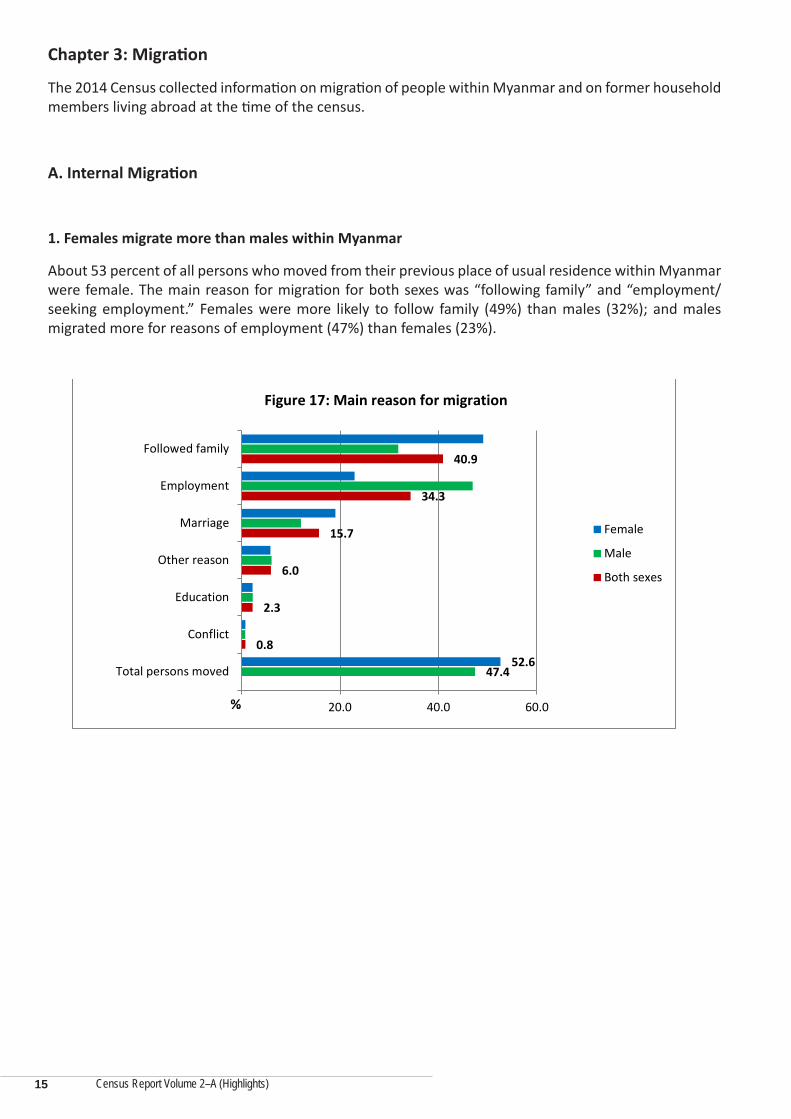
1. Females migrate more than males within Myanmar
About 53 percent of all persons who moved from their previous place of usual residence within Myanmar were female. The main reason for migration for both sexes was “following family” and “employment/seeking employment.” Females were more likely to follow family (49%) than males (32%); and males migrated more for reasons of employment (47%) than females (23%).
0.8
2.3
6.0
15.7
34.3
40.9
47.4 52.6
- 20.0 40.0 60.0
Total persons moved
Conflict
Education
Other reason
Marriage
Employment
Followed family
Female
Male
Both sexes
Figure 17: Main reason for migration
%
15
Census Report Volume 2–A (Highlights)
B. International Migration12
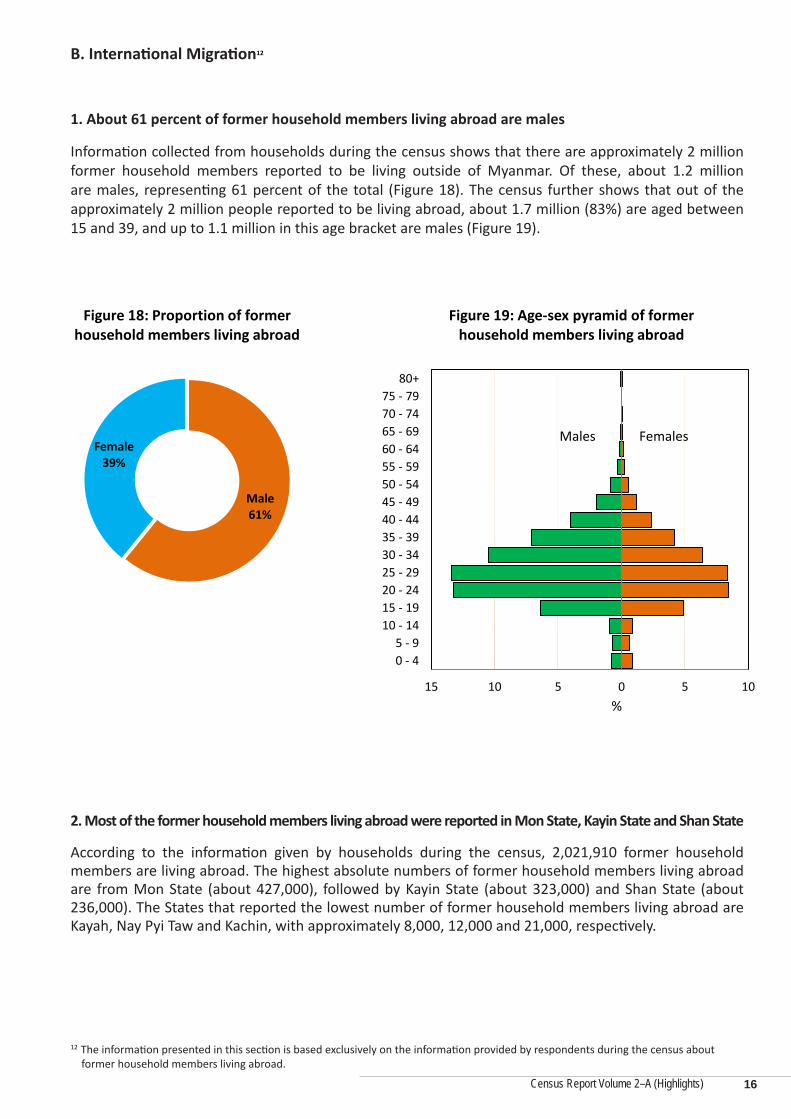
1. About 61 percent of former household members living abroad are males
Information collected from households during the census shows that there are approximately 2 million former household members reported to be living outside of Myanmar. Of these, about 1.2 million are males, representing 61 percent of the total (Figure 18). The census further shows that out of the approximately 2 million people reported to be living abroad, about 1.7 million (83%) are aged between 15 and 39, and up to 1.1 million in this age bracket are males (Figure 19).
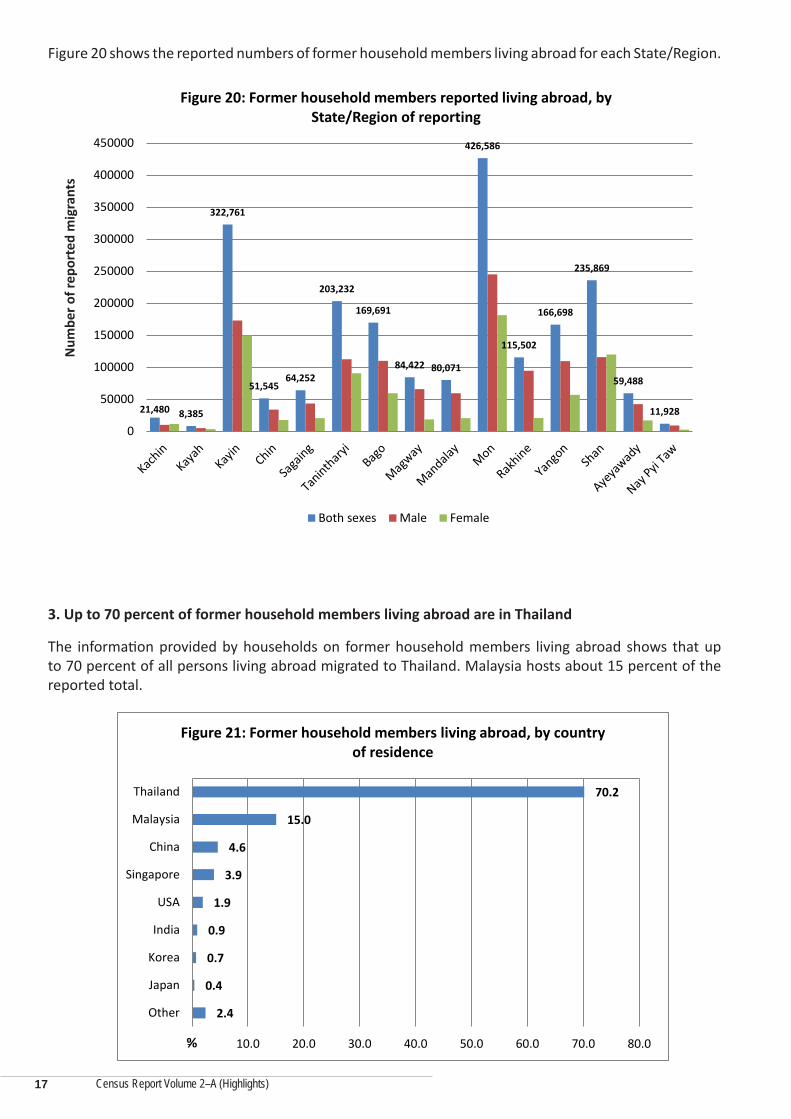
2. Most of the former household members living abroad were reported in Mon State, Kayin State and Shan State
According to the information given by households during the census, 2,021,910 former household members are living abroad. The highest absolute numbers of former household members living abroad are from Mon State (about 427,000), followed by Kayin State (about 323,000) and Shan State (about 236,000). The States that reported the lowest number of former household members living abroad are Kayah, Nay Pyi Taw and Kachin, with approximately 8,000, 12,000 and 21,000, respectively.
12 The information presented in this section is based exclusively on the information provided by respondents during the census about former household members living abroad.
Male 61%
Female 39%
Figure 18: Proportion of former household members living abroad
Figure 19: Age-sex pyramid of former household members living abroad
Males Females
%
16
Census Report Volume 2–A (Highlights)
Figure 20 shows the reported numbers of former household members living abroad for each State/Region.
3. Up to 70 percent of former household members living abroad are in Thailand
The information provided by households on former household members living abroad shows that up to 70 percent of all persons living abroad migrated to Thailand. Malaysia hosts about 15 percent of the reported total.
Num
ber o
f rep
orte
d m
igra
nts
21,480 8,385
322,761
51,545 64,252
203,232
169,691
84,422 80,071
426,586
115,502
166,698
235,869
59,488
11,928
0
50000
100000
150000
200000
250000
300000
350000
400000
450000
Figure 20: Former household members reported living abroad, by State/Region of reporting
Both sexes Male Female
70.2
15.0
4.6
3.9
1.9
0.9
0.7
0.4
2.4
- 10.0 20.0 30.0 40.0 50.0 60.0 70.0 80.0
Thailand
Malaysia
China
Singapore
USA
India
Korea
Japan
Other
Figure 21: Former household members living abroad, by country of residence
%
17
Census Report Volume 2–A (Highlights)
Chapter 4: Education
The 2014 Census collected information on literacy, school attendance and the highest level of education completed.
A. Literacy
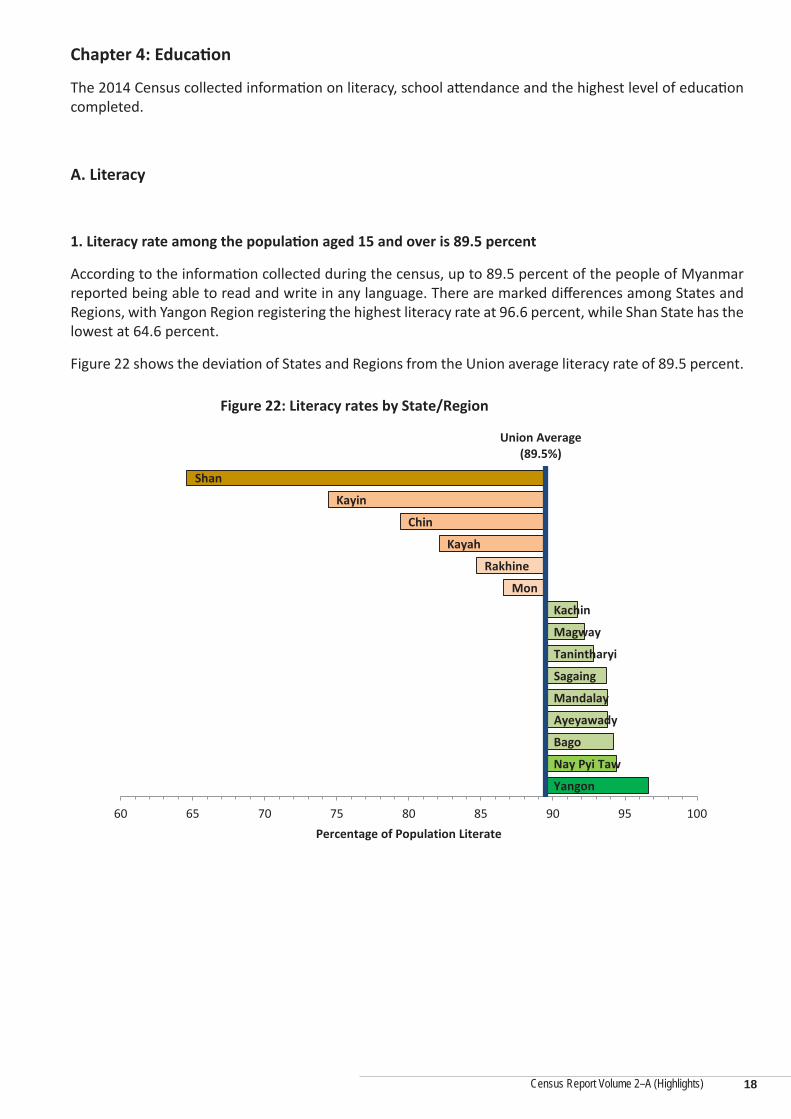
1. Literacy rate among the population aged 15 and over is 89.5 percent
According to the information collected during the census, up to 89.5 percent of the people of Myanmar reported being able to read and write in any language. There are marked differences among States and Regions, with Yangon Region registering the highest literacy rate at 96.6 percent, while Shan State has the lowest at 64.6 percent.
Figure 22 shows the deviation of States and Regions from the Union average literacy rate of 89.5 percent.
Shan
Kayin
Chin
Kayah
Rakhine
Mon
Kachin
Magway
Tanintharyi
Sagaing
Mandalay
Ayeyawady
Bago
Nay Pyi Taw
Yangon
Union Average (89.5%)
60 65 70 75 80 85 90 95 100Percentage of Population Literate
Figure 22: Literacy rates by State/Region
18
Census Report Volume 2–A (Highlights)
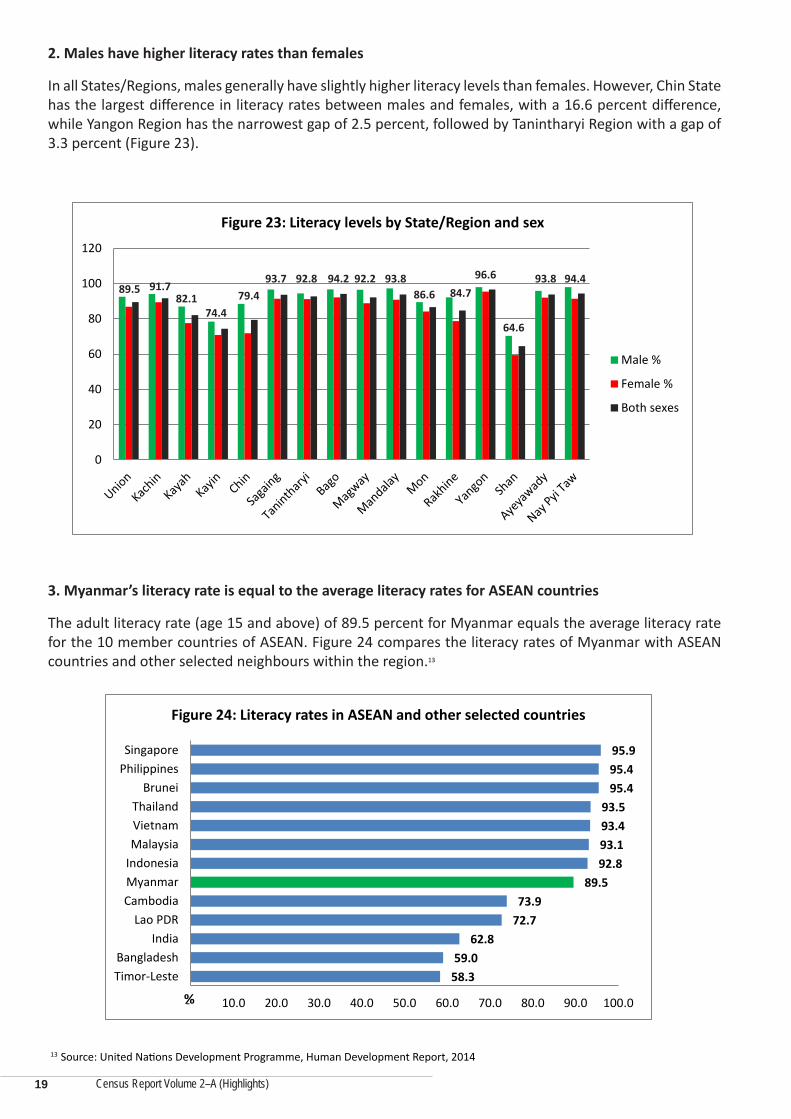
2. Males have higher literacy rates than females
In all States/Regions, males generally have slightly higher literacy levels than females. However, Chin State has the largest difference in literacy rates between males and females, with a 16.6 percent difference, while Yangon Region has the narrowest gap of 2.5 percent, followed by Tanintharyi Region with a gap of 3.3 percent (Figure 23).
3. Myanmar’s literacy rate is equal to the average literacy rates for ASEAN countries
The adult literacy rate (age 15 and above) of 89.5 percent for Myanmar equals the average literacy rate for the 10 member countries of ASEAN. Figure 24 compares the literacy rates of Myanmar with ASEAN countries and other selected neighbours within the region.13
13 Source: United Nations Development Programme, Human Development Report, 2014
Figure 24: Literacy rates in ASEAN and other selected countries
%
19
0
20
40
60
80
100
120
Figure 23: Literacy levels by State/Region and sex
Male %
Female %
Both sexes
89.5 91.782.1
74.479.4
93.7 92.8 94.2 92.2 93.886.6 84.7
96.6 93.8 94.4
64.6
Census Report Volume 2–A (Highlights)
B. School Attendance
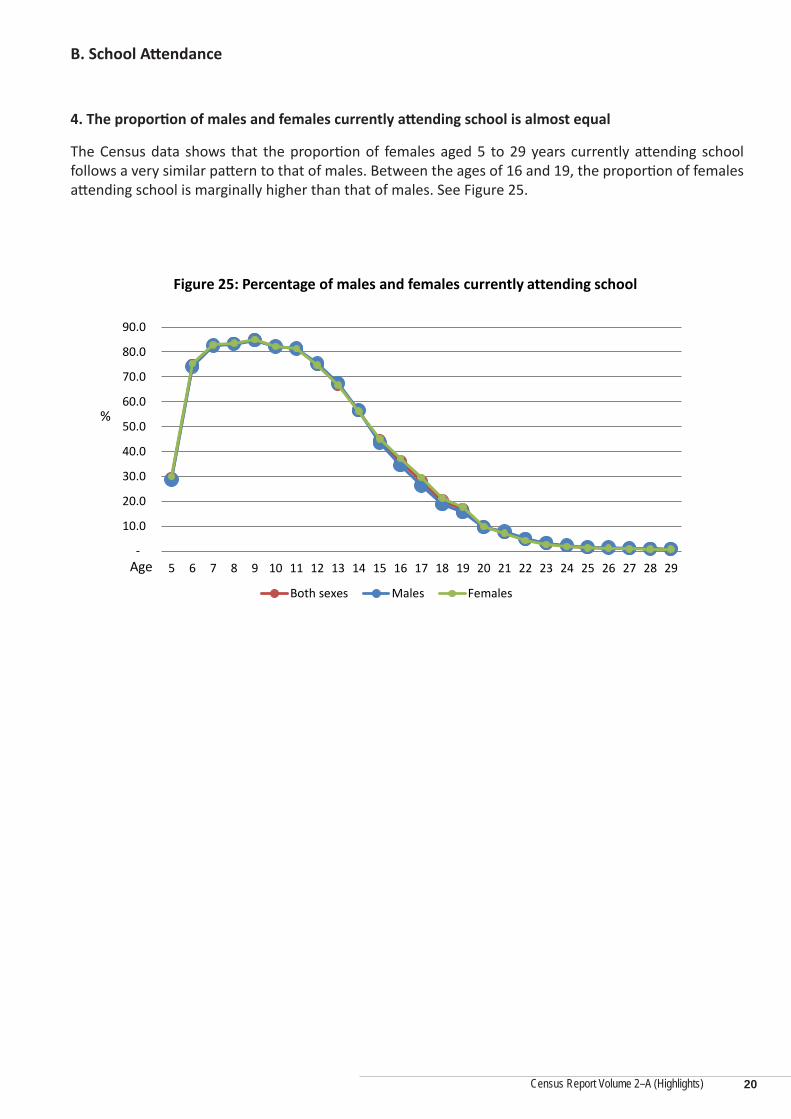
4. The proportion of males and females currently attending school is almost equal
The Census data shows that the proportion of females aged 5 to 29 years currently attending school follows a very similar pattern to that of males. Between the ages of 16 and 19, the proportion of females attending school is marginally higher than that of males. See Figure 25.
Figure 25: Percentage of males and females currently attending school
Both sexes Males Females
%
Age
20
Census Report Volume 2–A (Highlights)
Chapter 5: Economic Characteristics
The 2014 Census collected information on the economic activity status of all household members aged 10 years and over. However, for purposes of comparability with other countries as may become appropriate, this chapter only presents information related to persons aged 15-64.
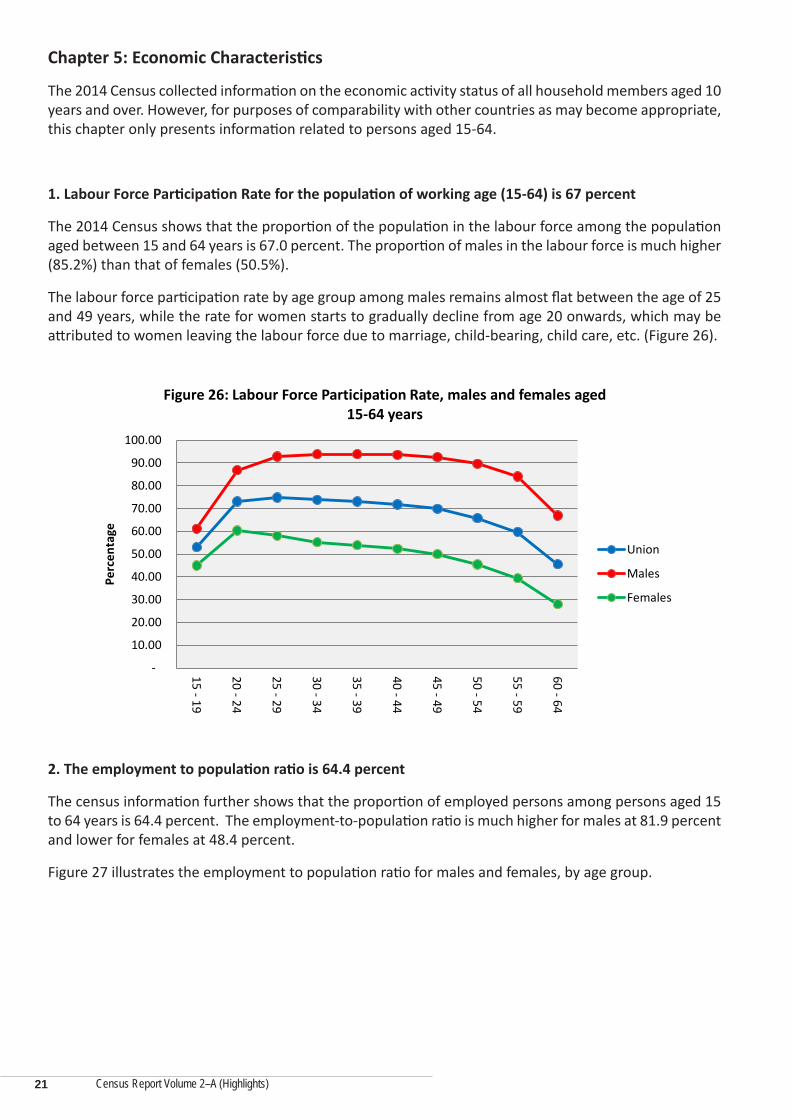
1. Labour Force Participation Rate for the population of working age (15-64) is 67 percent
The 2014 Census shows that the proportion of the population in the labour force among the population aged between 15 and 64 years is 67.0 percent. The proportion of males in the labour force is much higher (85.2%) than that of females (50.5%).
The labour force participation rate by age group among males remains almost flat between the age of 25 and 49 years, while the rate for women starts to gradually decline from age 20 onwards, which may be attributed to women leaving the labour force due to marriage, child-bearing, child care, etc. (Figure 26).
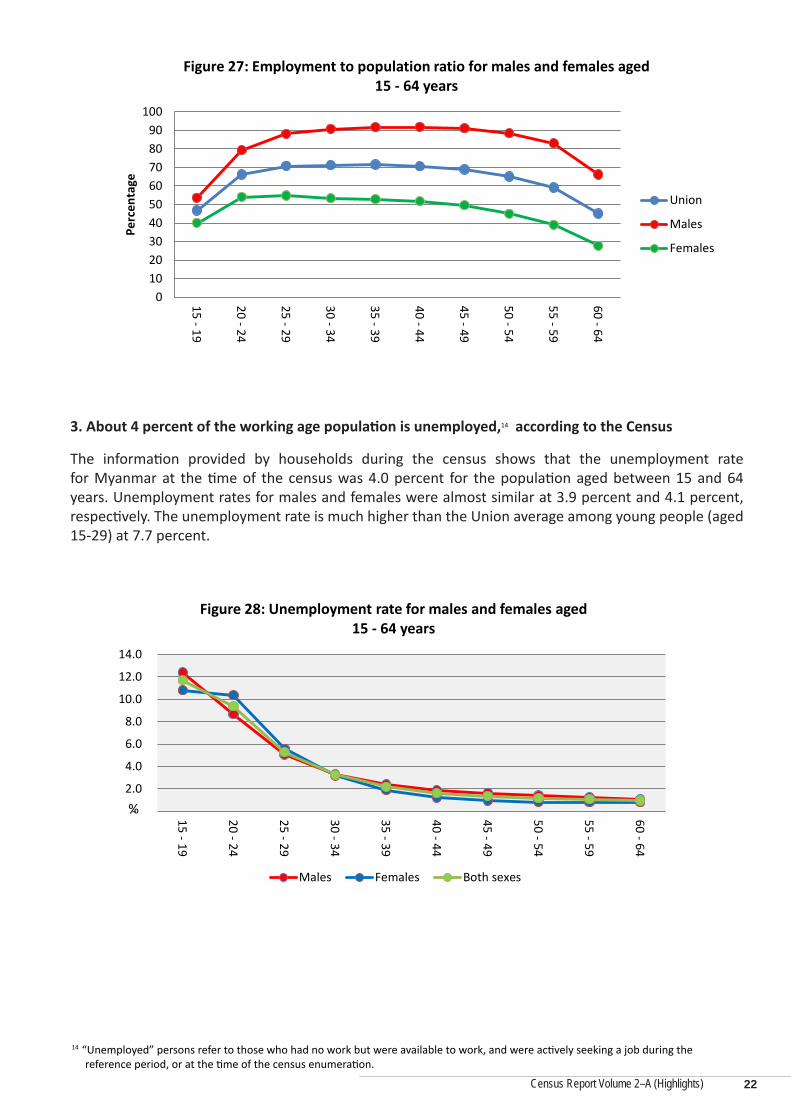
2. The employment to population ratio is 64.4 percent
The census information further shows that the proportion of employed persons among persons aged 15 to 64 years is 64.4 percent. The employment-to-population ratio is much higher for males at 81.9 percent and lower for females at 48.4 percent.
Figure 27 illustrates the employment to population ratio for males and females, by age group.
-
10.00
20.00
30.00
40.00
50.00
60.00
70.00
80.00
90.00
100.00
15 - 19
20 - 24
25 - 29
30 - 34
35 - 39
40 - 44
45 - 49
50 - 54
55 - 59
60 - 64
Perc
enta
ge
Figure 26: Labour Force Participation Rate, males and females aged 15-64 years
Union
Males
Females
21
Census Report Volume 2–A (Highlights)
3. About 4 percent of the working age population is unemployed,14 according to the Census
The information provided by households during the census shows that the unemployment rate for Myanmar at the time of the census was 4.0 percent for the population aged between 15 and 64 years. Unemployment rates for males and females were almost similar at 3.9 percent and 4.1 percent, respectively. The unemployment rate is much higher than the Union average among young people (aged 15-29) at 7.7 percent.
0102030405060708090
100
15 - 19
20 - 24
25 - 29
30 - 34
35 - 39
40 - 44
45 - 49
50 - 54
55 - 59
60 - 64
Perc
enta
ge
Figure 27: Employment to population ratio for males and females aged 15 - 64 years
Union
Males
Females
-
2.0
4.0
6.0
8.0
10.0
12.0
14.0
15 - 19
20 - 24
25 - 29
30 - 34
35 - 39
40 - 44
45 - 49
50 - 54
55 - 59
60 - 64
Figure 28: Unemployment rate for males and females aged 15 - 64 years
Males Females Both sexes
%
14 “Unemployed” persons refer to those who had no work but were available to work, and were actively seeking a job during the reference period, or at the time of the census enumeration.
22
Census Report Volume 2–A (Highlights)
Chapter 6: Births
The 2014 Census collected information related to births among ever married women aged 15 and over.
1. Total Fertility Rate is 2.3 for all women and 4.03 for ever-married women
The Census information shows that the number of children a woman is likely to have if she lived from age 15 to age 49 is 2.3. However, for women ever married and aged between 15 and 49, the number of children is 4.03.
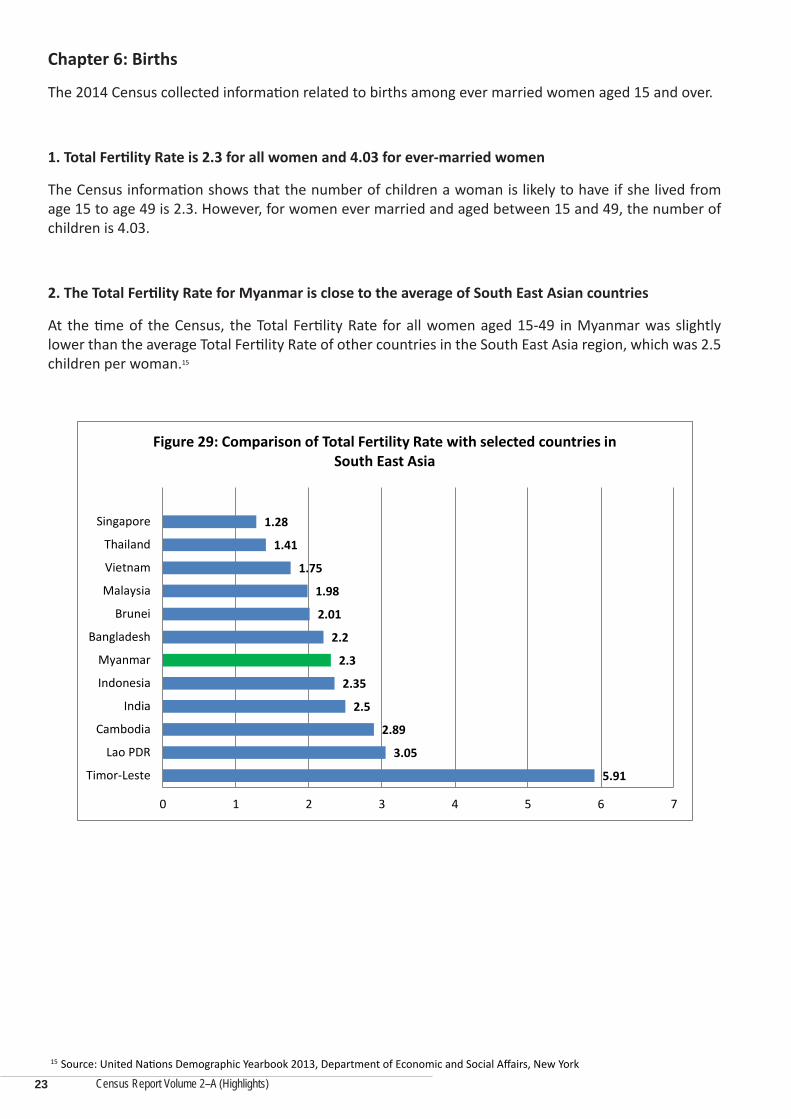
2. The Total Fertility Rate for Myanmar is close to the average of South East Asian countries
At the time of the Census, the Total Fertility Rate for all women aged 15-49 in Myanmar was slightly lower than the average Total Fertility Rate of other countries in the South East Asia region, which was 2.5 children per woman.15
5.91
3.05
2.89
2.5
2.35
2.3
2.2
2.01
1.98
1.75
1.41
1.28
0 1 2 3 4 5 6 7
Timor-Leste
Lao PDR
Cambodia
India
Indonesia
Myanmar
Bangladesh
Brunei
Malaysia
Vietnam
Thailand
Singapore
Figure 29: Comparison of Total Fertility Rate with selected countries in South East Asia
15 Source: United Nations Demographic Yearbook 2013, Department of Economic and Social Affairs, New York
23
Census Report Volume 2–A (Highlights)
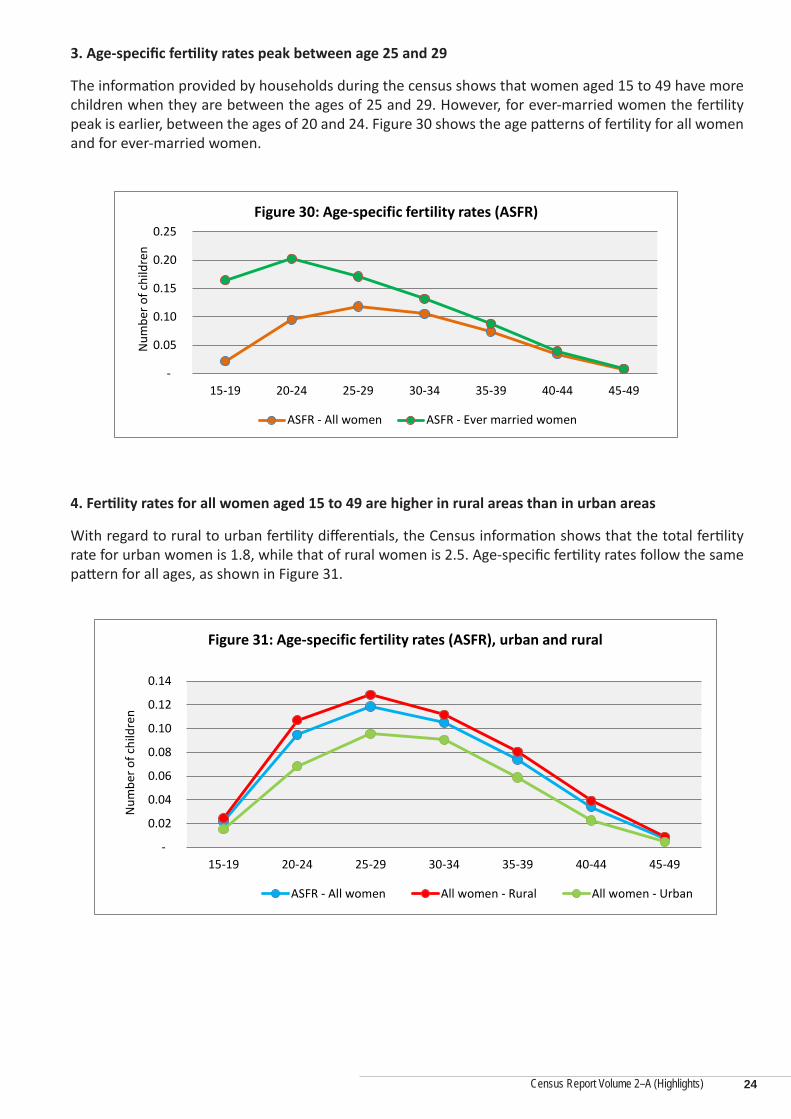
3. Age-specific fertility rates peak between age 25 and 29
The information provided by households during the census shows that women aged 15 to 49 have more children when they are between the ages of 25 and 29. However, for ever-married women the fertility peak is earlier, between the ages of 20 and 24. Figure 30 shows the age patterns of fertility for all women and for ever-married women.
4. Fertility rates for all women aged 15 to 49 are higher in rural areas than in urban areas
With regard to rural to urban fertility differentials, the Census information shows that the total fertility rate for urban women is 1.8, while that of rural women is 2.5. Age-specific fertility rates follow the same pattern for all ages, as shown in Figure 31.
-
0.05
0.10
0.15
0.20
0.25
15-19 20-24 25-29 30-34 35-39 40-44 45-49
Figure 30: Age-specific fertility rates (ASFR)
ASFR - All women ASFR - Ever married women
Num
ber o
f chi
ldre
n
-
0.02
0.04
0.06
0.08
0.10
0.12
0.14
15-19 20-24 25-29 30-34 35-39 40-44 45-49
Figure 31: Age-specific fertility rates (ASFR), urban and rural
ASFR - All women All women - Rural All women - Urban
Num
ber o
f chi
ldre
n
24
Census Report Volume 2–A (Highlights)
Chapter 7: Mortality
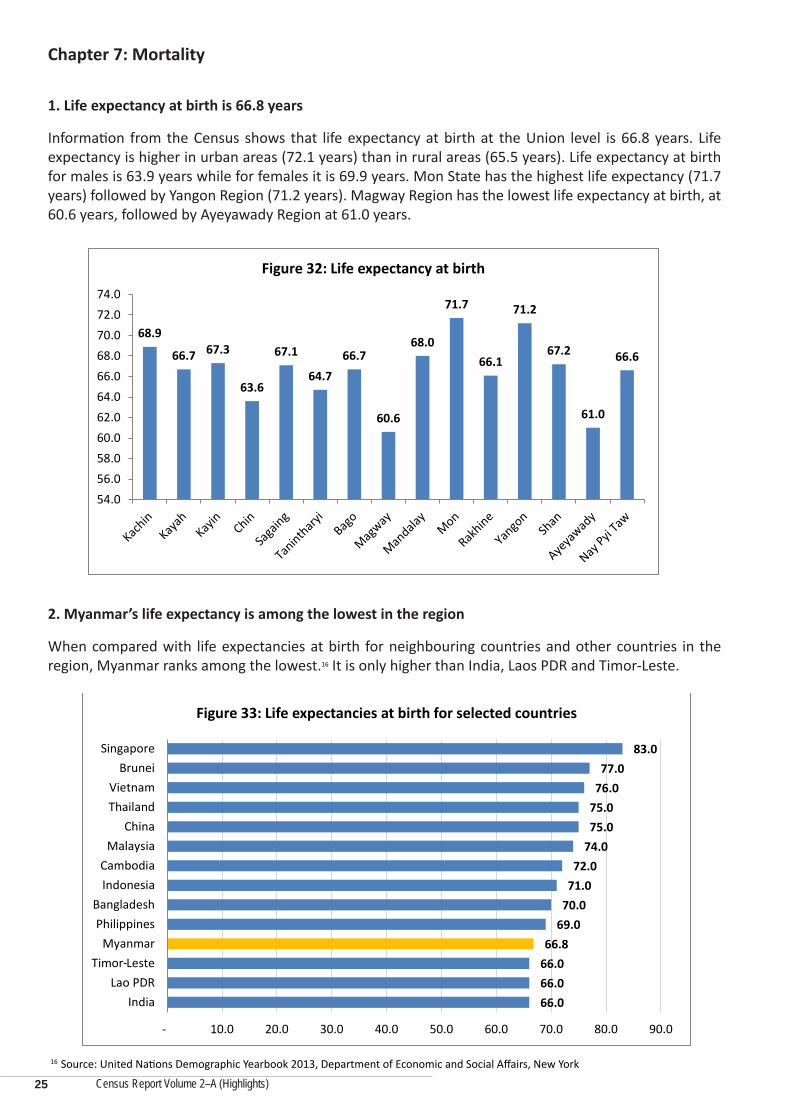
1. Life expectancy at birth is 66.8 years
Information from the Census shows that life expectancy at birth at the Union level is 66.8 years. Life expectancy is higher in urban areas (72.1 years) than in rural areas (65.5 years). Life expectancy at birth for males is 63.9 years while for females it is 69.9 years. Mon State has the highest life expectancy (71.7 years) followed by Yangon Region (71.2 years). Magway Region has the lowest life expectancy at birth, at 60.6 years, followed by Ayeyawady Region at 61.0 years.
2. Myanmar’s life expectancy is among the lowest in the region
When compared with life expectancies at birth for neighbouring countries and other countries in the region, Myanmar ranks among the lowest.16 It is only higher than India, Laos PDR and Timor-Leste.
68.9
66.7 67.3
63.6
67.1
64.7 66.7
60.6
68.0
71.7
66.1
71.2
67.2
61.0
66.6
54.056.058.060.062.064.066.068.070.072.074.0
Figure 32: Life expectancy at birth
66.0 66.0 66.0 66.8
69.0 70.0 71.0 72.0
74.0 75.0 75.0 76.0 77.0
83.0
- 10.0 20.0 30.0 40.0 50.0 60.0 70.0 80.0 90.0
IndiaLao PDR
Timor LesteMyanmar
PhilippinesBangladesh
IndonesiaCambodia
MalaysiaChina
ThailandVietnam
BruneiSingapore
Figure 33: Life expectancies at birth for selected countries
16 Source: United Nations Demographic Yearbook 2013, Department of Economic and Social Affairs, New York
25
-
Census Report Volume 2–A (Highlights)
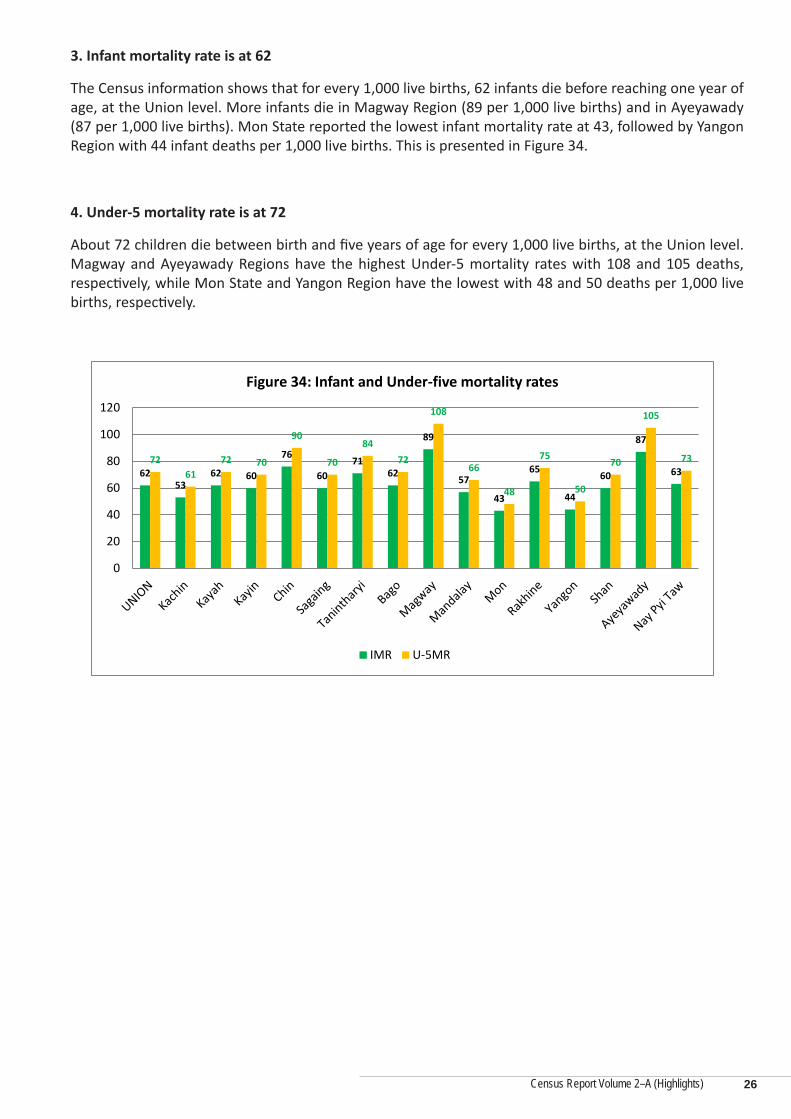
3. Infant mortality rate is at 62
The Census information shows that for every 1,000 live births, 62 infants die before reaching one year of age, at the Union level. More infants die in Magway Region (89 per 1,000 live births) and in Ayeyawady (87 per 1,000 live births). Mon State reported the lowest infant mortality rate at 43, followed by Yangon Region with 44 infant deaths per 1,000 live births. This is presented in Figure 34.
4. Under-5 mortality rate is at 72
About 72 children die between birth and five years of age for every 1,000 live births, at the Union level. Magway and Ayeyawady Regions have the highest Under-5 mortality rates with 108 and 105 deaths, respectively, while Mon State and Yangon Region have the lowest with 48 and 50 deaths per 1,000 live births, respectively.
62 53
62 60
76
60 71
62
89
57
43
65
44
60
87
63 72
61 72 70
90
70
84 72
108
66
48
75
50
70
105
73
0
20
40
60
80
100
120
Figure 34: Infant and Under-five mortality rates
IMR U-5MR
26
Census Report Volume 2–A (Highlights)
Chapter 8: Disability
The Census collected information on the prevalence of disability in households. The types of disability covered included seeing, hearing, walking and remembering/mental. It is generally recognised that disability is a sensitive issue in many societies and, as such, the information collected on this topic is usually under-reported. However, strategies were adopted to improve coverage and the quality of the data collected.
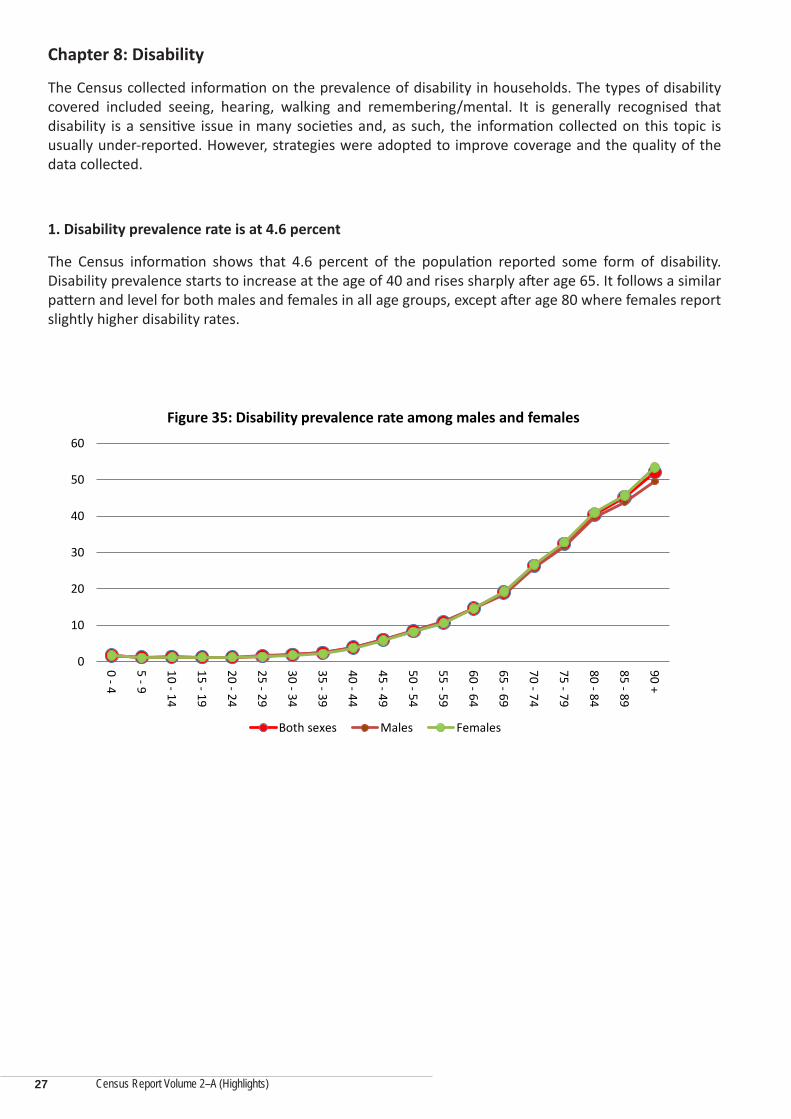
1. Disability prevalence rate is at 4.6 percent
The Census information shows that 4.6 percent of the population reported some form of disability. Disability prevalence starts to increase at the age of 40 and rises sharply after age 65. It follows a similar pattern and level for both males and females in all age groups, except after age 80 where females report slightly higher disability rates.
0
10
20
30
40
50
60
0 - 4
5 - 9
10 - 14
15 - 19
20 - 24
25 - 29
30 - 34
35 - 39
40 - 44
45 - 49
50 - 54
55 - 59
60 - 64
65 - 69
70 - 74
75 - 79
80 - 84
85 - 89
90 +
Figure 35: Disability prevalence rate among males and females
Both sexes Males Females
27
Census Report Volume 2–A (Highlights)
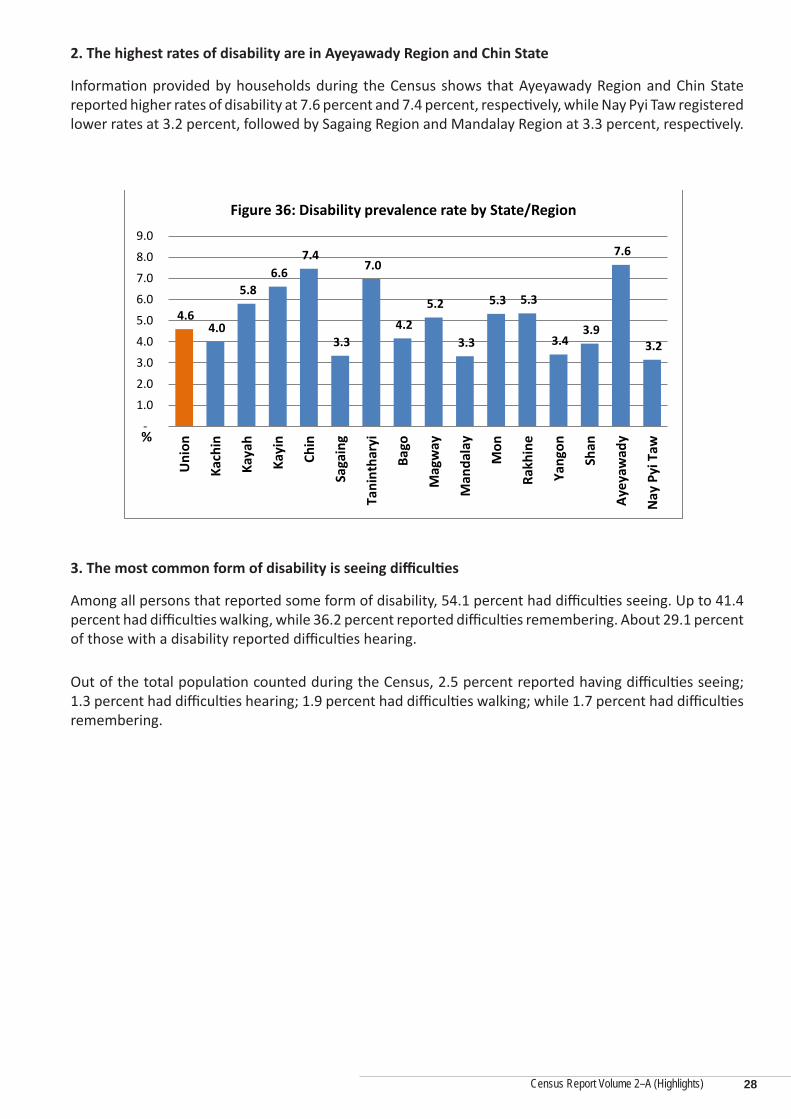
2. The highest rates of disability are in Ayeyawady Region and Chin State
Information provided by households during the Census shows that Ayeyawady Region and Chin State reported higher rates of disability at 7.6 percent and 7.4 percent, respectively, while Nay Pyi Taw registered lower rates at 3.2 percent, followed by Sagaing Region and Mandalay Region at 3.3 percent, respectively.
3. The most common form of disability is seeing difficulties
Among all persons that reported some form of disability, 54.1 percent had difficulties seeing. Up to 41.4 percent had difficulties walking, while 36.2 percent reported difficulties remembering. About 29.1 percent of those with a disability reported difficulties hearing.
Out of the total population counted during the Census, 2.5 percent reported having difficulties seeing; 1.3 percent had difficulties hearing; 1.9 percent had difficulties walking; while 1.7 percent had difficulties remembering.
4.6 4.0
5.8 6.6
7.4
3.3
7.0
4.2
5.2
3.3
5.3 5.3
3.4 3.9
7.6
3.2
-
1.0
2.0
3.0
4.0
5.0
6.0
7.0
8.0
9.0
Uni
on
Kach
in
Kaya
h
Kayi
n
Chin
Saga
ing
Tani
ntha
ryi
Bago
Mag
way
Man
dala
y
Mon
Rakh
ine
Yang
on
Shan
Ayey
awad
y
Nay
Pyi
Taw
Figure 36: Disability prevalence rate by State/Region
%
28
Census Report Volume 2–A (Highlights)
Chapter 9: Housing Conditions and Household Amenities
The 2014 Census also collected information related to housing conditions and household amenities which will be useful for informing policy makers about key aspects of the standard of living of the people of Myanmar.
A. Ownership of Housing Unit
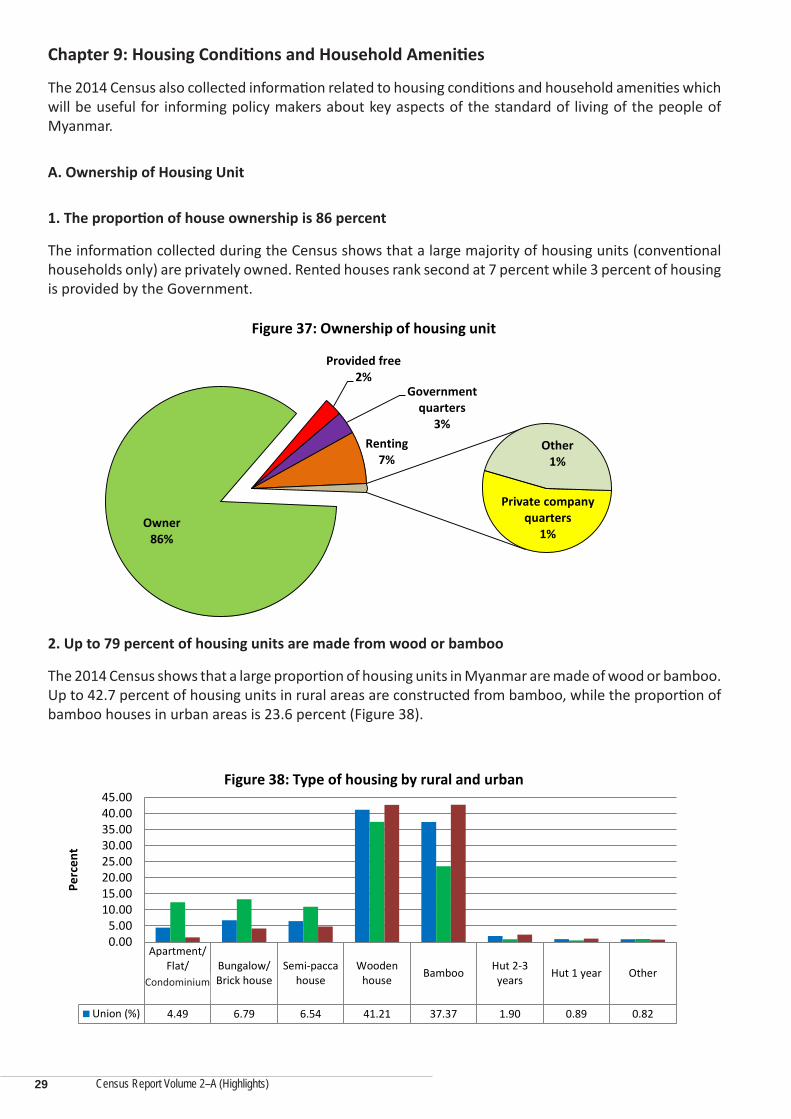
1. The proportion of house ownership is 86 percent
The information collected during the Census shows that a large majority of housing units (conventional households only) are privately owned. Rented houses rank second at 7 percent while 3 percent of housing is provided by the Government.
2. Up to 79 percent of housing units are made from wood or bamboo
The 2014 Census shows that a large proportion of housing units in Myanmar are made of wood or bamboo. Up to 42.7 percent of housing units in rural areas are constructed from bamboo, while the proportion of bamboo houses in urban areas is 23.6 percent (Figure 38).
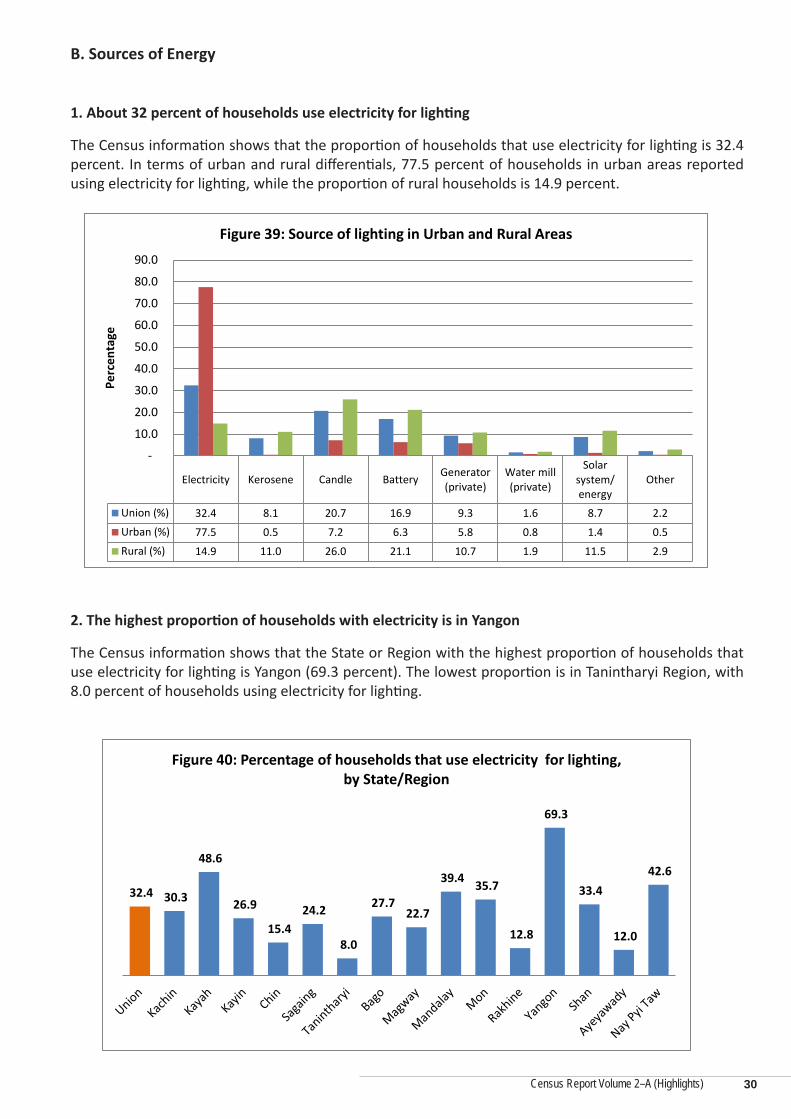
1. About 32 percent of households use electricity for lighting
The Census information shows that the proportion of households that use electricity for lighting is 32.4 percent. In terms of urban and rural differentials, 77.5 percent of households in urban areas reported using electricity for lighting, while the proportion of rural households is 14.9 percent.
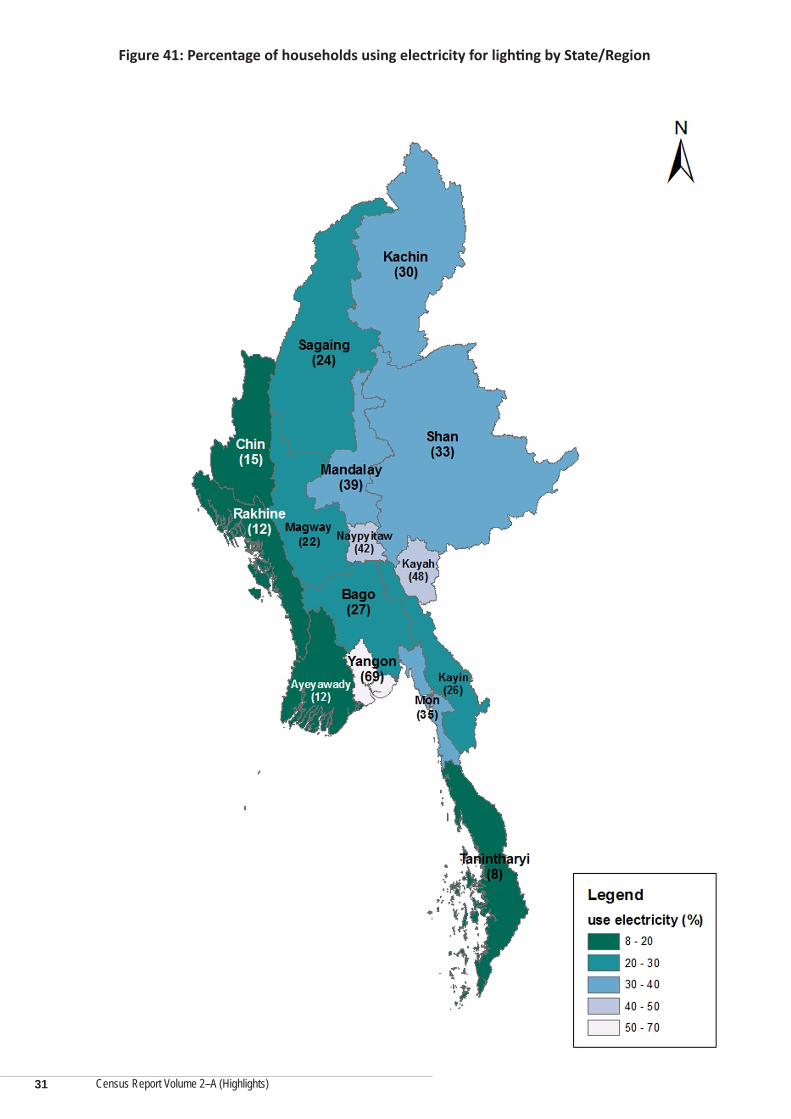
2. The highest proportion of households with electricity is in Yangon
The Census information shows that the State or Region with the highest proportion of households that use electricity for lighting is Yangon (69.3 percent). The lowest proportion is in Tanintharyi Region, with 8.0 percent of households using electricity for lighting.
Figure 39: Source of lighting in Urban and Rural Areas
32.4 30.3
48.6
26.9
15.4 24.2
8.0
27.7 22.7
39.4 35.7
12.8
69.3
33.4
12.0
42.6
Figure 40: Percentage of households that use electricity for lighting, by State/Region
30
Census Report Volume 2–A (Highlights)
Figure 41: Percentage of households using electricity for lighting by State/Region
31
Census Report Volume 2–A (Highlights)
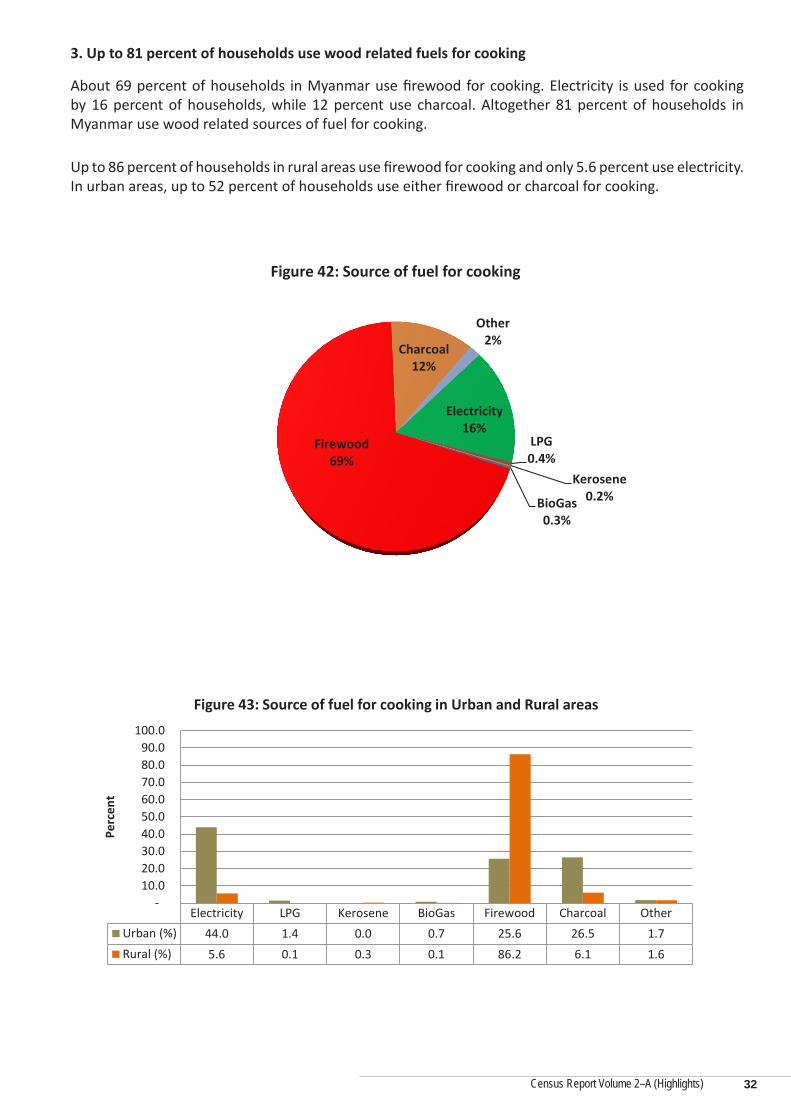
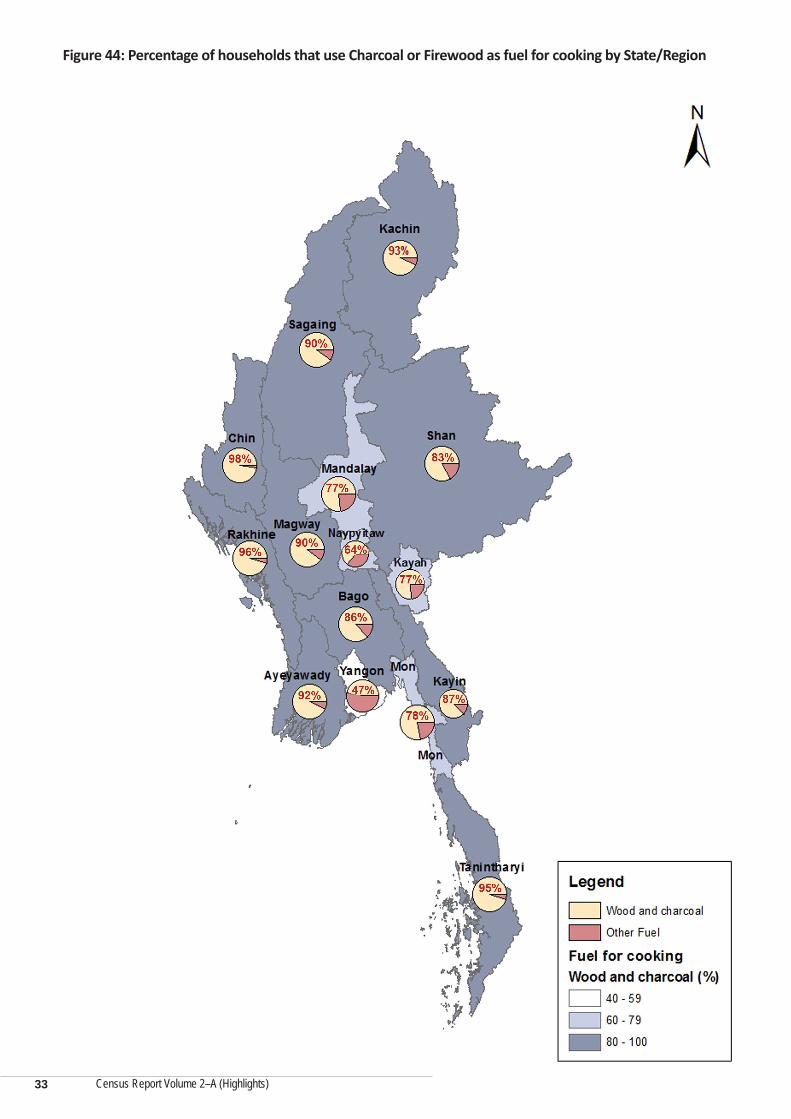
3. Up to 81 percent of households use wood related fuels for cooking
About 69 percent of households in Myanmar use firewood for cooking. Electricity is used for cooking by 16 percent of households, while 12 percent use charcoal. Altogether 81 percent of households in Myanmar use wood related sources of fuel for cooking.
Up to 86 percent of households in rural areas use firewood for cooking and only 5.6 percent use electricity. In urban areas, up to 52 percent of households use either firewood or charcoal for cooking.
Figure 43: Source of fuel for cooking in Urban and Rural areas
32
Census Report Volume 2–A (Highlights)
Figure 44: Percentage of households that use Charcoal or Firewood as fuel for cooking by State/Region
33
Census Report Volume 2–A (Highlights)
C. Sources of Water
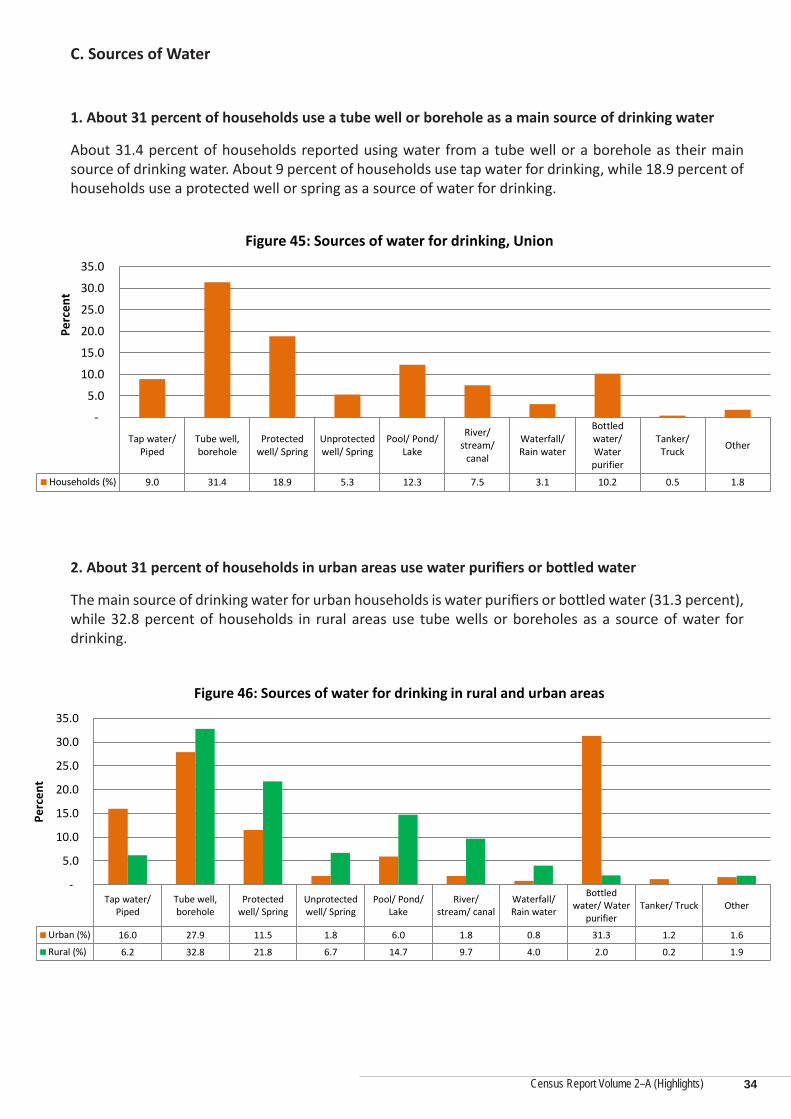
1. About 31 percent of households use a tube well or borehole as a main source of drinking water
About 31.4 percent of households reported using water from a tube well or a borehole as their main source of drinking water. About 9 percent of households use tap water for drinking, while 18.9 percent of households use a protected well or spring as a source of water for drinking.
2. About 31 percent of households in urban areas use water purifiers or bottled water
The main source of drinking water for urban households is water purifiers or bottled water (31.3 percent), while 32.8 percent of households in rural areas use tube wells or boreholes as a source of water for drinking.
Figure 46: Sources of water for drinking in rural and urban areas
34
Census Report Volume 2–A (Highlights)
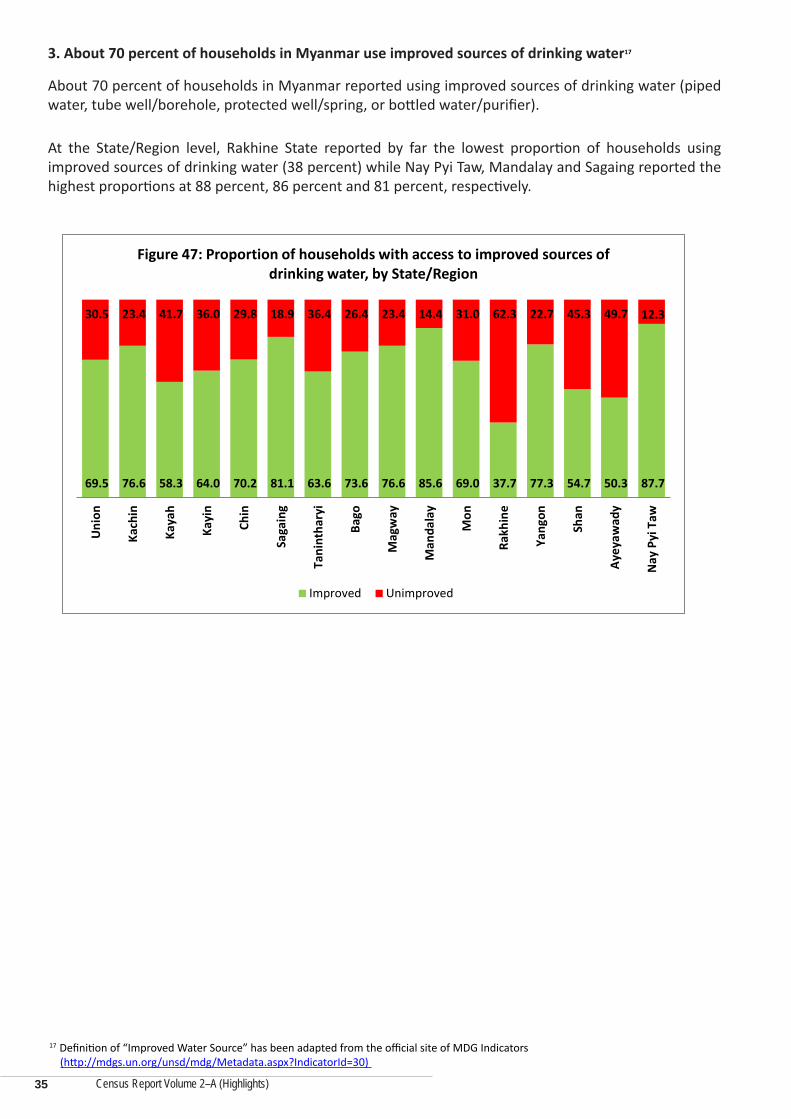
3. About 70 percent of households in Myanmar use improved sources of drinking water17
About 70 percent of households in Myanmar reported using improved sources of drinking water (piped water, tube well/borehole, protected well/spring, or bottled water/purifier).
At the State/Region level, Rakhine State reported by far the lowest proportion of households using improved sources of drinking water (38 percent) while Nay Pyi Taw, Mandalay and Sagaing reported the highest proportions at 88 percent, 86 percent and 81 percent, respectively.
17 Definition of “Improved Water Source” has been adapted from the official site of MDG Indicators (http://mdgs.un.org/unsd/mdg/Metadata.aspx?IndicatorId=30)
Figure 47: Proportion of households with access to improved sources of drinking water, by State/Region
Improved Unimproved
35
Census Report Volume 2–A (Highlights)
D. Toilet Facilities
The 2014 Census collected information on the type of toilet facilities that are available for households.
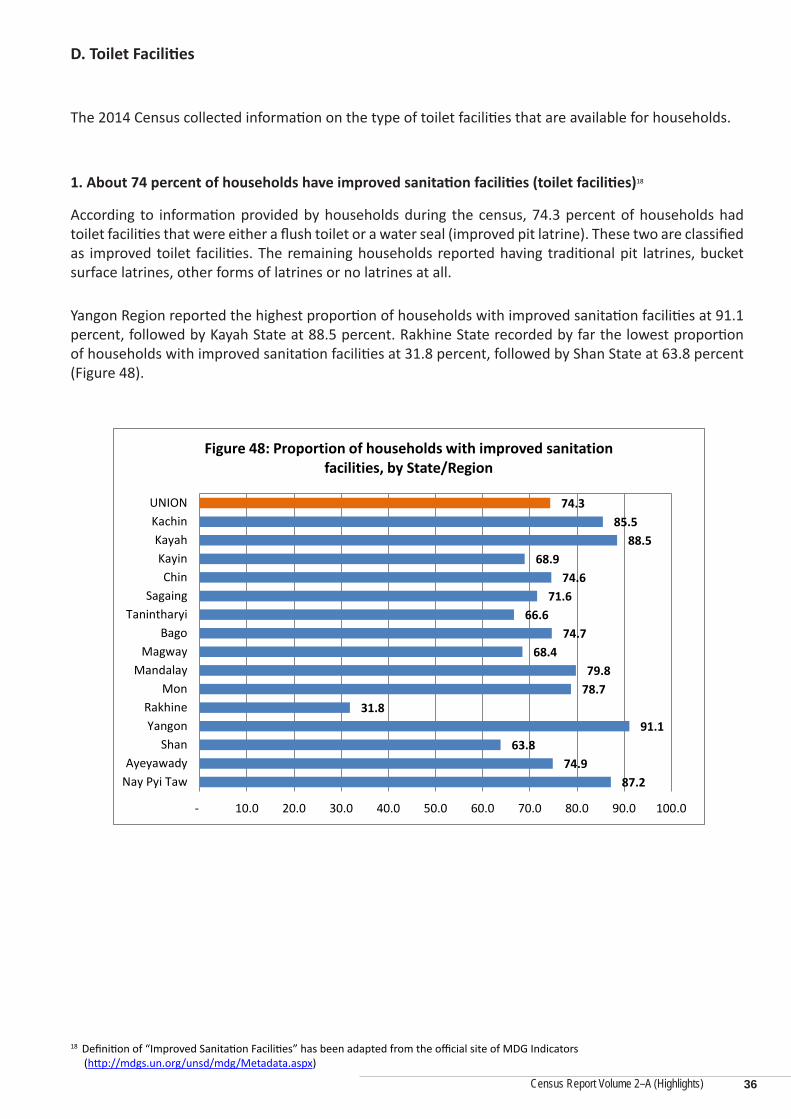
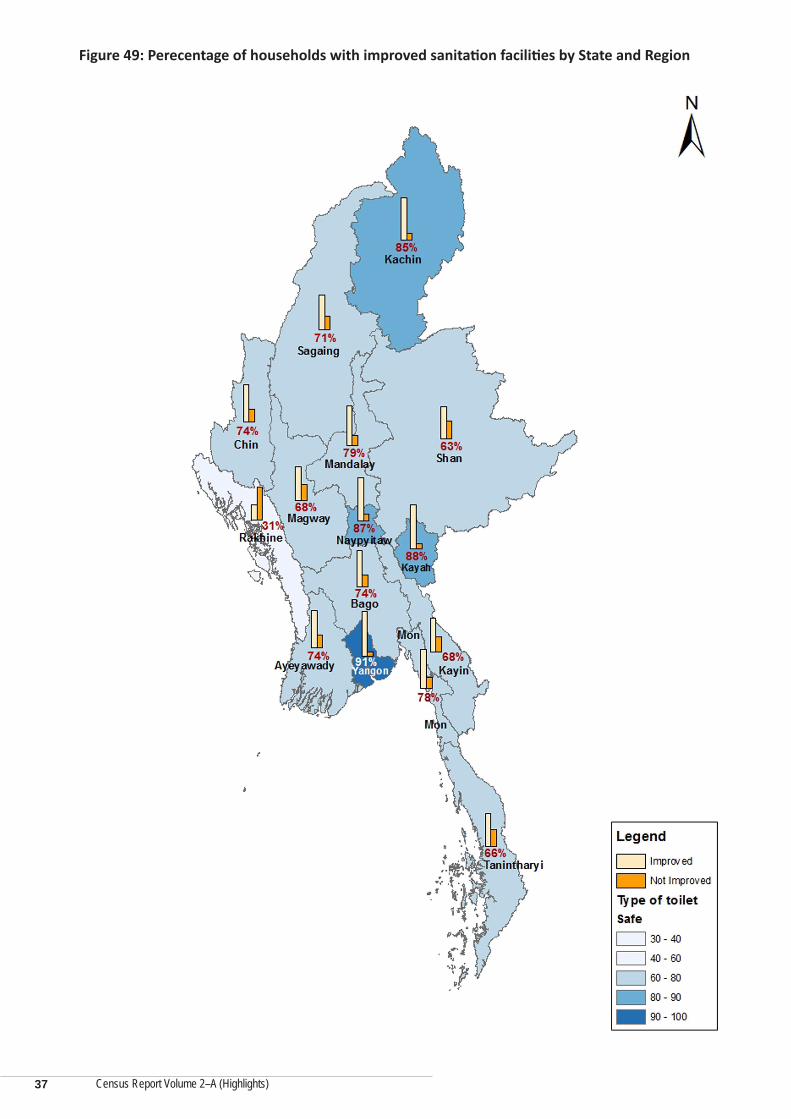
1. About 74 percent of households have improved sanitation facilities (toilet facilities)18
According to information provided by households during the census, 74.3 percent of households had toilet facilities that were either a flush toilet or a water seal (improved pit latrine). These two are classified as improved toilet facilities. The remaining households reported having traditional pit latrines, bucket surface latrines, other forms of latrines or no latrines at all.
Yangon Region reported the highest proportion of households with improved sanitation facilities at 91.1 percent, followed by Kayah State at 88.5 percent. Rakhine State recorded by far the lowest proportion of households with improved sanitation facilities at 31.8 percent, followed by Shan State at 63.8 percent (Figure 48).
18 Definition of “Improved Sanitation Facilities” has been adapted from the official site of MDG Indicators (http://mdgs.un.org/unsd/mdg/Metadata.aspx)
Figure 48: Proportion of households with improved sanitation facilities, by State/Region
36
Census Report Volume 2–A (Highlights)
Figure 49: Perecentage of households with improved sanitation facilities by State and Region
37
Census Report Volume 2–A (Highlights)
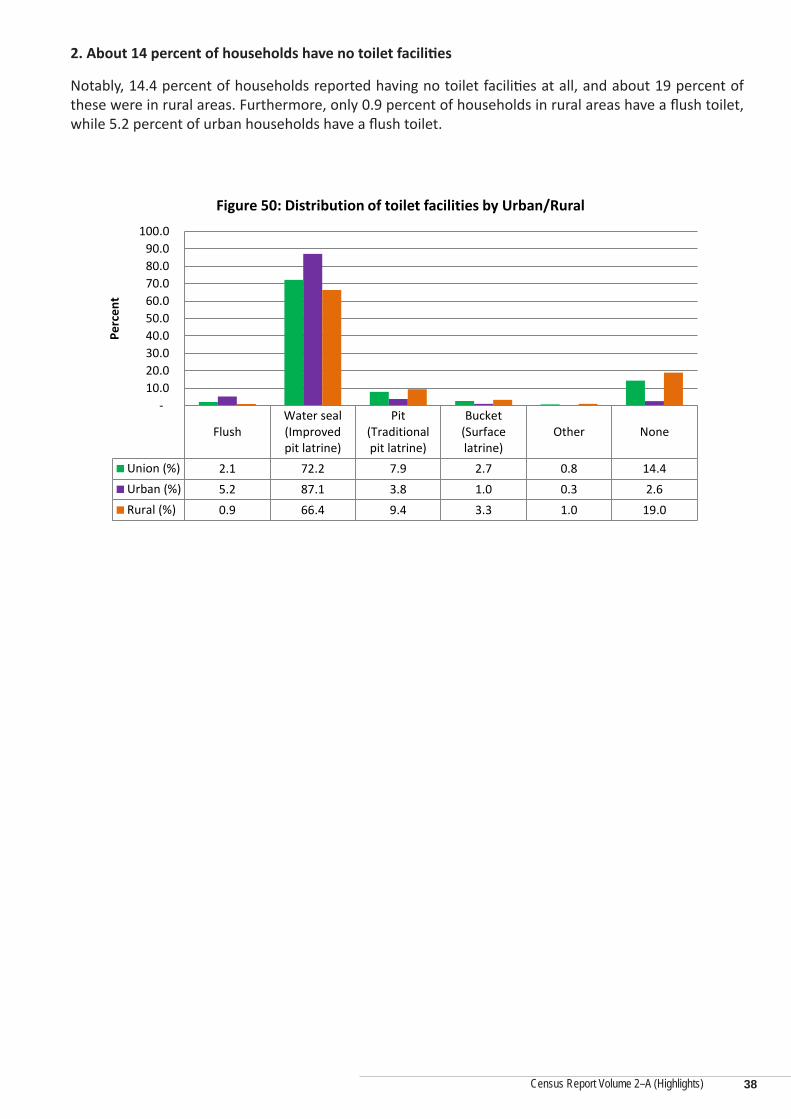
2. About 14 percent of households have no toilet facilities
Notably, 14.4 percent of households reported having no toilet facilities at all, and about 19 percent of these were in rural areas. Furthermore, only 0.9 percent of households in rural areas have a flush toilet, while 5.2 percent of urban households have a flush toilet.
Figure 50: Distribution of toilet facilities by Urban/Rural
38
Census Report Volume 2–A (Highlights)
E. Communication Facilities
The 2014 Census collected information on the availability of selected communication facilities in households. This information is important for understanding the most common channels that can be used for disseminating important messages to the population, and the extent to which people have access to information.
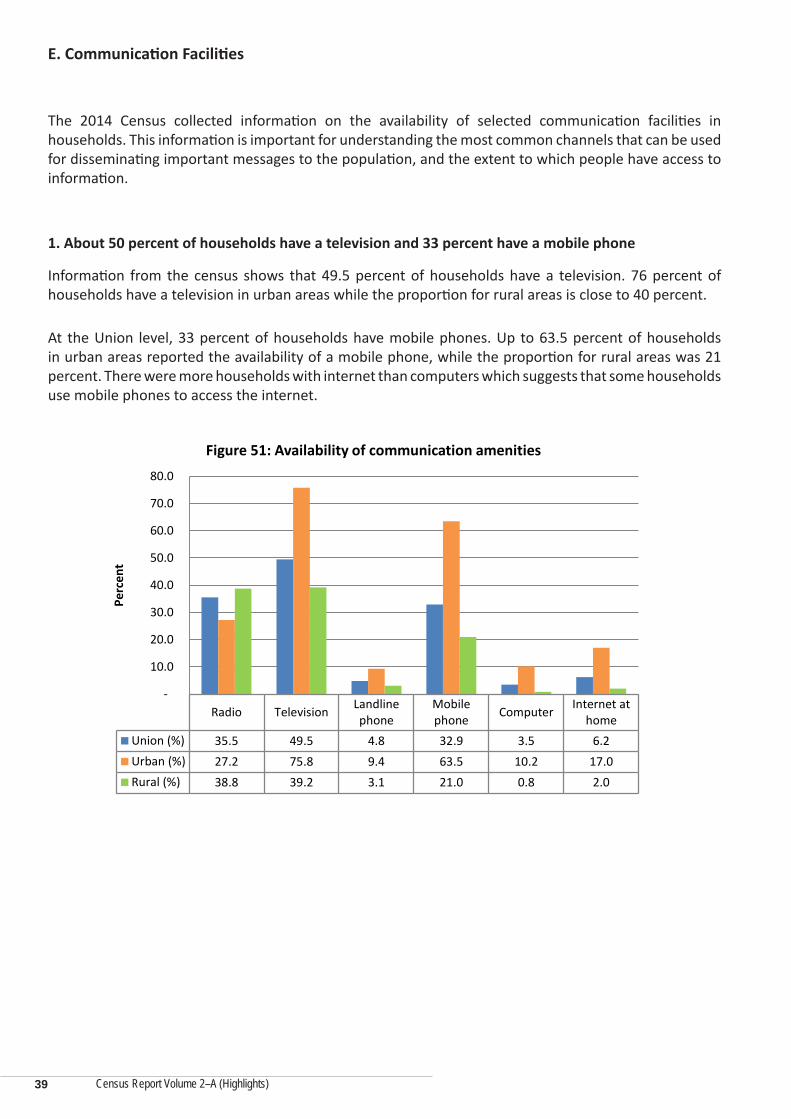
1. About 50 percent of households have a television and 33 percent have a mobile phone
Information from the census shows that 49.5 percent of households have a television. 76 percent of households have a television in urban areas while the proportion for rural areas is close to 40 percent.
At the Union level, 33 percent of households have mobile phones. Up to 63.5 percent of households in urban areas reported the availability of a mobile phone, while the proportion for rural areas was 21 percent. There were more households with internet than computers which suggests that some households use mobile phones to access the internet.
Figure 51: Availability of communication amenities
39
Census Report Volume 2–A (Highlights)
F. Transportation Equipment
The 2014 Census collected information on the availability of selected transportation equipment in households across the country.
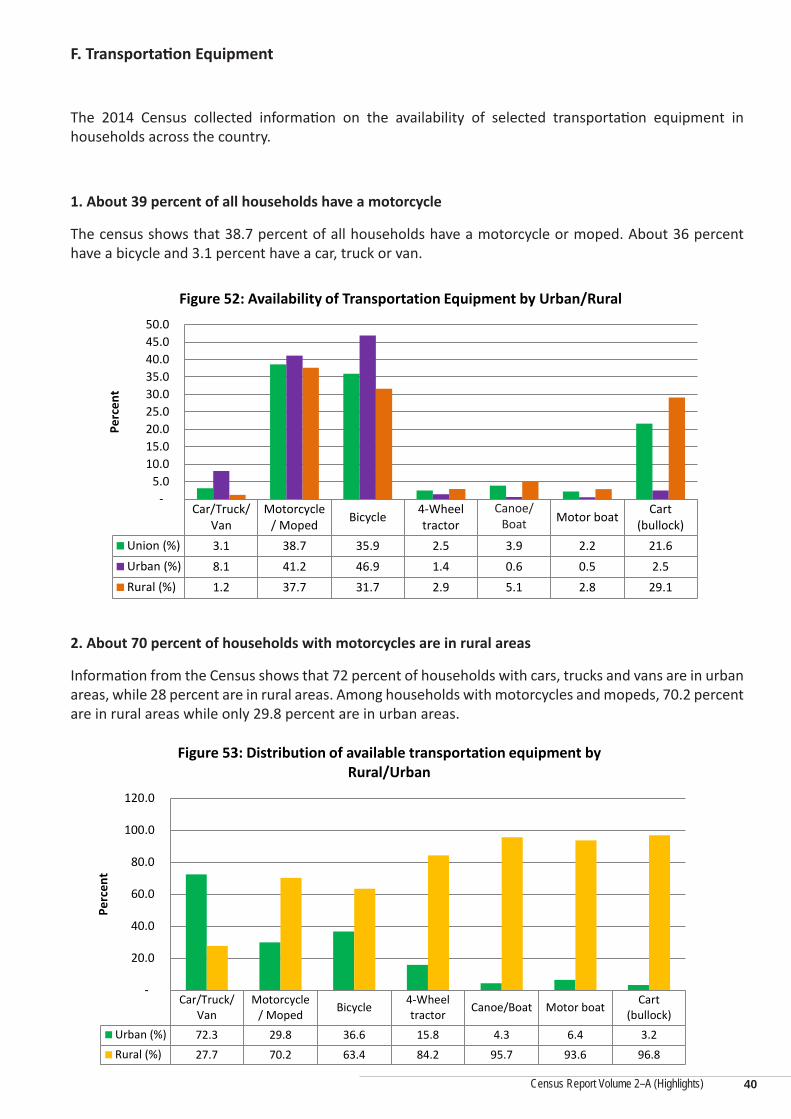
1. About 39 percent of all households have a motorcycle
The census shows that 38.7 percent of all households have a motorcycle or moped. About 36 percent have a bicycle and 3.1 percent have a car, truck or van.
2. About 70 percent of households with motorcycles are in rural areas
Information from the Census shows that 72 percent of households with cars, trucks and vans are in urban areas, while 28 percent are in rural areas. Among households with motorcycles and mopeds, 70.2 percent are in rural areas while only 29.8 percent are in urban areas.
Figure 53: Distribution of available transportation equipment by Rural/Urban
40
Canoe/ Boat
Census Report Volume 2–A (Highlights)
Concluding Remarks: Data Use and Data Access
The 2014 Myanmar Population and Housing Census provides a wealth of valuable demographic and socio-economic information, which is essential for informed decision-making at all levels. Census information is an important tool for development planners, policy makers and sectoral authorities at the Union, State/Region, District and Township levels, both in the public and private sectors, to enable them to better understand the socio-economic profiles of the intended beneficiaries of their programmes and projects and to maximise the impact of their interventions.
The data generated from the 2014 Census is vital for addressing the statistical and information needs of the central, regional and local governments, parliamentarians, ethnic groups, interest groups, businesses, researchers, students, the media and the public at large. The Census information is an indispensable building block for the on-going political and socio-economic transition in Myanmar, as well as for mapping the short, medium and long term development needs of the country.
In addition, the 2014 Census provides the necessary information for addressing the needs of special population groups in Myanmar, particularly those of women and girls, children, young people, people with disabilities, the elderly and other marginalised populations. Social researchers and other stakeholders are encouraged to conduct further analysis of the socio-economic variables collected by the census to highlight the structural and social relations of the people of Myanmar that need to be addressed in order to improve the overall welfare of the population and reduce inequities where these exist.
The Department of Population, with assistance from UNFPA and the World Bank, has developed a National Sampling Frame based on the 2014 Census data. This Sampling Frame provides an up-to-date, nation-wide, accurate and adequate listing of sampling units that can be used for large and small surveys in the country. Research institutions and organisations are encouraged to use the Sampling Frame for their surveys in order to reduce time and financial costs, while at the same time improving the quality of their samples. The sampling frame may be requested from the Department of Population.
More information on the 2014 Census can be obtained from the Department of Population at the address below. Individuals and institutions interested in specific information or data that has not been presented in any of the printed or electronic products may officially request such information from the Department of Population. The Department of Population will evaluate such requests and, where merited, provide the data if available.
1. Provisional Results; Census Report Volume (1): 2014 Myanmar Population and Housing Census: Ministry of Immigration and Population, Republic of The Union of Myanmar, August 2014
2. The 1983 Population Census Report, Burma: Immigration and Manpower Department. The Socialist Republic of the Union of Burma, Ministry of Home and Religious Affairs
3. The 1973 Population Census Report (Union) – Myanmar version: Immigration and Manpower Department. The Socialist Republic of the Union of Burma, Ministry of Home and Religious Affairs
4. Overview of the Results of the 2010 Population Census; Population and Households of Japan, 2010: Statistics Bureau, Ministry of Internal Affairs and Communications, July 2013
5. Principles and Recommendations for Population and Housing Censuses, Series M No 67/Rev. 2; United Nations (2008)
6. Population, An Introduction to Concepts and Issues, Tenth Edition, San Diego State University; John R. Weeks (2008)
7. The Methods and Materials of Demography, Condensed Edition; Shyrock Henry S (1976).
8. Manual for the Development of Statistical Information for Disability Programmes and Policies. Statistics Population Groups, No. 8. Sales No. E. 96.XVII.4, United Nations (1996)
9. Country Report on 2007 Fertility and Reproductive Health Survey, Department of Population, Ministry of Immigration and Population, Union of Myanmar
10. Step-by-Step Guide to the Estimation of Child Mortality; Department of International Economic and Social Affairs, Population Studies No. 107; United Nations New York 1990