Kozo Okamoto, and Meteorological Satellite Center of JMA Meteorological Research Institute (MRI) of Japan Meteorological Agency (JMA) Himawari-8: Japan's new-generation geostationary satellite 8th IPWG and 5th IWSSM Joint Workshop, Bologna, Italy 3-7 October 2016
Transcript
Kozo Okamoto, and Meteorological Satellite Center of JMA
Meteorological Research Institute (MRI) of Japan Meteorological Agency (JMA)
• Operational adaptive (targeting) observation is used for TCs and volcanos
• 1,000 x 1,000km
• 2.5 min
8
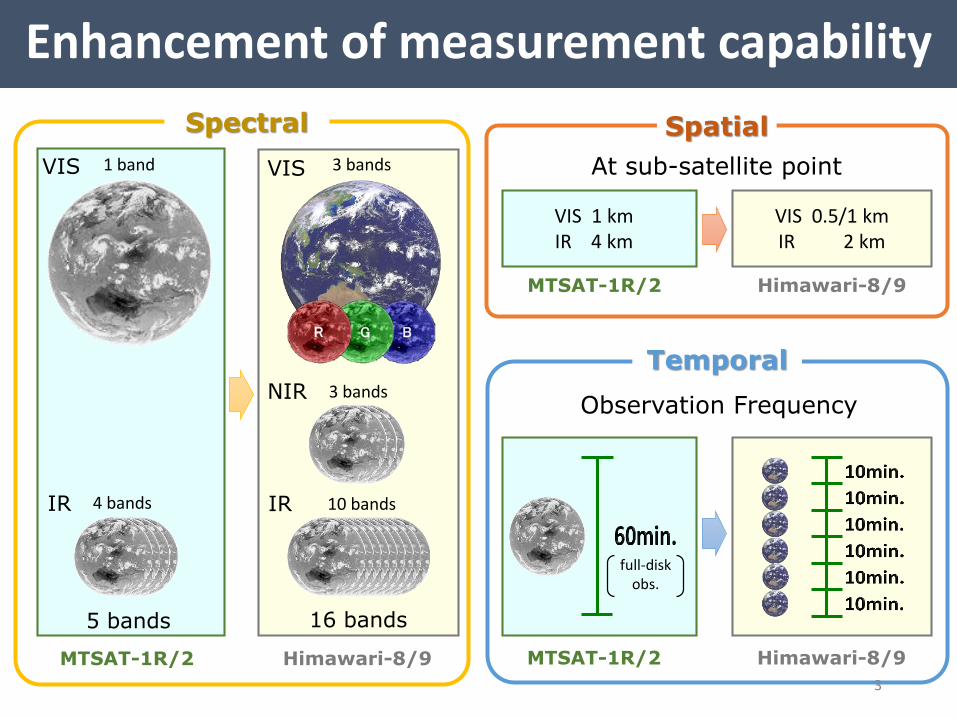
Himawari-8/9
raw data
JMA
Communication Satellite (CS)
HRIT files,SATAID files
All imagery(full data)
HimawariCloud service
HimawariCastservice
Users
CS Operator
C-band antenna
LNB converter
DVB-S2 receiver
PC & software
NMHSs
Data Distribution
9
• Updates the ground processing system in March 2016– Band-to-band co-registration, resampling
process, coherent noise reduction Significant improvement in image quality
• Image navigation– Residual error is less than ~1km
• Calibration– IR: very stable TB biases - less than 0.2K
for standard scenes, no significant diurnal variation
– VIS/NIR (reflectivity/radiance) bias: less than +/- 3% for bands 1-4 (0.46–0.86 μm) since June 2015– But +/- 4-6% biases still remain in bands 5 & 6
(1.6 & 2.3 μm)
Navigation and CalibrationMonitor website http://www.jma-net.go.jp/msc/en/index.html
High-resolution Cloud Analysis Information (HCAI)
Basic cloud product with latitude-longitude grid in 0.02 degree.
• cloud mask, cloud type and cloud top height
Produced hourly (24/day)
Cloud Top Height
Clear CloudMixed
Cloud Mask
11
Atmospheric Motion Vector (AMV)
12Himawari-8 and MTSAT-2 IR AMV (QI>60, 2015 01 14 1700UTC)
Resolution 4km/30min.
Resolution 4km/60min.
MTSAT-2 AMVs
Colder color : upper level wind warmer color : low level wind
Resolution 2km/10min.
Himawari-8 AMVs
JMA/MSC has developed a new algorithm for Himawari-8 AMVs based on an
optimal estimation method for full exploitation of satellite data (Shimoji 2014).
• Assimilate AMV with better quality and coverage• 200 km thinning and 100
km average around Japan
• Improve analysis and forecast of wind speed
Assimilation of AMV
Forecast lead time [h]
Rel
ativ
e Im
pro
vem
ent
[%]
Better
Wo
rse
MTSAT2Himawari8Besttrack
Typhoon Track forecast of Nangka (T1511)Initialized at 12 UTC 13 July 2015
MTSAT2 Himawari8
Relative improvement of wind speed at 850hPa around Japan
Yamashita 2016, WGNE
Clear Sky Radiance (CSR) Area averaged clear sky brightness temperature All IR bands (3.9, 6.2, 6.9, 7.3, 8.6, 9.6, 10.4, 11.2, 12.4, 13.3 μm) Full disk, hourly produced and distributed via GTS mainly for NWP community Spatial resolution (averaging size): 16 x 16 pixel (IR) (i.e. 32 x 32 km @SSP) Band dependent clear pixel ratios for clear pixel detection Provided to NWP centers via GTS
00 UTC on15 August 2015
Band #8 (6.2 μm) Band #9 (6.9 μm) Band #10 (7.3 μm)
BrightnessTemperature
Clear PixelRatio
KWeighting function of
WV bands
• Reduce dry bias in global DA
• Improve front location and humidity convergence in mesoscale DA• improve precipitation
forecast
Radar and rain gauge composite
Analyzed total column water vapor [mm]
MTSAT-2 Himawari-8
Assimilation of CSR
Kazumori2016 WGNE
MTSAT-2 Himawari-8
3-h rainfall forecasts [mm/3h]
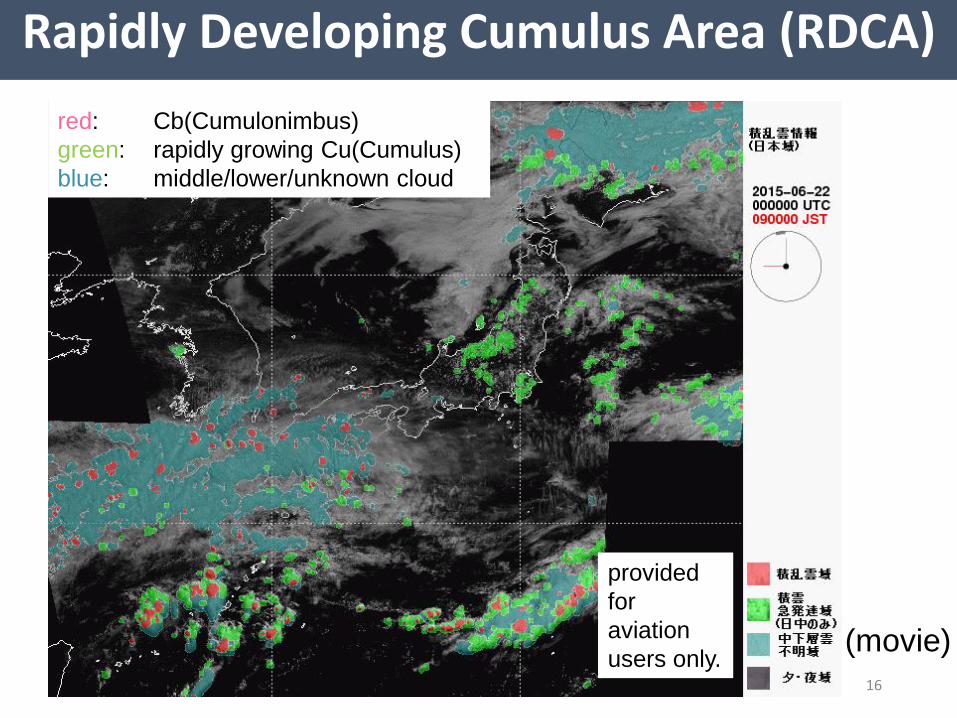
Rapidly Developing Cumulus Area (RDCA)
red: Cb(Cumulonimbus)
green: rapidly growing Cu(Cumulus)
blue: middle/lower/unknown cloud
provided
for
aviation
users only. 16
(movie)
height
• Developing cumulus is identified by cloud top and roughness
• Probability is estimated with a logistic regression method
• Detect about 20 min before lightning occurrence
• Detection accuracy is • High for isolated Cb clouds• Low when upper clouds cover potentially developing low clouds• Low at night time