38
Hispanic Shopping Trends October 2015
| Date post: | 20-Feb-2017 |
| Category: |
Marketing |
| Upload: | thinknow-research |
| View: | 31 times |
| Download: | 0 times |

Hispanic Shopping TrendsOctober 2015

Outline
Methodology 3
Detailed Findings 5
Key Findings 41
Appendix 44
Methodology

Methodology
Method Online survey via ThinkNow Research’s Omnibus Study
Segments &
Base Sizes
Total: n=1,539
Hispanics: n=614
Non-Hispanic Whites: n=309
African Americans: n=304
Asians: n=312
Test Area Nationwide
Fieldwork Timing September, 2015
QuotasQuotas/Weighting per segment to US Census benchmarks on
gender, age, US region and HH income.

Detailed Findings

Roughly two-thirds of consumers buy something online at least monthly; about
one-third do so at least weekly.
Frequency of Buying Something Online & In-Person- Total Sample -
Q1. In general, about how often do you buy something online/in-person?
Base: Total Sample - Hispanics (614), NH Whites (309), African-Americans (304), Asians (312)
Letters indicate statistically significant
difference (95% confidence)
33%
70%
33%
76%
28%
71%
34%
70%
Once a week or more (Net) Once a month or more(Net)
Hispanics NH Whites African-Americans Asians
6
(A) (B) (C) (D)
76%
94%
76%
96%
72%
93%
71%
90%
Once a week or more(Net)
Once a month or more(Net)
ONLINE IN-PERSON

Among Hispanics, the biggest driver of online purchasing is household income.
Hispanic males and Millennials in general buy online more often as well.
Frequency of Buying Something Online- Hispanics -
Q1. In general, about how often do you buy something online?
Base: Total Sample – Males (n=295), Females (n=318), 18-34 (n=306), 35-64 (n=308), <$40K (n=312), $40K+ (n=276),
Span-Dom (n=219), Bilingual (n=203), Eng-Dom (n=192)
Letters indicate statistically significant
difference (95% confidence)
39%
28%
38%
29%
23%
45%
31%
42%
25%
Males Females . 18-34 35-64 .. <$40K $40K+ … Span-Dom.
Bilingual Eng-Dom.
7
ONLINE
(A) (B) (C) (D) (E) (F) (G) (H) (I)
B D
E
GI
Once a Week or More Often (Net)

56%
31%
12%
48%46%
6%
51%
29%
20%
52%
39%
10%
More now About the same Less now
Hispanics NH Whites African-Americans Asians
8
Change in Online Purchasing Habits
Compared to One Year Ago- Online Shoppers -
Q6. Would you say you are making more, less or the same number of purchases online now compared to 1 year ago?
Base: Online Shoppers – Hispanics (567), NH Whites (290), African-Americans (278), Asians (291)
Letters indicate statistically significant
difference (95% confidence)
(A) (B) (C) (D)
Just over half of Hispanic online shoppers say they are buying more online
now compared to one year ago. This is higher than the other segments.
B
ACD
ABD
B
Hispanics 18-34 = 64% More
Hispanics 35-64 = 49% More

9
58%
27%
15%
62%
26%
12%
49%
40%
11%
More now About the same Less now
Spanish Dom. Bilingual English Dom.
(J) (K) (L)
Change in Online Purchasing Habits
Compared to One Year Ago- Hispanic Online Shoppers -
Q6. Would you say you are making more, less or the same number of purchases online now compared to 1 year ago?
Base: Online Shoppers – Spanish Dom. (199), Bilingual (188), English Dom. (190)
Letters indicate statistically significant
difference (95% confidence)
Spanish-Dominant and Bilingual Hispanics in particular are shopping online
more now compared to one year ago.
JK
L

10
67%
57%
47%
41%
3%
62%
35%
48%
30%
3%
64%
49%
43%
29%
1%
71%
45% 46%
30%
3%
Laptop computer Mobile phone Desktop computer Tablet iWatch
Hispanics NH Whites African-Americans Asians
Devices Used When Buying Products Online- Online Shoppers -
Q9. Which devices do you use when you buy products online?
Base: Online Shoppers - Hispanics (567), NH Whites (290), African-Americans (278), Asians (291)
Letters indicate statistically significant
difference (95% confidence)
(A) (B) (C) (D)
Consumers in general are most likely to use their laptop computer when
shopping online. More Hispanics use their mobile phone and tablet to make
purchases compared to the other segments.
B
BCD
BCD
BB

The popularity of mobile phone purchases among Hispanics is driven mostly by
Bilinguals.
Devices Used When Buying Products Online- Hispanic Online Shoppers -
Q9. Which devices do you use when you buy products online?
Base: Online Shoppers – Spanish Dom. (n=199), Bilingual (n=188), English Dom. (n=190)
Letters indicate statistically significant
difference (95% confidence) 11
67%
54%
39%38%
2%
65%62%
53%
43%
4%
69%
54%
48%
41%
2%
Laptop computer Mobile phone Desktop computer Tablet iWatch
Spanish Dom. Bilingual English Dom.
(J) (K) (L)
J

12
3.73.9
3.5
4.2
Hispanics NH-Whites African-American Asian
Number of Online Purchases Made in Past 30 Days- Online Shoppers -
Letters indicate statistically significant
difference (95% confidence)
Q13a. How many times did you make a purchase online in the past 30 days?
Base: Online Shoppers – Hispanics (n=567), NH Whites (n=290), African-American (n=278), Asian (n=291)
(A) (B) (C) (D)
Online consumers made an average of close to four online purchases in the
past 30 days. Asians made the most at just over four.
C

Bilinguals and households with $40K+ income made the most online purchases
among Hispanics.
Q13a. How many times did you make a purchase online in the past 30 days?
Base: Online Shoppers - Males (n=273), Females (n=293), 18-34 (n=286), 35-64 (n=281), <$40K (n=277), $40K+ (n=269),
Span-Dom (n=199), Bilingual (n=188), Eng-Dom (n=180)
Letters indicate statistically significant
difference (95% confidence)
3.9
3.5
3.9
3.6
3
4.5
3.4
4.6
3
Males Females . 18-34 35-64 .. <$40K $40K+ … Span-Dom.
Bilingual Eng-Dom.
13
(A) (B) (C) (D) (E) (F) (G) (H) (I)
E GIMean
Number of Online Purchases Made in Past 30 Days- Hispanic Online Shoppers -

14
$1,437
$1,597
$881
$1,363
Hispanics NH-Whites African-American Asian
Amount Spent on Online Purchases in the Past 12 Months- Total Sample -
Letters indicate statistically significant
difference (95% confidence)
Q13c. Approximately how much do you think you spent on all of your online purchase in the past 12 months?
Base: Total Sample - Hispanics (n=614), NH Whites (n=309), African-Americans (n=304), Asians (n=312)
(A) (B) (C) (D)
Hispanics spent an average of $1,437 on their online purchases in the past 12
months. This is lower than non-Hispanic Whites and relatively even with
Asians. African-Americans spent the least overall.
C
CC
MEAN

15
$2,165
$1,220
$1,551
$2,216
$1,298
Males Females . Spanish Dom. Bilingual English Dom.
Amount Spent on Online Purchases in the Past 12 Months- Hispanics -
Q13c. Approximately how much do you think you spent on all of your online purchase in the past 12 months?
Base: Total Sample: Males (n=295), Females (n=318), Spanish Dom. (n=199), Bilingual (n=188), English Dom. (n=180)Letters indicate statistically significant
difference (95% confidence)
(J) (K) (L)
Hispanic males spent significantly more online in the last 12 months compared
to females.
(F) (G)
GJL
MEAN

Most online shoppers have purchased clothing in the past 12 months. Shoes,
home electronics and music are also popular items to buy online.
Product Categories Bought Online in Past 12 Months- Online Shoppers -
Q2. Thinking of the past 12 months, which of the following product categories have you purchased online?
Base: Online Shoppers
Letters indicate statistically significant
difference (95% confidence) 16
Hispanics (A)
NH Whites(B)
African-
Americans
(C)
Asians (D)
(Base) (567) (290) (278) (291)
Clothing 62% 61% 57% 63%
Shoes 47% 45% 45% 45%
Home Electronics 43% 42% 43% 47%
Music 41% 35% 34% 34%
Fast food/Take-out (Pizza, etc.) 39% 33% 37% 31%
Books 38%C 46%AC 29% 40%C
Tickets (movies, concerts, etc.) 37% 33% 26% 38%C
Toys 35%C 33%C 23% 32%C
Health & Beauty products 33% 30% 24% 41%BC
Airline tickets 33%BC 21% 15% 46%ABC
Jewelry (including watches) 30% 26% 24% 24%
Vitamins/Supplements 30% 24% 23% 30%
Small Appliances 26% 23% 20% 26%
Home decorations/ accessories 20% 24% 19% 28%C
Magazines 20% 20% 15% 17%
Grocery food items 18% 22% 16% 19%
Sports Equipment (not including apparel) 18%C 18%C 9% 16%C
Flower arrangements 16%CD 13% 11% 10%
Household Cleaning Supplies 15% 15% 12% 20%C
Medicine (Prescription or Off-the-shelf) 14% 15% 11% 13%
Furniture 14%C 17%C 8% 16%C
Large Appliances 11% 11%C 5% 8%
Beer/Alcohol 8%BCD 4% 5% 4%

Hispanic females are more likely to buy healthy and beauty products online
compared to males. Males are more likely to buy such things as grocery food
items, sports equipment and flower arrangements online.
Product Categories Bought Online in Past 12 Months- Hispanic Online Shoppers -
Q2. Thinking of the past 12 months, which of the following product categories have you purchased online?
Base: Online Shoppers
Letters indicate statistically significant
difference (95% confidence) 17
Males(F)
Females(G)
(Base) (273) (293)
Clothing 59% 65%
Shoes 47% 46%
Home Electronics (TV, Computer, etc.) 54% 32%
Music 50% 32%
Fast food/Take-out (Pizza, etc.) 41% 37%
Books 40% 36%
Tickets (movies, concerts, etc.) 39% 34%
Toys 35% 34%
Health & Beauty products 24% 42%F
Airline tickets 35% 30%
Jewelry (including watches) 28% 31%
Vitamins/Supplements 33% 26%
Small Appliances 29% 23%
Home decorations/ accessories 19% 21%
Magazines 23%G 15%
Grocery food items 22%G 14%
Sports Equipment (not including apparel) 24%G 11%
Flower arrangements 20%G 12%
Household Cleaning Supplies 16% 14%
Medicine (Prescription or Off-the-shelf) 19%G 10%
Furniture 14% 13%
Large Appliances 13%G 8%
Beer/Alcohol 11%G 5%

18
64%
56%
46%
46%
35%
33%
32%
31%
29%
28%
26%
24%
24%
22%
21%
21%
17%
16%
14%
13%
10%
8%
6%
26%
35%
48%
48%
62%
62%
57%
56%
65%
68%
69%
70%
62%
72%
75%
75%
79%
80%
79%
83%
85%
81%
91%
10%
8%
6%
7%
3%
5%
11%
12%
6%
3%
5%
6%
14%
6%
4%
4%
4%
4%
7%
3%
5%
11%
3%
Airline tickets
Music
Books
Tickets (movies, concerts, etc.)
Home Electronics (TV, Computer, Mobile…
Toys
Magazines
Flower arrangements
Sports Equipment (not including apparel)
Jewelry (including watches)
Vitamins/Supplements
Small Appliances (microwave, blender/…
Fast food/Take-out (Pizza, etc.)
Shoes
Clothing
Home decorations/ accessories (picture…
Health & Beauty products (body soap,…
Large Appliances (washer, dryer,…
Medicine (Prescription or Off-the-shelf)
Household Cleaning Supplies
Furniture
Beer/Alcohol
Grocery food items
Internet In-Person Mail/Phone
When given a choice, the items that Hispanics prefer to purchase online the most
are airline tickets, music, books, movie/concert tickets and home electronics.
Buying Preference Per Category- Hispanic Category Purchasers -
Q4. Which method do you prefer to use to buy each of the following types of products?
Base: Hispanic Category Purchasers (Varies by category)

19
Hispanics (A)
NH Whites(B)
African-
Americans
(C)
Asians (D)
Airline tickets 64% 62% 58% 77%ABC
Music 56% 50% 52% 62%B
Books 46% 43% 45% 55%B
Tickets (movies, concerts, etc.) 46%B 33% 44%B 55%BC
Home Electronics 35% 32% 31% 41%C
Toys 33% 29% 34% 41%B
Magazines 32% 25% 31% 42%B
Flower arrangements 31% 33% 36% 26%
Sports Equipment 29% 26% 21% 28%
Jewelry (including watches) 28% 23% 21% 19%
Vitamins/Supplements 26% 17% 20% 28%
Small Appliances 24% 23% 27% 37%ABC
Fast food/Take-out (Pizza, etc.) 24% 20% 23% 28%
Shoes 22% 18% 21% 25%
Clothing 21% 20% 22% 30%B
Home decorations/ accessories 21% 17% 20% 17%
Health & Beauty products 17% 12% 12% 19%
Large Appliances 16% 15% 13% 19%
Medicine (Prescription or Off-the-shelf) 14% 11% 10% 13%
Household Cleaning Supplies 13% 7% 8% 16%C
Furniture 10% 15% 14% 14%
Beer/Alcohol 8% 4% 6% 11%B
Grocery food items 6% 3% 3% 6%
Q4. Which method do you prefer to use to buy each of the following types of products? - Online
Base: Category Purchasers (Varies by category)
Letters indicate statistically significant
difference (95% confidence)
Preferred Method For Purchasing Items – Online- Category Purchasers -
Asians over-index in preference for online purchases across many product
categories.

20
Research Done Before Buying- Online Shoppers -
Q11. When you are looking for a specific item to buy online (i.e. electronics, apparel, etc.), how much research do you do in
advance, if at all? Base: Online Shoppers – Hispanics (n=567), NH Whites (n=290), African-American (n=278), Asian (n=291)
Letters indicate statistically significant
difference (95% confidence)
9%17%
10%5%
54%46%
48%
48%
31% 31%33%
36%
6% 6% 8% 11%
Hispanics NH-Whites African-American Asian
I search for weeks beforemaking a purchase
I search for several days(multiple sessions) beforemaking a purchase
I spend time looking throughdifferent websites in the samesession before making apurchase
I don’t do much research/I usually buy from the first website I visit
Online shoppers are most likely to browse through different websites in one
session before making a purchase.
Asians take
the most time
47%
(A) (B) (C) (D)
B
ACDD

21
Research Done Before Buying- Hispanic Online Shoppers -
Letters indicate statistically significant
difference (95% confidence)
Q11. When you are looking for a specific item to buy online (i.e. electronics, apparel, etc.), how much research do you do in
advance, if at all?
Base: Online Shoppers – Spanish Dom. (n=199), Bilingual (n=188), English Dom. (n=189)
8% 8% 11%
54%61%
47%
34% 25%
33%
4% 7% 8%
Spanish Dom. Bilingual English Dom.
I search for weeks beforemaking a purchase
I search for several days(multiple sessions) beforemaking a purchase
I spend time looking throughdifferent websites in the samesession before making apurchase
I don’t do much research/I usually buy from the first website I visit
English-Dominant Hispanics spend the most time searching online before
making a purchase.
41% search
for several
days/ weeks
(J) (K) (L)
L

Amazon is the dominant website used for online purchases by all four groups.
Ebay and Walmart are a distant second and third.
In Which Website Do You Make the Most Online Purchases?- Online Shoppers -
Q12. In which website do you make the most online purchases?
Base: Online Shoppers- Hispanics (n=567), NH Whites (n=290), African-Americans (n=278), Asians (n=291)
Letters indicate statistically significant
difference (95% confidence)
61%
17%
10%
73%
9% 8%
53%
15%
20%
76%
11%
7%
Amazon Ebay Walmart.com
Hispanics NH Whites African-Americans Asians
(A) (B) (C) (D)
22
Walmart.com is popular
with African-Americans.
B
ACAC
ABD
Note: Top 3 are shown.

23
Hispanics (A)
NH Whites(B)
African-
Americans
(C)
Asians (D)
Better prices 53% 55% 51% 57%
More convenient/ Don’t need to leave home 48% 56% 53% 65% AC
Able to compare prices 44% 36% 38% 46%
Easier to find the products I need 40% 39% 38% 44%
More variety/selection 36% 36% 37% 36%
Like to read customer reviews 24% 31% 34% A 38% A
The product/brand I want is only available
online19% 20% 20% 18%
Q16. Why have you only purchased these items online and not in-person?
Base: Online Shoppers – Hispanics (n=417), NH Whites (n=213), African-American (n=207), Asian (n=232)
Reasons Why Items Purchased Online- Buy Certain Items Online Only -
Letters indicate statistically significant
difference (95% confidence)
The reasons why consumers purchase online center around better prices,
convenience and improved variety.

24
32% 31% 30% 27%
53% 56%54%
55%
12% 8%12% 14%
4% 5% 5% 5%
Hispanics NH-Whites African-American Asian
I stay away from buying itemsonline
I like it but I only buy onlinewhen I really need to
I like it but still prefer to buycertain items in-person at thestore
I love it, I wish I could buyeverything online
Q18a. In general, how do you feel about shopping online?
Base: Total Sample - Hispanics (614), NH Whites (309), African-Americans (304), Asians (312)Letters indicate statistically significant
difference (95% confidence)
Feelings Towards Online Shopping
Most consumers say they like online shopping but still prefer to buy certain
items in-person. A sizeable portion (roughly one-third) wish they could buy
everything online.
(A) (B) (C) (D)
40% among Hispanics $40K+;
26% among <$40K

25
Feelings Towards Online Shopping- Hispanics -
Letters indicate statistically significant
difference (95% confidence)
Q18a. In general, how do you feel about shopping online?
Base: Hispanics – Spanish Dom. (n=219), Bilingual (n=203), English Dom. (n=192)
31% 35%28%
47%
54%57%
16%
10%11%
6% 2% 4%
Spanish Dom. Bilingual English Dom.
I stay away from buying itemsonline
I like it but I only buy onlinewhen I really need to
I like it but still prefer to buycertain items in-person at thestore
I love it, I wish I could buyeverything online
(J) (K) (L)
Bilingual Hispanics in particular enjoy buying products online.
26
19% 19% 16% 14%
41%35% 43%
33%
27%30%
33%
40%
13% 15%7%
13%
Hispanics NH Whites African-Americans Asians
Never
Rarely
Sometimes
A lot/The majority of times that I’m on the internet
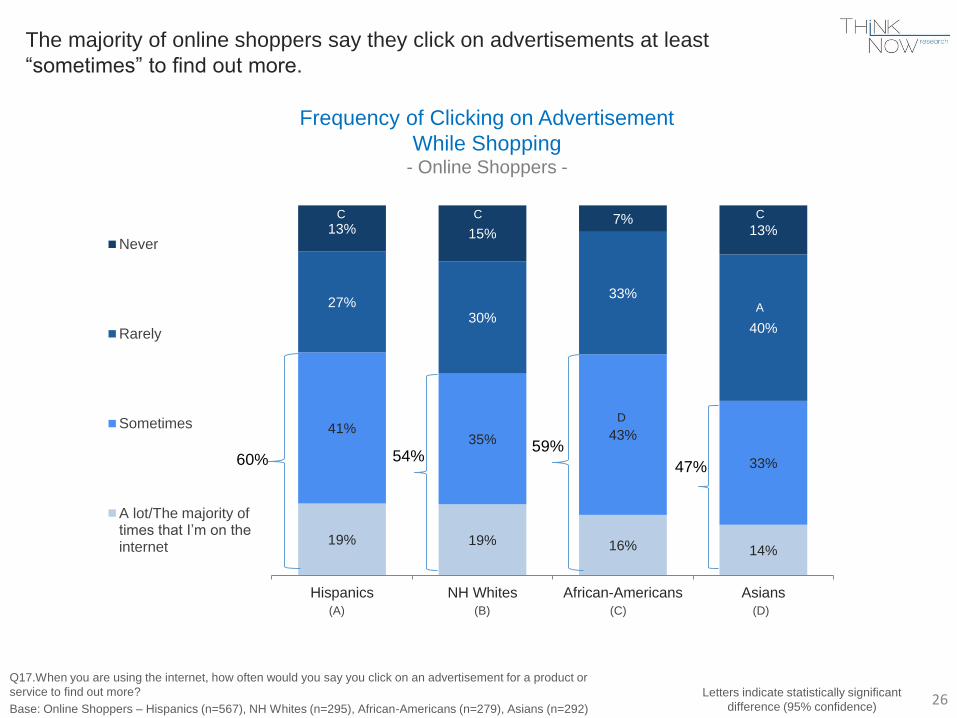
Frequency of Clicking on Advertisement
While Shopping- Online Shoppers -
Letters indicate statistically significant
difference (95% confidence)
Q17.When you are using the internet, how often would you say you click on an advertisement for a product or
service to find out more?
Base: Online Shoppers – Hispanics (n=567), NH Whites (n=295), African-Americans (n=279), Asians (n=292)
(A) (B) (C) (D)
The majority of online shoppers say they click on advertisements at least
“sometimes” to find out more.
D
C C C
A
60% 54%59%
47%

27
Frequency of Clicking on an Advertisement- Hispanic Online Shoppers -
Letters indicate statistically significant
difference (95% confidence)
Q17.When you are using the internet, how often would you say you click on an advertisement
for a product or service to find out more?
Base: Online Shoppers – Spanish Dom. (n=199), Bilingual (n=188), English Dom. (n=180)
26% 22%
11%
40% 46%
36%
27% 20%
35%
8% 11%18%
Spanish Dom. Bilinguals English Dom.
Never
Rarely
Sometimes
A lot/The majority of times that I’m on the internet
(J) (K) (L)
Spanish-Dominant and Bilingual Hispanics are significantly more likely to click
on an advertisement compared to English-Dominants.
L L
J
K

28
65%
42%
56%
64%
Yes
Hispanics NH Whites African-Americans Asian
Check Prices on Mobile Device While Shopping- Total Sample -
Letters indicate statistically significant
difference (95% confidence)
Q19. When you are out shopping in-person, do you ever compare prices by checking online on your mobile device?
Base: All Respondents - Hispanics (614), NH Whites (309), African-Americans (304), Asians (312)
(A) (B) (C) (D)
Hispanics are likely to compare prices on their mobile device when they are
out shopping (Hispanic Millennials in particular). Non-Hispanic Whites are
the least likely to do this.
BC B
B
18-34 year olds = 74%
Bilinguals = 70%

51%45%
51%47%
44%50%
43% 50%
2% 2%3%
1%2% 2% 4% 2%
Hispanics NH Whites African-Americans Asians
29
Christmas Gift Shopping Mode
- Total Sample -
Letters indicate statistically significant
difference (95% confidence)
Q18C. If you are planning on buying gifts for Christmas this year, approximately what percentage of those gifts do you
think will be made online, in-person, by phone or by mail?
Base: All Respondents - Hispanics (614), NH Whites (309), African-Americans (304), Asians (312)
(A) (B) (C) (D)
C
Consumers who are buying Christmas gifts this year will be relying heavily on
the internet. Among Hispanics, close to half of all of their holiday purchases
will be done online.
In-Person
Online
C
Phone

30
Christmas Gift Shopping Preference- Hispanics -
Letters indicate statistically significant
difference (95% confidence)
Q18C. If you are planning on buying gifts for Christmas this year, approximately what percentage of those gifts do you think
will be made online, in-person, by phone or by mail?
Base: Hispanics - - Spanish Dom. (n=219), Bilingual (n=203), English Dom. (n=192)
55%47%
52%
40%47%
45%
2% 2%1%2% 3% 1%
Spanish Dom. Bilingual English Dom.
(J) (K) (L)
In-Person
Online
Phone
Bilingual Hispanics are the most likely to buy their holiday gifts online.

Key Findings

• Hispanics are heavy online shoppers. Nearly all buy products online at least
occasionally; one-third wish they could buy everything online.
• The heaviest Hispanic online shoppers are males, bilinguals and 18 to 34 year olds.
Households with $40K+ income are also heavier online consumers than those with
under $40K.
• A large share of Hispanic online shoppers (just over half) say they are buying more
online now compared to one year ago. This increase is being driven by Millennials.
• Hispanics spent an average of $1,437 on their online purchases in the past 12
months. This is lower than non-Hispanic Whites and relatively even with Asians.
• African-Americans are the least active online shoppers.
• Online shoppers are most likely to use their laptop computer when making
purchases. Hispanics use their mobile phone significantly more often compared to
the other segments.
Key Findings
32
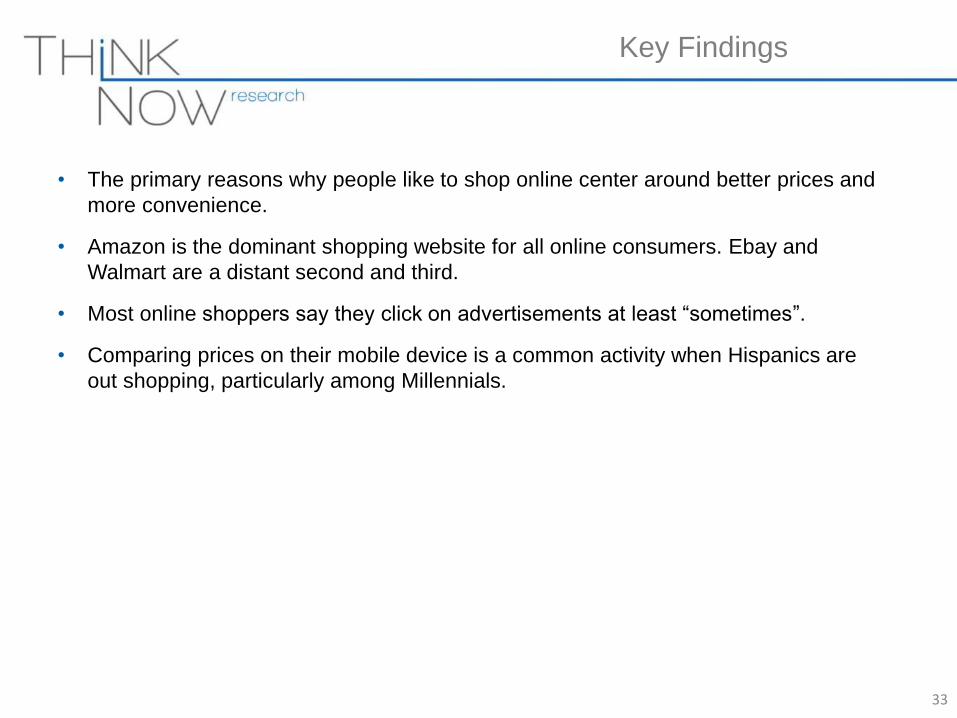
• The primary reasons why people like to shop online center around better prices and
more convenience.
• Amazon is the dominant shopping website for all online consumers. Ebay and
Walmart are a distant second and third.
• Most online shoppers say they click on advertisements at least “sometimes”.
• Comparing prices on their mobile device is a common activity when Hispanics are
out shopping, particularly among Millennials.
Key Findings
33

Appendix

Sample Profile
Hispanics
n=614
White
n=309
African-
American
n=304
Asian
n=312
Hispanics
n=614
White
n=309
African-
American
n=304
Asian
n=312
Gender U.S. Born
Male 51% 50% 48% 47% Born in the U.S. 65% 97% 96% 45%
Female 49% 50% 52% 53% Moved here 35% 3% 4% 55%
Average years living in
U.S.13.46 17.55 17.12 10.87
Age
18 to 34 47% 34% 41% 39% Household Income
35 to 64 54% 66% 58% 60% Less than $30,000 32% 21% 40% 14%
Mean age 37 42 39 39$30,000 to less than
$50,00021% 14% 18% 16%
$50,000 to less than
$70,00015% 16% 15% 14%
Census Region70,000 to less than
$100,00012% 15% 7% 13%
Northeast 14% 19% 17% 21% $100,000 or more 13% 28% 11% 36%
Midwest 9% 26% 17% 12% Median income ($000) $43 $64 $36 $75
South 37% 35% 57% 23%
West 40% 20% 9% 44%
35

Sample Profile
Hispanics
n=614
White
n=309
African-
American
n=304
Asian
n=312
Hispanics
n=614
White
n=309
African-
American
n=304
Asian
n=312
Marital Status Educational Attainment
Married 47% 53% 28% 51% Less than High School 8% 3% 7% 3%
Single 32% 24% 48% 34% High school graduate 26% 24% 27% 11%
Living with partner13% 10% 9% 5% Some College, but no
degree22% 25% 27% 13%
Separated/divorced 6% 11% 9% 5% Trade or technical school 4% 6% 7% 4%
Widowed2% 1% 3% 1% Graduated from 2-year
College7% 7% 13% 5%
Graduated from 4-5 year
College25% 26% 14% 41%
Average household size 3.4 3.0 2.7 3.0 Post Graduate Degree 8% 11% 5% 23%
Presence of Children Employment Status
No children <18 present 42% 53% 60% 64%Employed or self employed
(net)68% 65% 55% 63%
Any children <18 present 58% 47% 40% 36% Full-time Homemaker 9% 11% 8% 11%
Currently unemployed 10% 8% 14% 11%
Student, not employed 6% 1% 8% 7%
Unable to work/Disabled 3% 6% 8% 1%
Retired 4% 8% 6% 6%
36

Sample Profile
Hispanics
n=614
Language Spoken at Home
Spanish only 10%
Spanish mostly 22%
Spanish and English equally 36%
English mostly 16%
English only 16%
Country of Origin
Mexican/Mexican American 64%
Puerto Rican 11%
South American 10%
Cuban 5%
Central American 10%
Dominican 3%
Acculturation
Less Acculturated 19%
Bicultural 49%
More Acculturated 33%
37

38
Spanish Dom.(J)
Bilingual(K)
English Dom.
(L)
Airline tickets 62% 64% 67%
Music 55% 57% 56%
Books 53% 45% 40%
Tickets (movies, concerts, etc.) 48%L 50%L 38%
Home Electronics 37% 35% 33%
Sports Equipment 35%L 32%L 20%
Toys 32% 33% 35%
Magazines 32% 33% 30%
Flower arrangements 28% 34% 31%
Jewelry (including watches) 27% 32% 26%
Small Appliances 26% 28%L 18%
Vitamins/Supplements 26% 26% 25%
Home decorations/ accessories 25%L 24%L 13%
Shoes 24%L 25%L 16%
Fast food/Take-out (Pizza, etc.) 24% 24% 26%
Clothing 21% 26%L 15%
Large Appliances (washer, dryer,
refrigerator, etc.) 16% 20%L 12%
Medicine (Prescription or Off-the-shelf) 16% 14% 13%
Health & Beauty products 13% 23%KL 13%
Furniture 11% 9% 11%
Household Cleaning Supplies 11% 19%L 10%
Beer/Alcohol 8% 9% 6%
Grocery food items 4% 9% 6%
Q4. Which method do you prefer to use to buy each of the following types of products? - Over the Internet
Base: Category Purchasers (Varies by category)
Letters indicate statistically significant
difference (95% confidence)
Preferred Method for Purchasing Items - Online- Hispanics -


