BioOne sees sustainable scholarly publishing as an inherently collaborative enterprise connecting authors, nonprofit publishers, academic institutions, research libraries, and research funders in the common goal of maximizing access to critical research. Historical Changes in Stocking Densities on Texas Rangelands Author(s) :Bradford P. Wilcox, Michael G. Sorice, Jay Angerer, and Cynthia L. Wright Source: Rangeland Ecology & Management, 65(3):313-317. 2012. Published By: Society for Range Management DOI: http://dx.doi.org/10.2111/REM-D-11-00119.1 URL: http://www.bioone.org/doi/full/10.2111/REM-D-11-00119.1 BioOne (www.bioone.org ) is a nonprofit, online aggregation of core research in the biological, ecological, and environmental sciences. BioOne provides a sustainable online platform for over 170 journals and books published by nonprofit societies, associations, museums, institutions, and presses. Your use of this PDF, the BioOne Web site, and all posted and associated content indicates your acceptance of BioOne’s Terms of Use, available at www.bioone.org/page/terms_of_use . Usage of BioOne content is strictly limited to personal, educational, and non-commercial use. Commercial inquiries or rights and permissions requests should be directed to the individual publisher as copyright holder.
Transcript
BioOne sees sustainable scholarly publishing as an inherently collaborative enterprise connecting authors, nonprofit publishers, academic institutions, researchlibraries, and research funders in the common goal of maximizing access to critical research.
Historical Changes in Stocking Densities on Texas RangelandsAuthor(s) :Bradford P. Wilcox, Michael G. Sorice, Jay Angerer, and Cynthia L. WrightSource: Rangeland Ecology & Management, 65(3):313-317. 2012.Published By: Society for Range ManagementDOI: http://dx.doi.org/10.2111/REM-D-11-00119.1URL: http://www.bioone.org/doi/full/10.2111/REM-D-11-00119.1
BioOne (www.bioone.org) is a nonprofit, online aggregation of core research in the biological, ecological, andenvironmental sciences. BioOne provides a sustainable online platform for over 170 journals and books publishedby nonprofit societies, associations, museums, institutions, and presses.
Your use of this PDF, the BioOne Web site, and all posted and associated content indicates your acceptance ofBioOne’s Terms of Use, available at www.bioone.org/page/terms_of_use.
Usage of BioOne content is strictly limited to personal, educational, and non-commercial use. Commercial inquiriesor rights and permissions requests should be directed to the individual publisher as copyright holder.
Historical Changes in Stocking Densities on Texas RangelandsBradford P. Wilcox,1 Michael G. Sorice,2 Jay Angerer,3 and Cynthia L. Wright4
Authors are 1Professor and 4Undergraduate Research Assistant, Ecosystem Science and Management, Texas A&M University, College Station, TX 77843,USA; 2Assistant Professor, Department of Forest Resources & Environmental Conservation, Virginia Tech, Blacksburg, VA 24061, USA; and 3Assistant
Professor, Texas AgriLife Blackland Research and Extension Center, Temple, TX 76502, USA.
Abstract
Stocking density, both current and past, is a major determinant of the nature and condition of rangelands. Despite this fact,there have been few detailed examinations of historical trends in stocking density. We used data from the U.S. Census ofAgriculture to track the density of domestic livestock from the early 1900s to the present, for six rangeland regions in the Stateof Texas: (1) the Edwards Plateau; (2) the Trans-Pecos; (3) the Lampasas Cut Plain; (4) the South Texas Plains; (5) the RollingPlains; and (6) the High Plains. We find that stocking densities have declined across the state—ranging from a decline of about40% in some regions to as much as 75% in the Trans-Pecos and Edwards Plateau regions. The period of sharpest decline, whichbegan in the middle of the last century, reflects important, but not fully understood, socioeconomic changes. These most likelyinclude changing land ownership, fragmentation of land holdings, and increasing emphasis on wildlife conservation. Otherfactors potentially contributing to the destocking of Texas rangelands include woody plant encroachment and a rise inpredation. We argue that the dramatic reduction in stocking densities documented here has profound socioeconomic, ecological,and hydrological implications that need to be better understood.
Resumen
La densidad de carga en el paso y actual, es el principal determinante de la naturaleza y condicion del agostadero. Despues de estehecho, ha habido pocas revisiones de la tendencia historica y la densidad de carga en detalle. Usamos datos del Censo de Agriculturade los Estados Unidos para rastrear la densidad de animales domesticos desde inicios de los 1900s al presente, en seis regiones depastizales en el estado de Texas. (1) La Altiplanicie Edwards, (2) La Region de Trans-Pecos, (3) La Planicie de Lampasas, (4) LasPlanicies del Sur de Texas, (5) Las Planicies Onduladas y (6) Las Planicies Altas de Texas. Encontramos que las densidades de cargase han reducido a lo largo del estado – variando de una disminucion del 40% en algunas regiones hasta un 75% en las regionesTrans-Pecos y La Planicie Edwards. El periodo de mas reduccion que inicio a mediados del siglo pasado refleja cambiossocioeconomicos importantes que no estan bien comprendidos. Los mas probables son el cambio de propiedad, fragmentacion de latierra y el aumento en el interes de conservacion de la fauna. Otros factores que potencialmente contribuyen en la descarga de losagostaderos de Texas incluyen, la invasion de plantas lenosas y un aumento en los predadores. Discutimos que esta dramaticareduccion de la densidad de carga aquı documentada tiene profundas implicaciones socioeconomicas, ecologicas e hidrologicas querequieren ser entendidas.
Key Words: destocking, ecological, hydrological, land fragmentation, land ownership, socioeconomic trends, wildlifeconservation
INTRODUCTION
Within a given climatic and edaphic regime, rangelandcondition and health are strongly affected by the region’sdisturbance history—including grazing, fire, and brush control(Briske et al. 2005). Because disturbance related to grazing hasa particularly strong influence on range condition (Quirk 2002;Asner et al. 2004), the grazing history of a region provides animportant backdrop for evaluating its current state. Forexample, Holechek et al. (2001) examined trends in stockingdensities (the number of grazing animals per unit of land) forfederal lands in the western United States from 1960 to 2005,
and demonstrated that over that period stocking densitiesdeclined by more than 50%. They suggest that the generalreduction in stocking densities has led to a slow but progressiveimprovement in overall range condition. Surprisingly, for manyother rangelands in the United States, we know comparativelylittle about changes in stocking densities and whether patternsare similar in all regions.
Detailed inventories of animal numbers in Texas began to becompiled at the county level in the late 1800s, and these datahave been used to construct trends in stocking densities for someregions—notably the Edwards Plateau (Smeins et al. 1997;Walker et al. 2005; Wilcox et al. 2008)—but no detailedregional comparison of stocking densities on Texas rangelandshas yet been done. In this article, we report on our evaluationand comparison of historical stocking densities for the majorrangeland ecoregions within Texas. Stocking densities in theEdwards Plateau region have declined quite dramatically, andour research question was whether similar declines in stocking
This research was supported by USDA-NIFA, Managed Ecosystem Grant No. 2010-85101-20485
and USDA-NIFA, CEAP Grant No 2008-51130-19562. Correspondence:
Manuscript received 3 July 2011; manuscript accepted 30 December 2011.
Correspondence: Dr Bradford Wilcox, Ecosystem Science and Management, Texas A&M
University, College Station, TX 77843, USA. Email: [email protected]
Rangeland Ecol Manage 65:313–317 | May 2012 | DOI: 10.2111/REM-D-11-00119.1
RANGELAND ECOLOGY & MANAGEMENT 65(3) May 2012 313
densities have occurred in other regions of Texas. The purpose ofthis exploratory investigation is not only to determine the extentto which stocking densities have changed across this region, butalso to formulate some hypotheses for future research: what maybe driving the change, and what larger-scale effects the changemight have on the ecosystem services these rangelands provide.
MATERIALS AND METHODS
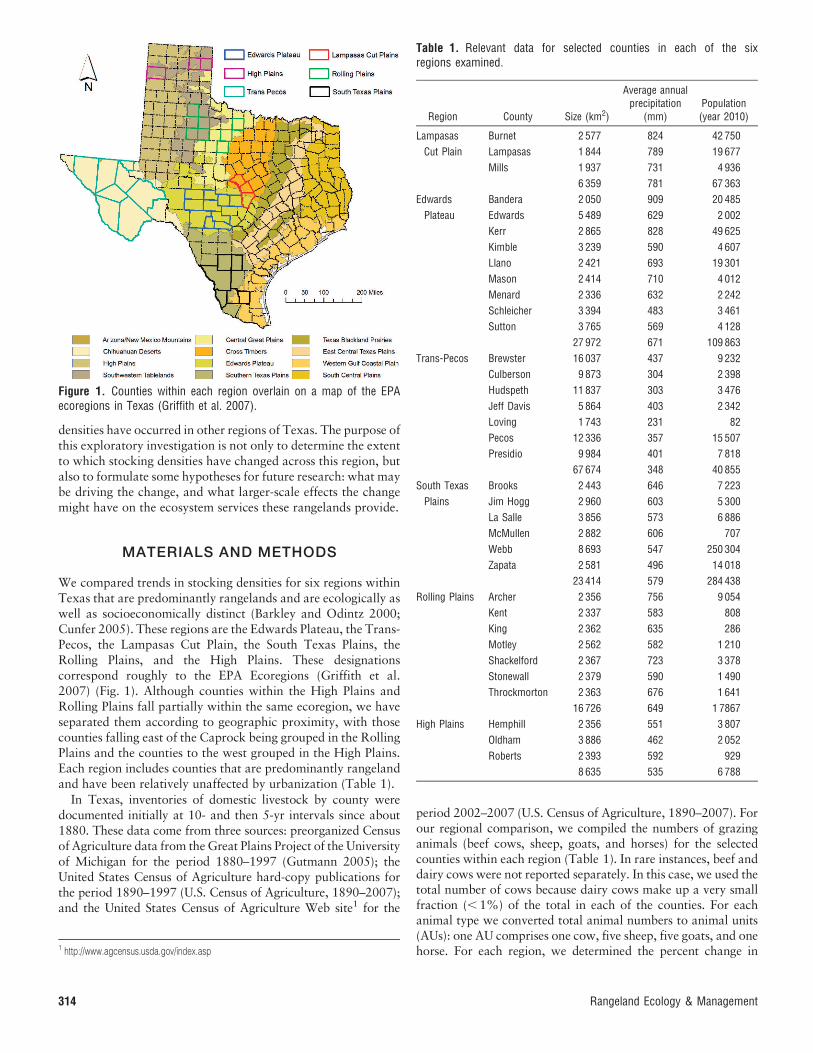
We compared trends in stocking densities for six regions withinTexas that are predominantly rangelands and are ecologically aswell as socioeconomically distinct (Barkley and Odintz 2000;Cunfer 2005). These regions are the Edwards Plateau, the Trans-Pecos, the Lampasas Cut Plain, the South Texas Plains, theRolling Plains, and the High Plains. These designationscorrespond roughly to the EPA Ecoregions (Griffith et al.2007) (Fig. 1). Although counties within the High Plains andRolling Plains fall partially within the same ecoregion, we haveseparated them according to geographic proximity, with thosecounties falling east of the Caprock being grouped in the RollingPlains and the counties to the west grouped in the High Plains.Each region includes counties that are predominantly rangelandand have been relatively unaffected by urbanization (Table 1).
In Texas, inventories of domestic livestock by county weredocumented initially at 10- and then 5-yr intervals since about1880. These data come from three sources: preorganized Censusof Agriculture data from the Great Plains Project of the Universityof Michigan for the period 1880–1997 (Gutmann 2005); theUnited States Census of Agriculture hard-copy publications forthe period 1890–1997 (U.S. Census of Agriculture, 1890–2007);and the United States Census of Agriculture Web site1 for the
period 2002–2007 (U.S. Census of Agriculture, 1890–2007). Forour regional comparison, we compiled the numbers of grazinganimals (beef cows, sheep, goats, and horses) for the selectedcounties within each region (Table 1). In rare instances, beef anddairy cows were not reported separately. In this case, we used thetotal number of cows because dairy cows make up a very smallfraction (, 1%) of the total in each of the counties. For eachanimal type we converted total animal numbers to animal units(AUs): one AU comprises one cow, five sheep, five goats, and onehorse. For each region, we determined the percent change in
Figure 1. Counties within each region overlain on a map of the EPAecoregions in Texas (Griffith et al. 2007).
Table 1. Relevant data for selected counties in each of the sixregions examined.
Region County Size (km2)
Average annualprecipitation
(mm)Population(year 2010)
Lampasas
Cut Plain
Burnet 2 577 824 42 750
Lampasas 1 844 789 19 677
Mills 1 937 731 4 936
6 359 781 67 363
Edwards
Plateau
Bandera 2 050 909 20 485
Edwards 5 489 629 2 002
Kerr 2 865 828 49 625
Kimble 3 239 590 4 607
Llano 2 421 693 19 301
Mason 2 414 710 4 012
Menard 2 336 632 2 242
Schleicher 3 394 483 3 461
Sutton 3 765 569 4 128
27 972 671 109 863
Trans-Pecos Brewster 16 037 437 9 232
Culberson 9 873 304 2 398
Hudspeth 11 837 303 3 476
Jeff Davis 5 864 403 2 342
Loving 1 743 231 82
Pecos 12 336 357 15 507
Presidio 9 984 401 7 818
67 674 348 40 855
South Texas
Plains
Brooks 2 443 646 7 223
Jim Hogg 2 960 603 5 300
La Salle 3 856 573 6 886
McMullen 2 882 606 707
Webb 8 693 547 250 304
Zapata 2 581 496 14 018
23 414 579 284 438
Rolling Plains Archer 2 356 756 9 054
Kent 2 337 583 808
King 2 362 635 286
Motley 2 562 582 1 210
Shackelford 2 367 723 3 378
Stonewall 2 379 590 1 490
Throckmorton 2 363 676 1 641
16 726 649 1 7867
High Plains Hemphill 2 356 551 3 807
Oldham 3 886 462 2 052
Roberts 2 393 592 929
8 635 535 6 788
1 http://www.agcensus.usda.gov/index.asp
314 Rangeland Ecology & Management
stocking density as the difference between the peak density andthe most recent year for which census data were available.
RESULTS
Edwards PlateauThe number of animal units on the Edwards Plateau peaked in1930 and again in 1945, with a slight dip in between, perhapsdue to the drought of the 1930s (Fig. 2a). Since 1945, animalunits have declined by about 70%, largely accounted for by adramatic decline in the number of sheep and goats. Today somegoats remain, but very few sheep. Cattle numbers initiallyincreased slightly, partially compensating for the drop in sheepand goats, but have declined by about 30% since the 1970s.
Trans-PecosTrends and patterns in the Trans-Pecos are similar to those seenin the Edwards Plateau (Fig. 2b). Grazing pressure was greatestaround 1940; since that time, the number of AUs has decreasedby 75%. Sheep and goats, introduced into the area in the
1920s, increased rapidly in numbers until around 1940, thenbegan to decline and today have practically disappeared. Thenumber of cattle has declined by about 40% since the 1970s.
Lampasas Cut PlainStocking densities in the Lampasas Cut Plain are similar tothose of the Edwards Plateau and Trans-Pecos regions (Fig. 2c).The main difference is that cattle numbers increased more inresponse to the drop in sheep and goats. Even so, the totalstocking level is about 40% lower than its 1945 peak.
South Texas PlainsThe pattern in South Texas is different from those of the other fiveregions (Fig. 2d). Sheep and goats have never been an importantcomponent. Cattle numbers increased continually until about1974, and since that time have declined by about 50%.
Rolling PlainsStocking densities in this region were greatest in the early 1900sand, following a sharp decline of around 50%, stabilized in the1930s. They have remained relatively unchanged since that
Figure 2. Historical trends in grazing intensity by domestic animals (beef cows, sheep, goats, horses) compiled from the U.S. Census ofAgriculture. Data for sheep and goats were missing in 1969 and 1974 for many counties. For those years, data were filled in by assuming a linear fitbetween the years (1964 and 1979) for which data existed (the data points extrapolated in this way are highlighted in red).
65(3) May 2012 315
time, except for some slight drops during the droughts of the1930s and 1950s (Fig. 2e). This is the only region in whichanimal numbers were greatest during the early 1900s.
High PlainsStocking densities in this region peaked in 1935, then declinedsharply in the 1940s (Fig. 2f). However, unlike the otherregions, stocking densities have been relatively stable from the1960s to the present—at about 60% below their peak.
DISCUSSION
In all six regions examined, stocking densities have declined fromtheir early or mid-20th century highs. In four of them—theEdwards Plateau, the Trans-Pecos, the Lampasas Cut Plain, andthe South Texas Plains—those declines are continuing. In theother two—the Rolling Plains, and the High Plains—stockingdensities have remained relatively stable for at least the past 35 yr.
Interestingly, the peak period of grazing was not consistentacross regions. For three of the regions (Edwards Plateau,Lampasas Cut Plain, and Trans-Pecos), the period of greateststocking densities was 1935–1945—accounted for by increases insheep and goats. In the High Plains, although livestock numberspeaked around the same time, the increase was short-lived and didnot consist mainly of sheep and goats. In the South Texas Plains,stocking densities increased gradually to a peak in 1974, possibly aresult of the development and expansion of improved pastures withintroduced species such as buffelgrass (Cenchrus ciliaris) (Hanselka1988). Finally, in the Rolling Plains—unlike the other regions—themidcentury peak in animal numbers was attenuated and thegreatest stocking densities are recorded for the early part of the1900s. It is possible that this difference is an artifact of poor recordkeeping for the other regions during the early 1900s and that thereare in fact more animals in all of the regions during this time thanreflected in the census data. The attenuated midcentury peak in theRolling Plains may be attributable to other factors, such as gains inincome from other sources in this region: cultivated agriculture,beginning around 1910, and oil production, beginning in the 1940s(Texas State Historical Association, http://www.tshaonline.org).
The overall decline in stocking density that we have trackedin the historical records is consistent with the declinedocumented for western rangelands by Holecheck et al.(2001). We believe that the dramatic decline seen in the past40–70 yr across most Texas rangelands has profoundecological as well as socioeconomic implications. Further,more detailed research is needed to identify and understandthese implications, as well as the ecological and/or socioeco-nomic drivers that led to the overall decline in stockingdensities. Below we explore some of the potential drivers aswell as consequences of changing stocking densities.
Potential Drivers of Declining Stocking DensityThe major drivers of change are probably not universal acrossall regions. Each region is different in terms of factors thataffect stocking density, such as settlement patterns, land tenure,and the relative importance of wildlife.
In the Edwards Plateau, the Lampasas Cut Plain, and theTrans-Pecos, much of the decline in stocking density is related
to the sharp decrease in the number of sheep and goats. Thisdecrease is consistent with national patterns (Jones 2004).Sheep and goat numbers peaked in the 1940s, when wool wasseen as a strategic commodity. Price supports for wool andmohair were put in place by the federal government in 1938,but were phased out in the 1990s (Canada 2008). Demand forwool also fell because of the development of synthetic fibersand competition from abroad. Other factors, such as increasedpredation and higher labor costs, may also have played a role.
A second factor that certainly comes into play is theincreasing importance that landowners ascribe to wildlife, bothas a source of income and for their inherent and intrinsic value(Haggerty and Travis 2006). This is particularly true in theSouth Texas Plains, where landowners’ income from wildlifecan equal or exceed that from other sources (McBryde 1998;Fulbright and Bryant 2002).
Another factor is that the nature of land ownership haschanged. Landowners are less dependent on their land as aprimary source of income than in the past. In addition, landvalues have been rising, the older population of ranchers is notbeing replaced by younger ones (especially with the profitabil-ity of ranching on the decline), and many urban and suburbanresidents are buying rural properties for the lifestyle experience(Olenick et al. 2005; Kjelland et al. 2007; Sheridan 2007). Inother words, recent decades have seen a shift in land-ownershipmotivation: the predominant focus on agricultural productionis giving way to a so-called amenity focus—valuing the rurallifestyle, the close proximity to nature and wildlife, and privaterecreation opportunities (Haggerty and Travis 2006; Johnson2008; Gosnell and Abrams 2009). Additional factors possiblycontributing to the decline in stocking densities are therelatively high costs for replacement cattle and the increasedproductivity per animal unit, which enables feedlots tomaintain productivity with fewer animals (USDA–NationalAgricultural Statistics Service 2010).
Finally, woody plant encroachment may be contributing to thedecline in stocking densities (Smeins et al. 1997). Woodlands areexpanding across Texas (Archer et al. 2001; Asner et al. 2003;Wilcox et al. 2008), and such expansion translates to lowerforage production in general (Archer et al. 2011).
Potential Implications for Ecosystem ServicesFor most rangelands, the type and abundance of vegetationcover is strongly affected by the extent to which it is grazed(Holechek et al. 2001). In general, range condition is negativelycorrelated with stocking density. It is very likely that the overalldecline in stocking density has contributed to an increase invegetation cover on rangelands (which certainly is the case,compared with conditions of the early and mid last century). Weargue that the decline in stocking densities along with theincrease in woody plants has given rise to a landscape with muchmore vegetation cover, biomass, and diversity than in the firsthalf of the last century. Some of these changes are reasonablywell documented and others are not. All of them need to bebetter quantified, but clearly they significantly affect bothecosystem functioning and the ecological services provided byrangelands.
On a regional scale, the increased vegetation cover mostcertainly translates into enhanced ecosystem services, includingboth hydrological services (protection from erosion, reduction in
316 Rangeland Ecology & Management
flooding, greater groundwater recharge, and better waterquality) and ecological services (more biodiversity, carbonsequestration, wildlife habitat, viewsheds, etc.). Althoughadditional research is needed to quantify better how changes inanimal numbers have altered rangeland ecosystems, some ofthese linkages are reasonably well established. For example,recent studies have documented a number of regional-scalehydrological changes that have occurred, including a reductionin flooding (Wilcox et al. 2008), increases in spring flow (Wilcoxand Huang 2010), and decreases in erosion (Dunbar et al. 2010).Furthermore, a significant body of work has established thepositive relationship between vegetation biomass and carbonsequestration, as well as the general benefit to wildlife andspecies diversity with increasing vegetation (Archer et al. 2011).Greater vegetation biomass also means higher fuel loads, whichare likely contributing to the unprecedented increase in the sizeand frequency of large-scale wildfires on Texas rangelands, suchas those witnessed in the spring of 2011.
MANAGEMENT IMPLICATIONS
Stocking densities have declined across rangelands in Texas, andare continuing to decline in a great many of them. The numbers ofsheep and goats have seen the most dramatic decline. We suggestthat this overall decline has been driven by a variety ofsocioeconomic factors, such as changing land ownership andthe increasing importance of wildlife conservation, but theserelationships need to be evaluated in more detail. The ensuingcombination of reduced grazing pressure and woody plantencroachment most certainly have given rise to greater vegetationcover and biomass compared with conditions during the first halfof the last century. Although the effects of these changes are notfully understood, they clearly are important—including increasedrisk of large fires, increases in carbon sequestration, improvedhydrological conditions, and in many cases improved habitat forwildlife. We argue, therefore, that these changes have profoundimplications for managers and policy makers, including the needfor regional-scale fire management programs and reassessment ofthe ecosystem services provided by rangelands.
ACKNOWLEDGMENTS
We are grateful to John Walker, Charles (Butch) Taylor, Richard Conner,
and Mort Kothman, all of whom provided helpful input.
LITERATURE CITED
ARCHER, S., T. W. BOUTTON, AND K. A. HIBBARD. 2001. Trees in grasslands: biogeochemicalconsequences of woody plant expansion. In: E. D. Schulze, S. P. Harrison, M.Heimann, E. A. Holland, J. Lloyd, I. C. Prentice, D. Schimel [EDS.]. Globalbiogeochemical cycles in the climate system. Durham, NC, USA: Academic Press.p. 115–138.
ARCHER, S., K. W. DAVIES, T. E. FULBRIGHT, K. C. MCDANIEL, B. P. WILCOX, AND
K. I. PREDICK. 2011. Brush management as a rangeland conservation tool: acritical evaluation. In: D. D. Briske [ED.]. Conservation effects assessmentproject. Washington, DC: USDA-NRCS.
ASNER, G. P., S. ARCHER, R. F. HUGHES, R. J. ANSLEY, AND C. A. WESSMAN. 2003. Netchanges in regional woody vegetation cover and carbon storage in TexasDrylands, 1937–1999. Global Change Biology 9:316–335.
ASNER, G. P., A. J. ELMORE, L. P. OLANDER, R. E. MARTIN, AND A. T. HARRIS. 2004.Grazing systems, ecosystem responses, and global change. Annual Review ofEnvironment and Resources 29:261–299.
BARKLEY, R. R. AND M. F. ODINTZ [EDS.]. 2000. The portable handbook of Texas.Austin, TX, USA: Texas State Historical Association. 1072 p.
BRISKE, D. D., S. D. FUHLENDORF, AND F. E. SMEINS. 2005. State-and-transition models,thresholds, and rangeland health: a synthesis of ecological concepts andperspectives. Rangeland Ecology & Management 58:1–10.
CANADA, C. 2008. Wool and mohair price support. CRS Report to Congress:Washington, DC.
CUNFER, G. A. 2005. On the Great Plains: agriculture and environment. CollegeStation, TX, USA: Texas A&M University Press.
DUNBAR, J. A., P. M. ALLEN, AND S. J. BENNETT. 2010. Effect of multiyear drought onupland sediment yield and subsequent impacts on flood control reservoirstorage. Water Resources Research 46:W05526. doi:10.1029/2008WR007519
FULBRIGHT, T. E., AND F. C. BRYANT. 2002. The last great habitat. Kingsville, TX, USA:Caesar Kleberg Wildlife Research Institute.
GOSNELL, H., AND J. ABRAMS. 2011. Amenity migration: diverse conceptualizations ofdrivers, socioeconomic dimensions, and emerging challenges. GeoJournal76:303–322.
GRIFFITH, G., S. BRYCE, J. OMERNIK, AND A. ROGERS. 2007. Ecoregions of Texas. Austin,TX, USA: Texas Commission on Environmental Quality. 125 p.
GUTMANN, M. P. 2005. Great Plains Population and Enviroment Data: Socialand Demographic Data, 1870–2000. Ann Arbor, MI, USA: Inter-universityConsortium for Political and Social Research, University of Michigan.
HAGGERTY, J. H., AND W. R. TRAVIS. 2006. Out of administrative control: absenteeowners, resident elk and the shifting nature of wildlife management insouthwestern Montana. Geoforum 37:816–830.
HANSELKA, C. W. 1988. Buffelgrass–South Texas wonder grass. Rangelands 10:279–281.
HOLECHEK, J. L., R. D. PIEPER, AND C. H. HERBEL. 2001. Range management: Principlesand practices. Upper Saddle River, NJ, USA: Prentice Hall.
JOHNSON, B. E. 2008. Nature, affordability, and privacy as motivations for exurbanliving. Urban Geography 29:705–723.
JONES, K. G. 2004. Trends in the U.S. sheep industry. Washington, DC, USA: USDAEconomic Research Service.
KJELLAND, M. E., U. P. KREUTER, G. A. CLENDENIN, R. N. WILKINS, X. BEN WU,E. G. AFANADOR, AND W. E. GRANT. 2007. Factors related to spatial patterns ofrural land fragmentation in Texas. Environmental Management 40:231–244.
MCBRYDE, G. 1998. Effects of range management on the lower Rio Grandewatershed. Journal of Arid Environments 40:217–233.
OLENICK, K. L., U. P. KREUTER, AND J. R. CONNER. 2005. Texas landowner perceptionsregarding ecosystem services and cost-sharing land management programs.Ecological Economics 53:247–260.
QUIRK, M. 2002. Managing grazing. In: A. C. Grice and K. C. Hodgkinson [EDS.].Global rangelands: progress and prospects. New York, NY, USA: CABIPublishing. p. 131–146.
SHERIDAN, T. E. 2007. Embattled ranchers, endangered species, and urban sprawl:the political ecology of the new American West. Annual Review ofAnthropology 36:121–138.
SMEINS, F. E., S. D. FUHLENDORF, AND C. A. TAYLOR. 1997. Environmental and land usechanges: a long-term perspective. In: J. Ansley [ED.]. Juniper symposium. SanAngelo, TX, USA: Texas A&M University. p. 3–21.
USDA–NATIONAL AGRICULTURAL STATISTICS SERVICE. 2010. Overview of the United Statescattle industry. Available at: http://usda.mannlib.cornell.edu/usda/current/USCatSup/USCatSup-12-17-2010.pdf. 15 p.
WALKER, J. W., J. L. JOHNSON, AND C. A. TAYLOR, JR. 2005. Challenges andopportunities for sustainable rangeland pastoral systems. In: J. A. Milne [ED.].Pastoral systems in marginal environments. Wageningen, The Netherlands:Wageningen Academic Publishers.
WILCOX, B. P., AND Y. HUANG. 2010. Woody plant encroachment paradox: riversrebound as degraded grasslands convert to woodlands. Geophysical ResearchLetters 37:L07402. doi:10.1029/2009GL041929
WILCOX, B. P., Y. HUANG, AND J. W. WALKER. 2008. Long-term trends in streamflowfrom semiarid rangelands: uncovering drivers of change. Global ChangeBiology 14:1676–1689.