This article was downloaded by: [S. Naranan] On: 21 November 2011, At: 22:45 Publisher: Routledge Informa Ltd Registered in England and Wales Registered Number: 1072954 Registered office: Mortimer House, 37-41 Mortimer Street, London W1T 3JH, UK Journal of Quantitative Linguistics Publication details, including instructions for authors and subscription information: http://www.tandfonline.com/loi/njql20 Historical Linguistics and Evolutionary Genetics. Based on Symbol Frequencies in Tamil Texts and DNA Sequences S. Naranan a a Chennai, India Available online: 17 Nov 2011 To cite this article: S. Naranan (2011): Historical Linguistics and Evolutionary Genetics. Based on Symbol Frequencies in Tamil Texts and DNA Sequences, Journal of Quantitative Linguistics, 18:4, 359-380 To link to this article: http://dx.doi.org/10.1080/09296174.2011.608607 PLEASE SCROLL DOWN FOR ARTICLE Full terms and conditions of use: http://www.tandfonline.com/page/terms-and- conditions This article may be used for research, teaching, and private study purposes. Any substantial or systematic reproduction, redistribution, reselling, loan, sub- licensing, systematic supply, or distribution in any form to anyone is expressly forbidden. The publisher does not give any warranty express or implied or make any representation that the contents will be complete or accurate or up to date. The accuracy of any instructions, formulae, and drug doses should be independently verified with primary sources. The publisher shall not be liable for any loss, actions, claims, proceedings, demand, or costs or damages whatsoever or howsoever caused arising directly or indirectly in connection with or arising out of the use of this material.
Transcript
This article was downloaded by [S Naranan]On 21 November 2011 At 2245Publisher RoutledgeInforma Ltd Registered in England and Wales Registered Number 1072954Registered office Mortimer House 37-41 Mortimer Street London W1T 3JH UK
Journal of Quantitative LinguisticsPublication details including instructions for authors andsubscription informationhttpwwwtandfonlinecomloinjql20
Historical Linguistics andEvolutionary Genetics Based onSymbol Frequencies in Tamil Textsand DNA SequencesS Naranan aa Chennai India
Available online 17 Nov 2011
To cite this article S Naranan (2011) Historical Linguistics and Evolutionary GeneticsBased on Symbol Frequencies in Tamil Texts and DNA Sequences Journal of QuantitativeLinguistics 184 359-380
To link to this article httpdxdoiorg101080092961742011608607
PLEASE SCROLL DOWN FOR ARTICLE
Full terms and conditions of use httpwwwtandfonlinecompageterms-and-conditions
This article may be used for research teaching and private study purposesAny substantial or systematic reproduction redistribution reselling loan sub-licensing systematic supply or distribution in any form to anyone is expresslyforbidden
The publisher does not give any warranty express or implied or make anyrepresentation that the contents will be complete or accurate or up to date Theaccuracy of any instructions formulae and drug doses should be independentlyverified with primary sources The publisher shall not be liable for any lossactions claims proceedings demand or costs or damages whatsoever orhowsoever caused arising directly or indirectly in connection with or arising outof the use of this material
Historical Linguistics and Evolutionary Genetics Basedon Symbol Frequencies in Tamil Texts and DNASequences
S NarananChennai India
ABSTRACT
We have studied the rank frequency distribution (RFD) of letters of the alphabet inTamil language texts In a novel application of rank frequencies we have defined asimple intuitive distance parameter between a pair of strings (text or DNA sequence ofcodons) This distance correlates well with age difference in historical linguistics andevolutionary genetics Using a distance matrix of a set of strings we derive evolutionarytrees that are broadly in agreement with historical evidence The method has potentialfor refinement and application in evolutionary studies to complement other approachesto evolution The RFD in a single string conforms to a law called the CMPL(Cumulative Modified Power Law) which we had formulated and applied to RFDrsquos ofdiverse symbol sets
1 INTRODUCTION
We consider two different kinds of strings of symbols language textsand DNA sequences A language text consists of N symbols calledlsquolsquotokensrsquorsquo chosen from a set of V symbols called lsquolsquotypesrsquorsquo For writtentext the symbols are the letters of the alphabet For speech thesymbols are phonemes that are the smallest units of speech String sizeor the number of word tokens is variable but the symbol set V is
Address correspondence to S Naranan 20A3 Second Cross Street JayaramnagarThiruvanmiyur Chennai 600-041 India Email snaranangmailcom
Journal of Quantitative Linguistics2011 Volume 18 Number 4 pp 337ndash358httpdxdoiorg101080092961742011608607
0929-61741118040337 2011 Taylor amp Francis
Dow
nloa
ded
by [
S N
aran
an]
at 2
245
21
Nov
embe
r 20
11
constant for all the strings DNA molecules the genetic material oflife are ndash at the most fundamental level ndash sequences of lsquolsquobasesrsquorsquo whichbelong to a set of four base molecules represented as A G C TActual genetic information is however coded as triplet bases (AGCGTC etc) known as codons The 64 possible codons form thelsquolsquoalphabetrsquorsquo of DNA sequencesFor a given string of size N with V different symbols the relative
frequency of occurrence of the V symbols is a very valuable source ofinformation The statistical function that describes them has beenexplored extensively But in this paper we focus our attention on a pairof strings and define a measure of their lsquolsquoseparationrsquorsquo or lsquolsquodistance apartrsquorsquoin terms of the differences in probability of a symbol in the two strings ofthe pair This distance measure is expected to correlate positively with thechronological age difference in the evolutionary history of the stringsThis idea was first tested for DNA molecules with an evolutionary timespan of a few billion years Relative codon frequencies were examined in20 different species spanning this period and a positive correlation wasseen between the lsquolsquodistancersquorsquo and the difference in the evolutionary age ofthe two speciesA similar examination of evolutionary history in the literary texts of a
language is possible using the relative letter frequencies of the alphabet ina pair of texts The distance measure in this case can be expected tocorrelate with the chronological age difference of the texts For applyingthis new tool for lsquolsquohistorical linguisticsrsquorsquo one needs literary texts spanninga long period The most suitable language for this effort is Tamil whichhas an almost uninterrupted record of literary works spread over the last2500 years Tamil is perhaps the only language which has its basicstructure relatively stable over such a long period We use data fromseven Tamil literary texts (Sections 3 4) There is significant agreementbetween the historical ages (which are somewhat uncertain) and thedistance measures It is interesting that the two types of strings we haveconsidered ndash DNA sequences and language texts ndash have time scalesdiffering by a factor of over 1000 (billions of years vs thousands ofyears) Yet the proposed tool of lsquolsquodistancersquorsquo measure promises to be ofsignificant value in both casesThe relative probability of letter frequencies in a single text is also
examined (Section 5) In Section 6 the entropies of Tamil texts as definedby Shannonrsquos Information Theory are discussed We conclude with adiscussion and summary of the results
338 S NARANAN
Dow
nloa
ded
by [
S N
aran
an]
at 2
245
21
Nov
embe
r 20
11
2 TAMIL LANGUAGE ALPHABET TEXTS AND LETTERFREQUENCIES
Tamil is one of the oldest living languages and is spoken by over 80million people spread over 40 countries It is mainly spoken in SouthIndia and is one of the 22 scheduled languages of the Indian constitutionIt belongs to the Dravidian family of 22 languages which are distinctfrom the Indo-European Languages The four languages TamilMalayalam Kannada and Telugu have literary histories The earliestepigraphic records of Tamil date back to 300 BCE making it one of theoldest languages in the world The earliest surviving literature is also inTamil dating to pre-Christian Era the highly acclaimed Tholkappiyamand the Sangam literature are attributed to the period 300 BCEndash300 CEThere is an uninterrupted record of Tamil literature spread over the last2500 years lsquolsquoTamil is perhaps the only example of an ancient classicaltongue which has survived as a spoken language for more than 2500years with its basic structure almost unchangedrsquorsquo (EncyclopaediaBritannica 1973 edition) In recognition of its antiquity the Governmentof India declared Tamil a lsquolsquoclassical languagersquorsquo in 2004 The TamilDiaspora is worldwide and Tamil websites on the Internet are growing inpopularity The Government of the State of Tamil Nadu organized aWorld Classical Tamil Conference in June 2010 lasting five days and ona mammoth scale to highlight classical as well as modern aspects ofTamil For details see reference at the end Tamil is perhaps the onlyclassical language which is still spoken extensively unlike the otherclassical languages such as Sanskrit and LatinThe Tamil alphabet consists of 30 letters 12 vowels and 18 consonants
The vowels are listed first followed by consonants in Table 1 column 2The number of vowel-consonants is 216 each is regarded as a syllable oftwo letters a consonant and a vowel The consonants lsquolsquol rsquorsquo lsquolsquonrsquorsquo lsquolsquotrsquorsquo(pronounced lsquolsquozhrsquorsquo lsquolsquonrsquorsquo lsquolsquorrsquorsquo) unique in Tamil are not represented fully inother Dravidian and Indian (Indic Sanskritic) languages Modern Tamilhas six more letters the Grantha characters borrowed from Sanskrit (j ss h ks srı) Tamil alphabet is the most compact among the Dravidianlanguages with only 30 letters since it excludes separate characters forclosely related aspirated and unaspirated sounds eg the character lsquolsquokrsquorsquorepresents also lsquolsquokhrsquorsquo lsquolsquogrsquorsquo and lsquolsquoghrsquorsquo which occur in Sanskrit loanwordsThe authorrsquos father had acquired a Tamil typewriter (Bijou) made by
a German company in 1937 The company had claimed it could
HISTORICAL LINGUISTICS AND EVOLUTIONARY GENETICS 339
Dow
nloa
ded
by [
S N
aran
an]
at 2
245
21
Nov
embe
r 20
11
Table
1Relativefrequencies
oflettersin
seven
Tamiltexts
SER
no
Translation
inEnglish
12
34
56
72ndash7
1ndash7
Huffmancode
MOD
BHR
KUK
KYK
SLP
TKL
TLK
POE
TAM
TAM
1a
150
129
156
145
142
126
139
837
987
010
2a
47
43
47
43
35
60
29
257
304
1110
3I
78
75
71
69
68
64
83
430
508
0011
4I
47
65
77
335
39
1100001
5u
77
70
58
72
73
74
87
434
511
0010
6u
43
66
65
531
35
11000000
7e
17
22
20
23
22
24
19
130
147
11111
8e
13
20
12
11
11
11
14
79
92
110001
9ai
27
32
28
23
29
30
29
171
198
10100
10
o10
13
912
13
13
14
74
84
111100
11
o
712
11
11
12
99
64
71
111101
12
au
00
00
00
00
0110000011
13
k79
49
63
58
67
71
56
364
443
1001
14
ng
65
99
11
79
50
56
1100000
15
c22
24
19
17
18
21
16
115
137
000110
16
nj
13
42
34
521
22
110000010
17
t36
25
25
27
32
25
25
159
195
10101
18
n
11
16
16
16
15
20
15
98
109
100010
19
th71
73
65
68
63
57
61
387
458
0111
20
nh
21
27
22
22
24
26
20
141
162
11001
21
p44
40
33
33
39
42
49
236
280
00001
22
m42
57
48
44
44
45
47
285
327
1101
23
y29
36
35
36
38
34
38
217
246
01100
24
r45
38
40
47
46
39
39
249
294
00000
25
l31
36
34
32
33
35
33
203
234
10000
26
v35
42
41
39
38
35
44
239
274
00010
(continued)
340 S NARANAN
Dow
nloa
ded
by [
S N
aran
an]
at 2
245
21
Nov
embe
r 20
11
Table
1(C
ontinued)
SER
no
Translation
inEnglish
12
34
56
72ndash7
1ndash7
Huffmancode
MOD
BHR
KUK
KYK
SLP
TKL
TLK
POE
TAM
TAM
27
l-7
10
99
12
816
64
71
0001110
28
l21
16
12
16
12
12
12
80
101
100011
29
t27
24
32
36
36
43
41
212
239
01101
30
n38
53
68
68
51
53
44
337
375
1011
Total
1000
1000
999
999
1000
1000
1001
5999
6999
NTOT
22855
5056
16283
11855
4165
6355
12430
56144
78999
1MODModernProse
(1946ndash57)
2BHRBharathi
3KUKKambaRamayanam
(Uthara
Kandam)
4KYK
KambaRamayanam
(YuddhaKandam)
5SLPSilappathigaram
6TKLThirukkural
7TLKTholkappiyam
(Porulathikaram)
2ndash7POETexts
nos2ndash71ndash7TAMAllTamiltexts
(bold)
Thefrequencies
are
per
thousandTheirlsquolsquoTotalrsquorsquodoes
notaddupto
1000dueto
round-offerrorsNTOTisthenumber
oftokensin
each
text
Column2Transliteratedlettersin
English
HISTORICAL LINGUISTICS AND EVOLUTIONARY GENETICS 341
Dow
nloa
ded
by [
S N
aran
an]
at 2
245
21
Nov
embe
r 20
11
manufacture typewriters in any language with an alphabet that could fitinto a standard English keyboard Tamil was the only Indian languagefor which this was possible because of its compact alphabet Lessons weredevised to type in Tamil in blind touch at age 13 The typewriter is still avalued possession The keyboard design has some novel ingeniousfeaturesThis article is based on data on Tamil letter frequencies for seven
Tamil texts given by Gift Siromoney (1963) The data are reproduced inTable 1 In column 2 the English transliterations of the Tamil lettersadopted by Siromoney are given they mostly conform to theInternational Phonetic Alphabet (IPA) code Samples were taken fromTamil poetry from six different works belonging to periods ranging fromthe beginning of the Christian Era to the modern periodAs the dates of these works cannot be fixed with any certainty the
(accepted) order in which they were written is followed Tholkappiyam(Porul athigaram) is the oldest and Bharathi is the most recent Modernprose is a sample of over 20000 letters from the prose works published inMadras State in 1946ndash1947 The seven texts are given in Table 1 Allexcept the first are poetical works The last five are ancient texts rangingfrom approximately third century to 12th century CE BHR is early 20thcentury and MOD is from mid-20th century The relative frequencies ofletters in a text are given in Table 1 (cols 3 to 9) as number of occurrencesper 1000 The total number of letters (N) in the sample text (letter tokens)is given in the last row (Siromoney 1963) Whereas the ancient textscontain only 30 letters the modern texts have in addition six Granthacharacters which are ignored in the countingFrom the seven texts we have cumulated the data from all poetical
works (2ndash7) in a new text POE (column 10) This is done by adding thefrequencies of a given letter in all the six texts The same is repeated forall the seven texts cumulated as a new text TAM (column 11)
3 DISTANCE MATRIX OF TAMIL TEXTS ndash A POSSIBLE NEWTOOL FOR HISTORICAL LINGUISTICS
We consider how different texts vary in the occurrence frequency of aletter in particular how we can quantify the difference between two textsX and Y in terms of the letter frequencies in the two texts For thispurpose we focus on the different ranks of the same letter in two texts
342 S NARANAN
Dow
nloa
ded
by [
S N
aran
an]
at 2
245
21
Nov
embe
r 20
11
Here we adopt the lsquolsquodistance measurersquorsquo between two species which weformulated in Balasubrahmanyan and Naranan (2000) based on codonfrequencies (Hereafter we abbreviate references to our previous works asBN or NB)Let xj and yj represent the ranks of the jth letter in the texts X and Y
The index j ranges over the n letters of the alphabet (jfrac14 1 2 3 n)Each text is thus represented by n numbers and so is an n-dimensionalvector We denote the vectors corresponding to X and Y as X and Y withcomponents X xj and Y yj jfrac14 1 2 3 nThe vector magnitudes jXj and jYj are given by
jXj2 frac14X
x2j jYj2 frac14X
y2j eth1THORN
The summation S is over jfrac14 1 2 n in this section The ncomponents of X and Y are simply different permutations of ranks 1 23 n Hence
Therefore X and Y represent points on an n-dimensional sphere ofradius Rn The distance Dn between these two vector points is given by
D2n frac14
Xethxj yjTHORN2 eth3THORN
The angle yn between the vectors is given by
sinethyn=2THORN frac14 Dn=2Rn eth4THORN
What is the maximum possible distance Dnmax It corresponds to thecircumstance when xjfrac14 (1 2 3 n) and yjfrac14 (n n ndash 1 2 1) ndashthe ranks in one text appear reversed in their order in the other text Itcan be shown from elementary algebra
D2nmax frac14 n ethn2 1THORN=3 eth5THORN
We define a normalized distance
Dn frac14 Dn=Dnmax eth6THORN
HISTORICAL LINGUISTICS AND EVOLUTIONARY GENETICS 343
Dow
nloa
ded
by [
S N
aran
an]
at 2
245
21
Nov
embe
r 20
11
so that Dn has a value 0 to 1 From Equations (2) (4) (5) and (6)
Dn can be calculated from the vector components xj yj (jfrac14 1 2 3 n) yn the angle between X and Y (in radians) is obtained from Equation(7) For nfrac14 30
sin ethyn=2THORN frac14 0 488 Dn
31 Distance Matrix for Tamil Texts
All the seven vectors corresponding to the texts 1 to 7 have the samemagnitude R and the points lie on a 30-dimensional sphere of radius RThe angle yij between the text i and text j (in degrees) for i jfrac14 1 2 7is the angular distance matrix or simply the lsquolsquodistance matrixrsquorsquo Thematrix is given in Table 2 For instance the distance between text 1(MOD) and text 5 (SLP) y15frac14 817 degrees The matrix is symmetricsince yijfrac14 yji The diagonal elements yiifrac14 0 We observe the followingsalient features
1 The largest distance is y17frac14 936 degrees and the smallest isy34frac14 472 Since the texts are indexed 1 to 7 in increasing order oftheir historical age it is interesting that the maximum distance isbetween the texts farthest apart in age (1 MOD and 7 TLK)Similarly the minimum distance is y34 is between neighbouring textsKUK (3) and KYK (4)
2 To examine the correlation between lsquolsquodistancersquorsquo and lsquolsquoagersquorsquo differenceof two texts i and j we plot yij vs ji7 jj the absolute value of (i7 j) inFigure 1 Each point in the figure is labeled with i j Circles are forthe texts 3ndash7 There is some evidence of positive correlation
3 The correlation improves if we remove lsquolsquostragglersrsquorsquo In Equation (3)(xj7 yj)
2 represents the contribution of the jth symbol to Dn2 If a
single symbol contributes more than 04 Dn2 that symbol is defined as
a straggler Stragglers represent extreme cases which can mask anotherwise systematic trend in correlation There are three suchstraggler symbols in y26 y56 y67 all of which have text 6 (TKL)common The symbol is lsquolsquoarsquorsquo in y56 y67 and lsquolsquotrsquorsquo in y26 These twosymbols have a very low rank (high frequency of occurrence) in TKL
344 S NARANAN
Dow
nloa
ded
by [
S N
aran
an]
at 2
245
21
Nov
embe
r 20
11
compared to other texts They contribute 45 42 and 46respectively of Dn
2 in y56 y67 y26 The revised distances are indicatedin Table 2 They are y26frac14 604 (782) y56frac14 541 (703) y67frac14 653(817) The numbers in parenthesis are the unrevised distancesLinear regression gives
yi j frac14 a thorn bji jj i 6frac14 jeth THORN eth8THORN
Table 2 lsquolsquoDistance matrixrsquorsquo (Theta) of seven Tamil texts
Theta (2 6) (5 6) (6 7) in italics exclude lsquolsquostragglersrsquorsquo (see text)Distance matrix of five ancient Tamil texts is shown in the box (i jfrac14 3 4 5 6 7) In thisbox distances above the diagonal in bold are the lsquolsquoobservedrsquorsquo distances distances belowthe diagonal are the corresponding distances from the lsquolsquoevolutionaryrsquorsquo tree Both arepresented in the same matrix for easy comparison
Fig 1 Theta vs abs(i ndash j) for Tamil texts
HISTORICAL LINGUISTICS AND EVOLUTIONARY GENETICS 345
Dow
nloa
ded
by [
S N
aran
an]
at 2
245
21
Nov
embe
r 20
11
afrac14 529+ 039 and bfrac14 062+ 013 Since the texts 1 to 7 cover aperiod of about 1800 years on the average each step in ji7 jjcorresponds to about 300 years and a distance interval of 062degrees Or every one-degree change in y corresponds on the averageto a change of age about 500 years This is a very roughapproximation since the age difference is not strictly proportionalto ji7 jj
4 With larger sample sizes N and more texts especially of knownhistorical age one can expect stronger correlation between distanceand age If so one can infer the age of a text of unknown date usingthe distance-age relation
32 Historical Evolutionary Tree of Texts Using the Distance Matrix
The positive correlation between the distance yij and ji ndash jj of two texts (ij) has motivated us to use a more sophisticated analysis of the distancematrix that leads to a binary evolutionary tree of texts For this analysiswe focused only on the five ancient texts (3ndash7) The reasons for excludingMOD (1) and BHR (2) are as follows For tree analysis the criterion ofhomogeneity among texts is crucial MOD is the only prose text and so isexcluded Both MOD and BHR being modern their alphabet includes sixGrantha characters unlike the ancient texts Although they may be only asmall fraction of the texts and are not counted it is not clear how theiruse affects the frequencies of the other letters closely related to theGrantha characters So it is safe to exclude both MOD and BHR Thedistance matrix of the ancient texts (3ndash7) is shown enclosed in a box inTable 2 (upper diagonal terms) The straggler symbols have beenexcluded (see previous section)
33 The Tree Algorithm
The algorithm for generating an evolutionary tree from an m6mdistance matrix of m species is called the UPGMA algorithm commonlyused in evolutionary genetics to obtain phylogenic trees of evolution ofbiological species (Ewens amp Grant 2001) The acronym UPGMA standsfor lsquolsquoUnweighted Pair-Group Method using arithmetic Averagesrsquorsquo Hereis a brief description of the algorithm
1 First the smallest matrix element in the distance matrix is picked(say yab) It is assumed that the species a and b diverged from acommon ancestor species r1 This means yabfrac14 yar1thorn ybr1
346 S NARANAN
Dow
nloa
ded
by [
S N
aran
an]
at 2
245
21
Nov
embe
r 20
11
2 The matrix is replaced by a new matrix in which the rows andcolumns corresponding to species a b are deleted and replaced by anew row and column for the lsquolsquospeciesrsquorsquo r1 This requires calculatingyzr1 where z represents all species other than a b
yz r1 frac14 ethyz a thorn y z b ya b THORN =2 z 6frac14 a b eth9THORN
3 The steps 1 and 2 are now applied to the new matrix which has a newlsquolsquospeciesrsquorsquo r1 instead of a b A new common ancestor is found (r2)and a new matrix is created with r2
4 The above procedure is iterated m ndash 1 times giving rise to m7 1common ancestors r1 r2 rm71 which are presumed extinct Thebasic assumption here is that all the extant (current) species evolvedas bifurcations of common ancestors along a time-line of biologicalevolution
34 Evolutionary Tree of Five Ancient Tamil Texts
The evolutionary tree derived from the distance matrix of five ancienttexts is shown in Figure 2 The smallest distance in the matrix (Table 2) isy34 (472) between KUK and KYK So r1 is the lsquolsquocommon ancestorrsquorsquo ofKYK and KUK Successive iterations create r2 as the common ancestor
Fig 2 Evolutionary tree of five ancient Tamil texts
HISTORICAL LINGUISTICS AND EVOLUTIONARY GENETICS 347
Dow
nloa
ded
by [
S N
aran
an]
at 2
245
21
Nov
embe
r 20
11
of SLP and r1 r3 as the common ancestor of TKL and r2 r4 as thecommon ancestor of TLK and r3 The best distance estimate between thenodes (in this case r1 r2 r3 r4) and the texts can be calculated and areshown (in degrees) in the figure Note that e (frac14 yr4r3) and f (frac14 yr4r7) arenot known individually but only their sum ethorn f (frac14 378) The distancematrix of the lsquolsquobest-fitrsquorsquo tree is also given in Table 2 (lower diagonalelements) for easy comparison of the two types of distances Theagreement between the tree matrix elements and the observed ones is verygood The maximum difference between the observed and tree values isfor y47 observed 791 vs tree value 748 a difference of 043 degreesHere are some interesting comparisons between the optimum historicalevolutionary tree derived from the observed distance matrix and knownhistorical facts about the texts
1 The two texts KYK KUK are closest in time and KUK is later thanKYK (Table 2) Both are attributed to 800 ndash 1100 CE KYK writtenby Kamban and KUK by a different author at a later time
2 TLK is the oldest text farther in distance from any other text (see thelast column in Table 2) TLK is the earliest known Tamil literary text(lsquolsquotolrsquorsquo means lsquolsquooriginalrsquorsquo and lsquolsquokappiyamrsquorsquo means literary epic) and isattributed to lsquolsquoSangamrsquorsquo period of secular (non-religious) poetryearly CE (c 0 ndash 300 CE)
3 TKL and SLP are of an intermediate historical age between TLKand KYK Both are believed to belong to 500 ndash 700 CEThirukkural TKL a didactic collection of cryptic aphorisms(couplets of seven words each) is highly esteemed worldwideThough it is thought that TKL preceded SLP the tree as well asobservation suggest TKL may be later than SLP A clearer picturemay emerge by increasing the sample size of texts for distanceanalysis TKL is a short text of 9310 words ndash 1330 couplets ofseven words each The current sample of letter-tokens is perhapsonly a 10th of the total size
4 The tree analysis of distance matrix yields ages for texts broadly inagreement with historical facts The approach certainly has potentialas a tool for research in historical linguistics While the older textsare difficult to date there are many literary texts of intermediate agewith known dates ndash eg Pallava (6th to 9th century CE) Chola (9thto 12th century CE) and Nayak (13th to 17th century CE) periodsThey can be used to calibrate the historical time scale It is necessary
348 S NARANAN
Dow
nloa
ded
by [
S N
aran
an]
at 2
245
21
Nov
embe
r 20
11
to emphasize here that the distances indicated in Figure 2 may not beproportional to time ndash in other words the evolutionary clockmarking variation in letter usage in texts may not be a regularuniformly ticking clock at different epochs of history Distancematrix analysis can complement historical evidence and each canmotivate research in the other to help resolve some uncertainties
4 DNA SEQUENCES DISTANCE MATRIX AS A POSSIBLETOOL FOR EVOLUTIONARY GENETICS
41 DNA sequences
DNA molecules in living cells carry genetic material (genes) withinformation that determines structures and regulation of proteins vitalfor lifersquos functions DNA contains up to millions of bases in a linearsequence There are four types of bases adenine (A) guanine (G)cytosine (C) and thymine (T) Hence DNA sequence is a string of lettersA G C T from a four-letter alphabet However genetic information iscarried by codons each made up of three bases The 64 possible tripletbases (AGC CAT etc) form an alphabet of 64 symbols This is the levelthat is used for our analysis DNA as a string of 64 codons The geneticcode maps 64 codons onto 20 amino acids and a STOP symbol fortranslation of a gene into its corresponding protein which is a string of 20amino acids The STOP codon is needed to signal the termination oftranslation process The genetic code is almost universal across allspeciesOrganisms are classified into two types 1 Prokaryotes (bacteria) 2
Eukaryotes (non-bacterial) Eukaryotes are complex organisms with anucleus in the cell surrounded by cytoplasm both with their own brandof DNA Nuclear DNA sequences are long (up to millions of bases)Cytoplasm has short stretches of DNA the mitochondrial DNA(mtDNA) they are specialized parts of the cell (organelles) forgeneration release and storage of energy Each cell has thousands ofcopies of mtDNA Bacteria do not have mtDNAWe have analysed DNA sequences of 20 different species spread over
the last four billion years of evolution classified into 10 phyla (NB 2000BN 2000) The codon frequencies are given by Wada et al (1992) The20 species are divided into two sets A and B Set A consists of 10 speciesone from each phylum with the largest sample of codons in Wadarsquos data
HISTORICAL LINGUISTICS AND EVOLUTIONARY GENETICS 349
Dow
nloa
ded
by [
S N
aran
an]
at 2
245
21
Nov
embe
r 20
11
Set B is similar to set A but has species with the second largest number ofcodons The species are
Set A HUM MUS BOV CHK DRO YSC ECO FLA PT4 RIC CPSet B CHP RAT RAB XEL TRB MZE BAC VAC LAM TOB CP
In addition mtDNA for seven species have been analysed (HUMMUS RAT BOV DRO YSC MZE) For details see Balasubrahman-yan and Naranan (2000)
42 Phylogenic Tree of Six Species in Biology from the Distance Matrix
The first application of the concept of distance between two species basedon rank frequency distribution of 64 codons of DNA sequences was tostudy the evolutionary age of species relative to HUM (Homo sapiens)over a period of four billion years We obtained yHX the distance betweenHUM and species X X standing for any one of the 20 species mentionedin Section 4 (Balasubrahmanyan amp Naranan 2000) The species wereindexed ifrac14 1 2 3 10 ifrac14 1 representing HUM and ifrac14 10 the mostancient organelles A plot of yHi (ifrac14 23 10) showed good linearcorrelation
yHi frac14 437 ethi 1THORN eth10THORN
This is to be compared with Equation (8) for Tamil texts For speciesthe evolutionary time scale is four billion years Equation (10) indicatesthat on the average y increases by one degree every 100 million years Incomparison for Tamil texts one degree increase corresponds to anincrease in average age of about 500 yearsWith a distance matrix of m species yij (i jfrac14 1 2 m) we have the
means to derive an evolutionary phylogenic tree (Section 3) Here wepresent the distance matrix for 6 mammalian species including three greatapes chimp (CHP) gorilla (GOR) and orangutan (ORA) The other threeare Homo sapiens (HUM) Mouse (MUS) and Rat (RAT) In Section 4we mentioned two types of DNA nuclear and mitochondrial (mtDNA)in cells For evolutionary studies mtDNA is preferred since it is inheritedonly from the mother So we have chosen to analyse the mtDNA of thesix species mentioned Further instead of using the 64 codons of theDNA sequence we have used the corresponding 20 amino acids and oneSTOP symbol (as dictated by the genetic code) as the symbols for rankfrequency analysis The data is from Kazusa (2004)
350 S NARANAN
Dow
nloa
ded
by [
S N
aran
an]
at 2
245
21
Nov
embe
r 20
11
The distance matrix based on 21 symbols RFD is given in Table 3 Thephylogenic tree derived from the matrix using the UPGMA algorithm(Section 3) is given in Figure 3 The distances derived from the tree aregiven in Table 3 (lower diagonal terms) The agreement between theobserved and derived distances is very good The root mean square of thedifference between observed and derived distances is 052 We mentiononly some of the interesting features of the tree
1 The smallest distance is between CHP and GOR (327) and the nextto smallest distance is between MUS and RAT (636)
Table 3 lsquolsquoDistance matrixrsquorsquo (Theta) of six mammalian species
Distances above the diagonal in bold are the lsquolsquoobservedrsquorsquo distances Distances below thediagonal are the corresponding distances from the lsquolsquophylogenicrsquorsquo tree Both are presentedin the same matrix for easy comparison
Fig 3 Phylogenic tree of six mammalian species
HISTORICAL LINGUISTICS AND EVOLUTIONARY GENETICS 351
Dow
nloa
ded
by [
S N
aran
an]
at 2
245
21
Nov
embe
r 20
11
2 HUM is closest to ORA (670) HUM to CHP is 900 but ORA andCHP are far apart (1444) CHP and GOR belong to a branchdifferent from ORA
3 The branches of the tree from the nodes or the common ancestors (r1to r5) all terminate on the same base line since all the species areextant Their varying lengths reflect different rates of evolution afterbifurcations occurred at common ancestors For example thecommon ancestor of (MUS RAT) and HUM is r4 yr4H is 126whereas yr4MUS is 768 and yr4RAT is 818 This suggests that MUSand RAT evolved about 6 times faster than HUM after the split at r4if we assume the rate of change of distance with time is uniform
Phylogenic tree analysis in Evolutionary Genetics is very complexand different approaches are known to sometimes yield contradictoryresults The method used here based on a random sample of the wholegenome has its merits and demerits The analysis is very simple anddatabases of codon frequencies in DNA sequences are readilyavailable Variations across individual genes are averaged out inderiving an over-all gross evolutionary picture but the time resolutionis likely to be poor for estimates of evolutionary age Obviously themethod can only complement other already currently used methods Acommon method used in evolutionary genetics is to count the numberof base changes in a conserved gene across a long period of evolutionas a measure of evolutionary age since the base changes occur due tomutations which are accumulated over time It is worth noting thatthe RFD of codons in single genes can also be used instead of arandom sample of the whole genome The evolution of the changes inranks of codons with time is also closely related to the base changescaused by mutations
5 RANK FREQUENCY DISTRIBUTION (RFD) OF SYMBOLS INLANGUAGE TEXTS AND DNA SEQUENCES
So far we have seen how the relative frequencies of symbols occurring ina pair of strings can be used as a measure of distance or lsquolsquoseparationrsquorsquobetween them In Tamil texts the symbols are the letters of the alphabetand in DNA sequences the symbols are the 64 codons For proteinsequences the symbols are the amino acids and the STOP symbol
352 S NARANAN
Dow
nloa
ded
by [
S N
aran
an]
at 2
245
21
Nov
embe
r 20
11
What can we learn about the RFD of symbols in a single string Foreach string the frequencies of symbols are ordered in descending ordersuch that the symbol with the highest occurrence has rank 1 Thefrequency of the symbol of rank r is p(r) rfrac14 1 2 V where V thetotal number of symbols is a constant Earlier we had deduced amathematical function for p(r) drawing upon concepts from ShannonrsquosInformation Theory and Statistical Physics (NB 1993 2005 BN 19962000) It was successful in describing the RFD of (1) phonemes in sixspoken Indian languages (2) S-words (articles prepositions andconjunctions) in English texts and (3) codons in DNA sequences of 20species The function called the cumulative modified power law (CMPL)is given by
pethrTHORN frac14Xifrac14V
ifrac14rdethiTHORN eth11aTHORN
Here d(i)frac14 p(i)7 p(ithorn 1) for ifrac14 1 2 V7 1 and d(V)frac14 p(V)Further
dethiTHORN frac14 Den=iid eth11bTHORN
where D n d are constants D depends only on the string size (N) and is ascaling or normalizing constant n d determine the shape of the functionp(i) is a sum of lsquolsquomodified power lawsrsquorsquo which are the terms e7nii7dFor each of the nine texts in Table 1 we obtained the RFD of letters
p(r) vs r They fit the Equations (11a b) very well according to theKolmogorov-Smirnov test (Keeping 1962) The (n d) parameters for thetexts 1 2 7 TAM POE are respectively
For details see NB (2006) A remarkable feature of the parameters nand d is that they are statistically correlated n(d7 1) b b is aconstant 32We had studied the RFD of 64 codons in DNA and mtDNA sequences
of 20 species (Section 41) and found a similar feature n(d7 1) 31(BN2000) The spread of (n d) in Tamil texts is however smaller (dfrac14 0 to
HISTORICAL LINGUISTICS AND EVOLUTIONARY GENETICS 353
Dow
nloa
ded
by [
S N
aran
an]
at 2
245
21
Nov
embe
r 20
11
052) than the corresponding spread in DNA sequences (dfrac1471 to 20)There are some chance coincidences (n d) are nearly the same for thepair TAM (7325 011) and a common bacterium E-Coli or ECO(732 012) Another close pair is TLK (7238 035) and mtDNA ofcow BOV (7236 037) The wide range of (n d) suggests the possibilityof distinguishing different texts from the values of n and d In otherwords the values of n and d are signatures characterizing an author atext a language or a species Finally we note that CMPL is not system-specific and may have a wider application in all sciences It is derivedfrom a model based on information theory and statistical physics and isnot an exercise in curve fittingClosely related to CMPL is the function MPL modified power law
which fits very well word frequency distributions in language texts
WethkTHORN frac14 Cem=k kg eth12THORN
HereW(k) is the number of word-types that occur k times in the text Cis a size-dependent normalizing constant and (m g) are shape parameters(NB 1992a 1992b 1998 2005 BN 2002) Baayenrsquos book WordFrequency Distributions (Baayen 2001) compares various mathematicalfunctions describing WFD beginning with the Zipfrsquos Law W(k)frac14Ck2
(Zipf 1935 1949) Among other WFDrsquos MPL is also tested for severalEnglish literary classics (Lewis Carroll HG Wells Conan Doyle) alarge corpus of about 66 106 words in English and a Dutch text Thesample size varies from 25000 to 100000 in most cases For most textsg 20 and m is in the range [0 1] Baayen refers to MPL as Naranan-Balasubrahmanyan-Zipf (NBZ) distribution A CD ROM accompanyingthe book has several computer programs including one to fit the NBZdistribution to the observed WFD (spectfit)Notice the close resemblance between MPL (Equation (12)) and
CMPL (Equation (11b)) Our model was first used to derive the MPLand then extended to CMPL A natural language text can be consideredas a string of symbols of different kinds When the symbols are words(vocabulary) we have the MPL for the WFD of word-types The numberof word-types grows with the size N of the text When the symbol set isthe alphabet phonemes or S-words the number of symbols V isconstant independent of N In such cases we deal with the RFD ofsymbols which is well fit by the CMPL For alphabet and phonemesV 20ndash40 and for S-words in English Vfrac14 71 (BN 1996)
354 S NARANAN
Dow
nloa
ded
by [
S N
aran
an]
at 2
245
21
Nov
embe
r 20
11
Zipfrsquos Law is valid for many European languages however it has notbeen tested for Indian languages presumably because the word types aredifficult to identify in a computer-based automatic analysis of wordfrequencies Therefore the letters of the alphabet as symbols are suitablefor analysis of rank frequencies Their number is fixed and small (20ndash40)CMPL for rank frequency distribution of letters is the equivalent ofMPL (NBZ) for word frequency distribution
6 ENTROPIES OF TAMIL TEXTS
In Shannonrsquos Information theory (Shannon 1948) entropy or informa-tion is defined for a string of symbols as follows
Hs frac14 Xn
ifrac141Pi lgPi eth13THORN
Here Pi4 0 (ifrac14 1 2 3 n) (S Pifrac14 1) are the probabilities ofoccurrence of the n symbols and lg is logarithm to base 2 Shannonentropy Hs has a very practical application for communication it is theminimum average binary code length per symbol required for efficientcommunication The code length of a symbol is determined by itsprobability most frequently occurring symbols have short codes and theleast frequent ones have long codes The actual code assignments can bedetermined from Pi using an elegant algorithm by Huffman (1952) For adiscussion of the relationship between entropy information andcomplexity see Balasubrahmanyan and Naranan (2005)Siromoney (1963) calculated the entropy of Tamil prose (MOD) as
Hsfrac14 434 bits and gave the code assignments for different symbols Wehave determined Hs for TAM as 4428 bits and the code assignments aregiven in Table 1 (last col) The average Huffman code length is 4460close to Hs Information theory guarantees that this is the best possiblecode
7 DISCUSSION AND SUMMARY
For strings with a small symbol set the rank frequency distribution(RFD) is the basic data from which all the quantitative estimates of
HISTORICAL LINGUISTICS AND EVOLUTIONARY GENETICS 355
Dow
nloa
ded
by [
S N
aran
an]
at 2
245
21
Nov
embe
r 20
11
parameters described have been determined For a given string RFD ofsymbols can be described by CMPL with two parameters n and d Thereare indications that only one of them is an independent parameter If thechosen text is a randomized sample of the whole text it is to be expectedthat n d will be independent of sample size N Since n d vary widely fromtext to text they may serve as signatures to distinguish different texts(Section 5) The range of variation is greater in DNA sequencescompared to language textsThe difference in the ranks of a symbol in two strings is used to define a
lsquolsquodistancersquorsquo between the two strings Note that this does not depend onany model such as CMPL for RFD of symbols it is based on rawfrequency data and a very intuitive concept of Euclidean distancegeneralized to n dimensions (n is the total number of symbols) Anoteworthy feature is that only the difference in the ranks are used andnot the ranks themselves eg a symbol with ranks 3 and 4 in two textscontributes the same distance as a symbol with ranks 20 and 21 therebygiving equal weights to all symbols irrespective of their probability ofoccurrence The angular separation between the two strings (DNAsequences or Tamil texts) shows good correlation with their agedifference indicating that the method is a promising tool in evolutionarygenetics and historical linguistics This is illustrated by deriving anevolutionary binary tree from the distance matrix using a tree algorithmTrees for five ancient Tamil texts and six mammalian species are broadlyin agreement with known facts from history of literary texts andevolution of speciesThe RFD of symbols in strings is a tool with interesting potential in
evolutionary studies with possibilities of refining the technique for betterresults By including strings of known age (texts or DNA species) one cancalibrate the time scale involved One might ask why such a correlationbetween distance and age is to be expected In the case of DNAsequences mutations of the four bases of DNA cause the relative codonfrequencies to change with time and accumulate at a rate related to theaverage rate of mutation (estimated as about 1 in 100000 years)Similarly in Tamil texts as word usage changes over historical timesconnected changes occur in the relative frequencies of letters of thewords Such changes also accumulate in time showing a net positivecorrelation between distance and age The heartening aspect of this typeof analysis is that string sizes (genes literary texts) can be sufficientlylarge to yield parameter estimates of high statistical accuracy In this
356 S NARANAN
Dow
nloa
ded
by [
S N
aran
an]
at 2
245
21
Nov
embe
r 20
11
respect mtDNA suffers in comparison to nuclear DNA since mtDNArsquosare short in length But mtDNA is preferred for evolutionary studiessince it is inherited only from the mother It will be interesting tocompare evolutionary histories of individual genes conserved over longperiods of evolution from gene to gene and from mtDNA to nuclearDNA For the choice of symbol one has 64 codons or 20 aminoacidsthorn STOP symbol (21 symbols) Evolutionary tree from a distancematrix based on RFD of symbols can complement other evidence egfossil linguistic and anthropological evidence
ACKNOWLEDGMENT
I thank my daughter Gomathy Naranan for a careful reading of the paper and valuablesuggestions
REFERENCES
Baayen R H (2001) Word frequency Distributions Dordrecht Kluwer AcademicPublishers
Balasubrahmanyan V K amp Naranan S (1996) Quantitative linguistics and complexsystem studies Journal of Quantitative Linguistics 3 177ndash228
Balasubrahmanyan V K amp Naranan S (2000) Information theory and algorithmiccomplexity Applications to language discourses and DNA sequences as complexsystems Part II Complexity of DNA sequences analogy with linguistic discoursesJournal of Quantitative Linguistics 7 153ndash183
Balasubrahmanyan V K amp Naranan S (2002) Algorithmic information complexityand Zipf00s law Glottometrics 4 1ndash26
Balasubrahmanyan V K amp Naranan S (2005) Entropy information and complexityIn R Kohler G Altmann amp R G Piotrowski (Eds) An International Handbook ofQuantitative Linguistics (Chap 61 pp 878ndash891) Berlin New York Walter deGruyter
Ewens W J amp Grant G R (2001) Statistical Methods in Bioinformatics ndash anIntroduction Berlin New York Springer Verlag
Huffman D A (1952) A method for the construction of minimum redundancy codesProceedings of the Institute of Radio Engineers 40 1098ndash1101
Kazusa (2004) Codon Usage Tables Retrieved January 24 2004 from httpwwwkasuzaorjpcodon
Keeping E S (1962) Introduction to Statistical Inference New York van NostrandNaranan S amp Balasubrahmanyan V K (1992a) Information theoretic models in
statistical linguistics ndash Part I A model for word frequencies Current Science 63261ndash269
HISTORICAL LINGUISTICS AND EVOLUTIONARY GENETICS 357
Dow
nloa
ded
by [
S N
aran
an]
at 2
245
21
Nov
embe
r 20
11
Naranan S amp Balasubrahmanyan V K (1992b) Information theoretic models instatistical linguistics ndash Part II Word frequencies and hierarchical structure inlanguage ndash statistical tests Current Science 63 297ndash306
Naranan S amp Balasubrahmanyan V K (1993) Information theoretic model forfrequency distribution of words and speech sounds (phonemes) in languageJournal of Scientific and Industrial Research 52 728ndash738
Naranan S amp Balasubrahmanyan V K (1998) Models for power law relations inlinguistics and information science Journal of Quantitative Linguistics 5 35ndash61
Naranan S amp Balasubrahmanyan V K (2000) Information theory and algorithmiccomplexity Applications to language discourses and DNA sequences as complexsystems Part I Efficiency of the genetic code of DNA Journal of QuantitativeLinguistics 7 129ndash152
Naranan S amp Balasubrahmanyan V K (2005) Power laws in statistical linguistics andrelated systems In R Kohler G Altmann amp R G Piotrowski (Eds) AnInternational Handbook of Quantitative Linguistics (Chap 50 pp 716ndash738) BerlinNew York Walter de Gruyter
Naranan S amp Balasubrahmanyan V K (2006) Statistical analogs in DNA sequencesand Tamil language texts Rank frequency distribution of symbols and theirapplication to Evolutionary Genetics and Historical Lnguistics Festschrift in honorof Professor G Altmann on his 75th birthday (pp 483ndash496) Berlin New YorkWalter de Gruyter
Shannon C E (1948) A mathematical theory of communication I II Bell SystemTechnical Journal 27 379ndash423 623ndash656 Reprinted in Shannon C E amp WeaverW (1949) The Mathematical Theory of Communication Urbana University ofIllinois
Siromoney G (1963) Entropy of Tamil Prose Information and Control 6 297ndash300Wada K Wada Y Ishibashi F Gojobori T amp Ikemura T (1992) Codon usage
tabulated from the GenBank genetic sequence data Nucleic Acids Research 202111ndash2118
World Classical Tamil Conference 2010 Retrieved July 29 2010 from httpenwikipediaorgwikiWorld_Classical_Tamil_Conference_2010
Zipf G K (1935) The psychobiology of language New York Houghton Mifflin CoReprinted (1968) Cambridge MIT Press
Zipf G K (1949) Human Behavior and the Principle of Least Effort Reading Addison-Wesley
358 S NARANAN
Dow
nloa
ded
by [
S N
aran
an]
at 2
245
21
Nov
embe
r 20
11
Table
1(C
ontinued)
SER
no
Translation
inEnglish
12
34
56
72ndash7
1ndash7
Huffmancode
MOD
BHR
KUK
KYK
SLP
TKL
TLK
POE
TAM
TAM
27
l-7
10
99
12
816
64
71
0001110
28
l21
16
12
16
12
12
12
80
101
100011
29
t27
24
32
36
36
43
41
212
239
01101
30
n38
53
68
68
51
53
44
337
375
1011
Total
1000
1000
999
999
1000
1000
1001
5999
6999
NTOT
22855
5056
16283
11855
4165
6355
12430
56144
78999
1MODModernProse
(1946ndash57)
2BHRBharathi
3KUKKambaRamayanam
(Uthara
Kandam)
4KYK
KambaRamayanam
(YuddhaKandam)
5SLPSilappathigaram
6TKLThirukkural
7TLKTholkappiyam
(Porulathikaram)
2ndash7POETexts
nos2ndash71ndash7TAMAllTamiltexts
(bold)
Thefrequencies
are
per
thousandTheirlsquolsquoTotalrsquorsquodoes
notaddupto
1000dueto
round-offerrorsNTOTisthenumber
oftokensin
each
text
Column2Transliteratedlettersin
English
HISTORICAL LINGUISTICS AND EVOLUTIONARY GENETICS 341
Dow
nloa
ded
by [
S N
aran
an]
at 2
245
21
Nov
embe
r 20
11
manufacture typewriters in any language with an alphabet that could fitinto a standard English keyboard Tamil was the only Indian languagefor which this was possible because of its compact alphabet Lessons weredevised to type in Tamil in blind touch at age 13 The typewriter is still avalued possession The keyboard design has some novel ingeniousfeaturesThis article is based on data on Tamil letter frequencies for seven
Tamil texts given by Gift Siromoney (1963) The data are reproduced inTable 1 In column 2 the English transliterations of the Tamil lettersadopted by Siromoney are given they mostly conform to theInternational Phonetic Alphabet (IPA) code Samples were taken fromTamil poetry from six different works belonging to periods ranging fromthe beginning of the Christian Era to the modern periodAs the dates of these works cannot be fixed with any certainty the
(accepted) order in which they were written is followed Tholkappiyam(Porul athigaram) is the oldest and Bharathi is the most recent Modernprose is a sample of over 20000 letters from the prose works published inMadras State in 1946ndash1947 The seven texts are given in Table 1 Allexcept the first are poetical works The last five are ancient texts rangingfrom approximately third century to 12th century CE BHR is early 20thcentury and MOD is from mid-20th century The relative frequencies ofletters in a text are given in Table 1 (cols 3 to 9) as number of occurrencesper 1000 The total number of letters (N) in the sample text (letter tokens)is given in the last row (Siromoney 1963) Whereas the ancient textscontain only 30 letters the modern texts have in addition six Granthacharacters which are ignored in the countingFrom the seven texts we have cumulated the data from all poetical
works (2ndash7) in a new text POE (column 10) This is done by adding thefrequencies of a given letter in all the six texts The same is repeated forall the seven texts cumulated as a new text TAM (column 11)
3 DISTANCE MATRIX OF TAMIL TEXTS ndash A POSSIBLE NEWTOOL FOR HISTORICAL LINGUISTICS
We consider how different texts vary in the occurrence frequency of aletter in particular how we can quantify the difference between two textsX and Y in terms of the letter frequencies in the two texts For thispurpose we focus on the different ranks of the same letter in two texts
342 S NARANAN
Dow
nloa
ded
by [
S N
aran
an]
at 2
245
21
Nov
embe
r 20
11
Here we adopt the lsquolsquodistance measurersquorsquo between two species which weformulated in Balasubrahmanyan and Naranan (2000) based on codonfrequencies (Hereafter we abbreviate references to our previous works asBN or NB)Let xj and yj represent the ranks of the jth letter in the texts X and Y
The index j ranges over the n letters of the alphabet (jfrac14 1 2 3 n)Each text is thus represented by n numbers and so is an n-dimensionalvector We denote the vectors corresponding to X and Y as X and Y withcomponents X xj and Y yj jfrac14 1 2 3 nThe vector magnitudes jXj and jYj are given by
jXj2 frac14X
x2j jYj2 frac14X
y2j eth1THORN
The summation S is over jfrac14 1 2 n in this section The ncomponents of X and Y are simply different permutations of ranks 1 23 n Hence
Therefore X and Y represent points on an n-dimensional sphere ofradius Rn The distance Dn between these two vector points is given by
D2n frac14
Xethxj yjTHORN2 eth3THORN
The angle yn between the vectors is given by
sinethyn=2THORN frac14 Dn=2Rn eth4THORN
What is the maximum possible distance Dnmax It corresponds to thecircumstance when xjfrac14 (1 2 3 n) and yjfrac14 (n n ndash 1 2 1) ndashthe ranks in one text appear reversed in their order in the other text Itcan be shown from elementary algebra
D2nmax frac14 n ethn2 1THORN=3 eth5THORN
We define a normalized distance
Dn frac14 Dn=Dnmax eth6THORN
HISTORICAL LINGUISTICS AND EVOLUTIONARY GENETICS 343
Dow
nloa
ded
by [
S N
aran
an]
at 2
245
21
Nov
embe
r 20
11
so that Dn has a value 0 to 1 From Equations (2) (4) (5) and (6)
Dn can be calculated from the vector components xj yj (jfrac14 1 2 3 n) yn the angle between X and Y (in radians) is obtained from Equation(7) For nfrac14 30
sin ethyn=2THORN frac14 0 488 Dn
31 Distance Matrix for Tamil Texts
All the seven vectors corresponding to the texts 1 to 7 have the samemagnitude R and the points lie on a 30-dimensional sphere of radius RThe angle yij between the text i and text j (in degrees) for i jfrac14 1 2 7is the angular distance matrix or simply the lsquolsquodistance matrixrsquorsquo Thematrix is given in Table 2 For instance the distance between text 1(MOD) and text 5 (SLP) y15frac14 817 degrees The matrix is symmetricsince yijfrac14 yji The diagonal elements yiifrac14 0 We observe the followingsalient features
1 The largest distance is y17frac14 936 degrees and the smallest isy34frac14 472 Since the texts are indexed 1 to 7 in increasing order oftheir historical age it is interesting that the maximum distance isbetween the texts farthest apart in age (1 MOD and 7 TLK)Similarly the minimum distance is y34 is between neighbouring textsKUK (3) and KYK (4)
2 To examine the correlation between lsquolsquodistancersquorsquo and lsquolsquoagersquorsquo differenceof two texts i and j we plot yij vs ji7 jj the absolute value of (i7 j) inFigure 1 Each point in the figure is labeled with i j Circles are forthe texts 3ndash7 There is some evidence of positive correlation
3 The correlation improves if we remove lsquolsquostragglersrsquorsquo In Equation (3)(xj7 yj)
2 represents the contribution of the jth symbol to Dn2 If a
single symbol contributes more than 04 Dn2 that symbol is defined as
a straggler Stragglers represent extreme cases which can mask anotherwise systematic trend in correlation There are three suchstraggler symbols in y26 y56 y67 all of which have text 6 (TKL)common The symbol is lsquolsquoarsquorsquo in y56 y67 and lsquolsquotrsquorsquo in y26 These twosymbols have a very low rank (high frequency of occurrence) in TKL
344 S NARANAN
Dow
nloa
ded
by [
S N
aran
an]
at 2
245
21
Nov
embe
r 20
11
compared to other texts They contribute 45 42 and 46respectively of Dn
2 in y56 y67 y26 The revised distances are indicatedin Table 2 They are y26frac14 604 (782) y56frac14 541 (703) y67frac14 653(817) The numbers in parenthesis are the unrevised distancesLinear regression gives
yi j frac14 a thorn bji jj i 6frac14 jeth THORN eth8THORN
Table 2 lsquolsquoDistance matrixrsquorsquo (Theta) of seven Tamil texts
Theta (2 6) (5 6) (6 7) in italics exclude lsquolsquostragglersrsquorsquo (see text)Distance matrix of five ancient Tamil texts is shown in the box (i jfrac14 3 4 5 6 7) In thisbox distances above the diagonal in bold are the lsquolsquoobservedrsquorsquo distances distances belowthe diagonal are the corresponding distances from the lsquolsquoevolutionaryrsquorsquo tree Both arepresented in the same matrix for easy comparison
Fig 1 Theta vs abs(i ndash j) for Tamil texts
HISTORICAL LINGUISTICS AND EVOLUTIONARY GENETICS 345
Dow
nloa
ded
by [
S N
aran
an]
at 2
245
21
Nov
embe
r 20
11
afrac14 529+ 039 and bfrac14 062+ 013 Since the texts 1 to 7 cover aperiod of about 1800 years on the average each step in ji7 jjcorresponds to about 300 years and a distance interval of 062degrees Or every one-degree change in y corresponds on the averageto a change of age about 500 years This is a very roughapproximation since the age difference is not strictly proportionalto ji7 jj
4 With larger sample sizes N and more texts especially of knownhistorical age one can expect stronger correlation between distanceand age If so one can infer the age of a text of unknown date usingthe distance-age relation
32 Historical Evolutionary Tree of Texts Using the Distance Matrix
The positive correlation between the distance yij and ji ndash jj of two texts (ij) has motivated us to use a more sophisticated analysis of the distancematrix that leads to a binary evolutionary tree of texts For this analysiswe focused only on the five ancient texts (3ndash7) The reasons for excludingMOD (1) and BHR (2) are as follows For tree analysis the criterion ofhomogeneity among texts is crucial MOD is the only prose text and so isexcluded Both MOD and BHR being modern their alphabet includes sixGrantha characters unlike the ancient texts Although they may be only asmall fraction of the texts and are not counted it is not clear how theiruse affects the frequencies of the other letters closely related to theGrantha characters So it is safe to exclude both MOD and BHR Thedistance matrix of the ancient texts (3ndash7) is shown enclosed in a box inTable 2 (upper diagonal terms) The straggler symbols have beenexcluded (see previous section)
33 The Tree Algorithm
The algorithm for generating an evolutionary tree from an m6mdistance matrix of m species is called the UPGMA algorithm commonlyused in evolutionary genetics to obtain phylogenic trees of evolution ofbiological species (Ewens amp Grant 2001) The acronym UPGMA standsfor lsquolsquoUnweighted Pair-Group Method using arithmetic Averagesrsquorsquo Hereis a brief description of the algorithm
1 First the smallest matrix element in the distance matrix is picked(say yab) It is assumed that the species a and b diverged from acommon ancestor species r1 This means yabfrac14 yar1thorn ybr1
346 S NARANAN
Dow
nloa
ded
by [
S N
aran
an]
at 2
245
21
Nov
embe
r 20
11
2 The matrix is replaced by a new matrix in which the rows andcolumns corresponding to species a b are deleted and replaced by anew row and column for the lsquolsquospeciesrsquorsquo r1 This requires calculatingyzr1 where z represents all species other than a b
yz r1 frac14 ethyz a thorn y z b ya b THORN =2 z 6frac14 a b eth9THORN
3 The steps 1 and 2 are now applied to the new matrix which has a newlsquolsquospeciesrsquorsquo r1 instead of a b A new common ancestor is found (r2)and a new matrix is created with r2
4 The above procedure is iterated m ndash 1 times giving rise to m7 1common ancestors r1 r2 rm71 which are presumed extinct Thebasic assumption here is that all the extant (current) species evolvedas bifurcations of common ancestors along a time-line of biologicalevolution
34 Evolutionary Tree of Five Ancient Tamil Texts
The evolutionary tree derived from the distance matrix of five ancienttexts is shown in Figure 2 The smallest distance in the matrix (Table 2) isy34 (472) between KUK and KYK So r1 is the lsquolsquocommon ancestorrsquorsquo ofKYK and KUK Successive iterations create r2 as the common ancestor
Fig 2 Evolutionary tree of five ancient Tamil texts
HISTORICAL LINGUISTICS AND EVOLUTIONARY GENETICS 347
Dow
nloa
ded
by [
S N
aran
an]
at 2
245
21
Nov
embe
r 20
11
of SLP and r1 r3 as the common ancestor of TKL and r2 r4 as thecommon ancestor of TLK and r3 The best distance estimate between thenodes (in this case r1 r2 r3 r4) and the texts can be calculated and areshown (in degrees) in the figure Note that e (frac14 yr4r3) and f (frac14 yr4r7) arenot known individually but only their sum ethorn f (frac14 378) The distancematrix of the lsquolsquobest-fitrsquorsquo tree is also given in Table 2 (lower diagonalelements) for easy comparison of the two types of distances Theagreement between the tree matrix elements and the observed ones is verygood The maximum difference between the observed and tree values isfor y47 observed 791 vs tree value 748 a difference of 043 degreesHere are some interesting comparisons between the optimum historicalevolutionary tree derived from the observed distance matrix and knownhistorical facts about the texts
1 The two texts KYK KUK are closest in time and KUK is later thanKYK (Table 2) Both are attributed to 800 ndash 1100 CE KYK writtenby Kamban and KUK by a different author at a later time
2 TLK is the oldest text farther in distance from any other text (see thelast column in Table 2) TLK is the earliest known Tamil literary text(lsquolsquotolrsquorsquo means lsquolsquooriginalrsquorsquo and lsquolsquokappiyamrsquorsquo means literary epic) and isattributed to lsquolsquoSangamrsquorsquo period of secular (non-religious) poetryearly CE (c 0 ndash 300 CE)
3 TKL and SLP are of an intermediate historical age between TLKand KYK Both are believed to belong to 500 ndash 700 CEThirukkural TKL a didactic collection of cryptic aphorisms(couplets of seven words each) is highly esteemed worldwideThough it is thought that TKL preceded SLP the tree as well asobservation suggest TKL may be later than SLP A clearer picturemay emerge by increasing the sample size of texts for distanceanalysis TKL is a short text of 9310 words ndash 1330 couplets ofseven words each The current sample of letter-tokens is perhapsonly a 10th of the total size
4 The tree analysis of distance matrix yields ages for texts broadly inagreement with historical facts The approach certainly has potentialas a tool for research in historical linguistics While the older textsare difficult to date there are many literary texts of intermediate agewith known dates ndash eg Pallava (6th to 9th century CE) Chola (9thto 12th century CE) and Nayak (13th to 17th century CE) periodsThey can be used to calibrate the historical time scale It is necessary
348 S NARANAN
Dow
nloa
ded
by [
S N
aran
an]
at 2
245
21
Nov
embe
r 20
11
to emphasize here that the distances indicated in Figure 2 may not beproportional to time ndash in other words the evolutionary clockmarking variation in letter usage in texts may not be a regularuniformly ticking clock at different epochs of history Distancematrix analysis can complement historical evidence and each canmotivate research in the other to help resolve some uncertainties
4 DNA SEQUENCES DISTANCE MATRIX AS A POSSIBLETOOL FOR EVOLUTIONARY GENETICS
41 DNA sequences
DNA molecules in living cells carry genetic material (genes) withinformation that determines structures and regulation of proteins vitalfor lifersquos functions DNA contains up to millions of bases in a linearsequence There are four types of bases adenine (A) guanine (G)cytosine (C) and thymine (T) Hence DNA sequence is a string of lettersA G C T from a four-letter alphabet However genetic information iscarried by codons each made up of three bases The 64 possible tripletbases (AGC CAT etc) form an alphabet of 64 symbols This is the levelthat is used for our analysis DNA as a string of 64 codons The geneticcode maps 64 codons onto 20 amino acids and a STOP symbol fortranslation of a gene into its corresponding protein which is a string of 20amino acids The STOP codon is needed to signal the termination oftranslation process The genetic code is almost universal across allspeciesOrganisms are classified into two types 1 Prokaryotes (bacteria) 2
Eukaryotes (non-bacterial) Eukaryotes are complex organisms with anucleus in the cell surrounded by cytoplasm both with their own brandof DNA Nuclear DNA sequences are long (up to millions of bases)Cytoplasm has short stretches of DNA the mitochondrial DNA(mtDNA) they are specialized parts of the cell (organelles) forgeneration release and storage of energy Each cell has thousands ofcopies of mtDNA Bacteria do not have mtDNAWe have analysed DNA sequences of 20 different species spread over
the last four billion years of evolution classified into 10 phyla (NB 2000BN 2000) The codon frequencies are given by Wada et al (1992) The20 species are divided into two sets A and B Set A consists of 10 speciesone from each phylum with the largest sample of codons in Wadarsquos data
HISTORICAL LINGUISTICS AND EVOLUTIONARY GENETICS 349
Dow
nloa
ded
by [
S N
aran
an]
at 2
245
21
Nov
embe
r 20
11
Set B is similar to set A but has species with the second largest number ofcodons The species are
Set A HUM MUS BOV CHK DRO YSC ECO FLA PT4 RIC CPSet B CHP RAT RAB XEL TRB MZE BAC VAC LAM TOB CP
In addition mtDNA for seven species have been analysed (HUMMUS RAT BOV DRO YSC MZE) For details see Balasubrahman-yan and Naranan (2000)
42 Phylogenic Tree of Six Species in Biology from the Distance Matrix
The first application of the concept of distance between two species basedon rank frequency distribution of 64 codons of DNA sequences was tostudy the evolutionary age of species relative to HUM (Homo sapiens)over a period of four billion years We obtained yHX the distance betweenHUM and species X X standing for any one of the 20 species mentionedin Section 4 (Balasubrahmanyan amp Naranan 2000) The species wereindexed ifrac14 1 2 3 10 ifrac14 1 representing HUM and ifrac14 10 the mostancient organelles A plot of yHi (ifrac14 23 10) showed good linearcorrelation
yHi frac14 437 ethi 1THORN eth10THORN
This is to be compared with Equation (8) for Tamil texts For speciesthe evolutionary time scale is four billion years Equation (10) indicatesthat on the average y increases by one degree every 100 million years Incomparison for Tamil texts one degree increase corresponds to anincrease in average age of about 500 yearsWith a distance matrix of m species yij (i jfrac14 1 2 m) we have the
means to derive an evolutionary phylogenic tree (Section 3) Here wepresent the distance matrix for 6 mammalian species including three greatapes chimp (CHP) gorilla (GOR) and orangutan (ORA) The other threeare Homo sapiens (HUM) Mouse (MUS) and Rat (RAT) In Section 4we mentioned two types of DNA nuclear and mitochondrial (mtDNA)in cells For evolutionary studies mtDNA is preferred since it is inheritedonly from the mother So we have chosen to analyse the mtDNA of thesix species mentioned Further instead of using the 64 codons of theDNA sequence we have used the corresponding 20 amino acids and oneSTOP symbol (as dictated by the genetic code) as the symbols for rankfrequency analysis The data is from Kazusa (2004)
350 S NARANAN
Dow
nloa
ded
by [
S N
aran
an]
at 2
245
21
Nov
embe
r 20
11
The distance matrix based on 21 symbols RFD is given in Table 3 Thephylogenic tree derived from the matrix using the UPGMA algorithm(Section 3) is given in Figure 3 The distances derived from the tree aregiven in Table 3 (lower diagonal terms) The agreement between theobserved and derived distances is very good The root mean square of thedifference between observed and derived distances is 052 We mentiononly some of the interesting features of the tree
1 The smallest distance is between CHP and GOR (327) and the nextto smallest distance is between MUS and RAT (636)
Table 3 lsquolsquoDistance matrixrsquorsquo (Theta) of six mammalian species
Distances above the diagonal in bold are the lsquolsquoobservedrsquorsquo distances Distances below thediagonal are the corresponding distances from the lsquolsquophylogenicrsquorsquo tree Both are presentedin the same matrix for easy comparison
Fig 3 Phylogenic tree of six mammalian species
HISTORICAL LINGUISTICS AND EVOLUTIONARY GENETICS 351
Dow
nloa
ded
by [
S N
aran
an]
at 2
245
21
Nov
embe
r 20
11
2 HUM is closest to ORA (670) HUM to CHP is 900 but ORA andCHP are far apart (1444) CHP and GOR belong to a branchdifferent from ORA
3 The branches of the tree from the nodes or the common ancestors (r1to r5) all terminate on the same base line since all the species areextant Their varying lengths reflect different rates of evolution afterbifurcations occurred at common ancestors For example thecommon ancestor of (MUS RAT) and HUM is r4 yr4H is 126whereas yr4MUS is 768 and yr4RAT is 818 This suggests that MUSand RAT evolved about 6 times faster than HUM after the split at r4if we assume the rate of change of distance with time is uniform
Phylogenic tree analysis in Evolutionary Genetics is very complexand different approaches are known to sometimes yield contradictoryresults The method used here based on a random sample of the wholegenome has its merits and demerits The analysis is very simple anddatabases of codon frequencies in DNA sequences are readilyavailable Variations across individual genes are averaged out inderiving an over-all gross evolutionary picture but the time resolutionis likely to be poor for estimates of evolutionary age Obviously themethod can only complement other already currently used methods Acommon method used in evolutionary genetics is to count the numberof base changes in a conserved gene across a long period of evolutionas a measure of evolutionary age since the base changes occur due tomutations which are accumulated over time It is worth noting thatthe RFD of codons in single genes can also be used instead of arandom sample of the whole genome The evolution of the changes inranks of codons with time is also closely related to the base changescaused by mutations
5 RANK FREQUENCY DISTRIBUTION (RFD) OF SYMBOLS INLANGUAGE TEXTS AND DNA SEQUENCES
So far we have seen how the relative frequencies of symbols occurring ina pair of strings can be used as a measure of distance or lsquolsquoseparationrsquorsquobetween them In Tamil texts the symbols are the letters of the alphabetand in DNA sequences the symbols are the 64 codons For proteinsequences the symbols are the amino acids and the STOP symbol
352 S NARANAN
Dow
nloa
ded
by [
S N
aran
an]
at 2
245
21
Nov
embe
r 20
11
What can we learn about the RFD of symbols in a single string Foreach string the frequencies of symbols are ordered in descending ordersuch that the symbol with the highest occurrence has rank 1 Thefrequency of the symbol of rank r is p(r) rfrac14 1 2 V where V thetotal number of symbols is a constant Earlier we had deduced amathematical function for p(r) drawing upon concepts from ShannonrsquosInformation Theory and Statistical Physics (NB 1993 2005 BN 19962000) It was successful in describing the RFD of (1) phonemes in sixspoken Indian languages (2) S-words (articles prepositions andconjunctions) in English texts and (3) codons in DNA sequences of 20species The function called the cumulative modified power law (CMPL)is given by
pethrTHORN frac14Xifrac14V
ifrac14rdethiTHORN eth11aTHORN
Here d(i)frac14 p(i)7 p(ithorn 1) for ifrac14 1 2 V7 1 and d(V)frac14 p(V)Further
dethiTHORN frac14 Den=iid eth11bTHORN
where D n d are constants D depends only on the string size (N) and is ascaling or normalizing constant n d determine the shape of the functionp(i) is a sum of lsquolsquomodified power lawsrsquorsquo which are the terms e7nii7dFor each of the nine texts in Table 1 we obtained the RFD of letters
p(r) vs r They fit the Equations (11a b) very well according to theKolmogorov-Smirnov test (Keeping 1962) The (n d) parameters for thetexts 1 2 7 TAM POE are respectively
For details see NB (2006) A remarkable feature of the parameters nand d is that they are statistically correlated n(d7 1) b b is aconstant 32We had studied the RFD of 64 codons in DNA and mtDNA sequences
of 20 species (Section 41) and found a similar feature n(d7 1) 31(BN2000) The spread of (n d) in Tamil texts is however smaller (dfrac14 0 to
HISTORICAL LINGUISTICS AND EVOLUTIONARY GENETICS 353
Dow
nloa
ded
by [
S N
aran
an]
at 2
245
21
Nov
embe
r 20
11
052) than the corresponding spread in DNA sequences (dfrac1471 to 20)There are some chance coincidences (n d) are nearly the same for thepair TAM (7325 011) and a common bacterium E-Coli or ECO(732 012) Another close pair is TLK (7238 035) and mtDNA ofcow BOV (7236 037) The wide range of (n d) suggests the possibilityof distinguishing different texts from the values of n and d In otherwords the values of n and d are signatures characterizing an author atext a language or a species Finally we note that CMPL is not system-specific and may have a wider application in all sciences It is derivedfrom a model based on information theory and statistical physics and isnot an exercise in curve fittingClosely related to CMPL is the function MPL modified power law
which fits very well word frequency distributions in language texts
WethkTHORN frac14 Cem=k kg eth12THORN
HereW(k) is the number of word-types that occur k times in the text Cis a size-dependent normalizing constant and (m g) are shape parameters(NB 1992a 1992b 1998 2005 BN 2002) Baayenrsquos book WordFrequency Distributions (Baayen 2001) compares various mathematicalfunctions describing WFD beginning with the Zipfrsquos Law W(k)frac14Ck2
(Zipf 1935 1949) Among other WFDrsquos MPL is also tested for severalEnglish literary classics (Lewis Carroll HG Wells Conan Doyle) alarge corpus of about 66 106 words in English and a Dutch text Thesample size varies from 25000 to 100000 in most cases For most textsg 20 and m is in the range [0 1] Baayen refers to MPL as Naranan-Balasubrahmanyan-Zipf (NBZ) distribution A CD ROM accompanyingthe book has several computer programs including one to fit the NBZdistribution to the observed WFD (spectfit)Notice the close resemblance between MPL (Equation (12)) and
CMPL (Equation (11b)) Our model was first used to derive the MPLand then extended to CMPL A natural language text can be consideredas a string of symbols of different kinds When the symbols are words(vocabulary) we have the MPL for the WFD of word-types The numberof word-types grows with the size N of the text When the symbol set isthe alphabet phonemes or S-words the number of symbols V isconstant independent of N In such cases we deal with the RFD ofsymbols which is well fit by the CMPL For alphabet and phonemesV 20ndash40 and for S-words in English Vfrac14 71 (BN 1996)
354 S NARANAN
Dow
nloa
ded
by [
S N
aran
an]
at 2
245
21
Nov
embe
r 20
11
Zipfrsquos Law is valid for many European languages however it has notbeen tested for Indian languages presumably because the word types aredifficult to identify in a computer-based automatic analysis of wordfrequencies Therefore the letters of the alphabet as symbols are suitablefor analysis of rank frequencies Their number is fixed and small (20ndash40)CMPL for rank frequency distribution of letters is the equivalent ofMPL (NBZ) for word frequency distribution
6 ENTROPIES OF TAMIL TEXTS
In Shannonrsquos Information theory (Shannon 1948) entropy or informa-tion is defined for a string of symbols as follows
Hs frac14 Xn
ifrac141Pi lgPi eth13THORN
Here Pi4 0 (ifrac14 1 2 3 n) (S Pifrac14 1) are the probabilities ofoccurrence of the n symbols and lg is logarithm to base 2 Shannonentropy Hs has a very practical application for communication it is theminimum average binary code length per symbol required for efficientcommunication The code length of a symbol is determined by itsprobability most frequently occurring symbols have short codes and theleast frequent ones have long codes The actual code assignments can bedetermined from Pi using an elegant algorithm by Huffman (1952) For adiscussion of the relationship between entropy information andcomplexity see Balasubrahmanyan and Naranan (2005)Siromoney (1963) calculated the entropy of Tamil prose (MOD) as
Hsfrac14 434 bits and gave the code assignments for different symbols Wehave determined Hs for TAM as 4428 bits and the code assignments aregiven in Table 1 (last col) The average Huffman code length is 4460close to Hs Information theory guarantees that this is the best possiblecode
7 DISCUSSION AND SUMMARY
For strings with a small symbol set the rank frequency distribution(RFD) is the basic data from which all the quantitative estimates of
HISTORICAL LINGUISTICS AND EVOLUTIONARY GENETICS 355
Dow
nloa
ded
by [
S N
aran
an]
at 2
245
21
Nov
embe
r 20
11
parameters described have been determined For a given string RFD ofsymbols can be described by CMPL with two parameters n and d Thereare indications that only one of them is an independent parameter If thechosen text is a randomized sample of the whole text it is to be expectedthat n d will be independent of sample size N Since n d vary widely fromtext to text they may serve as signatures to distinguish different texts(Section 5) The range of variation is greater in DNA sequencescompared to language textsThe difference in the ranks of a symbol in two strings is used to define a
lsquolsquodistancersquorsquo between the two strings Note that this does not depend onany model such as CMPL for RFD of symbols it is based on rawfrequency data and a very intuitive concept of Euclidean distancegeneralized to n dimensions (n is the total number of symbols) Anoteworthy feature is that only the difference in the ranks are used andnot the ranks themselves eg a symbol with ranks 3 and 4 in two textscontributes the same distance as a symbol with ranks 20 and 21 therebygiving equal weights to all symbols irrespective of their probability ofoccurrence The angular separation between the two strings (DNAsequences or Tamil texts) shows good correlation with their agedifference indicating that the method is a promising tool in evolutionarygenetics and historical linguistics This is illustrated by deriving anevolutionary binary tree from the distance matrix using a tree algorithmTrees for five ancient Tamil texts and six mammalian species are broadlyin agreement with known facts from history of literary texts andevolution of speciesThe RFD of symbols in strings is a tool with interesting potential in
evolutionary studies with possibilities of refining the technique for betterresults By including strings of known age (texts or DNA species) one cancalibrate the time scale involved One might ask why such a correlationbetween distance and age is to be expected In the case of DNAsequences mutations of the four bases of DNA cause the relative codonfrequencies to change with time and accumulate at a rate related to theaverage rate of mutation (estimated as about 1 in 100000 years)Similarly in Tamil texts as word usage changes over historical timesconnected changes occur in the relative frequencies of letters of thewords Such changes also accumulate in time showing a net positivecorrelation between distance and age The heartening aspect of this typeof analysis is that string sizes (genes literary texts) can be sufficientlylarge to yield parameter estimates of high statistical accuracy In this
356 S NARANAN
Dow
nloa
ded
by [
S N
aran
an]
at 2
245
21
Nov
embe
r 20
11
respect mtDNA suffers in comparison to nuclear DNA since mtDNArsquosare short in length But mtDNA is preferred for evolutionary studiessince it is inherited only from the mother It will be interesting tocompare evolutionary histories of individual genes conserved over longperiods of evolution from gene to gene and from mtDNA to nuclearDNA For the choice of symbol one has 64 codons or 20 aminoacidsthorn STOP symbol (21 symbols) Evolutionary tree from a distancematrix based on RFD of symbols can complement other evidence egfossil linguistic and anthropological evidence
ACKNOWLEDGMENT
I thank my daughter Gomathy Naranan for a careful reading of the paper and valuablesuggestions
REFERENCES
Baayen R H (2001) Word frequency Distributions Dordrecht Kluwer AcademicPublishers
Balasubrahmanyan V K amp Naranan S (1996) Quantitative linguistics and complexsystem studies Journal of Quantitative Linguistics 3 177ndash228
Balasubrahmanyan V K amp Naranan S (2000) Information theory and algorithmiccomplexity Applications to language discourses and DNA sequences as complexsystems Part II Complexity of DNA sequences analogy with linguistic discoursesJournal of Quantitative Linguistics 7 153ndash183
Balasubrahmanyan V K amp Naranan S (2002) Algorithmic information complexityand Zipf00s law Glottometrics 4 1ndash26
Balasubrahmanyan V K amp Naranan S (2005) Entropy information and complexityIn R Kohler G Altmann amp R G Piotrowski (Eds) An International Handbook ofQuantitative Linguistics (Chap 61 pp 878ndash891) Berlin New York Walter deGruyter
Ewens W J amp Grant G R (2001) Statistical Methods in Bioinformatics ndash anIntroduction Berlin New York Springer Verlag
Huffman D A (1952) A method for the construction of minimum redundancy codesProceedings of the Institute of Radio Engineers 40 1098ndash1101
Kazusa (2004) Codon Usage Tables Retrieved January 24 2004 from httpwwwkasuzaorjpcodon
Keeping E S (1962) Introduction to Statistical Inference New York van NostrandNaranan S amp Balasubrahmanyan V K (1992a) Information theoretic models in
statistical linguistics ndash Part I A model for word frequencies Current Science 63261ndash269
HISTORICAL LINGUISTICS AND EVOLUTIONARY GENETICS 357
Dow
nloa
ded
by [
S N
aran
an]
at 2
245
21
Nov
embe
r 20
11
Naranan S amp Balasubrahmanyan V K (1992b) Information theoretic models instatistical linguistics ndash Part II Word frequencies and hierarchical structure inlanguage ndash statistical tests Current Science 63 297ndash306
Naranan S amp Balasubrahmanyan V K (1993) Information theoretic model forfrequency distribution of words and speech sounds (phonemes) in languageJournal of Scientific and Industrial Research 52 728ndash738
Naranan S amp Balasubrahmanyan V K (1998) Models for power law relations inlinguistics and information science Journal of Quantitative Linguistics 5 35ndash61
Naranan S amp Balasubrahmanyan V K (2000) Information theory and algorithmiccomplexity Applications to language discourses and DNA sequences as complexsystems Part I Efficiency of the genetic code of DNA Journal of QuantitativeLinguistics 7 129ndash152
Naranan S amp Balasubrahmanyan V K (2005) Power laws in statistical linguistics andrelated systems In R Kohler G Altmann amp R G Piotrowski (Eds) AnInternational Handbook of Quantitative Linguistics (Chap 50 pp 716ndash738) BerlinNew York Walter de Gruyter
Naranan S amp Balasubrahmanyan V K (2006) Statistical analogs in DNA sequencesand Tamil language texts Rank frequency distribution of symbols and theirapplication to Evolutionary Genetics and Historical Lnguistics Festschrift in honorof Professor G Altmann on his 75th birthday (pp 483ndash496) Berlin New YorkWalter de Gruyter
Shannon C E (1948) A mathematical theory of communication I II Bell SystemTechnical Journal 27 379ndash423 623ndash656 Reprinted in Shannon C E amp WeaverW (1949) The Mathematical Theory of Communication Urbana University ofIllinois
Siromoney G (1963) Entropy of Tamil Prose Information and Control 6 297ndash300Wada K Wada Y Ishibashi F Gojobori T amp Ikemura T (1992) Codon usage
tabulated from the GenBank genetic sequence data Nucleic Acids Research 202111ndash2118
World Classical Tamil Conference 2010 Retrieved July 29 2010 from httpenwikipediaorgwikiWorld_Classical_Tamil_Conference_2010
Zipf G K (1935) The psychobiology of language New York Houghton Mifflin CoReprinted (1968) Cambridge MIT Press
Zipf G K (1949) Human Behavior and the Principle of Least Effort Reading Addison-Wesley
358 S NARANAN
Dow
nloa
ded
by [
S N
aran
an]
at 2
245
21
Nov
embe
r 20
11
Naranan S amp Balasubrahmanyan V K (1992b) Information theoretic models instatistical linguistics ndash Part II Word frequencies and hierarchical structure inlanguage ndash statistical tests Current Science 63 297ndash306
Naranan S amp Balasubrahmanyan V K (1993) Information theoretic model forfrequency distribution of words and speech sounds (phonemes) in languageJournal of Scientific and Industrial Research 52 728ndash738
Naranan S amp Balasubrahmanyan V K (1998) Models for power law relations inlinguistics and information science Journal of Quantitative Linguistics 5 35ndash61
Naranan S amp Balasubrahmanyan V K (2000) Information theory and algorithmiccomplexity Applications to language discourses and DNA sequences as complexsystems Part I Efficiency of the genetic code of DNA Journal of QuantitativeLinguistics 7 129ndash152
Naranan S amp Balasubrahmanyan V K (2005) Power laws in statistical linguistics andrelated systems In R Kohler G Altmann amp R G Piotrowski (Eds) AnInternational Handbook of Quantitative Linguistics (Chap 50 pp 716ndash738) BerlinNew York Walter de Gruyter
Naranan S amp Balasubrahmanyan V K (2006) Statistical analogs in DNA sequencesand Tamil language texts Rank frequency distribution of symbols and theirapplication to Evolutionary Genetics and Historical Lnguistics Festschrift in honorof Professor G Altmann on his 75th birthday (pp 483ndash496) Berlin New YorkWalter de Gruyter
Shannon C E (1948) A mathematical theory of communication I II Bell SystemTechnical Journal 27 379ndash423 623ndash656 Reprinted in Shannon C E amp WeaverW (1949) The Mathematical Theory of Communication Urbana University ofIllinois
Siromoney G (1963) Entropy of Tamil Prose Information and Control 6 297ndash300Wada K Wada Y Ishibashi F Gojobori T amp Ikemura T (1992) Codon usage
tabulated from the GenBank genetic sequence data Nucleic Acids Research 202111ndash2118
World Classical Tamil Conference 2010 Retrieved July 29 2010 from httpenwikipediaorgwikiWorld_Classical_Tamil_Conference_2010
Zipf G K (1935) The psychobiology of language New York Houghton Mifflin CoReprinted (1968) Cambridge MIT Press
Zipf G K (1949) Human Behavior and the Principle of Least Effort Reading Addison-Wesley
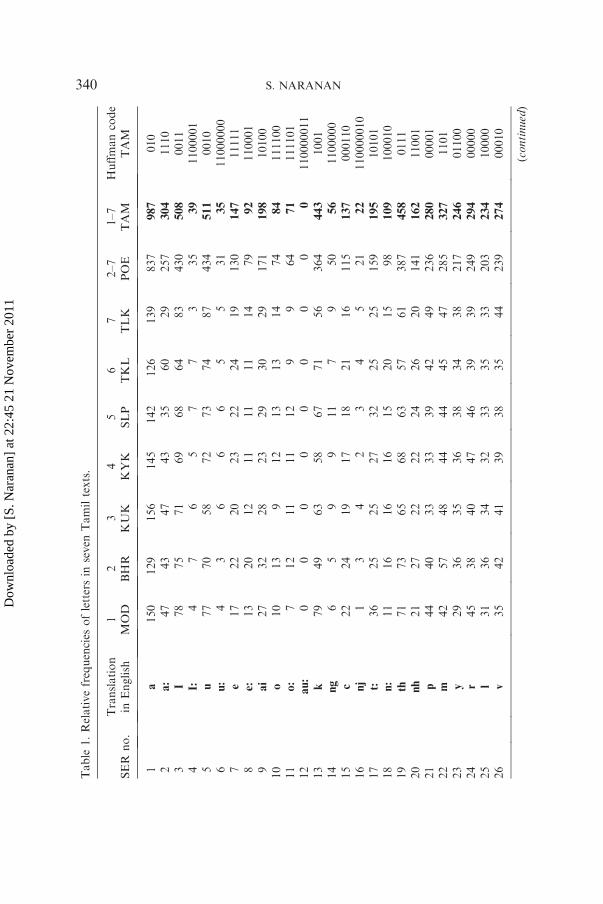
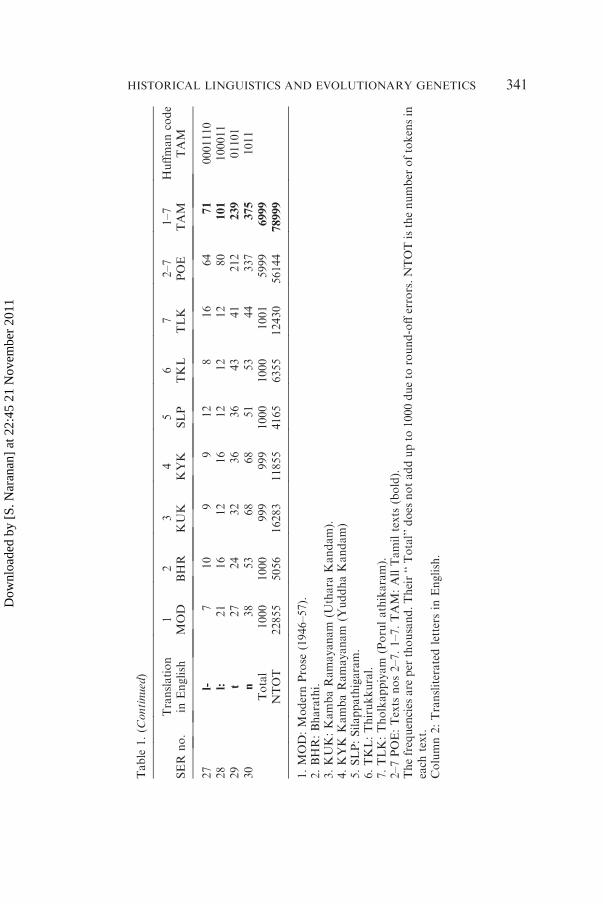
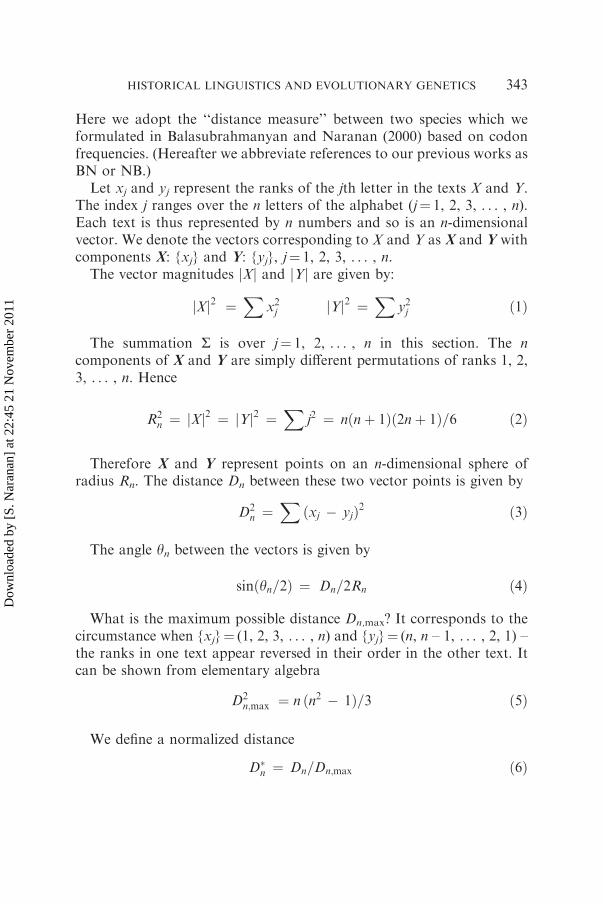
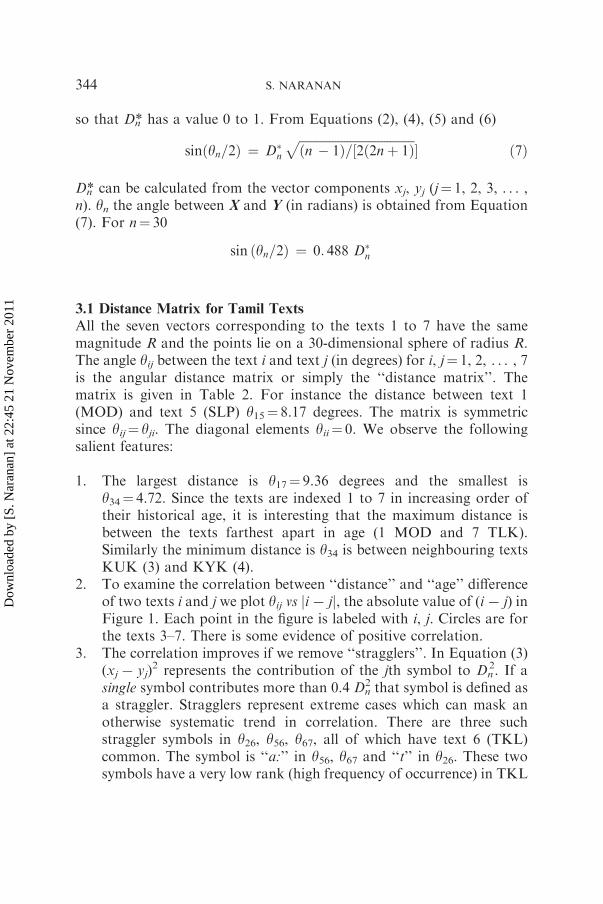
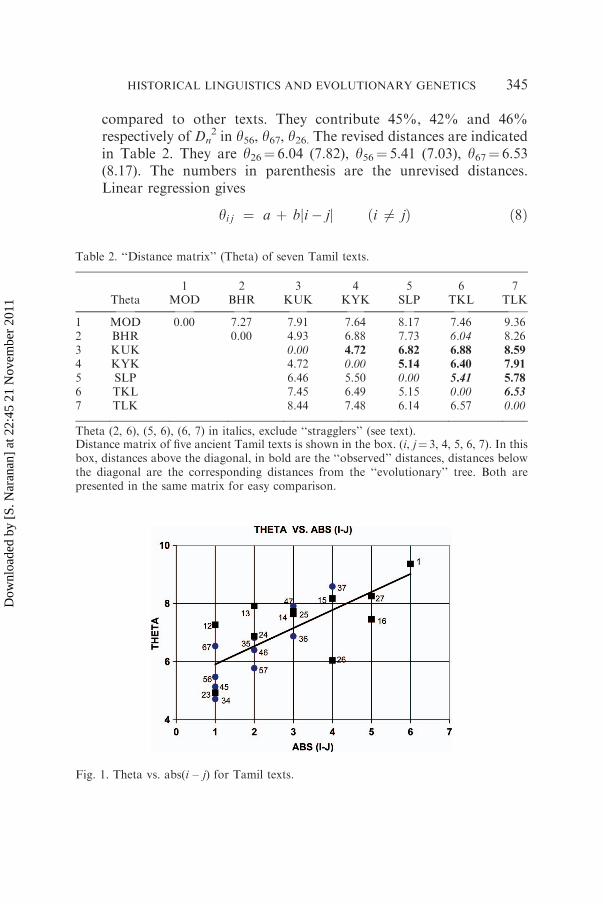
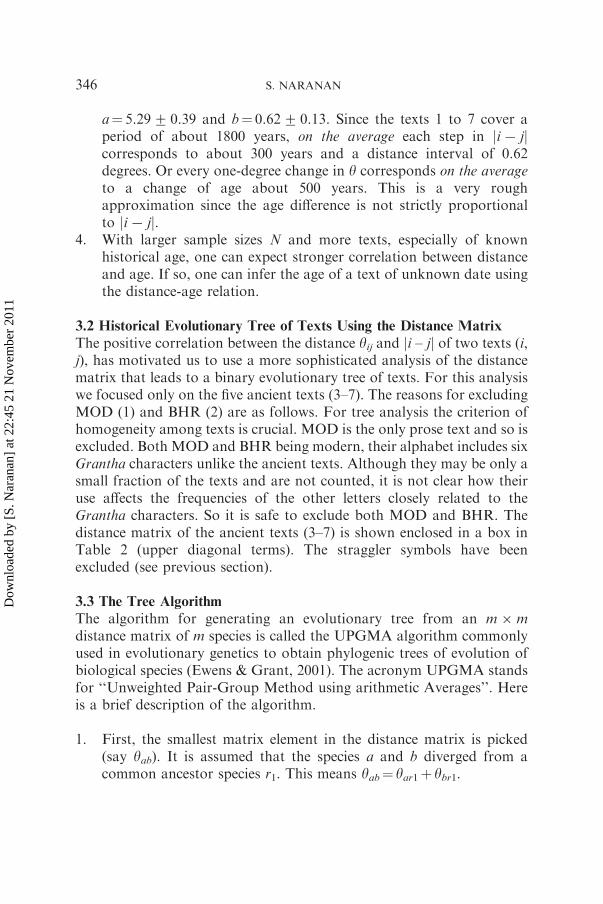
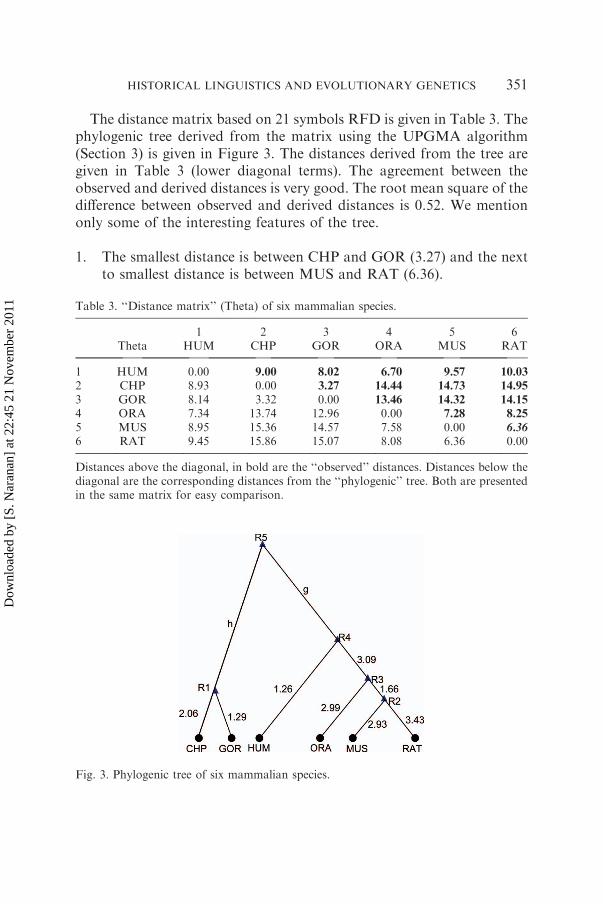
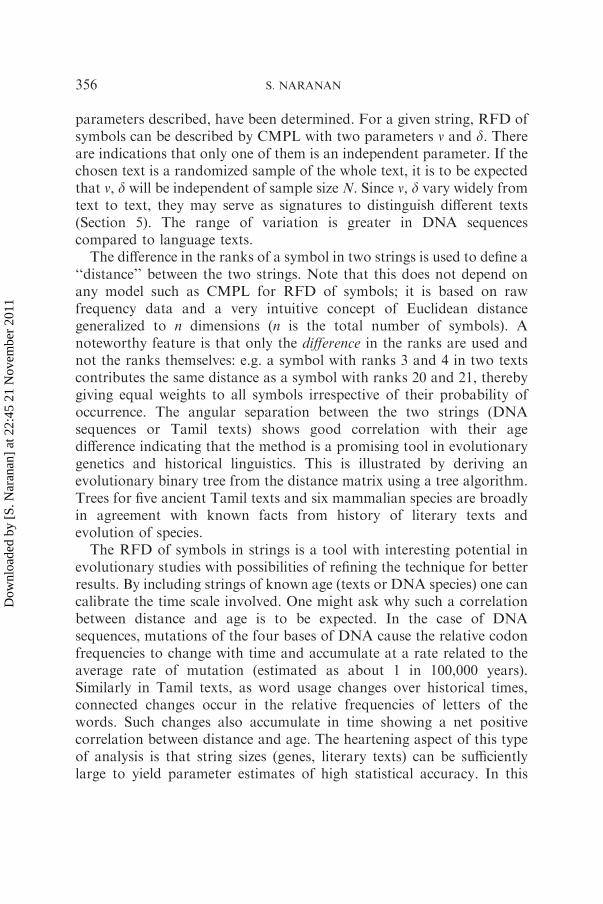


![Russian - WordPress.com · Consonants are sounds like [p], [t], [k]. Russian has two different types of consonants: hard consonants and soft consonants. Soft consonants are palatalized,](https://static.documents.pub/doc/80x56/5e84e2ae62d17d5e877582b0/russian-consonants-are-sounds-like-p-t-k-russian-has-two-different-types.jpg)

