HISTORICAL RESEARCH REPORT Research Report TM/88/18 1989 Hearing abilities of a group of mineworkers in relation to their age and estimated noise exposures Final report Robertson A, Howie RM, Maclaren WM, Dodgson J, Garland RP, Afacan AS, Jones K, Wood N, Bellamy M, Fisher P
Transcript
HISTORICAL RESEARCH REPORTResearch Report TM/88/18
1989
Hearing abilities of a group of mineworkers in relation to their age and estimated noise exposures Final report Robertson A, Howie RM, Maclaren WM, Dodgson J, Garland RP, Afacan AS, Jones K, Wood N, Bellamy M, Fisher P
Hearing abilities of a group of mineworkers in relation to their age and estimated noise exposures Final
report
Robertson A, Howie RM, Maclaren WM, Dodgson J, Garland RP, Afacan AS, Jones K, Wood N, Bellamy M, Fisher P
This document is a facsimile of an original copy of the report, which has been scanned as an image, with searchable text. Because the quality of this scanned image is determined by the clarity of the original text pages, there may be variations in the overall appearance of pages within the report. The scanning of this and the other historical reports in the Research Reports series was funded by a grant from the Wellcome Trust. The IOM’s research reports are freely available for download as PDF files from our web site: http://www.iom-world.org/research/libraryentry.php
HISTORICAL RESEARCH REPORTResearch Report TM/88/18
1989
ii Research Report TM/88/18
Report No. TM/88/18UCD 613.644:622
HEARING ABILITIESOF A GROUP OFMINEWORKERS INRELATION TO THEIRAGE AND ESTIMATEDNOISE EXPOSURES
HEARING ABILITIES OF A GROUP OF MINEWORKERS INRELATION TO THEIR AGE AND ESTIMATED NOISE EXPOSURES
by
A Robertson, RM Howie, WM Maclaren, J Dodgson, RP Garland,AS Afacan1, K Jones2, N Wood2, M Bellamy2, P Fisher1
FINAL REPORT
1 British Coal Corporation Medical Services
2 British Coal Corporation Scientific Control
Institute of Occupational Medicine8 Roxburgh PlaceEDINBURGHEH8 9SU
Tel: 031 667 5131Telex: 9312100237 =TD G January 1989
This report is one of a series of Technical Memoranda (TM) published by theInstitute of Occupational Medicine. Current and earlier lists of these reports, andof other Institute publications, are available from the Librarian/Information Officerat the address overleaf.
For further information about the Institute's facilities for research,service/consultancy and teaching please contact the Librarian/Information Officer inthe first instance.
CONTENTS
Page No.
SUMMARY 1
1. INTRODUCTION 3
2. PRELIMINARY INVESTIGATIONS OF THE RELATIONSHIPSBETWEEN MEASURED AND ESTIMATED NOISE EXPOSURE 5
3. METHODS 7
3.1 Noise measurements available for study 7
3.2 Formation of Noise Occupational Groups 7and Assignment of sound Pressure Levels (Leq)
3.3 Calculation of Noise Exposures 8
3.4 Audiometry 9
3.5 Statistical Methods 10
4. RESULTS 13
4.1 Noise Levels and Exposures 13
4.2 Hearing Levels of Mineworkers at Colliery Q 13
4.3 Hearing Levels by Age and Noise Exposure 15
4.4 Hearing Performance of Left and Right Ears 15
5. DISCUSSION 17
6. CONCLUSIONS 21
ACKNOWLEDGEMENTS 23
REFERENCES 25
TABLES 27
FIGURES 41
APPENDICES
INSTITUTE OF OCCUPATIONAL MEDICINE
HEARING ABILITIES OF A GROUP OF MINEWORKERS IN RELATION TOTHEIR AGE AND ESTIMATED NOISE EXPOSURES
by
A Robertson, RM Howie, WM Maclaren, J Dodgson, RP Garland,AS Afacan, K Jones, N Wood, M Bellamy, P Fisher
SUMMARY
Using existing noise level measurements, detailed working records of individualminers and data on hearing abilities supplied by British Coal Medical Services, thehearing abilities of colliery Q coalmine workers have been investigated in relationto their age and noise exposure.
Noise levels in colliery Q were typical of those found in the British Coal Industry.The individual mean lifetime exposures (average Leq) to noise were found to liebetween 86 and 93 dB(A) with 83% of men exposed on average between 88 and91 dB(A). The hearing levels of the colliery Q miners were, however, found tobe similar to predicted from typical age-matched, non-noise exposed populations.These differences are not readily explicable from the data available and requirefurther investigation. There was no significant correlation, after allowing for age,of hearing level with noise exposure amongst a subset of 197 men whose estimatedlifetime noise exposure was well defined. In view of the forthcoming noisecontrol regulations and the fact that we do not know whether colliery hearinglevels of Q men are fully representative of the UK coal industry we recommendthat a further cross-sectional study is undertaken to investigate hearing levelsamongst miners from a number of collieries in relation to age.
1. INTRODUCTION
The relationship between hearing ability, age and occupational noise exposure hasbeen studied in detail (BAUGHN, 1973; ISO, 1974; ISO, 1985; BURNS andROBINSON, 1970) and this work has been used as a basis for legislation tocontrol occupational noise exposure. Current and proposed UK legislation restrictspersonal exposures to equivalent continuous sound levels (Leq) of 90 dB(A) over aneight hour working shift (FACTORIES, 1974; HSC, 1987). Noise exposure levelsin the British coal industry have been found to be around that level during mostwork activities (JONES, 1986; LANCASTER, 1986; JONES, 1988) but limitedstudies of hearing loss amongst selected mineworkers have revealed that hearing lossat low frequencies and social disability were considerably less than expected fromsuch noise exposures (DICK, 1975; DICK and COLEMAN, BRITISH COALINTERNAL REPORT 1979). It was therefore considered that an epidemiologicalstudy of noise exposure and hearing loss in the coal industry should be carried outto ascertain whether the effects of age and noise exposure on the hearing abilitiesof mineworkers were consistent with those predicted from the data upon whichcurrent legislation is based.
There are, however, difficulties in carrying out such a study, particularly associatedwith the measurement of personal noise exposure levels and the calculation of longterm noise exposures. LANCASTER (1986) and McCORMICK (1987) described adetailed study of personal noise exposures using dosemeters at three collieries overa period of six months starting in 1983. There were two main conclusionsregarding noise exposure measurement strategy:
(1) Direct measurement of individual coalminers1 long term exposure to noiseis impracticable if reasonable accuracy is to be achieved;(2) Noise exposures can be calculated from static sound pressure levelmeasurements in favourable circumstances but the amount of detailed informationrequired renders it unlikely that such calculations could be sensibly carried outthroughout the UK coal industry.
However, one of the collieries, colliery Q (referred to as colliery L in bothLancaster's and McCormick's papers), offered a unique opportunity for furtherstudy. Mining methods and the colliery population had remained relatively stablefor many years. It had been one of the Pneumoconiosis Field Research (PFR)collieries (HURLEY et al., 1982) and, as part of that research, detailed records ofthe working histories of each man who worked at the colliery between 1955 and1985 were available. Extensive studies of noise exposures and sound pressurelevels had been made between 1974 and 1985 by both British Coal ScientificDepartment and the Institute of Occupational Medicine. An audiometric survey ofthe colliery Q workforce was carried out by British Coal Medical Services in 1986.
This report describes a study designed to assess the hearing levels of coalminers atcolliery Q in relation to age and noise exposure. It was restricted to theexamination and analysis of existing information and the results are presented inthis report together with details of the comparisons of measured and estimatednoise exposures described by McCORMICK (1987) which were used as a feasibilitystudy for the present work. The specific aims of this research were to:
(i) estimate lifetime occupational noise exposures of colliery Q coalminers forwhom audiometric measurements were available;
(ii) compare the hearing abilities of colliery Q workers with those predicted onthe basis of their age and estimated noise exposure;
(iii) examine the relationships between hearing level and noise exposure aftertaking account of age.
2. PRELIMINARY INVESTIGATIONS OF THERELATIONSHIPS BETWEEN MEASURED AND ESTIMATED NOISE
EXPOSURES
Between September 1983 and March 1984 British Coal Scientific Departmentmeasured the noise exposures of 10 colliery Q mineworkers (LANCASTER, 1986).Before the start of the present study a short investigation was carried out todetermine whether these measured noise exposures corresponded with estimatednoise exposures based on Scientific Department Noise Zone Measurements andPneumoconiosis Field Research (PFR) manpower records (McCORMICK, 1987).
The occupational noise exposures of the 10 men were measured continuously usingpersonal sampling techniques between September 1983 and March 1984. Theseexposures were expressed as a six month cumulative Leq.
Employment records of the 10 individuals were extracted from the PFR attendancerecords (Section 3.2). The numbers of shifts attended by each man and theoccupational groups the individuals were assigned are given in Table 2.1 Eachoccupational group was divided into a series of work activities and the noise levelsassociated with the activities obtained from the Scientific Control Noise ZoneMeasurements (see Section 3.1). Fractional doses and 8 hour Leq's wereestimated using the formulae given in Section 3.2. An example of thecalculation of an 8 hour Leq for one occupational group (face officials) from workactivities and fractional exposures is given in Table 2.2 Appendix 1 gives thisinformation for the other nine occupations involved.
The measured and estimated noise exposures, expressed as Leq's, are compared inTable 2.3 In general, agreement is good with exposure estimates being similar tothe measured values. There are, of course, a number of discrepancies, thelargest of which was associated with the mobile electrician. This individualworked considerable overtime and no record of this was kept in the PFRmanpower record system. There were, however, no systematic differences betweenthe measured and calculated Leq's.
These men covered a wide range of coalmine occupations and it was concludedfrom this preliminary study that reasonable estimates of long term exposures tonoise could be made from the PFR attendance records, Scientific Control NoiseZone Measurements (supplemented by other available noise measurement data asrequired) and a detailed knowledge of the work activities associated with eachoccupational group.
3. METHODS
3.1 Noise measurements available for study
Noise levels at colliery Q colliery were monitored by the Institute of OccupationalMedicine and Scientific Department between 1973 and 1975. Routinemeasurements of noise have been made by Area Staff from 1982 to enable noisezones to be defined. Sound pressure level measurements were made by ScientificDepartment in 1974 when a Bruel and Kjaer (B&K) 2209 precision grade SoundLevel Meter (SLM) was used on the surface and a Dawe 1419B industrial gradeSLM was used for underground measurements. All Institute measurements weremade using a B&K 2206 precision grade SLM. The Routine Noise Zonemeasurements have been made using Dawe 1405C industrial grade SLM's.
To calculate the noise exposures associated with some occupations (see below) itwas necessary to obtain noise data from machines for which no in situmeasurements were available at colliery Q. Information on noise emissions fromthese machines was supplied by Scientific Department from measurements made atother collieries around the country.
3.2 Formation of Noise Occupational Groups andAssignment of Sound Pressure Levels (Leq)
The attendance record system used in the Pneumoconiosis Field Research at collieryQ was maintained from 1955 to 1985. It was based on a series of occupationalgroups (OG's) which enabled workers' working histories to be charted for thepurpose of calculating dust exposure. Individuals were assigned to occupationalgroups from information given in colliery time sheets. The records were updatedweekly until 1981. Thereafter, quarterly summaries were recorded.
Occupational Groups were defined to satisfy the needs of a dust researchprogramme and consequently required modification for use in noise exposurestudies. Each OG comprised men with nominally similar dust exposures whocarried out similar work. Face workers were classified according to theiroccupation and the face in which they worked. Workers elsewhere undergroundand on the surface were grouped simply by the type of work they carried out.
In the present study all dust occupational groups have been reclassified in terms ofnoise occupational groups. In the first place noise occupational groups whichconsisted of men carrying out similar work using similar machinery were formedfrom the dust OGs. These noise groups were further split to allow for travellingtime. colliery Q operated an extensive diesel hauled locomotive system in theHigh Main Seam. Travelling times reached a maximum of 92 minutes for thereturn journey. To allow for the effect on the shift pattern all OG's which werelocation specific were categorised into one of four noise sub-groups dependent onthe length of travel involved and an average time allocated for travel. Thesub-groups were:
00 - No Man-rider travel e.g. pitbottom groups or <10 minutes - groups ofmen working at Waterloo, Low Bright, Main Bright plus some High Hazlegroups.
01 - 6 km return trip. Time allocation 23 minutes.
02 - 6-12 km return trip. Time allocation 46 minutes.
03 - + 12 km return trip. Time allocation 77 minutes.
Groups which were not specific in location were allocated to group 02.
For the purposes of deriving the 8 hour Leq for each occupational group theworking shift was divided into series of time periods believed to be representativeof a normal work pattern. No allowance was made for breakdowns or otherstanding time but travelling time was included. A sound pressure level wasassigned to each period from the mean of all relevant noise measurements (Section3.1). Appendix 1 gives examples for those occupations concerned in thepreliminary work. The fractional dose (f) for each period was calculated fromthe following formula (DEPARTMENT OF EMPLOYMENT, 1972)
f = t/g antilog 0.1 (L - 90)where t = Time of period in hours
L = sound pressure level dB(A)
The sum of the fractional doses gave the 8 hour Leq by the relationship:
Leq = 90 + 10 Iog10
3.3 Calculation of Noise Exposures
PFR working histories of the individuals being studied were restated in terms oftime in each noise occupational group. Using the values of Leq assigned to eachnoise occupational group and the noise working histories an average Leq(Leqave)was calculated for each individual from the following expression:
r r nI iLeq j - 90lI £T j x ant i 1 og, Q | |I I I
Leqave=90 + 10 log, 0 I l 10 JIII J^i
where T; time (yr) in OGf, Leqj is Leq in OGj.
For the purposes of investigating relationships between hearing level and noiseexposure, noise immission levels (NIL) were also calculated for each man using theequation
NIL = Lea ,̂ + 10 log,0 (T)
where T = exposure period in years.
Exposures were calculated for all men who had worked for more than 75% oftheir working life from the age of 18 and more than two years at colliery Q.
3.4 Audiometry
Audiometry was carried out by British Coal Medical Services between October andDecember 1986 using a mobile 4 booth audiometry unit. Scientific Departmenttested the site for noise which was found to meet standard requirements (HSE,1978).
Before the survey the Colliery Manager wrote to each employee inviting him toattend the survey. Any man not wishing to attend returned a form indicating hisrefusal. Those wishing to be tested were given appointments by the SafetyOfficer on a daily basis. A total of 765 persons out of the mine population of878 was surveyed.
Approximately five minutes "training/ familiarisation* was given to each group priorto audiometry. At administration each man was asked whether he workedunderground or on the surface. He was also asked whether the test was beingcarried out before, after or mid shift.
The audiometers were calibrated immediately prior to the survey and were found tomeet specifications at the end of the study.
Testing was carried out with four, three or two patients per session. Selfrecording 'Bekesy' audiometry was carried out using Peters equipment. Eightfrequencies per ear were tested - the left ear first. A final check was thenautomatically carried out to re-check 1kHz in the left ear.
All individuals were categorised according to the HSE (1978) categories (Tables 3.1and 3.2). Those men categorised 5 (normal) were informed that their hearingwas normal. Men with Category 4 (warning), Category 3 (referral) or Category 2(one sided loss - unilateral) received a letter requesting them to see the NursingOfficer - who examined the ears, syringed where necessary, and completed aquestionnaire (Figure 3.1) for each man. (On at least one occasion a manrefused to complete the questionnaire). A total of 216 questionnaires werecompleted.
Following this clinical examination men in Category 4 were sent a 'warning' letterand no further action was taken. Men in Categories 2 and 3 were asked toattend for a further hearing test. For men whose ears had been syringed thiswas at least 48 hours later.
10
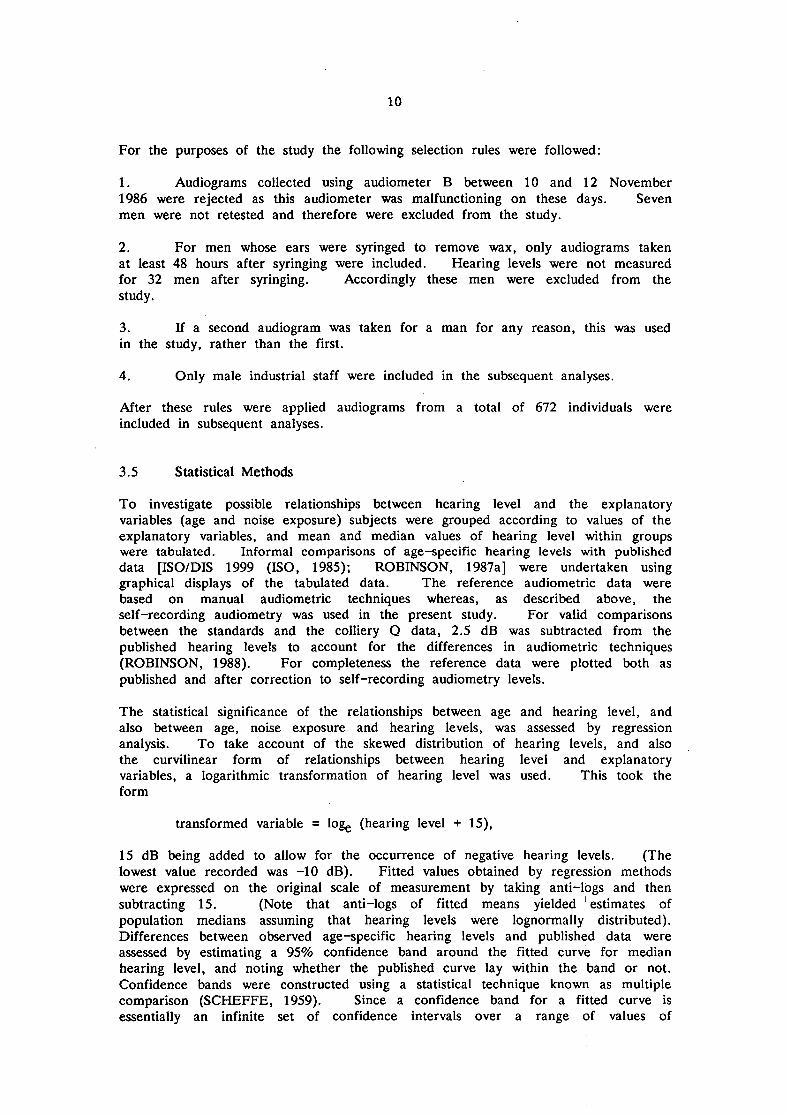
For the purposes of the study the following selection rules were followed:
1. Audiograms collected using audiometer B between 10 and 12 November1986 were rejected as this audiometer was malfunctioning on these days. Sevenmen were not retested and therefore were excluded from the study.
2. For men whose ears were syringed to remove wax, only audiograms takenat least 48 hours after syringing were included. Hearing levels were not measuredfor 32 men after syringing. Accordingly these men were excluded from thestudy.
3. If a second audiogram was taken for a man for any reason, this was usedin the study, rather than the first.
4. Only male industrial staff were included in the subsequent analyses.
After these rules were applied audiograms from a total of 672 individuals wereincluded in subsequent analyses.
3.5 Statistical Methods
To investigate possible relationships between hearing level and the explanatoryvariables (age and noise exposure) subjects were grouped according to values of theexplanatory variables, and mean and median values of hearing level within groupswere tabulated. Informal comparisons of age-specific hearing levels with publisheddata [ISO/DIS 1999 (ISO, 1985); ROBINSON, 1987a] were undertaken usinggraphical displays of the tabulated data. The reference audiometric data werebased on manual audiometric techniques whereas, as described above, theself-recording audiometry was used in the present study. For valid comparisonsbetween the standards and the colliery Q data, 2.5 dB was subtracted from thepublished hearing levels to account for the differences in audiometric techniques(ROBINSON, 1988). For completeness the reference data were plotted both aspublished and after correction to self-recording audiometry levels.
The statistical significance of the relationships between age and hearing level, andalso between age, noise exposure and hearing levels, was assessed by regressionanalysis. To take account of the skewed distribution of hearing levels, and alsothe curvilinear form of relationships between hearing level and explanatoryvariables, a logarithmic transformation of hearing level was used. This took theform
transformed variable = logg (hearing level + 15),
15 dB being added to allow for the occurrence of negative hearing levels. (Thelowest value recorded was -10 dB). Fitted values obtained by regression methodswere expressed on the original scale of measurement by taking anti-logs and thensubtracting 15. (Note that anti-logs of fitted means yielded 'estimates ofpopulation medians assuming that hearing levels were lognormally distributed).Differences between observed age-specific hearing levels and published data wereassessed by estimating a 95% confidence band around the fitted curve for medianhearing level, and noting whether the published curve lay within the band or not.Confidence bands were constructed using a statistical technique known as multiplecomparison (SCHEFFE, 1959). Since a confidence band for a fitted curve isessentially an infinite set of confidence intervals over a range of values of
11
explanatory variables, the usual methods based on Student's "t" are notappropriate. Scheffe's method uses a statistic based on the "F" distribution. Inthis case, the band is at a distance of 2.45 standard deviations from the fittedcurve, instread of 1.96.
Further informal comparisons were made of the numbers of men in each age bandcategorised as Categories 3 or 4, as defined by HSE (1978) guidelines, with thosepredicted from the ISO/DIS 1999. The numbers of men whose mean hearinglevels for both ears at 1, 2 and 3 kHz exceeded nominal 30 and 50 dB as definedby HEALTH AND SAFETY COMMISSION (HSC, 1987) were also determined.
12
13
4. RESULTS
4.1 Noise Levels and Exposures
The 8 hour Leq's assigned to the noise occupational groups are summarised inFigure 4.1. Details of the nature of the various occupational groups togetherwith their assigned Leq's are given in Appendix 2.
All assigned Leq's lay between 84 and 96 dB(A) with 70% between 89 and 92dB(A). The highest noise levels were assigned to screens operators, diesellocomotive drivers, borers and Gleithobel plough operators. These results aresimilar to those found in other British collieries (JONES, 1988).
Noise exposures were calculated for 197 men. These men had worked at leasttwo years and at least 75% of their working lives from the age of 18 to the dateof audiometry at colliery Q. Men with known exposure to over 1000 rounds ofgunfire or military service were excluded. Men with ear pathology were included.
The average noise exposures are summarised in Figure 4.2. These lay within anarrow band of noise levels [86 - 92.8 dB(A)] with 83% between 88 and 91dB(A) and estimated cummulative noise exposures were highly associated withlength of service in colliery Q.
4.2 Hearing Levels of Mineworkers at Colliery Q
Table 4.1 shows the frequency distribution of the ages of 665 of the 672 subjectsat the time of audiometric testing (October to December 1986). The mean agewas 36.6 years, the standard deviation 8.8 (for seven men the subject's age wasnot recorded).
4.2.1 Comparisons with ISO/DIS 1999
Valid ages were available for 665 of the 672 men included in this part of thestudy. These men were divided into six five year age bands (20-24, 25-29,30-34, 35-39, 40-44 and 45-49) for the purposes of comparing hearing levels withthose predicted in ISO/DIS 1999. Four men aged between 19.8 and 20 wereincluded in the 20-24 age band. The eleven men over 50 were excluded fromthe graphical comparisons described below although they were included in thesubsequent regression analyses.
Figures 4.3 to 4.8 show median hearing levels (better ear) for each age grouptogether with upper and lower quartiles and the maximum and minimum, plottedagainst the mean age for the group. Predicted median hearing levels published indocument ISO/DIS 1999 and the predicted median hearing levels corrected forautomatic audiometry are also shown for non-noise exposed persons and personsexposed at 90 dB(A). (The data on which these graphs are based are given inTable 1, Appendix 3 and Table 1, Appendix 4). Each figure corresponds to adifferent frequency. At each frequency, observed medians lie below thosepredicted. Regression analysis showed that these differences were significant atthe 5% level. The 95% confidence bands for the (hypothetical) populationmedian hearing level for colliery Q men, plotted with observed medians and
14
ISO/DIS productions, are shown in Figures 4.9 to 4.14. The regression modelexplains between 4.3% and 33% of the variation in hearing level according to thefrequency. Figures 4.15 - 4.18 show median hearing levels (mean of both ears),upper and lower quartiles and the maximum and minimum also plotted against themean age of each group. These figures show the median hearing levels predictedby ROBINSON (1987a), both as published and corrected for automatic audiometry.The observed levels were similar to but slightly lower than those predicted byRobinson for a non-noise exposed population.
4.2.2 Hearing levels by Health and Safety Executive category
The Health and Safety Executive have defined five categories of hearing ability(HSE, 1978). These categories are described in Tables 3.1 and 3.2.Categorisation is based on the hearing ability of the worse ear at low and highfrequencies.
The distribution of the men in the study by age and hearing category is shown inTable 4.2. The numbers of men showing hearing loss at low and highfrequencies are shown in Table 4.3 together with the proportions of men, notexposed to noise, who would be expected to fall into these categories from thepredictions published in ISO/DIS 1999. The numbers of men fitting categories 3and 4 were similar to those predicted for a typical non-noise exposed population.
It should be noted that the HSE categories refer to worse ear whereas the ISO/DIS1999 predictions refer to better ear. There is no facility in the ISO/DIS 1999document to predict the men in category 2. With the exception of men over 45the proportions of men in the categories 3 and 4 are generally less than thosepredicted from ISO/ DIS 1999.
In general more men fit categories 3 and 4 as a result of their hearing ability athigh frequency than low frequency. This is not the case for men with unilateralhearing loss where there are approximately equal numbers of men who fit thecategories at high and low frequencies.
4.2.3 Numbers of men exceeding of HSC hearing handicap and disability criteria
The numbers of men under 50 with mean hearing levels for both ears at 1, 2 and3 kHz in excess of 30 and 50 dB (respectively, the HSC (1987) criteria forhandicap and disability) are shown in Table 4.4 together with the numberspredicted from ROBINSON'S (1987b) audiometric tables for men with no noiseexposure and men exposed to 90 dB(A). Using ROBINSON's data it is notpossible to predict percentages below 5%.
No estimates are given for men over 49 as there were too few men. As can beseen from Table 4.4 a total of 24 men had hearing levels at 1, 2 and 3 kHz ^30dB and three ^50 dB. However, of these men 11 and 2 respectively had markedunilateral hearing levels suggesting that the hearing levels were unlikely to be dueto occupational noise exposure.
As the ROBINSON estimates for the non-noise exposed group indicate low (<5%)prevalences of even hearing handicap for younger men, only comparisons for oldermen can be made between observed and expected numbers of men. However,the estimates for men exposed to 90 dB(A) enable reasonable predictions to be
15
made for ages 35-49. A total of 22 cases of ^30 dB were observed as against44 estimated from the 90 dB(A) exposed population.
4.3 Hearing Levels by Age and Noise Exposure
For this analysis further exclusions were carried out. All men with gunfireexposure (at least 1000 rounds) or military service were excluded. (Men with earpathology were included). To ensure reliable noise exposure estimates, those menwho were included were also required to have work experience of at least twoyears in occupational groups at colliery Q with assigned noise levels. In addition,this period of assigned time had to comprise at least 75% of a man's total worktime from age 18 to the date of audiometry. And, finally, the disparity, if any,between assigned time and total work time could not exceed five years.
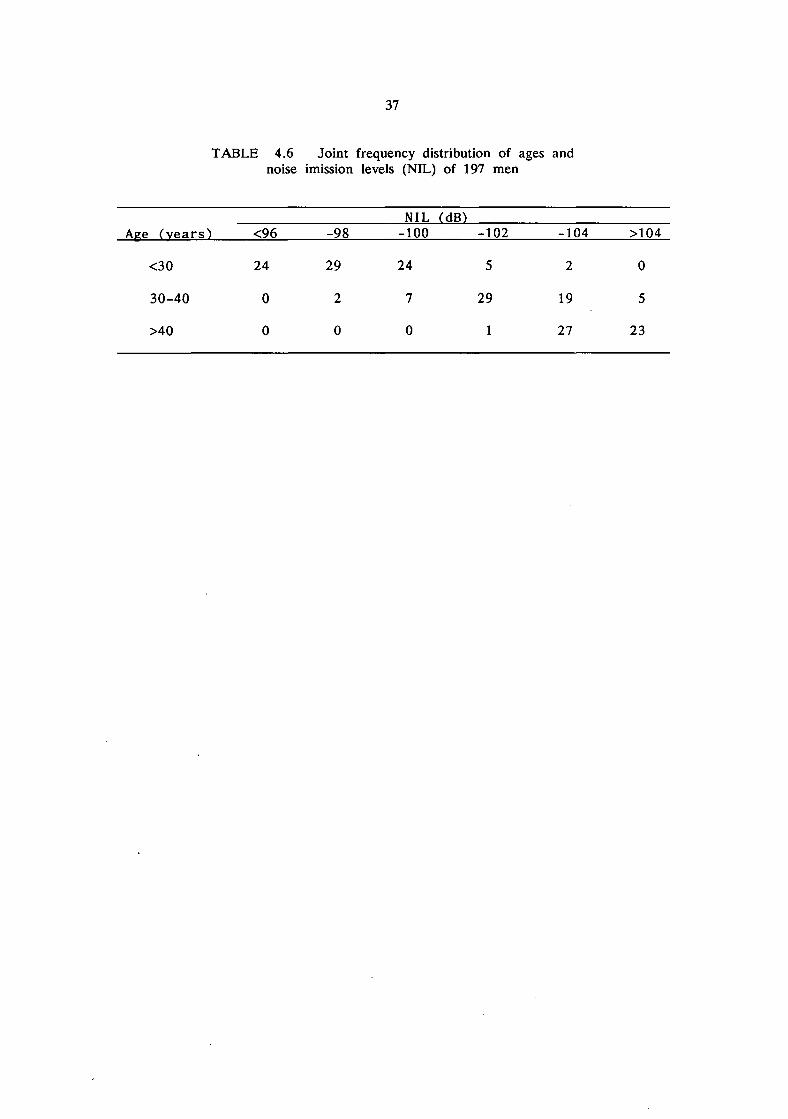
One hundred and ninety-seven men satisfied these criteria. Some summarystatistics for these men are given in Table 4.5. On average they were youngerthan the overall group of 665 subjects, but their ages covered almost as wide arange. The average Leq measured ranged from 86 to 93 dB(A) only.
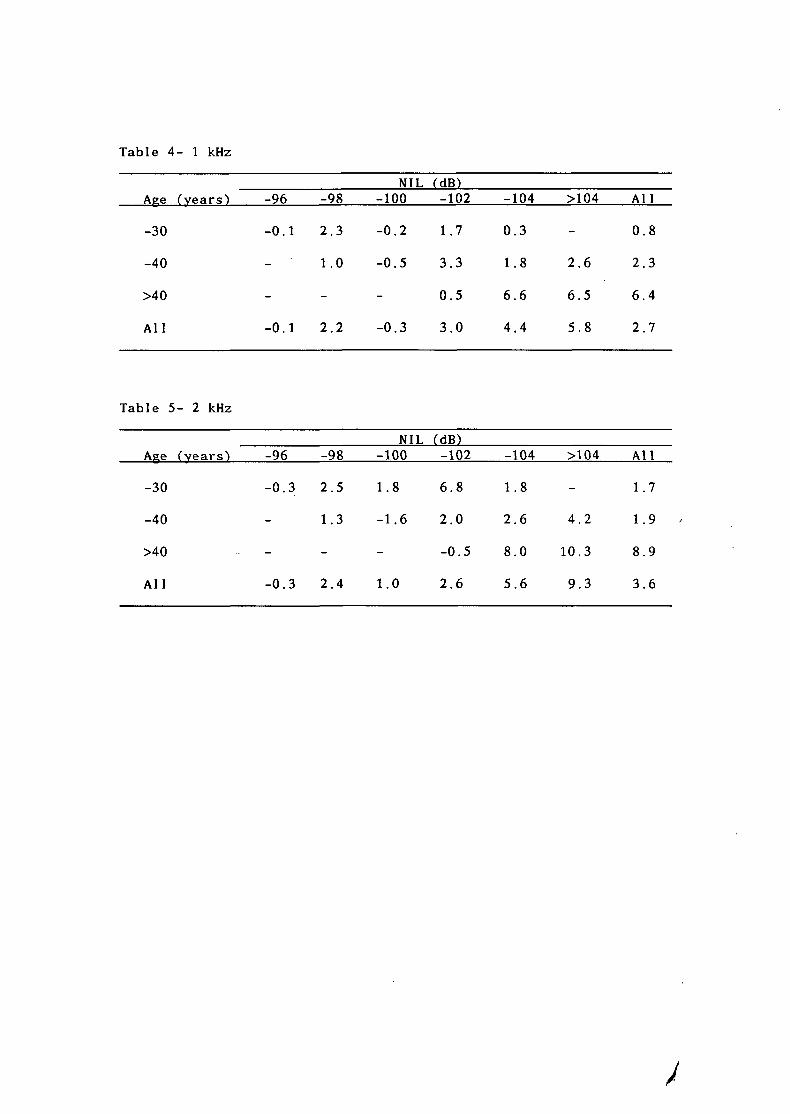
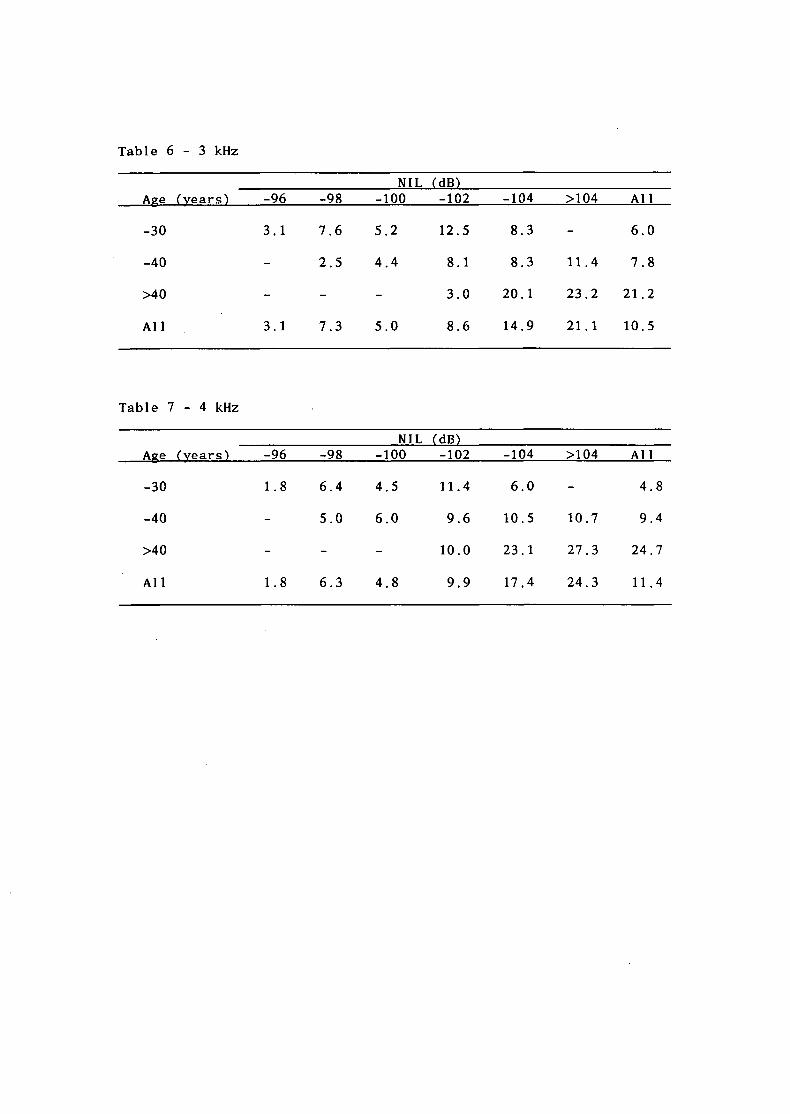
Table 4.6 shows the frequency distribution by age and noise imission level (NIL) ofthe 197 men. The positive correlation between the measures is clearly shown.The variation of mean hearing level (average of both ears) with age and NILconsidered jointly, for a range of frequencies, is shown in Tables 2 to 9 inAppendix 3. There is, in general, no evidence of a relationship between hearinglevel and NIL, within the different age categories. Regression analyses of hearinglevel upon age and NIL jointly confirm this impression; results are given in Table4.7.
The relationship between hearing level and noise exposure, adjusting for age, wasalso examined using hearing level (better ear) as response, and Leq as explanatoryvariable. The results were essentially the same. After allowing for the effectsof ageing, no significant correlation between hearing level and noise exposure inthese men was observed.
4.4 Hearing Performance of Left and Right Ears
Under the audiometric protocol adopted, the left ear was tested first at the varioustesting frequencies, then the right ear and, finally, the left ear at 1 kHz. Therewas a systematic bias between the performance of the left and right ears. Theaverage hearing levels of the left ears ranged between 0.3 and 2.5 dB higher thanthe right ears according to the testing frequency (Table 4.8). In addition, thehearing level of the left ear at 1 kHz measured initially averaged 1.7 dB higherthan that found during the repeat test of the left ear at 1 kHz.
16
17
5. DISCUSSION
The study is based on the results of audiometric testing of 672 male workers atcolliery Q. The group is, we believe, a typical population (e.g. ISO DIS/1999;ROBINSON, 1987a). The only screening was to exclude men with obvious waxin their ears in line with standard audiometric practice.
Coalmines are not quiet workplaces. Eight hour Leq's are generally close to 90dB(A) (JONES, 1986; LANCASTER, 1986; McCORMICK, 1987, JONES, 1988).Noise measurements at colliery Q over a period of over 10 years have shown that8 hour Leq's are almost invariably close to that figure. It is therefore surprisingthat, according to the reference population used, hearing levels of colliery Qworkers are similar to or better than those predicted for typical non-noise exposedpopulations (ROBINSON, 1987; ISO 1985). Considerable effort has beenexpended to ensure that substantial systematic errors had not been introduced bythe audiometry or the analyses.
Are the reference populations inappropriate? The ISO/DIS 1999 database B wasthe best reference non-noise exposed population available at the start of the study.It is described as an example, based on subjects from Europe and North America,which is believed to be representative of an industrialised country. However, ISOrecommend that a control population from the country under consideration shouldbe used as a reference, if practicable. This information was not available for thepresent study. ROBINSON (1987a) criticises the ISO/DIS 1999 document both forits recommendation regarding the construction of a non-noise exposed populationdatabase and for technical aspects in the estimation of hearing abilities of a noiseexposed population. However, comparison of the colliery Q audiometric data withthat published by ROBINSON (1987a) also leads to the conclusion that the hearingabilities of colliery Q population as a whole are at least as good as a typicalnon-noise exposed population.
ROBINSON (1988) has recently published further information describing hearinglevels for typical non-noise and noise exposed populations at 0.5, 1, 2, 3, 4 and 6kHz. This information is a compilation of published hearing levels from anumber of studies carried out in Europe and North America.
The data for 1-4 kHz are essentially the same as those he published previously(ROBINSON, 1987a). Comparisons between the colliery Q population andROBINSON'S reference populations at 0.5 kHz fit the general pattern described sofar. The data for 6 kHz is anomalous, being the only data which suggest thatthe colliery Q men are exposed to high levels of noise. ROBINSON'S predicted6 kHz hearing levels appear to be incompatible with his lower frequency data asthey suggest that hearing levels are better at 6 kHz than at 4 kHz for non-noiseexposed populations.
This is contrary to the generally accepted pattern for presbycousis (e.g. BURNS1973). Other workers have also encountered problems in the interpretation ofaudiometric data in relation to published reference data. In 1977 BURNS et alconcluded "...that severely limited quantitative significance must be attached toabsolute hearing levels, and there should always be a sizeable control group asbaseline." More recently MALLESON (personal communication, 1988) found thatthe hearing abilities of underground train drivers were better than predicted fromreference populations on the bases of age and estimated noise exposures. There
18
remains much to be done to define the hearing abilities for both non-noise andnoise exposed populations. We believe, however, that we have used the mostappropriate available reference data.
Was there a problem with the audiometry? Audiometry is not a precise technique(e.g. BURNS, 1973). Errors can arise simply from the variability of anindividual's hearing threshold but this is unlikely to cause systematic errors in apopulation of 672. Other potential sources include incorrect calibration ofequipment, noisy test booths, incorrect fitting of earphones and the individual'sjudgement of his own hearing threshold. Most of these were considered andcovered in the testing protocol. Audiometers were calibrated before the studycommenced and there were no signs of instrument drift after the work wascompleted. The noise levels in the booths were tested on site prior to the surveyand found to be within acceptable limits. The audiometry was carried out byfully trained audiometricians who were aware of problems associated with poorfitting (in any case, errors in fitting would lead to poor hearing levels beingmeasured). Problems were noted in relation to the subject's judgement ofhearing threshold but these may have led to a systematic over-estimation of thehearing levels of the colliery Q men, most of whom were undergoing their firstaudiometric test. It was found that, according to the frequency, left earsperformed, on average, between 0.3 and 2.5 dB poorer than right ears and therepeat 1 kHz test on the left ear indicated a hearing level 1.7 dB lower than thefirst test on the left ear at that frequency. This is a clear indication of alearning effect. As the test proceeds the subject's performance appears toimprove until it approaches his actual hearing ability. ROBINSON and WHITTLE(1973) noted similar learning effects in studies of audiometric techniques. Anotherpotential source of systematic error is the correction made to the standards toaccount for the differences between manual and self-recording audiometry. Thishas been reported as being small by a number of authors (e.g. ROBINSON, 1988)and the figure of 2.5 dB (ROBINSON, 1988) adopted makes little difference to theoverall conclusions.
Despite the apparent good hearing of the population in relation to the ISO/DIS1999 and ROBINSON (1987a) reference populations, a substantial number of menhad hearing abilities which were categorised as abnormal under the current HSEGuidance (HSE 1978) and a few fitted the HSC hearing handicap and disabilitycriteria. Some further work, using both ISO/DIS 1999 or ROBINSON'S (1987b)data, was therefore carried out. The predictions of HSE hearing category werebased on the information provided in ISO/DIS 1999. These predictions should belower, as the HSE categories are based on worse ear while ISO/DIS 1999 is basedon better ear. It is therefore surprising that with a non-noise exposedpopulation, aged over 35 about 40% of better ears would be categorised as'warnings' and about 10% as 'referrals'. Similar proportions of the colliery Qpopulation were in these categories on the basis of the hearing performance oftheir worse ear. ROBINSON'S (1987b) data were used to predict the numbers ofmen expected to fall into the HSC's (1987) 'handicap' category on the basis of agealone and age together with noise exposure at 90 dB(A). Again, the numbers inthe colliery Q population were not substantially different from those predicted for atypical non-noise exposed population and about a half of those expected in apopulation exposed to 90 dB(A). It is of note that a substantial proportion ofthe men fitting the handicap category suffered unilateral hearing loss which isunlikely to be occupationally induced.
19
It is, therefore, clear that, by all criteria examined the hearing abilities of thecolliery Q population was similar to those predicted for a typical non-noiseexposed population.
Is coalmining noise less damaging than surface industry noise? Noise on thecoalface tends to have a larger proportion of the energy in the frequencies belowabout 500 Hz and to be less 'peaky1 than surface industry noise of similar 'A1
weighted sound pressure level.
A number of studies (e.g. KYLIN, 1960) have shown that although noise at mostfrequencies can cause temporary threshold shift (TTS) in the 1-4 kHz range, thelower the noise frequency, the less TTS generated for a given 'A1 weighted soundpressure level. If it were assumed that TTS is indicative of possible permanentdamage, mining noise might be less damaging than noise of the same 'A' weightedlevel with relatively greater energy in the higher frequencies. In addition, duringthe UK study which led to the Department of Employment 'Code of Practice'(Department of Employment 1972) and BS 5330 (BSI 1976), it was found that thebest energy correlate with noise induced hearing loss was the L^, the 'A'weighted sound pressure level exceeded for 2 per cent of the measurement period(BURNS and ROBINSON, 1970). However, at that time, equipment to measure^A2 was larSe and bulky and a correction to permit the use of Leq wasintroduced. This correction was based on the assumption that L^2 = Leq + 3.7dB. If the actual difference between Leq and L^2 IS not 3.7 dB, the predictionof hearing loss may be incorrect. In coalmines the LA2~Leq difference has beenobserved to be around 1.5 dB. The use of the Leq may therefore haveoverestimated L^ and resulted in a greater noise induced hearing loss beingpredicted than had the actual L^2 figure been used.
The combined effects of the low frequency characteristic of mining noise and therelative constancy within any shift of coalmine noise levels could therefore, at leastpartly, explain why the mineworkers at colliery Q had better hearing levels thanpredicted by either ISO DIS 1999 or ROBINSON for age matched populationsexposed to Leq of 90 dB(A).
The relationship between hearing ability and age was clearly identifiable in thepresent study but we could not distinguish any relationship between noise exposureand hearing ability after allowing for age. This may largely be a result of thenarrow range of average noise exposure levels at the colliery with the consequentclose correlation of noise exposures with age. The hearing levels observed suggestlittle noise induced hearing loss and this too may have made it difficult to identifyany relationships between noise exposure and hearing ability after allowing for age.However, there is no doubt that excessive exposure to noise at work causesoccupational deafness (BURNS and ROBINSON, 1970; BAUGHN, 1973). Webelieve that noise control initiatives in the coalmining industry should be continuedso that occupational exposure and any consequential hearing loss is minimised.
Despite the limitations of this study its results have several substantial implications,particularly with regard to the imminent introduction of the noise controlregulations to meet the CEC Noise Control Directive. If the colliery Qpopulation were typical of the UK coal industry in general it would be clear thatthe industry would be meeting the objective of the regulation in terms of hearinglevels while not, in some instances, meeting the required noise levels.
20
Earlier unpublished studies* has also demonstrated lower than predicted hearinglevels amongst coalminers but these studies were based on small numbers ofspecially selected men. It will be necessary to carry out a number ofcomprehensive audiometric surveys of coalmine populations in a number ofcoalfields throughout the country to determine whether the results at colliery Q aretypical for coalmine workers.
This additional work would give a good indication of hearing level within theindustry but would not answer the question 'does work in a coalmine causedeafness?1 This could only be answered by a prospective study over a number ofyears. Ideally new entrants and the populations described above, including anyleavers, would be followed in such a study. Records of occupations could bemaintained relatively easily through access to payroll systems and these, inconjunction with routine Scientific Department noise measurements, might provideacceptable estimates of noise exposures for use in a prospective study.
* Dick JA, Hearing levels in the British coalmining industry. Paper presented toXVIII International congress on Occupational Health, Brighton 14-19September 1975
Dick JA, Coleman G. British Coal Internal Report, 1979
21
6. CONCLUSIONS
1. Estimated individual lifetime mean exposures (average Leq) to noise rangebetween 86 dB(A) and 93 dB(A). 83% of the men included in the noiseexposure study were exposed between 88 and 91 dB(A).
2. The hearing levels of the men were found to be substantially similar tothose predicted from typical age-matched, non-noise exposed populationsand were better than those predicted for populations exposed to noise at90 dB(A).
3. These differences from predicted hearing levels are not readily explicablefrom the data available and require further investigation.
4. After allowing for the effects of age there was no significant correlation ofhearing level with noise exposure amongst the 197 miners studied.
5. It is apparent that even amongst a non-noise exposed populationsubstantial proportions of men would be expected to fit the HSE warningand referral categories of hearing level.
6. We have no means of knowing whether colliery Q men are representativeof the UK coal industry. In view of the forthcoming noise controlregulations we recommend that a further cross-sectional study is undertakento investigate hearing levels of miners in relation to age at a number ofcollieries to assess whether the colliery Q results are typical of theindustry. We further recommend that this study should be designed toenable it to be extended to a prospective study if required.
23
ACKNOWLEDGEMENTS
The authors would like to thank colliery staff and personnel and colleagues in theInstitute of Occupational Medicine, British Coal Scientific Control and British CoalMedical Service for their help and co-operation throughout. We also thank theBritish Coal Corporation for funding the study.
24
25
REFERENCES
BAUGHN WL. (1973) Relation between daily noise exposure and hearing lossbased on the evaluation of 6835 industrial noise exposure cases. Ohio:Wright-Patterson AFB, Aerospace Medical Research Laboratory.(AMRL-TR-73-53) (EPA-550-73-001 -C)
BRITISH STANDARDS INSTITUTION. (1976) Method of test for estimating therisk of hearing handicap due to noise exposure. London: BSI. (BS 5330: 1976)
BURNS W. (1973) Noise and man. 2nd ed. London: John Murray.
BURNS W, ROBINSON DW. (1970) Hearing and noise in industry. London:HM Stationery Office.
BURNS W, ROBINSON DW, SHIPTON MS, SINCLAIR A. (1977) Hearinghazard from occupational noise: observations from heavy industry. Teddington:National Physical Laboratory. (Acoustic Report Ac 80)
DEPARTMENT OF EMPLOYMENT. (1972) Code of practice for reducing theexposure of employed persons to noise. (With correction slip 12/1/81). London:HM Stationery Office.
HEALTH AND SAFETY COMMISSION. (1987) Prevention of damage to hearingfrom noise at work: draft proposals for regulations and guidance. London: HMStationery Office.
HEALTH AND SAFETY EXECUTIVE. (1978) Audiometry in industry. Reportof the HSE Working Group on Audiometry. Discussion document. London: HMStationery Office.
HURLEY JF, BURNS J, COPLAND L, DODGSON J, JACOBSEN M. (1982)Coalworkers1 simple pneumoconiosis and exposure to dust at 10 British coalmines.British Journal of Industrial Medicine; 39: 120-127
INTERNATIONAL ORGANIZATION FOR STANDARDIZATION. (1985)Acoustics - assessment of occupational noise exposure and estimation ofnoise-induced hearing impairment. Draft. Switzerland: ISO. (ISO/DIS 1999.2)
INTERNATIONAL ORGANIZATION FOR STANDARDIZATION. (1975)Assessment of occupational noise exposure for hearing conservation purposes.Switzerland: ISO. (ISO 1999-1975)
JONES K. (1986) Personal noise exposure. Colliery Guardian: 136-140
JONES K. (1988) Sound pressure level zones - their use for monitoring noiseexposure. Colliery Guardian: 126-129.
KYLIN B. (1960) Temporary threshold shift and auditory trauma followingexposure to steady-state noise. An experimental and field study. ActaOto-Laryngologica; (suppl.152):
26
LANCASTER GK. (1986) Personal noise exposure. Part 2: A summary of asix-month survey at three collieries. Colliery Guardian; 213-216
MCCORMICK G. (1987) Personal noise exposure. Colliery Guardian; 488-491
ROBINSON DW. (1987a) Noise exposure and hearing - a new look at theexperimental data. Bootle: Health and Safety Executive. (HSE Contract ResearchReport No.l)
ROBINSON DW. (1987b) Tables for the estimation of hearing impairment due tonoise for otologically normal persons and for a typical unscreened population.Southampton: Institute of Sound and Vibration Research. (ISVR Contract ReportNo.87/4)
ROBINSON DW. (1988) Threshold of hearing as a function of age and sex fortypical unscreened population. British Journal of Audiology; 22: 5-20
ROBINSON DW, WHITTLE LS. (1973) A comparison of self-recording andmanual audiometry: some systematic effects shown by unpractised subjects.Journal of Sound and Vibration; 26: 41-62
SCHEFFE (1959) The analysis of variance. New York. John Wiley.
27
TABLE 2.1 PFR Occupational Group records for the10 men with measured noise exposures
Recorded Occupational Group
Worker
A
B
C
D
E
F
G
H
I
J
Key
010500103201044010490033001053005270052901058
Attendance(Shifts) Sept. 1983 Oct-Dec. 1983
127 01050
134 01032
133 01044
131 01049
133 01044
124 00330
94 00330
126 01053
130 00527
135 00529
Face OfficialsLoco DriversBelt AttendantOnsettersFace TradesmenGeneral WorkersM/c Operators and CheckersReturn Rippers Al9's FaceDevelopment Worker - High
01050
01032
01044
01049
01044
00330
00330
01053
00527
01058
Al9's Face
Hazles
Jan-Mar. 1984
01050
01032
01044
01040
01044
00330
00330
01053
00527
01058
28
TABLE 2.2 An example of the calculation of8 hour Leq for an occupational group from work
activities and fractional exposures
Work Act ivity
Travel in LocoCarriages/manrider
Walking time/snap time
Loader Gate
Loader Gate Ripping
Loader Gate Stable Hole
Main Face Machine DEDMT
Face Panzer
Supply Gate Sumper
Supply Gate Ripping
Supply Gate Power Pack
Durat ionofExposure(mini
130
50
50
20
30
30
60
25
20
20
435
SPLdB(A)
89.8
80.0
89.6
90.4
91.1
97.3
86.6
97.1
90.9
86.6
Fract ionalExposure
0.258
0.010
0.094
0.046
0.080
0.335
0.057
0.267
0.052
0.019
1.218
Est imatedfromspecialsurvey
Leq 8 hr = 90.9 dB(A)
29
TABLE 2.3 Comparison of estimated and measured Leq'sfrom IOM manpower records and noise measurements
Equivalent continuous sound levels
Worker
A
B
C
D
E
F
G
H
I
J
Occupat ion
Face Deputy
Loco Driver
Belt Attendant
Belt Attendant
Onset ter
Face Fitter
Mobile Electrician
Dust Sampler
Machine Op Propper
Developer
LeqCalculated-8 hr
est imated90.9
94.3
87.9
87.9
92.2
91.2
91.2
87.7
93.0
90.091.5
rdBCA1)!Measured-6 month
90.0
94.6
86.6
89.0
89.6
87.6
97.8
84.9
89.9
87.891.6
30
TABLE 3.1 HSE Hearing Level Categories
Category Basis/Criteria
1 Comparison of Sequential Audiograms(Rapid Deterioration)Sum of Hearing Levels for either ear, lowor high frequencies>30dB - period between Audiometry <3 yr>45dB - period between Audiometry >3 yr
2 Comparison of Ears (Unilateral Loss)Difference between ears, low frequencies >45dBDifference between ears, high frequencies >60dB
3 Hearing Levels, Either Ear, Age RelatedSum of hearing levels exceed referral criteria
4 Hearing Levels, Either Ear, Age RelatedSum of hearing levels exceed warning criteria
5 Cases not meeting above criteria'Normal' hearing
31
TABLE 3.2 Referral and Warning Criteria
Sum of hearing levels
Agein vrs
20-2425-2930-34
35-3940-4445-49
50-5455-5960-6465-
0.5. 1. 2WarninglevelCat 4
454545
485154
57606570
kHzReferrallevelCat 3
606672
788490
90909090
3. 4. 6 kHzWarninglevelCat 4
454545
546066
7487100115
ReferrallevelCat 3
758799
111123135
144144144144
TABLE 4.1 Frequency distribution of ages of 665 subjects at Colliery Q(The mean age and standard deviation within each age group,
used in graphical displays, is also shown).
Age (years) wto
19-24 25-29 30-34 35-39 40-44 45-49 50-54 ^55
No. of subjects 88 97 94 114 130 131 9 2
Mean age (s.d.) 22.5(1.6) 27.7(1.4) 32.5(1.5) 37.8(1.4) 42.4(1.4) 47.5(1.3) 51.0(0.9) 59.6(4.8)
TABLE 4.2 Distribution of men in HSE hearing ability categories by age
TABLE 4.3 Measured and predicted proportions of men in HSE hearing abilitycategories split by frequency and age
HSE categoryof hearing 2(uni lateral )
High1 Low2
Age erouo
20253035404550All
- 24- 29- 34- 39- 44- 49and overmen
meas-'
3.48.110.65.25.36.83.37.0
meas
1.19.17.47.06.09.13.37.3
% of men in category3(referral)
High Lowmeas^
5.72.00.03.56.0
12.904.1
ored4
n.a.9.28.79.210.012n.a.n.a.
meas ored
11123201
.1 n.a.
.0 <1
. 1 <1
.6 <1
.0 <1
.3 <1
.0 n.a.
.9 n.a.
4(warning)High Low
meas
19.319.230.934.235.343.258.328.8
ored
n.a.2936363841n.a.n.a.
meas
002.15.26.05.30.03.4
ored
n.a.4.86.67.79.412n.a.n.a.
n.a. - not applicable1 - high frequency (based on sum of hearing loss at 3, 4 and 6 kHz)2 - low frequency (based on sum of hearing loss at 0.5, 1 and 2 kHz)3 - measured H of men4 - % men predicted from ISO DIS 1999 (Better ear)
u>
35
TABLE 4.4 Observed and Predicted exceedancesof HSE hearing handicap and disability criteria
Numbers of men with handicapof disability
Observed Predicted1
Age Group
19-24
25-29
30-34
35-39
40-44
45-49
No. of Menin Group
88
99
94
113
138
131
Non-noise 90 dB(A)Exposed Leq
Handicap^ Disability^ Handicap Handicap
0
0
1 (1)
4 (4)
6 (4)
12 (9)
0
0
0
0
1 (1)
2 (2)
7 (6)
15 (11)
9 (7) 23 (18)
Figures in brackets are percentages
Predictions based on ROBINSON (1987a) The published data do not permitresolution of predictions below 5% of the population under study. The proportionsof men predicted as having disability were less than 5% for all age groups understudy, both non-noise exposed and
Handicap : mean hearing levels for both ears at 1, 2 and 3 kHz exceeding 30dB.
Disability : mean hearing levels for both ears at 1, 2 and 3 kHz exceeding 50dB.
36
TABLE 4.5 Summary statistics of the ages, and noise exposuremeasured (noise imission levels (NIL) and Leq) of
197 men at colliery Q
Characterist icStatistic
Mean
Std.Dev.
Min
Max.
Age (years)
33.5
8.5
20.6
50.6
NIL CdB)
100.
3.
91.
106.
3
6
6
4
Leq (dB)
89.4
1.2
86.2
92.8
37
TABLE 4.6 Joint frequency distribution of ages andnoise imission levels (NIL) of 197 men
NIL (dB)Age (vears)
<30
30-40
>40
<96
24
0
0
-98
29
2
0
-100
24
7
0
-102
5
29
1
-104
2
19
27
>104
0
5
23
38
TABLE 4.7 Anti-logs of regression coefficients of age andnoise imission levels (NIL), by frequency, with
statistical significances in brackets
Frequency (kHz) Age effect (per 10 years) NIL effect (per 10 dB)
0.25 x 1.13 (P = 0.04) x 0.88 (P =0.37)
0.5 x 1.18 (P = 0.02) x 0.79 (P = 0.17)
1 x 1.25 (P - 0.002) x 0.84 (P - 0.33)
2 x 1.28 (P = 0.003) x 0.87 (P = 0.50)
3 x 1.26 (P = 0.003) x 1.09 (P - 0.64)
4 x 1.34 (P <0.001) x 1.15 (P = 0.42)
6 x 1.30 (P <0.001) x 0.89 (P = 0.44)
8 x 1.37 (P <0.001) x 0.85 (P - 0.30)
TABLE 4.8 Differences in hearing levels betweenleft and right ears
FIGURE 4.3 Comparison with ISO/DIS 1999;Median hearing levels for colliery Q men vs age
0.5 KHz
100-
80-
00 60-
UJ
UJ_1
o40-
tr<:LJ 20-
0-
-2020 25
NN
30 35 40AGE(YEARS)
45 50
median, quartiles and range of hearing levelsfor age group
ISO/DIS 1999 prediction, uncorrectedISO/DIS 1999 prediction, corrected by -2.5 dB
NN - Non-noise exposed population (same as 90 dB(A)exposed at 0.5 kHz)
46
FIGURE 4.4 Comparison with ISO/DIS 1999;Median hearing levels for colliery Q men vs age
1 KHz
100'
80-
CD 60-"D
40-
UJ
LJ_J
OzI—I
^ 20-
0-
-2020
NN
25 30 35 40AGE(YEARS)
45 50
median, quartiles and range of hearing levelsfor age group
ISO/DIS 1999 prediction, unconnectedISO/DIS 1999 prediction, corrected by -2.5 dB
NN - Non-noise exposed population (same as 90 dB(A)exposed at 1 kHz)
47
FIGURE 4.5 Comparison with ISO/DIS 1999;Median hearing levels for colliery Q men vs age
2 KHz
100
80-
00 60-
LJ
LJ_J 40-
O
I-HIT
LJ 20-
0-
-20'20 25 30 35 40
AGE(YEARS)45
I
90 dB'(A)
NN
50
median, quartiles and range of hearing levelsfor age group
ISO/DIS 1999 prediction, uncorrectedISO/DIS 1999 prediction, corrected by -2.5 dB
NN - Non-noise exposed population
48
FIGURE 4.6 Comparison with ISO/DIS 1999;Median hearing levels for colliery Q men vs age
3 KHz
100
80-
CD 60--O
LJ>UJ
40-
20-
0-
-2020
90 d B ( A )
NN
25 30 35 40AGE(YEARS)
45 50
median, quartiles and range of hearing levelsfor age group
ISO/DIS 1999 prediction, uncorrectedISO/DIS 1999 prediction, corrected by -2.5 dB
NN - Non-noise exposed population
49
FIGURE 4.7 Comparison with ISO/DIS 1999;Median hearing levels for colliery Q men vs age
4 KHz
100-
80-
03 60-"O
LJ>
O
40-
UJ 20'
0-
-20-20 25
I
30 35 40A G E ( Y E A R S )
90 dB(A)
NN
45 50
median, quartiles and range of hearing levelsfor age group
ISO/DIS 1999 prediction, uncorrectedISO/DIS 1999 prediction, corrected by -2.5 dB
NN - Non-noise exposed population
50
FIGURE 4.8 Comparison with ISO/DIS 1999;Median hearing levels for colliery Q men vs age
6 KHz
100-
80-
00 60-
>UJ
O
40-
UJ 20-
0-
-20-20
I
25 30 35 40AGE(YEARS)
45
90 d B ( A )
NN
50
median, quartiles and range of hearing levelsfor age group
ISO/DIS 1999 prediction, unconnectedISO/DIS 1999 prediction, corrected by -2.5 dB
NN - Non-noise exposed population
51
FIGURE 4.9 Hearing level (Better ear) vs age
0.5 KHz
4-0
32-
00 24-
UJ—I 16-
O
IT
bJ 8-
0-
-8-20 25 30 35 40
A G E ( Y E A R S )
NN
45 50
I
observed median
95% confidence band for (hypothetical) populationmedian hearing level underlying colliery Q data
ISO/DIS 1999 prediction, uncorrected
ISO/DIS 1999 prediction, corrected by -2.5 dB
NN - Non-noise exposed population (same as 90 dB(A)exposed at 0.5 kHz)
52
FIGURE 4.10 Hearing level (Better ear) vs age
1 KHz
40-
32-
DQ 24-
_JLJ
LoJ16-
O-z.I— I
LJ 8'
0-
-820 25 30 35 40
AGE(YEARS)
NN
45 50
I
observed median
95% confidence band for (hypothetical) populationmedian hearing level underlying colliery Q data
ISO/DIS 1999 prediction, unconnected
ISO/DIS 1999 prediction, corrected by -2.5 dB
NN - Non-noise exposed population (same as 90 dB(A)exposed at 1 kHz)
53
FIGURE 4.11 Hearing level (Better ear) vs age
2 KHz
40'
32-
03 24-"D
LJ
LJ_l
O
I—icc
16-
8-
0-
-8-20
I +
90 d B ( A )
NN
25 30 35 40AGE(YEARS)
45 50
Iobserved median
95% confidence band for (hypothetical) populationmedian hearing level underlying colliery Q data
ISO/DIS 1999 prediction, uncorrected
ISO/DIS 1999 prediction, corrected by -2.5 dB
NN - Non-noise exposed population
54
FIGURE 4.12 Hearing level (Better ear) vs age
3 KHz
40
32-
03 24-
LU
LU_l
O
16-
LJ 8-
0-
20 25 30 35 40
AGE(YEARS)45
90 d B ( A )
NN
50
Iobserved median
95% confidence band for (hypothetical) populationmedian hearing level underlying colliery Q data
ISO/DIS 1999 prediction, unconnected
BO/DIS 1999 prediction, corrected by -2.5 dB
NN - Non-noise exposed population
55
FIGURE 4.13 Hearing level (Better ear) vs age
4 KHz
40'
CD 24-
UJ>
16-
UJ 8-
0-
-8-
I
20 25 30 35 40 45A G E ( Y E A R S )
90 d B ( A )
NN
50
Iobserved median
95% confidence band for (hypothetical) populationmedian hearing level underlying colliery Q data
ISO/DIS 1999 prediction, unconnected
ISO/DIS 1999 prediction, corrected by -2.5 dB
NN - Non-noise exposed population *-.
56
FIGURE 4.14 Hearing level (Better ear) vs age
6 KHz
40
32-
m 24--o
LJ
UJ_lo
16-
8-1
0-
-8-20 25
90 d B ( A )
NN
30 35 40A G E ( Y E A R S )
45 50
Iobserved median
95% confidence band for (hypothetical) populationmedian hearing level underlying colliery Q data
ISO/DIS 1999 prediction, unconnected
ISO/DIS 1999 prediction, corrected by -2.5 dB
NN - Non-noise exposed population
57
FIGURE 4.15 Comparison with ROBINSON (1987)Median hearing levels for colliery Q men v age
1 KHz
100
BO-
CD 60"D
UJ>
ozM(T
40-
20-
0-
-20-20
—i—25
—r—30
—r~35
AGE(YEARS)
—,—40
—i—45
90 d B ( A )NN
50
median, quartiles and range of hearing levelsfor age group
Predicted hearing levels from ROBINSON (1987) - unconnectedPredicted hearing levels from ROBINSON (1987) - corrected by-2.5 dB
NN - Non-noise exposed population
58
FIGURE 4.16 Comparison with ROBINSON (1987)Median hearing levels for colliery Q men v age
2 KHz
100
80-
00 60-
>LJ_J 40-
O
tr
20-
0-
-2020 25 30 35 40
AGE(YEARS)45
90 d B ( A )
NN
50
median, quartiles and range of hearing levelsfor age group
Predicted hearing levels from ROBINSON (1987) - unconnectedPredicted hearing levels from ROBINSON (1987) - corrected by-2.5 dB
NN - Non-noise exposed population
59
FIGURE 4.17 Comparison with ROBINSON (1987)Median hearing levels for colliery Q men v age
3 KHz
100'
80-
00 60-
LoJ>
CD
40-
CC<UJ 20-
0-
-20-25 30 35 40
AGE(YEARS)45
90 d B ( A )
NN
50
median, quartiles and range of hearing levelsfor age group
Predicted hearing levels from ROBINSON (1987) - uncorrectedPredicted hearing levels from ROBINSON (1987) - corrected by-2.5 dB
NN - Non-noise exposed population
60
FIGURE 4.18 Comparison with ROBINSON (1987)Median bearing levels for colliery Q men v age
4 KHz
100'
80-
CD 60--o
>UJ
o:
40-
20-
0-
-20
90 d B ( A )
NN
20 25 30 35 40AGE(YEARS)
45 50
median, quartiles and range of hearing levelsfor age group
Predicted hearing levels from ROBINSON (1987) - uncorrectedPredicted hearing levels from ROBINSON (1987) - corrected by-2.5 dB
NN - Non-noise exposed) population
APPENDIX 1
Preliminary investigation of measured and estimated noise exposures at colliery Qwork activities and fractional noise exposures for the occupations concerned.
Face Tradesmen - OG 00330
Work Act ivity
Travel in LocoCarriages/manrider
Face Panzer
Walking Time/Snap Time
Main Face Machine Decmt
S/G Sumper
L/C AFC Drive
S/G Stage Loader
S/G Power Pack
Durat ionofExposure(min)
130
75
50
30
30
30
30
30
435
SPLdB(A)
89.8
86.6
80.0
97.3
97.1
91.1
90.4
86.6
Fract ionalExposure
0.258
0.071
0.010
0.336
0.321
0.081
0.069
0.029
1.332
Est imatedfromspecialsurvey
Leq = 9 1 . 2 dB(A) 8 hr
Gen Workers - OG 01053
Work Activity
Travel in LocoCarriages/manriders
Snap time
Walking time
O/bye Machinery General
Conveyor Roads
Durat ionofExposure(min)
130
20
50
100
135
435
SPLdB(A)
89.8
80.0
80.0
91.5
80.0
Fract ionalExposure
0.258
0.004
0.010
0.294
0.028
0.594
Est imatedfromspecialsurvey
Leq =87.7 dB(A) 8 hr
Loco Driver - OG 01032
Work Act ivity
Driving Loco
Pitbottom No. 1
Loco Garage
Snap time
Durat ionofExposure(min)
120
150
145
20
435
SPLdB(A)
98.0
95.0
85.0
80.0
Fract ionalExposure
1.577
0.988
0.096
0.004
2.665
Leq =94.3 dB(A) 8 hr
Belt Attendants - OG 01044
Work Act ivity
Travel in LocoCarriage/manrider
Snap Time
Operators Position
Cleaning Mech/ElectMachinery
Cleaning T/P Chutes
Leq =87.9 dB(A)
Rippers - OG 00529
Work Act ivity
Durat ionof SPLExposure dB(A)(mini
60 89.8
20 80.0
235 85.9
60 91.3
60 90.1
8 hr
Durat ionof SPLExposure dB(A)(mini
Fract ionalExposure
0.129
0.004
0.192
0.169
0.128
Fract ionalExposure
Travel in LocoCarriages/manrider
Snap Time
Supply Gate Ripping
130 89.8 0.258
20 80.0 0.004
285 90.9 0.730
Est imatedfromspecialsurvey
Est imatedfromspecialsurvey
435 0.992
Leq =90.0 dB(A) 8 hr
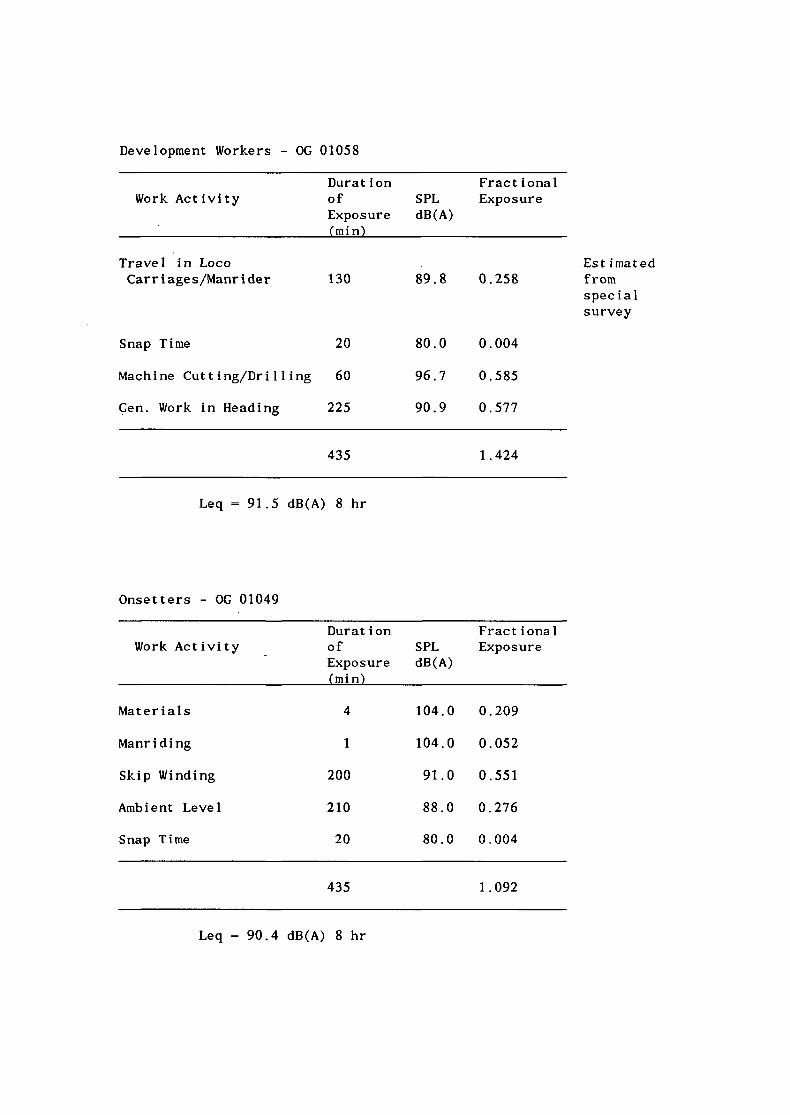
Development Workers - OG 01058
Work Act ivity
Travel in LocoCarriages/Manrider
Snap Time
Machine Cutting/Drill
Gen. Work in Heading
Leq =91.5
Onsetters - OG 01049
Work Activity
Materials
Manriding
Skip Winding
Ambient Level
Snap Time
Durat ionof SPLExposure dB(A)(min)
130 89.8
20 80.0
ing 60 96.7
225 90.9
435
dB(A) 8 hr
Durat ionof SPLExposure dB(A)(min)
4 104.0
1 104.0
200 91.0
210 88.0
20 80.0
435
Fract ionalExposure
0.258
0.004
0.585
0.577
1.424
Fract ionalExposure
0.209
0.052
0.551
0.276
0.004
1.092
Est imatedfromspecialsurvey
Leq =90.4 dB(A) 8 hr
Repairers - OC 01040
Work Activity
Travel in LocoCarriage/manrider
Snap Time
General U/G Ambient
Jigger Pick
Dri 1 1 ing
Durat ionofExposure(min)
60
20
335
10
10
SPLdB(A)
89.8
80.0
91.3
107.0
97.9
Fract ionalExposure
0.129
0.004
0.941
1.044
0.129
Est imatedfromspecialsurvey
435 2.246
Leq =93.5
APPENDIX 2
Noise Occupational Groups and their assigned Leq's