Page 1
Page i
TPC Benchmark H Full Disclosure Report
© Hitachi, Ltd, 2013. All rights reserved.
TPC-H Benchmark™ Full Disclosure Report
Hitachi BladeSymphony BS2000
using
Hitachi Advanced Data Binder 01-02
Submitted for Review
October 19, 2013
Page 2
Page ii
TPC Benchmark H Full Disclosure Report
© Hitachi, Ltd, 2013. All rights reserved.
First Edition - October, 2013
Hitachi, Ltd. (HITACHI), the Sponsor of this benchmark test, believes that the technical, pricing and
discounting information in this document is accurate as of its publication date. The performance information
in this document is for guidance only. System performance is highly dependent on many factors including
system hardware, system and user software, and user-application characteristics. Customer applications must
be carefully evaluated before estimating performance. HITACHI does not warrant or represent that a user can
or will achieve similar performance as expressed in this document.
THE TERMS AND CONDITIONS GOVERNING THE SALE OF HITACHI HARDWARE PRODUCTS
AND THE LICENSING OF HITACHI SOFTWARE CONSIST SOLELY OF THOSE SET FORTH IN THE
WRITTEN CONTRACTS BETWEEN HITACHI AND ITS CUSTOMERS. NO REPRESENTATION OR
OTHER AFFIRMATION OF FACT CONTAINED IN THIS DOCUMENT INCLUDING BUT NOT
LIMITED TO STATEMENTS REGARDING PRICE, CAPACITY, RESPONSE-TIME PERFORMANCE,
SUITABILITY FOR USE, OR PERFORMANCE OF PRODUCTS DESCRIBED HEREIN SHALL BE
DEEMED TO BE A WARRANTY BY HITACHI FOR ANY PURPOSE, OR GIVE RISE TO ANY
LIABILITY OF HITACHI WHATSOEVER.
HITACHI assumes no responsibility for any errors that may appear in this document. HITACHI reserves the
right to make changes in specifications and other information contained in this document without prior notice,
and the reader should in all cases consult HITACHI to determine whether any such changes have been made.
Copyright 2013 Hitachi, Ltd.
All rights reserved. Permission is hereby granted to reproduce this document in whole or in part provided the
copyright notice printed above is set forth in full text or on the title page of each item reproduced.
BladeSymphony is registered trademark of Hitachi, Ltd.
Hitachi Advanced Data Binder is based on “Out-of-Order Database Engine” technology proposed by Prof.
Masaru Kitsuregawa (Univ. of Tokyo and also Director-General, National Institute of Informatics). This
product uses the outcome of “Development of the fastest database engine for the era of very large database,
and Experiment and evaluation of strategic social services enabled by the database engine” project (Principle
Investigator: Prof. Masaru Kitsuregawa), supported by the Japanese Cabinet Office’s FIRST Program
(Funding Program for World-Leading Innovative R&D on Science and Technology).
TPC Benchmark, TPC-H and QphH are trademarks of the Transaction Processing Performance Council.
Intel and Intel Xeon are trademarks or registered trademarks of Intel Corporation.
Red Hat and Red Hat Enterprise Linux are registered trademarks of Red Hat, Inc.
Linux is a registered trademark of Linus Torvalds.
Other product names mentioned in this document may be trademarks and/or registered trademarks of their
respective companies.
Page 3
Page iii
TPC Benchmark H Full Disclosure Report
© Hitachi, Ltd. 2013. All rights reserved.
Hitachi BladeSymphony BS2000
using Hitachi Advanced Data
Binder 01-02
TPC-H Rev. 2.16.0
TPC-Pricing Rev. 1.7.0
Report Date:
Oct 19, 2013
Total System Cost Composite Query per Hour Metric Price/Performance
¥1,563,605,024 JPY 82,678.0 QphH@100000GB
¥ 18,911.98 JPY ¥ / QphH@100000GB
Database Size (*) Database Manager Operating System Other Software Availability Date
100,000GB Hitachi Advanced Data
Binder 01-02
Red Hat® Enterprise
Linux® 6.2 None Oct 19, 2013
0 10,000 20,000 30,000 40,000 50,000 60,000 70,000
Q1
Q2
Q3
Q4
Q5
Q6
Q7
Q8
Q9
Q10
Q11
Q12
Q13
Q14
Q15
Q16
Q17
Q18
Q19
Q20
Q21
Q22
RF1
RF2
Power Run
Throughput Run
Geometric Mean of Power Test
Arithmetic Mean of Throughput Test
5,603.6 27,196.5
Database Load Time =139:53:08 Storage Redundancy Levels:
Load Includes Backup: N
Base Tables:
Auxiliary Data Structures:
DBMS Temporary Space:
OS and DBMS Software:
Level One
Level One
Level One
Level One
Total Data Storage / Database Size (*) = 14.76
Memory / Database Size = 8.0%
System Configuration
Number of Nodes: 4
Processors/Cores/Threads/Type: 32/320/640 Intel® Xeon® Processor E7-8870 (24M Cache, 2.13 GHz, 6.40 GT/s Intel® QPI)
Memory: 8TB
Storage Controllers: 128 x 8Gbps PCI Express FC Dual-port HBA, 4 x 8Gbps PCI Express Mezzanine FC Dual-port HBA
Storage Subsystem Disk Drives: 16 x Hitachi Unified Storage 150 (Dual 8-port controller) each with 100 x 900GB 10Krpm SAS Disks
4 x Hitachi BR1600E each with 15 x 600GB 10Krpm SAS Disks
Total Disk Storage: 1,476,000GB
* Database Size includes only raw data (e.g., no temp, index, redundant storage space, etc.)
Page 4
Page iv
TPC Benchmark H Full Disclosure Report
© Hitachi, Ltd. 2013. All rights reserved.
Hitachi BladeSymphony BS2000
using Hitachi Advanced Data
Binder 01-02
TPC-H Rev. 2.16.0
TPC-Pricing Rev. 1.7.0
Report Date:
Oct 19, 2013
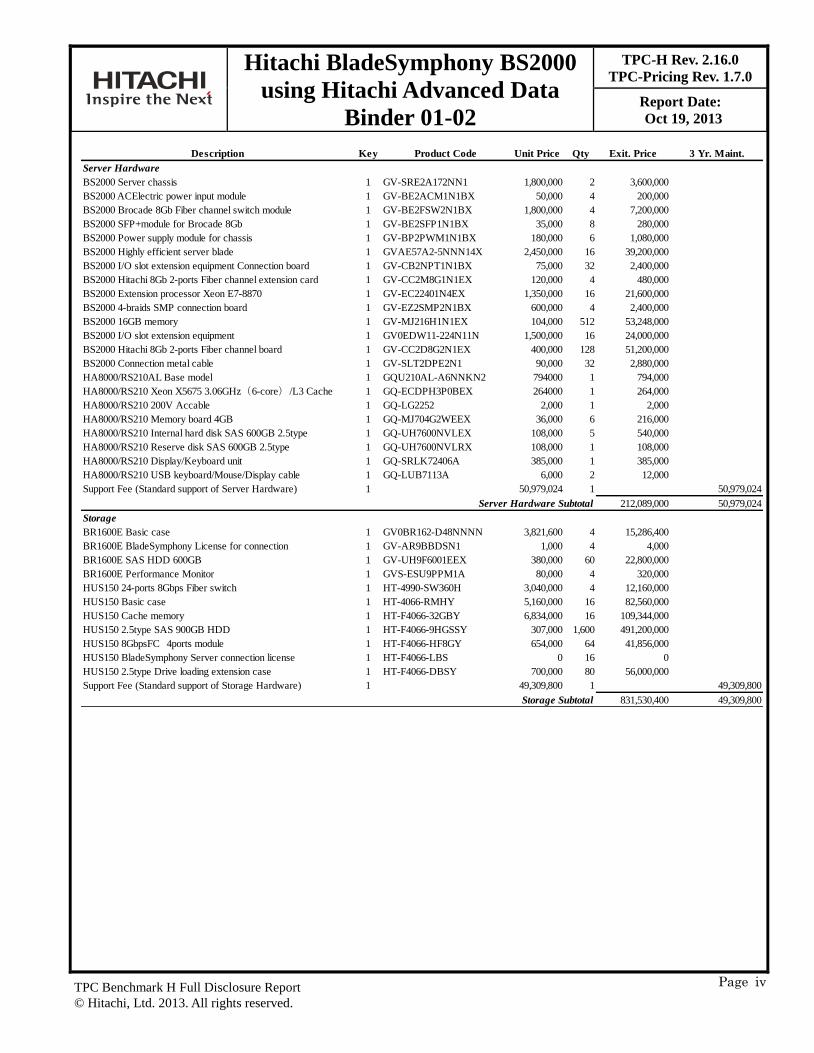
Description Key Product Code Unit Price Qty Exit. Price 3 Yr. Maint.
Server Hardware
BS2000 Server chassis 1 GV-SRE2A172NN1 1,800,000 2 3,600,000
BS2000 ACElectric power input module 1 GV-BE2ACM1N1BX 50,000 4 200,000
BS2000 Brocade 8Gb Fiber channel switch module 1 GV-BE2FSW2N1BX 1,800,000 4 7,200,000
BS2000 SFP+module for Brocade 8Gb 1 GV-BE2SFP1N1BX 35,000 8 280,000
BS2000 Power supply module for chassis 1 GV-BP2PWM1N1BX 180,000 6 1,080,000
BS2000 Highly efficient server blade 1 GVAE57A2-5NNN14X 2,450,000 16 39,200,000
BS2000 I/O slot extension equipment Connection board 1 GV-CB2NPT1N1BX 75,000 32 2,400,000
BS2000 Hitachi 8Gb 2-ports Fiber channel extension card 1 GV-CC2M8G1N1EX 120,000 4 480,000
BS2000 Extension processor Xeon E7-8870 1 GV-EC22401N4EX 1,350,000 16 21,600,000
BS2000 4-braids SMP connection board 1 GV-EZ2SMP2N1BX 600,000 4 2,400,000
BS2000 16GB memory 1 GV-MJ216H1N1EX 104,000 512 53,248,000
BS2000 I/O slot extension equipment 1 GV0EDW11-224N11N 1,500,000 16 24,000,000
BS2000 Hitachi 8Gb 2-ports Fiber channel board 1 GV-CC2D8G2N1EX 400,000 128 51,200,000
BS2000 Connection metal cable 1 GV-SLT2DPE2N1 90,000 32 2,880,000
HA8000/RS210AL Base model 1 GQU210AL-A6NNKN2 794000 1 794,000
HA8000/RS210 Xeon X5675 3.06GHz(6-core)/L3 Cache 1 GQ-ECDPH3P0BEX 264000 1 264,000
HA8000/RS210 200V Accable 1 GQ-LG2252 2,000 1 2,000
HA8000/RS210 Memory board 4GB 1 GQ-MJ704G2WEEX 36,000 6 216,000
HA8000/RS210 Internal hard disk SAS 600GB 2.5type 1 GQ-UH7600NVLEX 108,000 5 540,000
HA8000/RS210 Reserve disk SAS 600GB 2.5type 1 GQ-UH7600NVLRX 108,000 1 108,000
HA8000/RS210 Display/Keyboard unit 1 GQ-SRLK72406A 385,000 1 385,000
HA8000/RS210 USB keyboard/Mouse/Display cable 1 GQ-LUB7113A 6,000 2 12,000
Support Fee (Standard support of Server Hardware) 1 50,979,024 1 50,979,024
212,089,000 50,979,024
Storage
BR1600E Basic case 1 GV0BR162-D48NNNN 3,821,600 4 15,286,400
BR1600E BladeSymphony License for connection 1 GV-AR9BBDSN1 1,000 4 4,000
BR1600E SAS HDD 600GB 1 GV-UH9F6001EEX 380,000 60 22,800,000
BR1600E Performance Monitor 1 GVS-ESU9PPM1A 80,000 4 320,000
HUS150 24-ports 8Gbps Fiber switch 1 HT-4990-SW360H 3,040,000 4 12,160,000
HUS150 Basic case 1 HT-4066-RMHY 5,160,000 16 82,560,000
HUS150 Cache memory 1 HT-F4066-32GBY 6,834,000 16 109,344,000
HUS150 2.5type SAS 900GB HDD 1 HT-F4066-9HGSSY 307,000 1,600 491,200,000
HUS150 8GbpsFC 4ports module 1 HT-F4066-HF8GY 654,000 64 41,856,000
HUS150 BladeSymphony Server connection license 1 HT-F4066-LBS 0 16 0
HUS150 2.5type Drive loading extension case 1 HT-F4066-DBSY 700,000 80 56,000,000
Support Fee (Standard support of Storage Hardware) 1 49,309,800 1 49,309,800
831,530,400 49,309,800
Server Hardware Subtotal
Storage Subtotal
Page 5
Page v
TPC Benchmark H Full Disclosure Report
© Hitachi, Ltd. 2013. All rights reserved.
Hitachi BladeSymphony BS2000
using Hitachi Advanced Data
Binder 01-02
TPC-H Rev. 2.16.0
TPC-Pricing Rev. 1.7.0
Report Date:
Oct 19, 2013
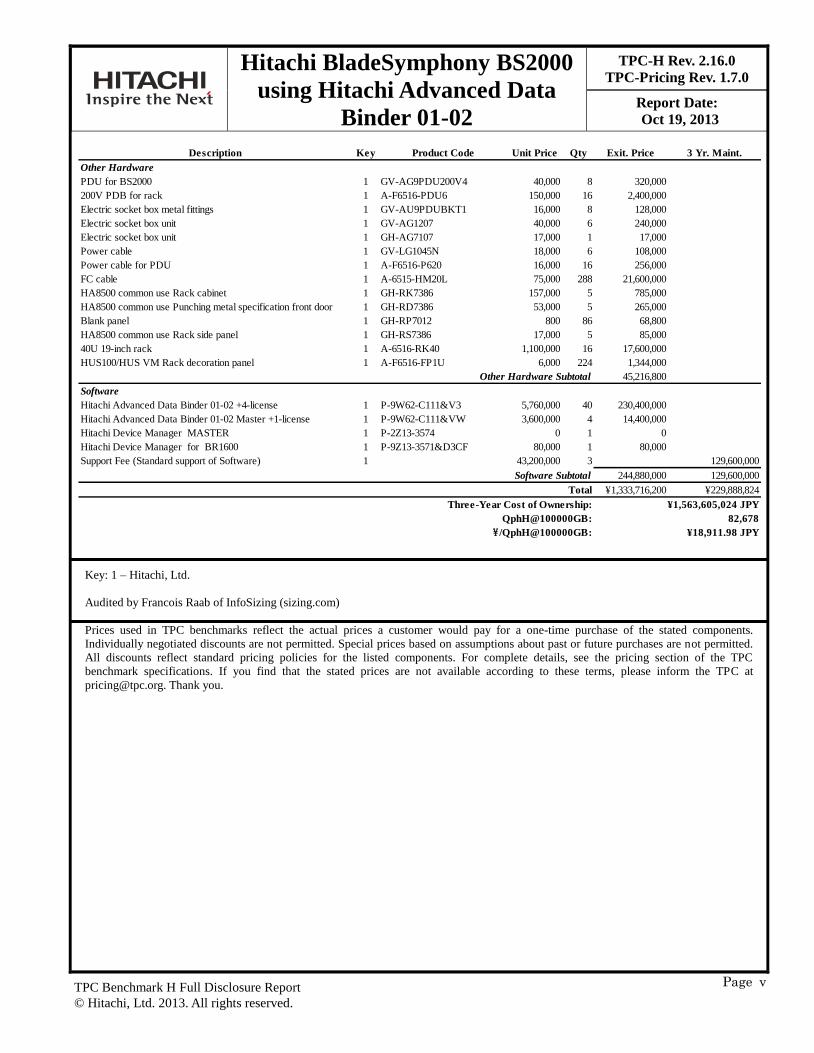
Description Key Product Code Unit Price Qty Exit. Price 3 Yr. Maint.
Other Hardware
PDU for BS2000 1 GV-AG9PDU200V4 40,000 8 320,000
200V PDB for rack 1 A-F6516-PDU6 150,000 16 2,400,000
Electric socket box metal fittings 1 GV-AU9PDUBKT1 16,000 8 128,000
Electric socket box unit 1 GV-AG1207 40,000 6 240,000
Electric socket box unit 1 GH-AG7107 17,000 1 17,000
Power cable 1 GV-LG1045N 18,000 6 108,000
Power cable for PDU 1 A-F6516-P620 16,000 16 256,000
FC cable 1 A-6515-HM20L 75,000 288 21,600,000
HA8500 common use Rack cabinet 1 GH-RK7386 157,000 5 785,000
HA8500 common use Punching metal specification front door 1 GH-RD7386 53,000 5 265,000
Blank panel 1 GH-RP7012 800 86 68,800
HA8500 common use Rack side panel 1 GH-RS7386 17,000 5 85,000
40U 19-inch rack 1 A-6516-RK40 1,100,000 16 17,600,000
HUS100/HUS VM Rack decoration panel 1 A-F6516-FP1U 6,000 224 1,344,000
45,216,800
Software
Hitachi Advanced Data Binder 01-02 +4-license 1 P-9W62-C111&V3 5,760,000 40 230,400,000
Hitachi Advanced Data Binder 01-02 Master +1-license 1 P-9W62-C111&VW 3,600,000 4 14,400,000
Hitachi Device Manager MASTER 1 P-2Z13-3574 0 1 0
Hitachi Device Manager for BR1600 1 P-9Z13-3571&D3CF 80,000 1 80,000
Support Fee (Standard support of Software) 1 43,200,000 3 129,600,000
244,880,000 129,600,000
¥1,333,716,200 ¥229,888,824
¥1,563,605,024 JPY
QphH@100000GB: 82,678
\ /QphH@100000GB: ¥18,911.98 JPY
Other Hardware Subtotal
Software Subtotal
Total
Three-Year Cost of Ownership:
Key: 1 – Hitachi, Ltd.
Audited by Francois Raab of InfoSizing (sizing.com)
Prices used in TPC benchmarks reflect the actual prices a customer would pay for a one-time purchase of the stated components.
Individually negotiated discounts are not permitted. Special prices based on assumptions about past or future purchases are not permitted.
All discounts reflect standard pricing policies for the listed components. For complete details, see the pricing section of the TPC
benchmark specifications. If you find that the stated prices are not available according to these terms, please inform the TPC at
[email protected] . Thank you.
Page 6
Page vi
TPC Benchmark H Full Disclosure Report
© Hitachi, Ltd. 2013. All rights reserved.
Hitachi BladeSymphony BS2000
using Hitachi Advanced Data
Binder 01-02
TPC-H Rev. 2.16.0
TPC-Pricing Rev. 1.7.0
Report Date:
Oct 19, 2013
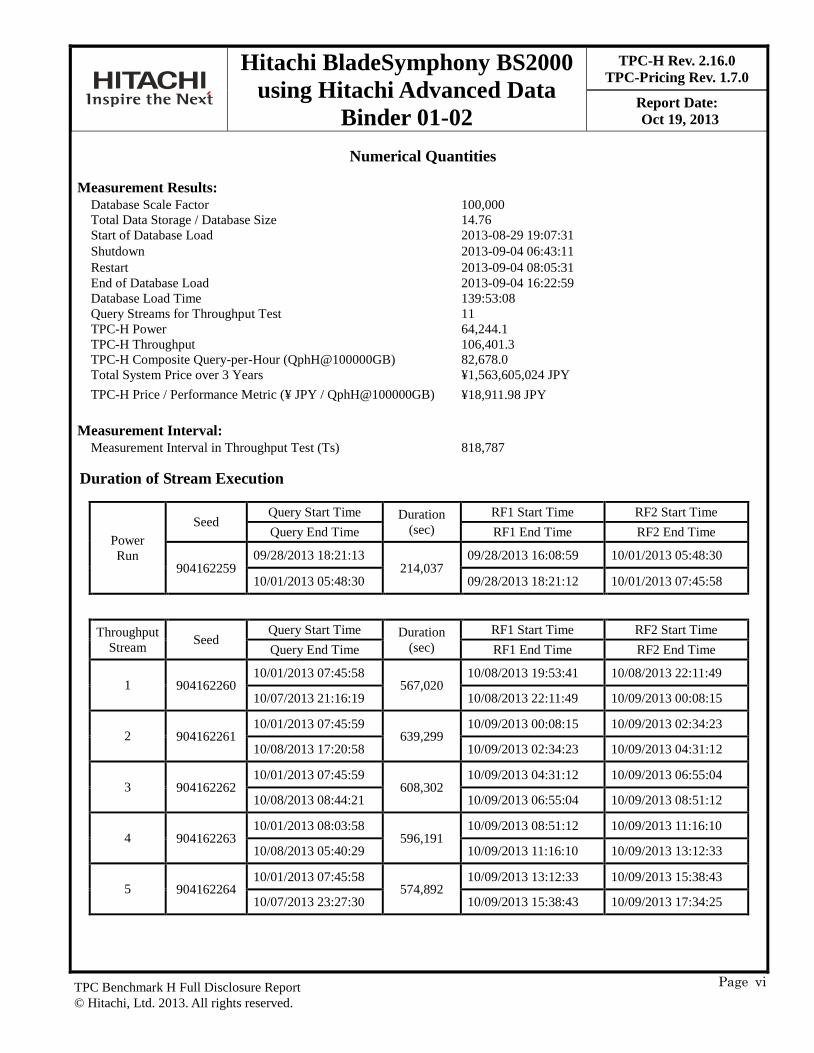
Numerical Quantities
Measurement Results:
Database Scale Factor 100,000
Total Data Storage / Database Size 14.76
Start of Database Load 2013-08-29 19:07:31
Shutdown 2013-09-04 06:43:11
Restart 2013-09-04 08:05:31
End of Database Load 2013-09-04 16:22:59
Database Load Time 139:53:08
Query Streams for Throughput Test 11
TPC-H Power 64,244.1
TPC-H Throughput 106,401.3
TPC-H Composite Query-per-Hour (QphH@100000GB) 82,678.0
Total System Price over 3 Years ¥1,563,605,024 JPY
TPC-H Price / Performance Metric (¥ JPY / QphH@100000GB) ¥18,911.98 JPY
Measurement Interval:
Measurement Interval in Throughput Test (Ts) 818,787
Duration of Stream Execution
Power
Run
Seed Query Start Time Duration
(sec)
RF1 Start Time RF2 Start Time
Query End Time RF1 End Time RF2 End Time
904162259 09/28/2013 18:21:13
214,037 09/28/2013 16:08:59 10/01/2013 05:48:30
10/01/2013 05:48:30 09/28/2013 18:21:12 10/01/2013 07:45:58
Throughput
Stream Seed
Query Start Time Duration
(sec)
RF1 Start Time RF2 Start Time
Query End Time RF1 End Time RF2 End Time
1 904162260 10/01/2013 07:45:58
567,020 10/08/2013 19:53:41 10/08/2013 22:11:49
10/07/2013 21:16:19 10/08/2013 22:11:49 10/09/2013 00:08:15
2 904162261 10/01/2013 07:45:59
639,299 10/09/2013 00:08:15 10/09/2013 02:34:23
10/08/2013 17:20:58 10/09/2013 02:34:23 10/09/2013 04:31:12
3 904162262 10/01/2013 07:45:59
608,302 10/09/2013 04:31:12 10/09/2013 06:55:04
10/08/2013 08:44:21 10/09/2013 06:55:04 10/09/2013 08:51:12
4 904162263 10/01/2013 08:03:58
596,191 10/09/2013 08:51:12 10/09/2013 11:16:10
10/08/2013 05:40:29 10/09/2013 11:16:10 10/09/2013 13:12:33
5 904162264 10/01/2013 07:45:58
574,892 10/09/2013 13:12:33 10/09/2013 15:38:43
10/07/2013 23:27:30 10/09/2013 15:38:43 10/09/2013 17:34:25
Page 7
Page vii
TPC Benchmark H Full Disclosure Report
© Hitachi, Ltd. 2013. All rights reserved.
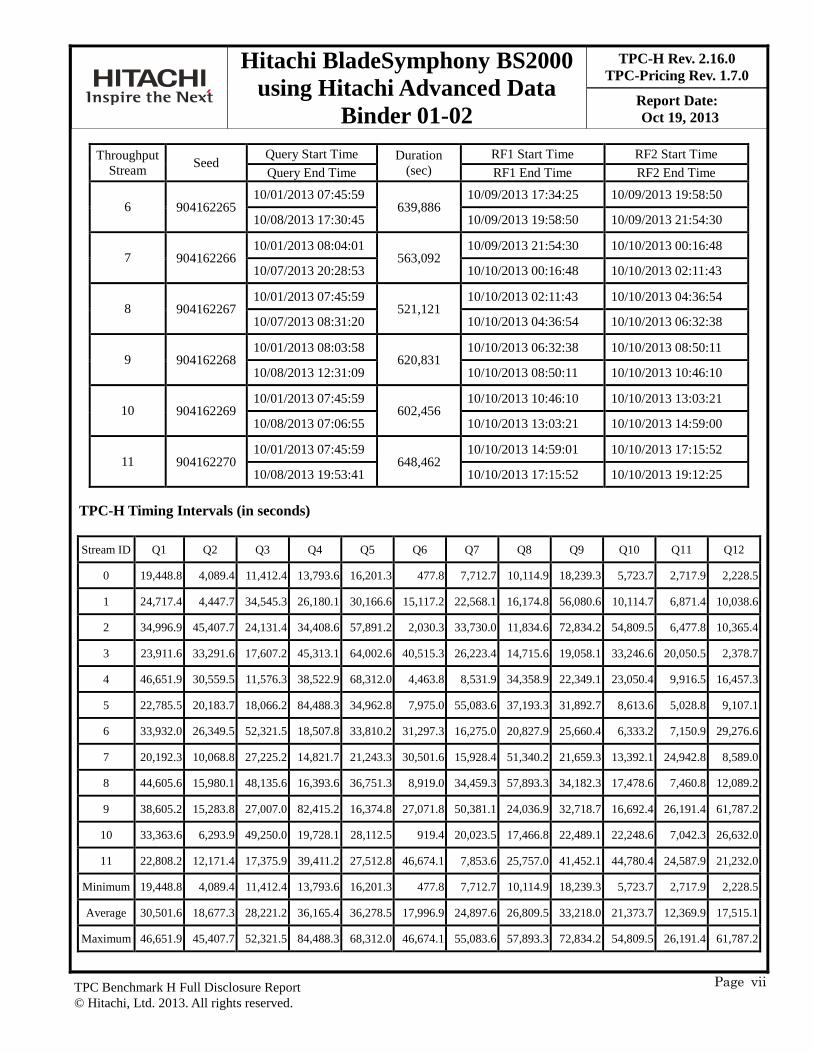
Throughput
Stream Seed
Query Start Time Duration
(sec)
RF1 Start Time RF2 Start Time
Query End Time RF1 End Time RF2 End Time
6 904162265 10/01/2013 07:45:59
639,886 10/09/2013 17:34:25 10/09/2013 19:58:50
10/08/2013 17:30:45 10/09/2013 19:58:50 10/09/2013 21:54:30
7 904162266 10/01/2013 08:04:01
563,092 10/09/2013 21:54:30 10/10/2013 00:16:48
10/07/2013 20:28:53 10/10/2013 00:16:48 10/10/2013 02:11:43
8 904162267 10/01/2013 07:45:59
521,121 10/10/2013 02:11:43 10/10/2013 04:36:54
10/07/2013 08:31:20 10/10/2013 04:36:54 10/10/2013 06:32:38
9 904162268 10/01/2013 08:03:58
620,831 10/10/2013 06:32:38 10/10/2013 08:50:11
10/08/2013 12:31:09 10/10/2013 08:50:11 10/10/2013 10:46:10
10 904162269 10/01/2013 07:45:59
602,456 10/10/2013 10:46:10 10/10/2013 13:03:21
10/08/2013 07:06:55 10/10/2013 13:03:21 10/10/2013 14:59:00
11 904162270 10/01/2013 07:45:59
648,462 10/10/2013 14:59:01 10/10/2013 17:15:52
10/08/2013 19:53:41 10/10/2013 17:15:52 10/10/2013 19:12:25
TPC-H Timing Intervals (in seconds)
Stream ID Q1 Q2 Q3 Q4 Q5 Q6 Q7 Q8 Q9 Q10 Q11 Q12
0 19,448.8 4,089.4 11,412.4 13,793.6 16,201.3 477.8 7,712.7 10,114.9 18,239.3 5,723.7 2,717.9 2,228.5
1 24,717.4 4,447.7 34,545.3 26,180.1 30,166.6 15,117.2 22,568.1 16,174.8 56,080.6 10,114.7 6,871.4 10,038.6
2 34,996.9 45,407.7 24,131.4 34,408.6 57,891.2 2,030.3 33,730.0 11,834.6 72,834.2 54,809.5 6,477.8 10,365.4
3 23,911.6 33,291.6 17,607.2 45,313.1 64,002.6 40,515.3 26,223.4 14,715.6 19,058.1 33,246.6 20,050.5 2,378.7
4 46,651.9 30,559.5 11,576.3 38,522.9 68,312.0 4,463.8 8,531.9 34,358.9 22,349.1 23,050.4 9,916.5 16,457.3
5 22,785.5 20,183.7 18,066.2 84,488.3 34,962.8 7,975.0 55,083.6 37,193.3 31,892.7 8,613.6 5,028.8 9,107.1
6 33,932.0 26,349.5 52,321.5 18,507.8 33,810.2 31,297.3 16,275.0 20,827.9 25,660.4 6,333.2 7,150.9 29,276.6
7 20,192.3 10,068.8 27,225.2 14,821.7 21,243.3 30,501.6 15,928.4 51,340.2 21,659.3 13,392.1 24,942.8 8,589.0
8 44,605.6 15,980.1 48,135.6 16,393.6 36,751.3 8,919.0 34,459.3 57,893.3 34,182.3 17,478.6 7,460.8 12,089.2
9 38,605.2 15,283.8 27,007.0 82,415.2 16,374.8 27,071.8 50,381.1 24,036.9 32,718.7 16,692.4 26,191.4 61,787.2
10 33,363.6 6,293.9 49,250.0 19,728.1 28,112.5 919.4 20,023.5 17,466.8 22,489.1 22,248.6 7,042.3 26,632.0
11 22,808.2 12,171.4 17,375.9 39,411.2 27,512.8 46,674.1 7,853.6 25,757.0 41,452.1 44,780.4 24,587.9 21,232.0
Minimum 19,448.8 4,089.4 11,412.4 13,793.6 16,201.3 477.8 7,712.7 10,114.9 18,239.3 5,723.7 2,717.9 2,228.5
Average 30,501.6 18,677.3 28,221.2 36,165.4 36,278.5 17,996.9 24,897.6 26,809.5 33,218.0 21,373.7 12,369.9 17,515.1
Maximum 46,651.9 45,407.7 52,321.5 84,488.3 68,312.0 46,674.1 55,083.6 57,893.3 72,834.2 54,809.5 26,191.4 61,787.2
Hitachi BladeSymphony BS2000
using Hitachi Advanced Data
Binder 01-02
TPC-H Rev. 2.16.0
TPC-Pricing Rev. 1.7.0
Report Date:
Oct 19, 2013
Page 8
Page viii
TPC Benchmark H Full Disclosure Report
© Hitachi, Ltd. 2013. All rights reserved.
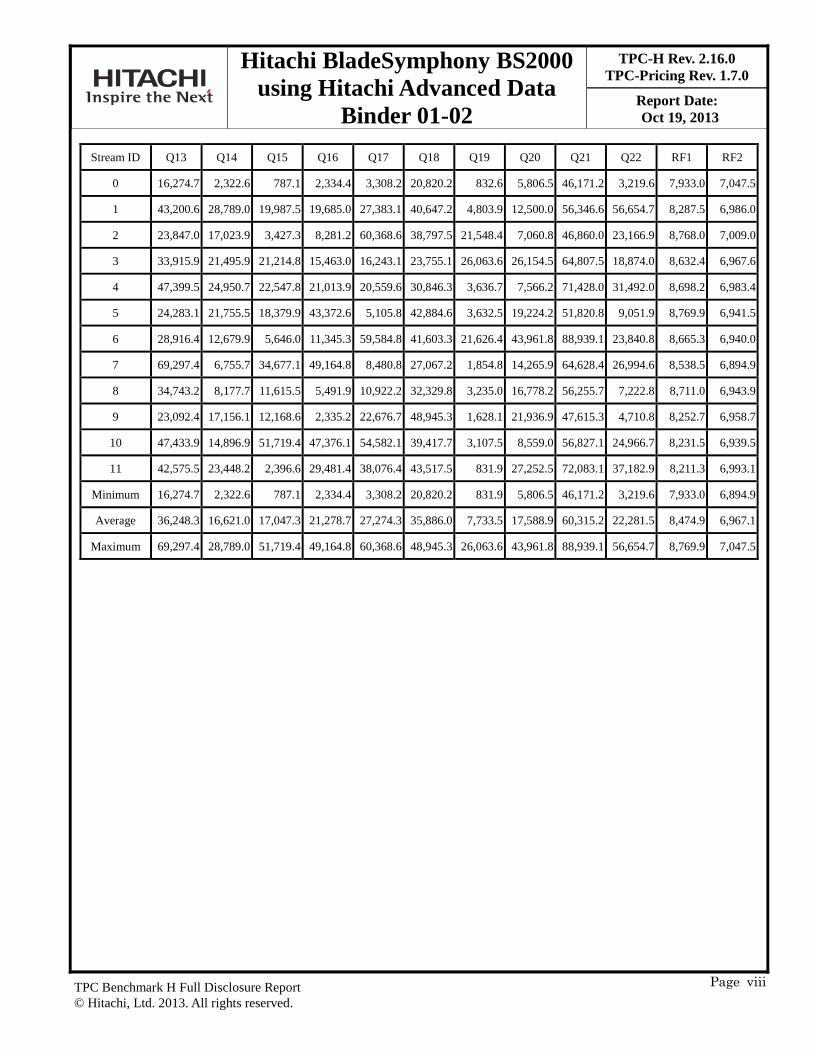
Stream ID Q13 Q14 Q15 Q16 Q17 Q18 Q19 Q20 Q21 Q22 RF1 RF2
0 16,274.7 2,322.6 787.1 2,334.4 3,308.2 20,820.2 832.6 5,806.5 46,171.2 3,219.6 7,933.0 7,047.5
1 43,200.6 28,789.0 19,987.5 19,685.0 27,383.1 40,647.2 4,803.9 12,500.0 56,346.6 56,654.7 8,287.5 6,986.0
2 23,847.0 17,023.9 3,427.3 8,281.2 60,368.6 38,797.5 21,548.4 7,060.8 46,860.0 23,166.9 8,768.0 7,009.0
3 33,915.9 21,495.9 21,214.8 15,463.0 16,243.1 23,755.1 26,063.6 26,154.5 64,807.5 18,874.0 8,632.4 6,967.6
4 47,399.5 24,950.7 22,547.8 21,013.9 20,559.6 30,846.3 3,636.7 7,566.2 71,428.0 31,492.0 8,698.2 6,983.4
5 24,283.1 21,755.5 18,379.9 43,372.6 5,105.8 42,884.6 3,632.5 19,224.2 51,820.8 9,051.9 8,769.9 6,941.5
6 28,916.4 12,679.9 5,646.0 11,345.3 59,584.8 41,603.3 21,626.4 43,961.8 88,939.1 23,840.8 8,665.3 6,940.0
7 69,297.4 6,755.7 34,677.1 49,164.8 8,480.8 27,067.2 1,854.8 14,265.9 64,628.4 26,994.6 8,538.5 6,894.9
8 34,743.2 8,177.7 11,615.5 5,491.9 10,922.2 32,329.8 3,235.0 16,778.2 56,255.7 7,222.8 8,711.0 6,943.9
9 23,092.4 17,156.1 12,168.6 2,335.2 22,676.7 48,945.3 1,628.1 21,936.9 47,615.3 4,710.8 8,252.7 6,958.7
10 47,433.9 14,896.9 51,719.4 47,376.1 54,582.1 39,417.7 3,107.5 8,559.0 56,827.1 24,966.7 8,231.5 6,939.5
11 42,575.5 23,448.2 2,396.6 29,481.4 38,076.4 43,517.5 831.9 27,252.5 72,083.1 37,182.9 8,211.3 6,993.1
Minimum 16,274.7 2,322.6 787.1 2,334.4 3,308.2 20,820.2 831.9 5,806.5 46,171.2 3,219.6 7,933.0 6,894.9
Average 36,248.3 16,621.0 17,047.3 21,278.7 27,274.3 35,886.0 7,733.5 17,588.9 60,315.2 22,281.5 8,474.9 6,967.1
Maximum 69,297.4 28,789.0 51,719.4 49,164.8 60,368.6 48,945.3 26,063.6 43,961.8 88,939.1 56,654.7 8,769.9 7,047.5
Hitachi BladeSymphony BS2000
using Hitachi Advanced Data
Binder 01-02
TPC-H Rev. 2.16.0
TPC-Pricing Rev. 1.7.0
Report Date:
Oct 19, 2013
Page 9
Page ix
TPC Benchmark H Full Disclosure Report
© Hitachi, Ltd. 2013. All rights reserved.
Table of Contents
TPC Benchmark H Overview ............................................................................................................................................................. 1
0. General Items .............................................................................................................................................................................. 2
0.1. Test Sponsor ....................................................................................................................................................................... 2
0.2. Parameter Settings .............................................................................................................................................................. 2
0.3. Configuration Diagram ...................................................................................................................................................... 2
1. Clause 1 – Logical Database Design........................................................................................................................................... 4
1.1. Database Definition Statements ......................................................................................................................................... 4
1.2. Physical Organization ........................................................................................................................................................ 4
1.3. Horizontal Partitioning ....................................................................................................................................................... 4
1.4. Replication ......................................................................................................................................................................... 4
1.5. Tunable Parameters ............................................................................................................................................................ 4
2. Clause 2 – Queries and Refresh Function-Related Items ............................................................................................................ 5
2.1. Query Language ................................................................................................................................................................. 5
2.2. QGen Version Verification ................................................................................................................................................. 5
2.3. Query Text and Output Data from Database ...................................................................................................................... 5
2.4. Query Substitution Parameters and Seeds Used ................................................................................................................. 5
2.5. Query Isolation Level ......................................................................................................................................................... 5
2.6. Source Code of Refresh Functions ..................................................................................................................................... 5
3. Clause 3 – Database System Properties Related Items ............................................................................................................... 6
3.1. ACID Properties ................................................................................................................................................................. 6
3.2. Atomicity Requirements .................................................................................................................................................... 6
3.2.1. Atomicity of Completed Transactions ....................................................................................................................... 6
3.2.2. Atomicity of Aborted Transactions ............................................................................................................................ 6
3.3. Consistency Requirements ................................................................................................................................................. 6
3.3.1. Consistency Test ........................................................................................................................................................ 6
3.4. Isolation Requirements....................................................................................................................................................... 7
3.4.1. Isolation Test 1 - Read-Write Conflict with Commit ................................................................................................. 7
3.4.2. Isolation Test 2 - Read-Write Conflict with Rollback ................................................................................................ 7
3.4.3. Isolation Test3 - Write-Write Conflict with Commit ................................................................................................. 8
3.4.4. Isolation Test 4 - Write-Write Conflict with Rollback ............................................................................................... 8
3.4.5. Isolation Test 5 - Concurrent Progress of Read and Write Transactions .................................................................... 8
3.4.6. Isolation Test 6 – Read-Only Query Conflict with Update Transaction .................................................................... 8
3.5. Durability Requirements .................................................................................................................................................... 9
3.5.1. System Crash / Memory Failure ................................................................................................................................ 9
3.5.2. Loss of External Power .............................................................................................................................................. 9
3.5.3. Failure of a Durable Medium ................................................................................................................................... 10
3.5.4. Failure of Write-Back Cache on a Storage Controller ............................................................................................. 10
3.5.5. Power Failure on a Storage Controller ..................................................................................................................... 10
4. Clause 4 – Scaling and Database Population Related Items ..................................................................................................... 12
4.1. Initial Cardinality of Tables .............................................................................................................................................. 12
4.2. Distribution of Tables and Logs Across Media ................................................................................................................ 12
4.3. Mapping of Database Partitions/Replications .................................................................................................................. 17
4.4. Implementation of Data Redundancy Mechanism ........................................................................................................... 17
4.5. Modifications to the DBGen ............................................................................................................................................ 17
4.6. Database load Time .......................................................................................................................................................... 17
4.7. Database Storage Ratio .................................................................................................................................................... 17
4.8. Database Load Mechanism Detail and Illustration .......................................................................................................... 17
Page 10
Page x
TPC Benchmark H Full Disclosure Report
© Hitachi, Ltd. 2013. All rights reserved.
4.9. Qualification Database Configuration .............................................................................................................................. 18
4.10. Memory to Database Size Ratio ....................................................................................................................................... 18
5. Clause 5 – Performance Metrics and Execution Rules Related Items ...................................................................................... 19
5.1. System Activity between Load and Performance Test ..................................................................................................... 19
5.2. Steps in the Power Test .................................................................................................................................................... 19
5.3. Timing Intervals for Each Query and Refresh Functions ................................................................................................. 19
5.4. Number of Streams for Throughput Test .......................................................................................................................... 19
5.5. Start and End Date/Times for Each Query Stream ........................................................................................................... 19
5.6. Total Elapsed Time of the Measurement Interval ............................................................................................................. 19
5.7. Refresh Function Start Data/Time and Finish Date/Time ................................................................................................ 19
5.8. Performance Metrics ........................................................................................................................................................ 20
5.9. The Performance Metric and Numerical Quantities from Both Runs .............................................................................. 20
5.10. System Activity Between Performance Test .................................................................................................................... 20
5.11. Documentation to satisfy Clause 5.2.7 ............................................................................................................................. 20
5.12. Query Output Validation .................................................................................................................................................. 20
6. Clause 6 – SUT and Driver Implementation Related Items ...................................................................................................... 21
6.1. Driver ............................................................................................................................................................................... 21
6.2. Implementation Specific Layer ........................................................................................................................................ 21
6.3. Profile-Directed Optimization .......................................................................................................................................... 21
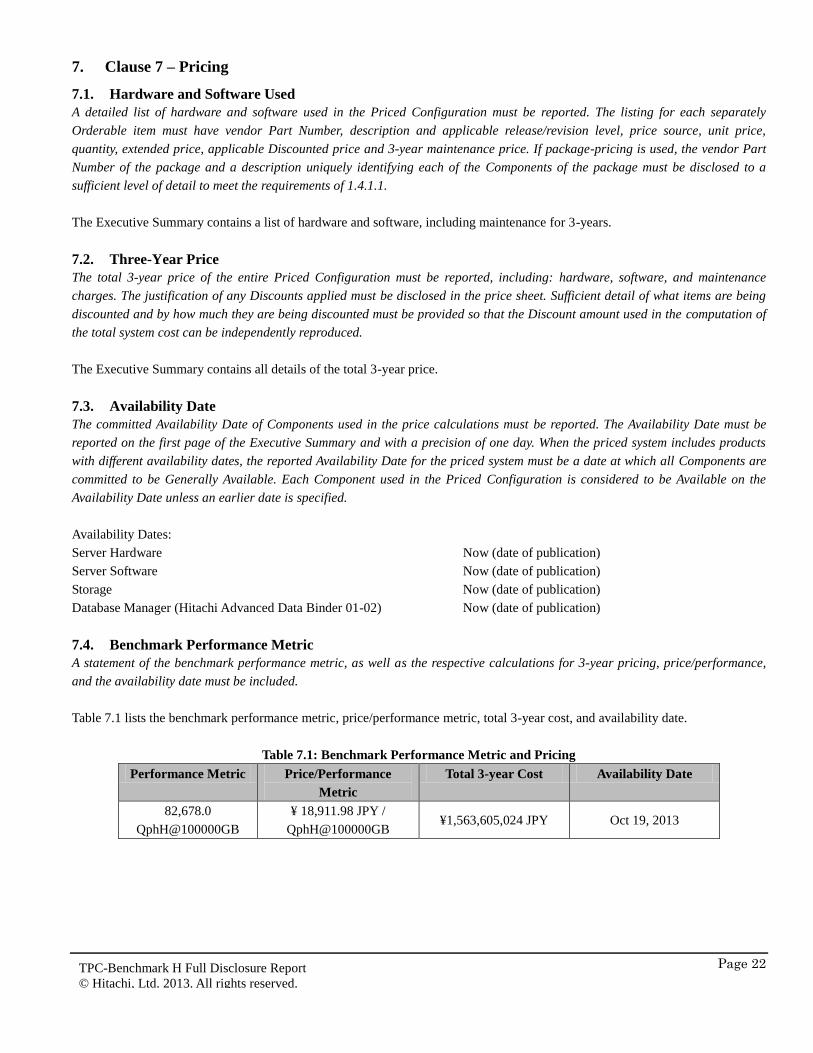
7. Clause 7 – Pricing ..................................................................................................................................................................... 22
7.1. Hardware and Software Used ........................................................................................................................................... 22
7.2. Three-Year Price .............................................................................................................................................................. 22
7.3. Availability Date .............................................................................................................................................................. 22
7.4. Benchmark Performance Metric ...................................................................................................................................... 22
8. Clause 8 – Supporting Files Index Table .................................................................................................................................. 23
9. Clause 9 – Audit Related Items ................................................................................................................................................. 24
Page 11
Page 1
TPC-Benchmark H Full Disclosure Report
© Hitachi, Ltd. 2013. All rights reserved.
TPC Benchmark H Overview
The TPC Benchmark™ H (TPC-H) is a decision support benchmark. It consists of a suite of business oriented ad-hoc queries and
concurrent data modifications. The queries and the data populating the database have been chosen to have broad industry-wide
relevance while maintaining a sufficient degree of ease of implementation. This benchmark illustrates decision support systems
that:
Examine large volumes of data
Execute queries with a high degree of complexity
Give answers to critical business questions
TPC-H evaluates the performance of various decision support systems by the execution of sets of queries against a standard
database under controlled conditions. The TPC-H queries:
Give answers to real-world business questions
Simulate generated ad-hoc queries (e.g., via a point and click GUI interface)
Are far more complex than most OLTP transactions
Include a rich breadth of operators and selectivity constraints
Generate intensive activity on the part of the database server component of the system under test
Are executed against a database complying to specific population and scaling requirements
Are implemented with constraints derived from staying closely synchronized with an on-line production database
Page 12
Page 2
TPC-Benchmark H Full Disclosure Report
© Hitachi, Ltd. 2013. All rights reserved.
0. General Items
0.1. Test Sponsor
A statement identifying the benchmark sponsor(s) and other participating companies must be provided.
This benchmark was sponsored by Hitachi, Ltd.
0.2. Parameter Settings
Settings must be provided for all customer-tunable parameters and options that have been changed from the defaults found in
actual products, including but not limited to:
Database tuning options;
Optimizer/Query execution options;
Query processing tool/language configuration parameters;
Recovery/commit options;
Consistency/locking options;
Operating system and configuration parameters;
Configuration parameters and options for any other software component incorporated into the pricing structure;
Compiler optimization options.
The Supporting Files Archive contains all the parameters and options for Hitachi Advanced Data Binder and operating system.
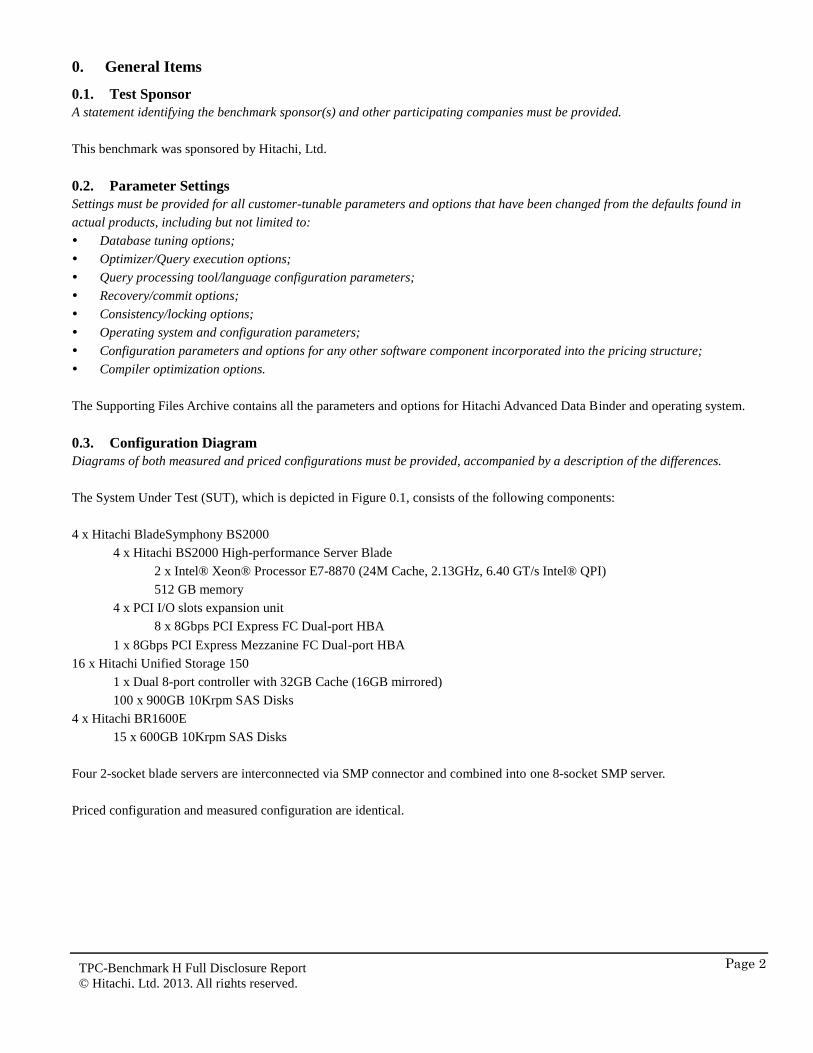
0.3. Configuration Diagram
Diagrams of both measured and priced configurations must be provided, accompanied by a description of the differences.
The System Under Test (SUT), which is depicted in Figure 0.1, consists of the following components:
4 x Hitachi BladeSymphony BS2000
4 x Hitachi BS2000 High-performance Server Blade
2 x Intel® Xeon® Processor E7-8870 (24M Cache, 2.13GHz, 6.40 GT/s Intel® QPI)
512 GB memory
4 x PCI I/O slots expansion unit
8 x 8Gbps PCI Express FC Dual-port HBA
1 x 8Gbps PCI Express Mezzanine FC Dual-port HBA
16 x Hitachi Unified Storage 150
1 x Dual 8-port controller with 32GB Cache (16GB mirrored)
100 x 900GB 10Krpm SAS Disks
4 x Hitachi BR1600E
15 x 600GB 10Krpm SAS Disks
Four 2-socket blade servers are interconnected via SMP connector and combined into one 8-socket SMP server.
Priced configuration and measured configuration are identical.
Page 13
Page 3
TPC-Benchmark H Full Disclosure Report
© Hitachi, Ltd. 2013. All rights reserved.
BS2000 #4 (Slave Node)
BS2000 #3 (Slave Node)
BS2000 #2 (Slave Node)
16 x Hitachi Unified Storage 150 (HUS 150)
System Management Server
1 x HA8000 RS210
4 x Hitachi BladeSymphony BS2000 High-performance Server Blade
Each with:
- 8 x Intel® Xeon® Processor E7-8870
- 2TB (4 x 512GB) Memory- 1 x 8Gbps PCI Express Mezzanine FC Dual-port HBA
- Red Hat® Enterprise Linux® 6.2
- Hitachi Advanced Data Binder 01-02
- 1 x BR1600E (OS, boot drive and binaries)
- 15 x 600GB 10Krpm SAS disks
- 4 x PCI I/O slot expansion unit
- 8 x 8Gbps PCI Express FC Dual-port HBA
Ethernet 1Gbps
Each with:
- 100 x 900GB 10Krpm SAS disks
- 1 x Dual 8-port controller w/ 32GB cache
32 FC cables
4 x 8Gbps 24 port FC Switch
32 FC cables
System Under Test
224 FC cables
BS2000 #1 (Master Node)
2 FC cables
Figure 0.1: Measured and Priced System Configuration
Page 14
Page 4
TPC-Benchmark H Full Disclosure Report
© Hitachi, Ltd. 2013. All rights reserved.
1. Clause 1 – Logical Database Design
1.1. Database Definition Statements
Listings must be provided for all table definition statements and all other statements used to set-up the test and qualification
databases. All listings must be reported in the supporting files archive.
The Supporting Files Archive contains the scripts which define the tables and indexes for TPC-H database.
1.2. Physical Organization
The physical organization of tables and indices within the test and qualification databases must be disclosed. If the column
ordering of any table is different from that specified in Clause 1.4, it must be noted. The physical organization of tables must be
reported in the supporting files archive.
The column ordering was changed for customer, orders and lineitem tables. The Supporting Files Archive contains the definitions
of these tables.
1.3. Horizontal Partitioning
Horizontal partitioning of tables and rows in the test and qualification databases (see Clause 1.5.4) must be disclosed. Scripts to
perform horizontal partitioning must be reported in the supporting files archive.
Horizontal partitioning was not used.
1.4. Replication
Any replication of physical objects must be disclosed and must conform to the requirements of Clause 1.5.7. Scripts to perform
any replication must be reported in the supporting files archive.
The physical objects stored the TPC-H database are shared among all the server nodes. No replication was used.
1.5. Tunable Parameters
Script or text for all hardware and software tunable parameters must be reported in the supporting files archive.
All software parameters changed from their defaults are reported in the Supporting Files Archive.
Page 15
Page 5
TPC-Benchmark H Full Disclosure Report
© Hitachi, Ltd. 2013. All rights reserved.
2. Clause 2 – Queries and Refresh Function-Related Items
2.1. Query Language
The query language used to implement the queries must be identified.
SQL was the query language used to implement all queries.
2.2. QGen Version Verification
The version number, release number, modification number, and patch level of QGen must be disclosed. Any modifications to the
QGen (see Clause 2.1.4) source code (see Appendix D) must be reported in the supporting files archive.
Version 2.16.0 of the DBGen package was not available at the time of testing. QGen 2.15.0 was used with the modifications
approved by the TPC for release 2.16.0. These approved modifications were detailed in the FDR of the TPC-H result published by
Oracle on June 7, 2013 for the SPARC T5-4 Server. In addition, the reference dataset for the query substitution parameters could
not be verified since the 2.16.0 dataset is not available.
2.3. Query Text and Output Data from Database
The executable query text used for query validation must be reported in the supporting files archive along with the corresponding
output data generated during the execution of the query text against the qualification database. If minor modifications (see
Clause 2.2.3) have been applied to any functional query definitions or approved variants in order to obtain executable query text,
these modifications must be disclosed and justified. The justification for a particular minor query modification can apply
collectively to all queries for which it has been used.
The Supporting Files Archive contains the executable query text and output data. The following modifications were used:
The “limit” function is used to restrict the number of output rows in Q2, Q3, Q10, Q18, and Q21.
The “interval” function doesn’t use to perform date arithmetic in Q1, Q4, Q5, Q6, Q10, Q12, Q14, Q15, and Q20, e.g.
“l_shipdate <= date '1998-12-01' - :1 DAY”.
The “substr” function is used to extract a part of string in Q22.
The “;” is used to insert comment line in ALL queries.
Q15 Variant A is used.
2.4. Query Substitution Parameters and Seeds Used
All the query substitution parameters used during the performance test must be disclosed in tabular format, along with the seeds
used to generate these parameters.
The Supporting Files Archive contains the query substitution parameters and the seeds used.
2.5. Query Isolation Level
The isolation level used to run the queries must be disclosed. If the isolation level does not map closely to one of the isolation
levels defined in Clause 3.4, additional descriptive detail must be provided.
The queries were run with isolation Level 1 (READ COMMITED of Hitachi Advanced Data Binder). The refresh functions were
run with Level 3 (REPEATABLE READ of Hitachi Advanced Data Binder).
2.6. Source Code of Refresh Functions
The details of how the refresh functions were implemented must be reported in the supporting files archive (including source code
of any non-commercial program used).
The Supporting Files Archive contains the source codes of the refresh functions.
Page 16
Page 6
TPC-Benchmark H Full Disclosure Report
© Hitachi, Ltd. 2013. All rights reserved.
3. Clause 3 – Database System Properties Related Items
3.1. ACID Properties
The results of the ACID tests must be disclosed along with a description of how the ACID requirements were met. All code
(including queries, stored procedures etc.) used to test the ACID requirements and their entire output must be reported in the
supporting files archive.
All the ACID tests are conducted according to the specification. The steps performed are outlined in the following sections. The
Supporting Files Archive contains all the source codes, the scripts, and their output files.
3.2. Atomicity Requirements
The system under test must guarantee that transactions are atomic; the system will either perform all individual operations on the
data, or will assure that no partially-completed operations leave any effects on the data.
3.2.1. Atomicity of Completed Transactions
Perform the ACID Transaction for a randomly selected set of input data and verify that the appropriate rows have been changed
in the ORDERS, LINEITEM, and HISTORY tables.
The following steps were performed to verify the atomicity of the completed transactions:
1. The total price from the ORDERS table and the extended price from the LINEITEM table were retrieved for a randomly
selected order key.
2. The ACID transaction was performed using the order key from Step 1.
3. The ACID transaction was COMMITTED.
4. The total price from the ORDERS table and the extended price from the LINEITEM table were retrieved for the same order
key used in Step 1. It was verified that the appropriate rows had been changed.
3.2.2. Atomicity of Aborted Transactions
Perform the ACID Transaction for a randomly selected set of input data, substituting a ROLLBACK of the transaction for the
COMMIT of the transaction. Verify that the appropriate rows have not been changed in the ORDERS, LINEITEM, and HISTORY
tables.
The following steps were performed to verify the atomicity of the aborted transactions:
1. The total price from the ORDERS table and the extended price from the LINEITEM table were retrieved for a randomly
selected order key.
2. The ACID transaction was performed using the order key from Step 1. The transaction is stopped prior to the commit.
3. The ACID transaction was ROLLED BACK.
4. The total price from the ORDERS table and the extended price from the LINEITEM table were retrieved for the same order
key used in Step 1. It was verified that the appropriate rows had not been changed.
3.3. Consistency Requirements
Consistency is the property of the application that requires any execution of transactions to take the database from one consistent
state to another.
3.3.1. Consistency Test
A consistent state for the TPC-H database is defined to exist when:
O_TOTALPRICE =SUM(trunc(trunc(L_EXTENDEDPRICE *(1 - L_DISCOUNT),2) * (1+L_TAX),2))
for each ORDERS and LINEITEM defined by (O_ORDERKEY = L_ORDERKEY)
Page 17
Page 7
TPC-Benchmark H Full Disclosure Report
© Hitachi, Ltd. 2013. All rights reserved.
The following three queries were executed before and after executing ACID transactions in order to verify that ORDERS table
and LINEITEM table were in consistent state. The program source codes to execute the queries are included in the Supporting
Files Archive.
INSERT INTO temp_con_output
SELECT o.O_ORDERKEY, o.O_TOTALPRICE, l.L_ORDERKEY,
SUM(trunc((trunc((L_EXTENDEDPRICE * ( 1 - L_DISCOUNT )),2) * ( 1 + L_TAX )),2)),
a.SEQ_NUM
FROM ACID_VALUES_LIST a
INNER JOIN ORDERS o ON a.ACID_O_KEY = o.O_ORDERKEY JOIN LINEITEM l
ON o.O_ORDERKEY = l.L_ORDERKEY WHERE a.ACID_TEST_NAME = 'Consistency_Durability'
GROUP BY o.O_ORDERKEY, o.O_TOTALPRICE, l.L_ORDERKEY, a.SEQ_NUM;
SELECT * FROM temp_con_output WHERE O_TOTALPRICE <> LINEITEM_SUM;
SELECT O_ORDERKEY, O_TOTALPRICE, L_ORDERKEY, LINEITEM_SUM, O_TOTALPRICE - LINEITEM_SUM FROM
temp_con_output;
To verify the consistency between the ORDERS, and LINEITEM tables, perform the following steps:
1. The consistency of the ORDERS and LINEITEM tables was verified.
2. One hundred ACID Transactions were submitted from each of 12 streams.
3. The consistency of the ORDERS and LINEITEM tables was re-verified.
3.4. Isolation Requirements
Operations of concurrent transactions must yield results which are indistinguishable from the results which would be obtained by
forcing each transaction to be serially executed to completion in the proper order.
3.4.1. Isolation Test 1 - Read-Write Conflict with Commit
Demonstrate isolation for the read-write conflict of a read-write transaction and a read-only transaction when the read-write
transaction is committed.
The following steps were performed to satisfy the test of isolation for a read-only and a read-write committed transaction:
1. An ACID Transaction was started for a randomly selected O_KEY, L_KEY, and DELTA. The ACID Transaction suspended
prior to COMMIT.
2. An ACID Query was started for the same O_KEY as in Step 1. The ACID Query did not see the uncommitted changes made
by the ACID Transaction.
3. The ACID Query completed.
4. The ACID Transaction was resumed and COMMITTED.
3.4.2. Isolation Test 2 - Read-Write Conflict with Rollback
Demonstrate isolation for the read-write conflict of a read-write transaction and a read-only transaction when the read-write
transaction is rolled back.
The following steps were performed to satisfy the test of isolation for a read-only and a rolled back read-write transaction:
1. An ACID Transaction was started for a randomly selected O_KEY, L_KEY, and DELTA. The ACID Transaction suspended
Page 18
Page 8
TPC-Benchmark H Full Disclosure Report
© Hitachi, Ltd. 2013. All rights reserved.
prior to COMMIT.
2. An ACID Query was started for the same O_KEY as in Step 1. The ACID Query did not see the uncommitted changes made
by the ACID Transaction.
3. The ACID Query completed.
4. The ACID Transaction was resumed and ROLLED BACK.
3.4.3. Isolation Test3 - Write-Write Conflict with Commit
Demonstrate isolation for the write-write conflict of two update transactions when the first transaction is committed.
The following steps were performed to verify isolation of two update transactions:
1. An ACID Transaction, T1, was started for a randomly selected O_KEY, L_KEY, and DELTA1. The ACID Transaction was
stopped prior to COMMIT.
2. Another ACID Transaction, T2, was started using the same O_KEY, L_KEY and a randomly selected DELTA2.
3. T2 updates returned an error. T2 was aborted (ROLLED BACK) and restarted. (Step3 was repeated until T1 was
COMMITTED.)
4. T1 was allowed to COMMIT and T2 completed.
5. It was verified that: T2.L_EXTENDEDPRICE = T1.L_EXTENDEDPRICE+(DELTA1 * (T1.L_EXTENDEDPRICE /
T1.L_QUANTITY)).
3.4.4. Isolation Test 4 - Write-Write Conflict with Rollback
Demonstrate isolation for the write-write conflict of two update transactions when the first transaction is rolled back.
The following steps were performed to verify isolation of two update transactions:
1. An ACID Transaction, T1, was started for a randomly selected O_KEY, L_KEY, and DELTA1. The ACID Transaction was
stopped prior to ROLLBACK.
2. Another ACID Transaction, T2, was started using the same O_KEY, L_KEY and a randomly selected DELTA2.
3. T2 updates returned an error. T2 was aborted (ROLLED BACK) and restarted. (Step3 was repeated until T1 was ROLLED
BACK.)
4. T1 was allowed to ROLLBACK and T2 completed.
5. It was verified that: T2.L_EXTENDEDPRICE = T1.L_EXTENDEDPRICE.
3.4.5. Isolation Test 5 - Concurrent Progress of Read and Write Transactions
Demonstrate the ability of read and write transactions affecting different database tables to make progress concurrently.
The following steps were performed to verify the ability of read and write transactions affecting different database tables to make
progress concurrently.
1. An ACID Transaction, T1, with randomly selected values of O_KEY, L_KEY and DELTA. T1 was suspended prior to
COMMIT.
2. Another transaction, T2, was starting using random values of PS_PARTKEY and PS_SUPPKEY.
3. T2 completed.
4. T1 was allowed to COMMIT.
5. It was verified that the appropriate rows in the ORDERS, LINEITEM and HISTORY tables were changed.
3.4.6. Isolation Test 6 – Read-Only Query Conflict with Update Transaction
Demonstrate that the continuous submission of arbitrary (read-only) queries against one or more tables of the database does not
indefinitely delay update transactions affecting those tables from making progress.
Page 19
Page 9
TPC-Benchmark H Full Disclosure Report
© Hitachi, Ltd. 2013. All rights reserved.
The following steps were performed to verify isolation of an update transaction during a continuous read-only query:
1. An ACID Transaction, T1, was started, executing Q1 against the qualification database. The substitution parameter was
chosen to be 0 so that the query ran for a sufficient length of time.
2. Before T1 completed, an ACID Transaction, T2, was started using randomly selected values of O_KEY, L_KEY and
DELTA.
3. T2 completed before T1 completed.
4. It was verified that the appropriate rows in the ORDERS, LINEITEM and HISTORY tables were changed.
3.5. Durability Requirements
The SUT must guarantee durability: the ability to preserve the effects of committed transactions and ensure database consistency
after recovery from any one of the failures listed in Clause 3.5.3.
3.5.1. System Crash / Memory Failure
System Crash: Guarantee the database and the effects of committed updates are preserved across an instantaneous interruption
(system crash/system hang) in processing which requires system re-boot to recover.
Memory Failure: Guarantee the database and the effects of committed updates are preserved across failure of all or part of
memory (loss of contents).
Each of these requirements was satisfied in the following two tests: (A) the first test was the single system crash (master node);
(B) the second test was the single system crash (slave node).
3.5.1.1. (A) The Single System Crash on Master Node
The following steps were performed to test a system crash or memory failure:
1. The ORDERS and LINITEM tables were verified to be consistent.
2. Twelve streams of ACID transactions were started.
3. After at least 100 transactions have occurred on each stream and the streams of ACID transactions were still running, the
master node was powered off by using SVP.
4. When power was restored, the system rebooted and the database was restarted.
5. The ORDERS and LINITEM tables were verified to be consistent.
6. The contents of the success files and the HISTORY table were compared and found to match.
3.5.1.2. (B) The Single System Crash on Slave Node
The following steps were performed to test a system crash or memory failure:
1. The ORDERS and LINITEM tables were verified to be consistent.
2. Twelve streams of ACID transactions were started.
3. After at least 100 transactions have occurred on each stream and the streams of ACID transactions were still running, one of
the slave nodes was powered off by using SVP.
4. When power was restored, the system rebooted and the database was restarted.
5. The ORDERS and LINITEM tables were verified to be consistent.
6. The contents of the success files and the HISTORY table were compared and found to match.
3.5.2. Loss of External Power
Loss of External Power: Guarantee the database and the effects of committed updates are preserved during the loss of all external
power to the SUT for an indefinite time period.
Page 20
Page 10
TPC-Benchmark H Full Disclosure Report
© Hitachi, Ltd. 2013. All rights reserved.
The following steps were performed to test the loss of all external power to the SUT:
1. The ORDERS and LINITEM tables were verified to be consistent.
2. Twelve streams of ACID transactions were started.
3. After at least 100 transactions have occurred on each stream and the streams of ACID transactions were still running, all
servers were powered off by using SVP.
4. When power was restored, the system rebooted and the database was restarted.
5. The ORDERS and LINITEM tables were verified to be consistent.
6. The contents of the success files and the HISTORY table were compared and found to match.
3.5.3. Failure of a Durable Medium
Guarantee the database and the effects of committed updates are preserved across a permanent irrecoverable failure of any single
durable medium containing TPC-H database tables.
TPC-H database tables, indexes, and log files are striped over 128 RAID-10 arrays using Logical Volume Manager (LVM). Each
RAID-10 array is composed of 12 physical hard disk drives. Therefore all tables, indexes, and log files are striped over all the
physical hard disk drives of the 128 RAID-10 arrays and a failure of one physical hard disk drive affects all tables, indexes, and
log files at the same time.
The following steps were performed to test the failure of a single disk drive in an array:
1. The ORDERS and LINITEM tables were verified to be consistent.
2. Twelve streams of ACID transactions were started.
3. After at least 100 transactions have occurred on each stream and the streams of ACID transactions were still running, one of
the disk drives in an RAID-10 array was removed. The transactions continued without any interruptions.
4. After each streams completed 200 ACID transactions, the ORDERS and LINITEM tables were verified to be consistent.
5. The contents of the success files and the HISTORY table were compared and found to match.
3.5.4. Failure of Write-Back Cache on a Storage Controller
The following steps were performed to test the failure of a single controller in a storage subsystem:
1. The ORDERS and LINITEM tables were verified to be consistent.
2. Twelve streams of ACID transactions were started.
3. After at least 100 transactions have occurred on each stream and the streams of ACID transactions were still running.
4. A hardware failure was injected into one of the storage controllers.
5. When the storage controller was restored and the storage subsystem with the storage controller was restored, the system
reboots and the database was restarted.
6. The ORDERS and LINITEM tables were verified to be consistent.
7. The contents of the success files and the HISTORY table were compared and found to match.
3.5.5. Power Failure on a Storage Controller
The following steps were performed to test the loss of power to a single controller in a storage subsystem:
1. The ORDERS and LINITEM tables were verified to be consistent.
2. Twelve streams of ACID transactions were started.
3. After at least 100 transactions have occurred on each stream and the streams of ACID transactions were still running.
4. The power was removed from one of the storage controllers.
5. When the power was restored and the storage subsystem with the storage controller was restored, the system reboots and the
Page 21
Page 11
TPC-Benchmark H Full Disclosure Report
© Hitachi, Ltd. 2013. All rights reserved.
database was restarted.
6. The ORDERS and LINITEM tables were verified to be consistent.
7. The contents of the success files and the HISTORY table were compared and found to match.
Page 22
Page 12
TPC-Benchmark H Full Disclosure Report
© Hitachi, Ltd. 2013. All rights reserved.
4. Clause 4 – Scaling and Database Population Related Items
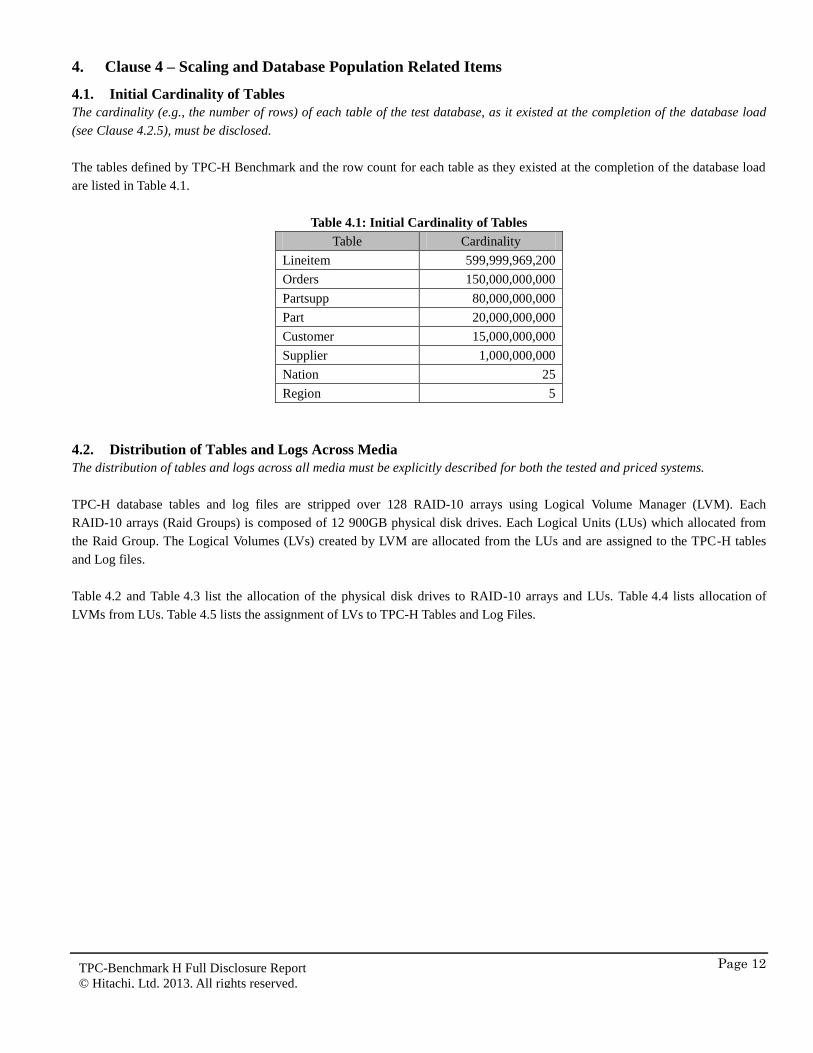
4.1. Initial Cardinality of Tables
The cardinality (e.g., the number of rows) of each table of the test database, as it existed at the completion of the database load
(see Clause 4.2.5), must be disclosed.
The tables defined by TPC-H Benchmark and the row count for each table as they existed at the completion of the database load
are listed in Table 4.1.
Table 4.1: Initial Cardinality of Tables
Table Cardinality
Lineitem 599,999,969,200
Orders 150,000,000,000
Partsupp 80,000,000,000
Part 20,000,000,000
Customer 15,000,000,000
Supplier 1,000,000,000
Nation 25
Region 5
4.2. Distribution of Tables and Logs Across Media
The distribution of tables and logs across all media must be explicitly described for both the tested and priced systems.
TPC-H database tables and log files are stripped over 128 RAID-10 arrays using Logical Volume Manager (LVM). Each
RAID-10 arrays (Raid Groups) is composed of 12 900GB physical disk drives. Each Logical Units (LUs) which allocated from
the Raid Group. The Logical Volumes (LVs) created by LVM are allocated from the LUs and are assigned to the TPC-H tables
and Log files.
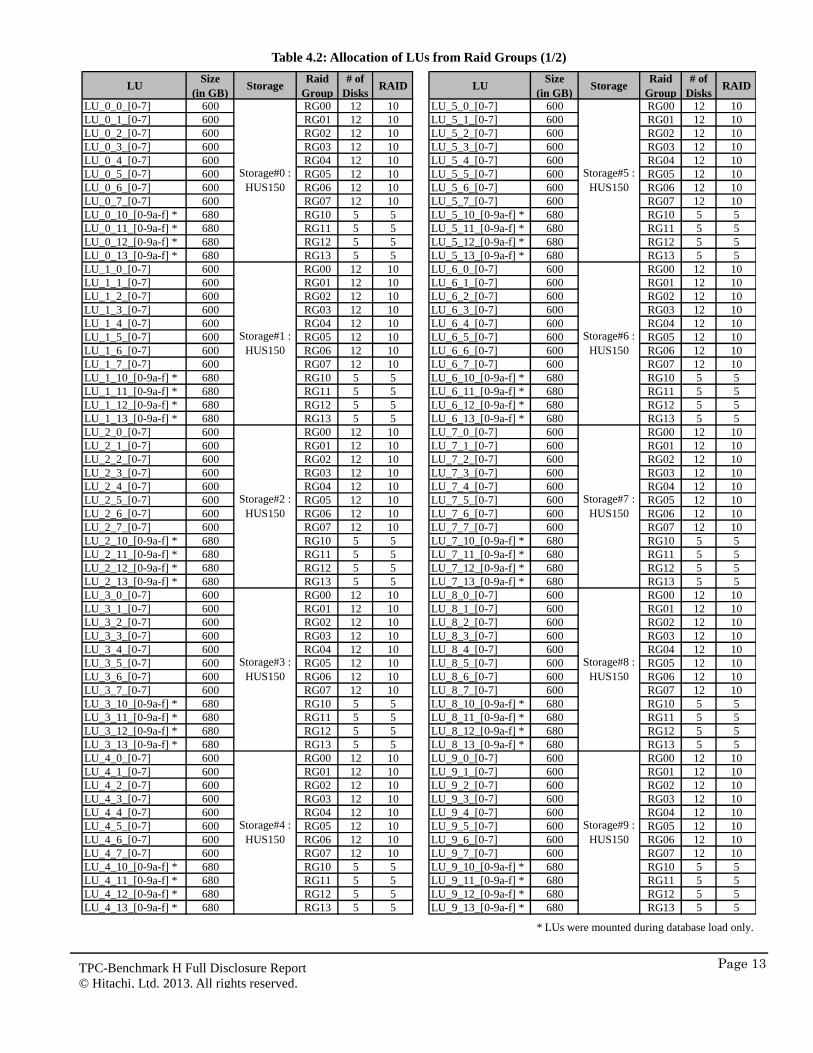
Table 4.2 and Table 4.3 list the allocation of the physical disk drives to RAID-10 arrays and LUs. Table 4.4 lists allocation of
LVMs from LUs. Table 4.5 lists the assignment of LVs to TPC-H Tables and Log Files.
Page 23
Page 13
TPC-Benchmark H Full Disclosure Report
© Hitachi, Ltd. 2013. All rights reserved.
Table 4.2: Allocation of LUs from Raid Groups (1/2)
LUSize
(in GB)Storage
Raid
Group
# of
DisksRAID LU
Size
(in GB)Storage
Raid
Group
# of
DisksRAID
LU_0_0_[0-7] 600 RG00 12 10 LU_5_0_[0-7] 600 RG00 12 10
LU_0_1_[0-7] 600 RG01 12 10 LU_5_1_[0-7] 600 RG01 12 10
LU_0_2_[0-7] 600 RG02 12 10 LU_5_2_[0-7] 600 RG02 12 10
LU_0_3_[0-7] 600 RG03 12 10 LU_5_3_[0-7] 600 RG03 12 10
LU_0_4_[0-7] 600 RG04 12 10 LU_5_4_[0-7] 600 RG04 12 10
LU_0_5_[0-7] 600 RG05 12 10 LU_5_5_[0-7] 600 RG05 12 10
LU_0_6_[0-7] 600 RG06 12 10 LU_5_6_[0-7] 600 RG06 12 10
LU_0_7_[0-7] 600 RG07 12 10 LU_5_7_[0-7] 600 RG07 12 10
LU_0_10_[0-9a-f] * 680 RG10 5 5 LU_5_10_[0-9a-f] * 680 RG10 5 5
LU_0_11_[0-9a-f] * 680 RG11 5 5 LU_5_11_[0-9a-f] * 680 RG11 5 5
LU_0_12_[0-9a-f] * 680 RG12 5 5 LU_5_12_[0-9a-f] * 680 RG12 5 5
LU_0_13_[0-9a-f] * 680 RG13 5 5 LU_5_13_[0-9a-f] * 680 RG13 5 5
LU_1_0_[0-7] 600 RG00 12 10 LU_6_0_[0-7] 600 RG00 12 10
LU_1_1_[0-7] 600 RG01 12 10 LU_6_1_[0-7] 600 RG01 12 10
LU_1_2_[0-7] 600 RG02 12 10 LU_6_2_[0-7] 600 RG02 12 10
LU_1_3_[0-7] 600 RG03 12 10 LU_6_3_[0-7] 600 RG03 12 10
LU_1_4_[0-7] 600 RG04 12 10 LU_6_4_[0-7] 600 RG04 12 10
LU_1_5_[0-7] 600 RG05 12 10 LU_6_5_[0-7] 600 RG05 12 10
LU_1_6_[0-7] 600 RG06 12 10 LU_6_6_[0-7] 600 RG06 12 10
LU_1_7_[0-7] 600 RG07 12 10 LU_6_7_[0-7] 600 RG07 12 10
LU_1_10_[0-9a-f] * 680 RG10 5 5 LU_6_10_[0-9a-f] * 680 RG10 5 5
LU_1_11_[0-9a-f] * 680 RG11 5 5 LU_6_11_[0-9a-f] * 680 RG11 5 5
LU_1_12_[0-9a-f] * 680 RG12 5 5 LU_6_12_[0-9a-f] * 680 RG12 5 5
LU_1_13_[0-9a-f] * 680 RG13 5 5 LU_6_13_[0-9a-f] * 680 RG13 5 5
LU_2_0_[0-7] 600 RG00 12 10 LU_7_0_[0-7] 600 RG00 12 10
LU_2_1_[0-7] 600 RG01 12 10 LU_7_1_[0-7] 600 RG01 12 10
LU_2_2_[0-7] 600 RG02 12 10 LU_7_2_[0-7] 600 RG02 12 10
LU_2_3_[0-7] 600 RG03 12 10 LU_7_3_[0-7] 600 RG03 12 10
LU_2_4_[0-7] 600 RG04 12 10 LU_7_4_[0-7] 600 RG04 12 10
LU_2_5_[0-7] 600 RG05 12 10 LU_7_5_[0-7] 600 RG05 12 10
LU_2_6_[0-7] 600 RG06 12 10 LU_7_6_[0-7] 600 RG06 12 10
LU_2_7_[0-7] 600 RG07 12 10 LU_7_7_[0-7] 600 RG07 12 10
LU_2_10_[0-9a-f] * 680 RG10 5 5 LU_7_10_[0-9a-f] * 680 RG10 5 5
LU_2_11_[0-9a-f] * 680 RG11 5 5 LU_7_11_[0-9a-f] * 680 RG11 5 5
LU_2_12_[0-9a-f] * 680 RG12 5 5 LU_7_12_[0-9a-f] * 680 RG12 5 5
LU_2_13_[0-9a-f] * 680 RG13 5 5 LU_7_13_[0-9a-f] * 680 RG13 5 5
LU_3_0_[0-7] 600 RG00 12 10 LU_8_0_[0-7] 600 RG00 12 10
LU_3_1_[0-7] 600 RG01 12 10 LU_8_1_[0-7] 600 RG01 12 10
LU_3_2_[0-7] 600 RG02 12 10 LU_8_2_[0-7] 600 RG02 12 10
LU_3_3_[0-7] 600 RG03 12 10 LU_8_3_[0-7] 600 RG03 12 10
LU_3_4_[0-7] 600 RG04 12 10 LU_8_4_[0-7] 600 RG04 12 10
LU_3_5_[0-7] 600 RG05 12 10 LU_8_5_[0-7] 600 RG05 12 10
LU_3_6_[0-7] 600 RG06 12 10 LU_8_6_[0-7] 600 RG06 12 10
LU_3_7_[0-7] 600 RG07 12 10 LU_8_7_[0-7] 600 RG07 12 10
LU_3_10_[0-9a-f] * 680 RG10 5 5 LU_8_10_[0-9a-f] * 680 RG10 5 5
LU_3_11_[0-9a-f] * 680 RG11 5 5 LU_8_11_[0-9a-f] * 680 RG11 5 5
LU_3_12_[0-9a-f] * 680 RG12 5 5 LU_8_12_[0-9a-f] * 680 RG12 5 5
LU_3_13_[0-9a-f] * 680 RG13 5 5 LU_8_13_[0-9a-f] * 680 RG13 5 5
LU_4_0_[0-7] 600 RG00 12 10 LU_9_0_[0-7] 600 RG00 12 10
LU_4_1_[0-7] 600 RG01 12 10 LU_9_1_[0-7] 600 RG01 12 10
LU_4_2_[0-7] 600 RG02 12 10 LU_9_2_[0-7] 600 RG02 12 10
LU_4_3_[0-7] 600 RG03 12 10 LU_9_3_[0-7] 600 RG03 12 10
LU_4_4_[0-7] 600 RG04 12 10 LU_9_4_[0-7] 600 RG04 12 10
LU_4_5_[0-7] 600 RG05 12 10 LU_9_5_[0-7] 600 RG05 12 10
LU_4_6_[0-7] 600 RG06 12 10 LU_9_6_[0-7] 600 RG06 12 10
LU_4_7_[0-7] 600 RG07 12 10 LU_9_7_[0-7] 600 RG07 12 10
LU_4_10_[0-9a-f] * 680 RG10 5 5 LU_9_10_[0-9a-f] * 680 RG10 5 5
LU_4_11_[0-9a-f] * 680 RG11 5 5 LU_9_11_[0-9a-f] * 680 RG11 5 5
LU_4_12_[0-9a-f] * 680 RG12 5 5 LU_9_12_[0-9a-f] * 680 RG12 5 5
LU_4_13_[0-9a-f] * 680 RG13 5 5 LU_9_13_[0-9a-f] * 680 RG13 5 5
* LUs were mounted during database load only.
Storage#0 :
HUS150
Storage#1 :
HUS150
Storage#2 :
HUS150
Storage#3 :
HUS150
Storage#4 :
HUS150
Storage#5 :
HUS150
Storage#6 :
HUS150
Storage#7 :
HUS150
Storage#8 :
HUS150
Storage#9 :
HUS150
Page 24
Page 14
TPC-Benchmark H Full Disclosure Report
© Hitachi, Ltd. 2013. All rights reserved.
Table 4.3: Allocation of LUs from Raid Groups (2/2)
LUSize
(in GB)Storage
Raid
Group
# of
DisksRAID LU
Size
(in GB)Storage
Raid
Group
# of
DisksRAID
LU_a_0_[0-7] 600 RG00 12 10 LU_f_0_[0-7] 600 RG00 12 10
LU_a_1_[0-7] 600 RG01 12 10 LU_f_1_[0-7] 600 RG01 12 10
LU_a_2_[0-7] 600 RG02 12 10 LU_f_2_[0-7] 600 RG02 12 10
LU_a_3_[0-7] 600 RG03 12 10 LU_f_3_[0-7] 600 RG03 12 10
LU_a_4_[0-7] 600 RG04 12 10 LU_f_4_[0-7] 600 RG04 12 10
LU_a_5_[0-7] 600 RG05 12 10 LU_f_5_[0-7] 600 RG05 12 10
LU_a_6_[0-7] 600 RG06 12 10 LU_f_6_[0-7] 600 RG06 12 10
LU_a_7_[0-7] 600 RG07 12 10 LU_f_7_[0-7] 600 RG07 12 10
LU_a_10_[0-9a-f] * 680 RG10 5 5 LU_f_10_[0-9a-f] * 680 RG10 5 5
LU_a_11_[0-9a-f] * 680 RG11 5 5 LU_f_11_[0-9a-f] * 680 RG11 5 5
LU_a_12_[0-9a-f] * 680 RG12 5 5 LU_f_12_[0-9a-f] * 680 RG12 5 5
LU_a_13_[0-9a-f] * 680 RG13 5 5 LU_f_13_[0-9a-f] * 680 RG13 5 5
LU_b_0_[0-7] 600 RG00 12 10 LU_10_0_0 50
LU_b_1_[0-7] 600 RG01 12 10 LU_10_0_1 2,048
LU_b_2_[0-7] 600 RG02 12 10 LU_11_0_0 50
LU_b_3_[0-7] 600 RG03 12 10 LU_11_0_1 2,048
LU_b_4_[0-7] 600 RG04 12 10 LU_12_0_0 50
LU_b_5_[0-7] 600 RG05 12 10 LU_12_0_1 2,048
LU_b_6_[0-7] 600 RG06 12 10 LU_13_0_0 50
LU_b_7_[0-7] 600 RG07 12 10 LU_13_0_1 2,048
LU_b_10_[0-9a-f] * 680 RG10 5 5
LU_b_11_[0-9a-f] * 680 RG11 5 5
LU_b_12_[0-9a-f] * 680 RG12 5 5
LU_b_13_[0-9a-f] * 680 RG13 5 5
LU_c_0_[0-7] 600 RG00 12 10
LU_c_1_[0-7] 600 RG01 12 10
LU_c_2_[0-7] 600 RG02 12 10
LU_c_3_[0-7] 600 RG03 12 10
LU_c_4_[0-7] 600 RG04 12 10
LU_c_5_[0-7] 600 RG05 12 10
LU_c_6_[0-7] 600 RG06 12 10
LU_c_7_[0-7] 600 RG07 12 10
LU_c_10_[0-9a-f] * 680 RG10 5 5
LU_c_11_[0-9a-f] * 680 RG11 5 5
LU_c_12_[0-9a-f] * 680 RG12 5 5
LU_c_13_[0-9a-f] * 680 RG13 5 5
LU_d_0_[0-7] 600 RG00 12 10
LU_d_1_[0-7] 600 RG01 12 10
LU_d_2_[0-7] 600 RG02 12 10
LU_d_3_[0-7] 600 RG03 12 10
LU_d_4_[0-7] 600 RG04 12 10
LU_d_5_[0-7] 600 RG05 12 10
LU_d_6_[0-7] 600 RG06 12 10
LU_d_7_[0-7] 600 RG07 12 10
LU_d_10_[0-9a-f] * 680 RG10 5 5
LU_d_11_[0-9a-f] * 680 RG11 5 5
LU_d_12_[0-9a-f] * 680 RG12 5 5
LU_d_13_[0-9a-f] * 680 RG13 5 5
LU_e_0_[0-7] 600 RG00 12 10
LU_e_1_[0-7] 600 RG01 12 10
LU_e_2_[0-7] 600 RG02 12 10
LU_e_3_[0-7] 600 RG03 12 10
LU_e_4_[0-7] 600 RG04 12 10
LU_e_5_[0-7] 600 RG05 12 10
LU_e_6_[0-7] 600 RG06 12 10
LU_e_7_[0-7] 600 RG07 12 10
LU_e_10_[0-9a-f] * 680 RG10 5 5
LU_e_11_[0-9a-f] * 680 RG11 5 5
LU_e_12_[0-9a-f] * 680 RG12 5 5
LU_e_13_[0-9a-f] * 680 RG13 5 5
14 5
Storage#f :
HUS150
Storage#10 :
BR1600E
* LUs were mounted during database load only.
14 5
Storage#11 :
BR1600ERG00 14 5
RG00
Storage#12 :
BR1600ERG00 14 5
Storage#13 :
BR1600ERG00
Storage#a :
HUS150
Storage#b :
HUS150
Storage#c :
HUS150
Storage#d :
HUS150
Storage#e :
HUS150
Page 25
Page 15
TPC-Benchmark H Full Disclosure Report
© Hitachi, Ltd. 2013. All rights reserved.
Table 4.4: Allocation of LVMs from LUs
LVSize
(in GB)VG LU LV
Size
(in GB)VG LU
lvm_vgh00_index_L_O_[0-7][0-9] 200
lvm_vgh00_index_L_P_[0-7][0-9] 95
lvm_vgh00_index_O_O_[0-7][0-9] 120 lvm_vgh05_work 39,997
lvm_vgh00_index_ps_[0-7][0-9] 38
lvm_vgh00_index_P_[0-7][0-9] 9
lvm_vgh00_index_C_[0-7][0-9] 7 lvm_vgh05_L_table_7[5-9] 2,396
lvm_vgh00_index_S_[0-7][0-9] 1 lvm_vgh06_work 39,997
lvm_vgh00_index_NR 0.5 lvm_vgh06_adbsys 500
lvm_vgh00_100K_RangeIndex 20 lvm_vgh06_adbsys2 500
lvm_vgh06_adbsys3 500
lvm_vgh06_adbsys4 500
lvm_vgh07_verification[0-7][0-9] 1.5
lvm_vgh01_O_table_0[0-8] 500
lvm_vgh02_P_table_[0-7][0-9] 50
lvm_vgh03_O_table_7[7-9] 500
lvm_vgh03_PS_table[0-7][0-9] 213
lvm_vgh03_C_table[0-7][0-9] 44
lvm_vgh03_S_table[0-7][0-9] 4
lvm_vgh03_NR_table 0.5
lvm_vgh03_100K_ADBDIC 10
lvm_vgh03_100K_ADBMST 10
lvm_vgh03_work 39,997
lvm_vgh04_L_table_6[3-8] 2,396
lvm_vgh04_work 39,997
LU_[0-9a-f]_1[0-3]_6
LU_[0-9a-f]_1[0-3]_4
LU_[0-9a-f]_1[0-3]_2
3,604 VGN03 LU_[0-9a-f]_1[0-3]_3
LU_[0-9a-f]_1[0-3]_5lvm_vgn05_dbgen_5[8-9] *
lvm_vgn05_dbgen_6[0-8] *
lvm_vgn06_dbgen_69 *
lvm_vgn06_dbgen_7[0-9] *
3,604
3,604
VGN00
3,604 VGN04
VGN05
3,604
lvm_vgn02_dbgen_2[4-9] *
lvm_vgn02_dbgen_3[0-5] *
lvm_vgn03_dbgen_3[6-9] *
lvm_vgn03_dbgen_4[0-6] *
lvm_vgn04_dbgen_4[7-9] *
lvm_vgn04_dbgen_5[0-7] *
VGN02
3,604 VGN06
LU_[0-9a-f]_1[0-3]_0
lvm_vgn01_dbgen_1[2-9] *
lvm_vgn01_dbgen_2[0-3] *3,604 VGN01 LU_[0-9a-f]_1[0-3]_1
lvm_vgh04_importi_0[0-9] *
lvm_vgh04_importi_1[0-1] *1,700
lvm_vgh05_L_table_69
lvm_vgh05_L_table_7[0-4]2,396
lvm_vgh05_importi_0[0-9] *
lvm_vgh05_importi_1[0-1] *1,700
lvm_vgh02_O_table_09
lvm_vgh02_O_table_[1-6][0-9]
lvm_vgh02_O_table_7[0-6]
500VGH02 LU_[0-9a-f]_[0-7]_2
VGH03 LU_[0-9a-f]_[0-7]_3
lvm_vgh03_L_table_5[8-9]
lvm_vgh03_L_table_6[0-2]2,396
lvm_vgh01_L_table_1[4-9]
lvm_vgh01_L_table_[2-3][0-9]
lvm_vgh01_L_table_4[0-2]
2,396
2,396
VGH01 LU_[0-9a-f]_[0-7]_1
lvm_vgh02_L_table_4[3-9]
lvm_vgh02_L_table_5[0-7]2,396
lvm_vgh00_L_table_0[0-9]
lvm_vgh00_L_table_1[0-3]
VGH04 LU_[0-9a-f]_[0-7]_4
VGH05 LU_[0-9a-f]_[0-7]_5
VGH00 LU_[0-9a-f]_[0-7]_0
LU_[0-9a-f]_[0-7]_6
VGH07 LU_[0-9a-f]_[0-7]_7
* LVs were mounted during database load only.
VGH06
lvm_vgh06_importi_0[0-9] *
lvm_vgh06_importi_1[0-1] *1,700
lvm_vgh07_importi_[0-3][0-9] *
lvm_vgh07_importi_4[0-3] *1,700
lvm_vgn00_dbgen_0[0-9] *
lvm_vgn00_dbgen_1[0-1] *
Page 26
Page 16
TPC-Benchmark H Full Disclosure Report
© Hitachi, Ltd. 2013. All rights reserved.
Table 4.5: Assignment of LVs to TPC-H Tables and Log Files
LV/LU
LU_10_0_[01] (for BS2000 #1)
LU_11_0_[01] (for BS2000 #2)
LU_12_0_[01] (for BS2000 #3)
LU_13_0_[01] (for BS2000 #4)
MASTER DIRECTORY lvm_vgh03_100K_ADBMST
DICTIONARY lvm_vgh03_100K_ADBDIC
SYSTEM LOG FILE
lvm_vgh06_adbsys (for BS2000 #1)
lvm_vgh06_adbsys2 (for BS2000 #2)
lvm_vgh06_adbsys3 (for BS2000 #3)
lvm_vgh06_adbsys4 (for BS2000 #3)
WORK
lvm_vgh03_work (for BS2000 #1)
lvm_vgh04_work (for BS2000 #2)
lvm_vgh05_work (for BS2000 #3)
lvm_vgh06_work (for BS2000 #4)
LINEITEM TABLE
lvm_vgh00_L_table_0[0-9] lvm_vgh00_L_table_1[0-3]
lvm_vgh01_L_table_1[4-9] lvm_vgh01_L_table_[2-3][0-9]
lvm_vgh01_L_table_4[0-2] lvm_vgh02_L_table_4[3-9]
lvm_vgh02_L_table_5[0-7] lvm_vgh03_L_table_5[8-9]
lvm_vgh03_L_table_6[0-2] lvm_vgh04_L_table_6[3-8]
lvm_vgh05_L_table_69 lvm_vgh05_L_table_7[0-4]
lvm_vgh05_L_table_7[5-9]
ORDERS TABLE
lvm_vgh01_O_table_0[0-8] lvm_vgh02_O_table_09
lvm_vgh02_O_table_[1-6][0-9] lvm_vgh02_O_table_7[0-6]
lvm_vgh03_O_table_7[7-9]
CUSTOMER TABLE lvm_vgh03_C_table[0-7][0-9]
PART TABLE lvm_vgh02_P_table_[0-7][0-9]
SUPPLIER TABLE lvm_vgh03_S_table[0-7][0-9]
PARTSUPP TABLE lvm_vgh03_PS_table[0-7][0-9]
NATION TABLE
RETION TABLE
LINEITEM INDEXlvm_vgh00_index_L_O_[0-7][0-9]
lvm_vgh00_index_L_P_[0-7][0-9]
ORDERS INDEX lvm_vgh00_index_O_O_[0-7][0-9]
CUSTOMER INDEX lvm_vgh00_index_C_[0-7][0-9]
PART INDEX lvm_vgh00_index_P_[0-7][0-9]
SUPPLIER INDEX lvm_vgh00_index_S_[0-7][0-9]
PARTSUPP INDEX lvm_vgh00_index_ps_[0-7][0-9]
NATION INDEX
RETION INDEX
RANGE INDEX lvm_vgh00_100K_RangeIndex
TABLES for Verification lvm_vgh07_verification[0-7][0-9]
lvm_vgn00_dbgen_0[0-9] lvm_vgn00_dbgen_1[0-1]
lvm_vgn01_dbgen_1[2-9] lvm_vgn01_dbgen_2[0-3]
lvm_vgn02_dbgen_2[4-9] lvm_vgn02_dbgen_3[0-5]
lvm_vgn03_dbgen_3[6-9] lvm_vgn03_dbgen_4[0-6]
lvm_vgn04_dbgen_4[7-9] lvm_vgn04_dbgen_5[0-7]
lvm_vgn05_dbgen_5[8-9] lvm_vgn05_dbgen_6[0-8]
lvm_vgn06_dbgen_69 lvm_vgn06_dbgen_7[0-9]
lvm_vgh04_importi_0[0-9] lvm_vgh04_importi_1[0-1]
lvm_vgh05_importi_0[0-9] lvm_vgh05_importi_1[0-1]
lvm_vgh06_importi_0[0-9] lvm_vgh06_importi_1[0-1]
lvm_vgh07_importi_[0-3][0-9] lvm_vgh07_importi_4[0-3]
Load Work
(areas to put tempolary files in the
loading phase only)
Note: Flat Files and Load Work were mounted during database load.
Contents
OS and DBMS Software
DB
lvm_vgh03_NR_table
lvm_vgh00_index_NR
Flat Files
(input files for database load)
Page 27
Page 17
TPC-Benchmark H Full Disclosure Report
© Hitachi, Ltd. 2013. All rights reserved.
4.3. Mapping of Database Partitions/Replications
The mapping of database partitions/replications must be explicitly described.
Neither database partitions nor replications are used.
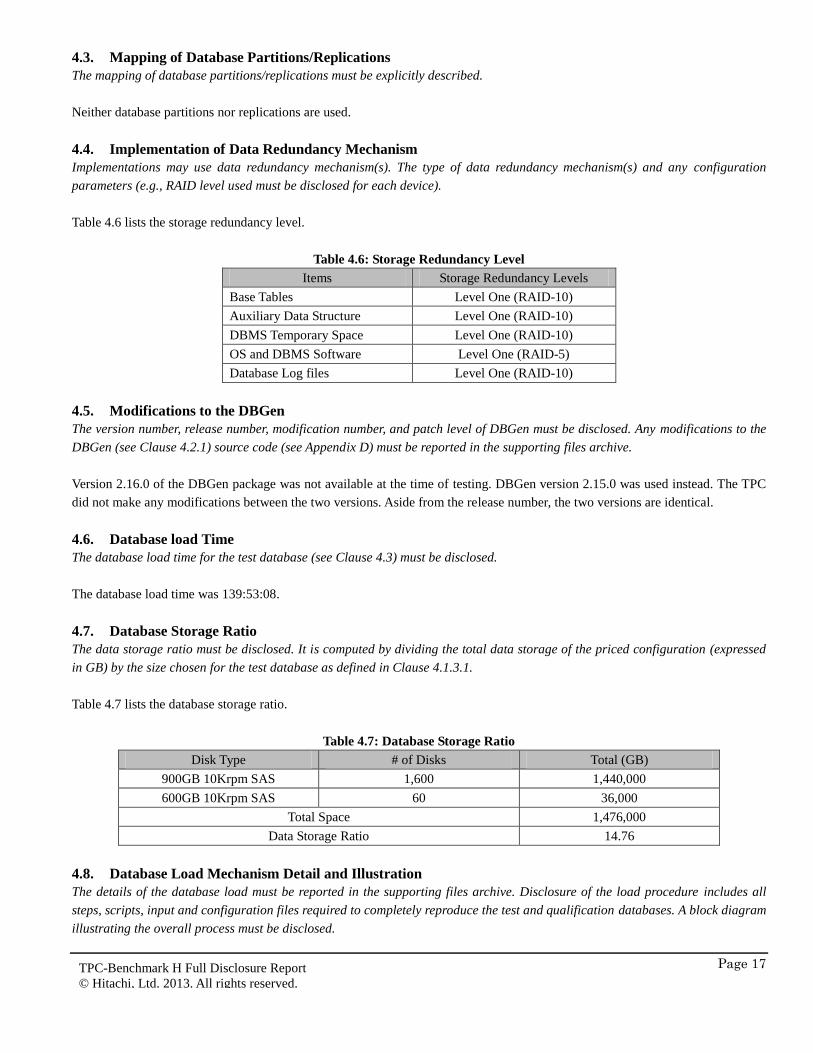
4.4. Implementation of Data Redundancy Mechanism
Implementations may use data redundancy mechanism(s). The type of data redundancy mechanism(s) and any configuration
parameters (e.g., RAID level used must be disclosed for each device).
Table 4.6 lists the storage redundancy level.
Table 4.6: Storage Redundancy Level
Items Storage Redundancy Levels
Base Tables Level One (RAID-10)
Auxiliary Data Structure Level One (RAID-10)
DBMS Temporary Space Level One (RAID-10)
OS and DBMS Software Level One (RAID-5)
Database Log files Level One (RAID-10)
4.5. Modifications to the DBGen
The version number, release number, modification number, and patch level of DBGen must be disclosed. Any modifications to the
DBGen (see Clause 4.2.1) source code (see Appendix D) must be reported in the supporting files archive.
Version 2.16.0 of the DBGen package was not available at the time of testing. DBGen version 2.15.0 was used instead. The TPC
did not make any modifications between the two versions. Aside from the release number, the two versions are identical.
4.6. Database load Time
The database load time for the test database (see Clause 4.3) must be disclosed.
The database load time was 139:53:08.
4.7. Database Storage Ratio
The data storage ratio must be disclosed. It is computed by dividing the total data storage of the priced configuration (expressed
in GB) by the size chosen for the test database as defined in Clause 4.1.3.1.
Table 4.7 lists the database storage ratio.
Table 4.7: Database Storage Ratio
Disk Type # of Disks Total (GB)
900GB 10Krpm SAS 1,600 1,440,000
600GB 10Krpm SAS 60 36,000
Total Space 1,476,000
Data Storage Ratio 14.76
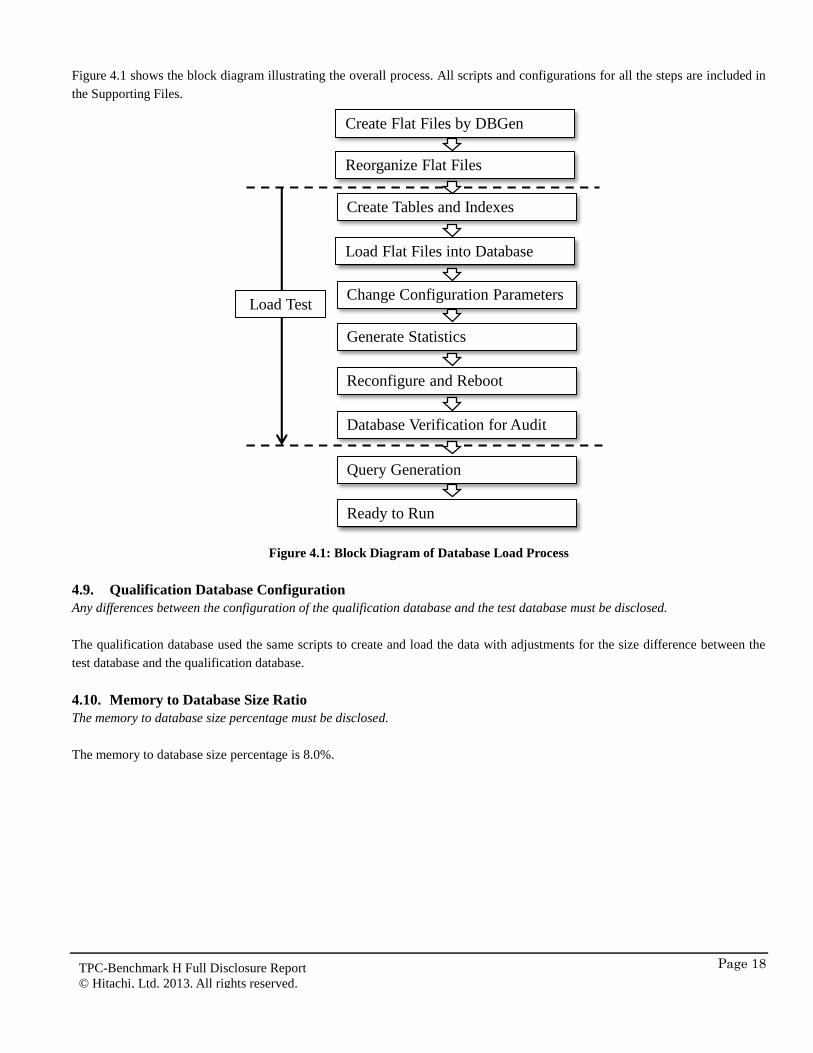
4.8. Database Load Mechanism Detail and Illustration
The details of the database load must be reported in the supporting files archive. Disclosure of the load procedure includes all
steps, scripts, input and configuration files required to completely reproduce the test and qualification databases. A block diagram
illustrating the overall process must be disclosed.
Page 28
Page 18
TPC-Benchmark H Full Disclosure Report
© Hitachi, Ltd. 2013. All rights reserved.
Figure 4.1 shows the block diagram illustrating the overall process. All scripts and configurations for all the steps are included in
the Supporting Files.
Create Flat Files by DBGen
Reorganize Flat Files
Create Tables and Indexes
Load Flat Files into Database
Database Verification for Audit
Query Generation
Generate Statistics
Reconfigure and Reboot
Change Configuration Parameters
Ready to Run
Load Test
Figure 4.1: Block Diagram of Database Load Process
4.9. Qualification Database Configuration
Any differences between the configuration of the qualification database and the test database must be disclosed.
The qualification database used the same scripts to create and load the data with adjustments for the size difference between the
test database and the qualification database.
4.10. Memory to Database Size Ratio
The memory to database size percentage must be disclosed.
The memory to database size percentage is 8.0%.
Page 29
Page 19
TPC-Benchmark H Full Disclosure Report
© Hitachi, Ltd. 2013. All rights reserved.
5. Clause 5 – Performance Metrics and Execution Rules Related Items
5.1. System Activity between Load and Performance Test
Any system activity on the SUT that takes place between the conclusion of the load test and the beginning of the performance test
must be fully reported in the supporting files archive including listings of scripts, command logs and system activity.
TPC-H queries created during the Load Test were copied from master-node server to the client because the benchmark driver of
the Performance Test was executed on the client and that of the Load Test was executed on the master-node server.
5.2. Steps in the Power Test
The details of the steps followed to implement the power test (e.g., system boot, database restart, etc.) must be reported in the
supporting files archive.
The following steps were used to implement power test:
1. Execution of the refresh function RF1 from the refresh stream
2. Execution of the full query set from the query stream
3. Execution of the refresh function RF2 from the refresh stream
5.3. Timing Intervals for Each Query and Refresh Functions
The timing intervals (see Clause 5.3.7) for each query and for both refresh functions must be reported for the power test. The
output for each query and for both refresh functions must be reported in the supporting files archive.
The timing intervals for each query and for both refresh functions are contained in the Numerical Quantities Summary of the
Executive Summary, which is located at the beginning of this document.
5.4. Number of Streams for Throughput Test
The number of query streams used for the throughput test must be disclosed.
Eleven query streams were used for the throughput test.
5.5. Start and End Date/Times for Each Query Stream
The start time and finish time for each query stream for the throughput test must be disclosed. The output for each query stream
for the throughput test must be reported in the supporting files archive.
The start time and finish time for each query stream for the throughput test are contained in the Numerical Quantities Summary of
Executive Summary, which is located at the beginning of this document.
5.6. Total Elapsed Time of the Measurement Interval
The total elapsed time of the measurement interval (see Clause 5.3.6) must be disclosed for the throughput test.
The total elapsed time of the measurement interval for the throughput test is contained in the Numerical Quantities Summary of
Executive Summary, which is located at the beginning of this document.
5.7. Refresh Function Start Data/Time and Finish Date/Time
The start time and, finish time for each refresh function in the refresh stream for the throughput test must be disclosed. The output
of each refresh function in the refresh stream for the throughput test must be reported in the supporting files archive.
The start time and finish time for each refresh function in the refresh stream are contained in the Numerical Quantities Summary
of the Executive Summary, which is located at the beginning of this document.
Page 30
Page 20
TPC-Benchmark H Full Disclosure Report
© Hitachi, Ltd. 2013. All rights reserved.
5.8. Performance Metrics
The computed performance metric, related numerical quantities and the price/performance metric must be disclosed.
The performance metric, related numerical quantities and the price/performance are contained in the Numerical Quantities
Summary of the Executive Summary, which is located at the beginning of this document.
5.9. The Performance Metric and Numerical Quantities from Both Runs
The performance metric (QphH@Size) and the numerical quantities (TPC-H Power@Size and TPC-H Throughput@ Size) from
both of the runs must be disclosed (see Clause 5.4).
Table 5.1 lists the performance metric and the numerical quantities from both of the runs.
Table 5.1: Performance Metric and Numerical Quantities
Run ID TPC-H Power@100000GB TPC-H Throughput@100000GB QphH@100000GB
Run 1 68,301.4 106,916.4 85,454.9
Run 2 64,244.1 106,401.3 82,678.0
5.10. System Activity Between Performance Test
Any activity on the SUT that takes place between the conclusion of Run1 and the beginning of Run2 must be fully disclosed
including system activity, listings of scripts or command logs along with any system reboots or database restarts.
After a successful execution of Run1, system and memory failures occurred during the execution of Run2. The first attempts at
Run2 were aborted and Run2 was restarted until it completed successfully. The following activity took place between the end of
Run1 and the beginning of the successful Run2:
- The execution of RF1/RF2 pairs from failed Run2 were checked to make sure that complete pairs had been fully executed.
- Failed memory boards were replaced.
- The system was rebooted and the database was restarted.
The logs for the RF1/RF2 pairs from the failed Run2 are included in the Supporting Files archive.
5.11. Documentation to satisfy Clause 5.2.7
All documentation necessary to satisfy Clause 5.2.7 must be made available upon request.
The Supporting Files archive contains the documentation.
5.12. Query Output Validation
The output of the Query Output Validation Test must be reported in the supporting files archive.
The Supporting Files archive contains the documentation.
Page 31
Page 21
TPC-Benchmark H Full Disclosure Report
© Hitachi, Ltd. 2013. All rights reserved.
6. Clause 6 – SUT and Driver Implementation Related Items
6.1. Driver
A detailed textual description of how the driver performs its functions, how its various components interact and any product
functionalities or environmental settings on which it relies and all related source code, scripts and configuration files must be
reported in the supporting files archive. The information provided should be sufficient for an independent reconstruction of the
driver.
QGen is used for creating executable queries for all query streams. All queries are created in Load Test. Each query text is
executed by the C program called Exec_sql (source code: Exec_sql.c) using the APIs which Hitachi Advanced Data Binder offers.
The Exec_sql issues TPC-H query text to Hitachi Advanced Data Binder and receives output data from Hitachi Advanced Data
Binder.
The Refresh Function 1 (RF1) is implemented as the C programs called RF_INSER_bulk (source code: RF_INSERT_bulk.c) and
the Refresh Function 2 (RF2) is implemented as the C programs called RF_DELETE_bulk (source code: RF_DELETE_bulk.c).
These programs use the APIs of Hitachi Advanced Data Binder.
The Power Test and The Throughput are executed from a shell script, Run_Performance.sh. The Power test operation is
performed as the following steps:
1. Run_PerformceTest.sh runs another script, Run_PWT_RF.sh.
2. Run_PWT_RF.sh executes the Refresh Function 1 (RF1) program RF_INSERT_bulk.
3. When RF1 completes, Run_PerformceTest.sh runs the query execution program (Exec_sql.c), which runs 22 queries of
stream 0.
4. When stream 0 completes, Run_PWT_RF.sh executes RF2 program, RF_DELETE_bulk
The Throughput Test is performed as the following steps:
1. When RF2 completes, Run_PerformceTest.sh executes Run_TPT_RF.sh.
2. Run_PerformceTest.sh runs 11 query streams concurrently.
3. When all the streams completes, Run_TPT_RF.sh run RF stream. The combination of RF1 and Rf2 is repeated 11 times.
The Supporting Files Archive contains all the scripts and the source codes.
6.2. Implementation Specific Layer
If an implementation specific layer is used, then a detailed description of how it performs its functions, how its various
components interact and any product functionalities or environmental setting on which it relies must be disclosed. All related
source code, scripts and configuration files must be reported in the supporting files archive. The information provided should be
sufficient for an independent reconstruction of the implementation specific layer.
The queries are submitted by the driver using Hitachi Advanced Data Binder standard APIs.
6.3. Profile-Directed Optimization
If profile-directed optimization as described in Clause 5.2.9 is used, such use must be disclosed. In particular, the procedure and
any scripts used to perform the optimization must be reported in the supporting files archive.
Profile-directed optimization was not used.
Page 32
Page 22
TPC-Benchmark H Full Disclosure Report
© Hitachi, Ltd. 2013. All rights reserved.
7. Clause 7 – Pricing
7.1. Hardware and Software Used
A detailed list of hardware and software used in the Priced Configuration must be reported. The listing for each separately
Orderable item must have vendor Part Number, description and applicable release/revision level, price source, unit price,
quantity, extended price, applicable Discounted price and 3-year maintenance price. If package-pricing is used, the vendor Part
Number of the package and a description uniquely identifying each of the Components of the package must be disclosed to a
sufficient level of detail to meet the requirements of 1.4.1.1.
The Executive Summary contains a list of hardware and software, including maintenance for 3-years.
7.2. Three-Year Price
The total 3-year price of the entire Priced Configuration must be reported, including: hardware, software, and maintenance
charges. The justification of any Discounts applied must be disclosed in the price sheet. Sufficient detail of what items are being
discounted and by how much they are being discounted must be provided so that the Discount amount used in the computation of
the total system cost can be independently reproduced.
The Executive Summary contains all details of the total 3-year price.
7.3. Availability Date
The committed Availability Date of Components used in the price calculations must be reported. The Availability Date must be
reported on the first page of the Executive Summary and with a precision of one day. When the priced system includes products
with different availability dates, the reported Availability Date for the priced system must be a date at which all Components are
committed to be Generally Available. Each Component used in the Priced Configuration is considered to be Available on the
Availability Date unless an earlier date is specified.
Availability Dates:
Server Hardware Now (date of publication)
Server Software Now (date of publication)
Storage Now (date of publication)
Database Manager (Hitachi Advanced Data Binder 01-02) Now (date of publication)
7.4. Benchmark Performance Metric
A statement of the benchmark performance metric, as well as the respective calculations for 3-year pricing, price/performance,
and the availability date must be included.
Table 7.1 lists the benchmark performance metric, price/performance metric, total 3-year cost, and availability date.
Table 7.1: Benchmark Performance Metric and Pricing
Performance Metric Price/Performance
Metric
Total 3-year Cost Availability Date
82,678.0
QphH@100000GB
¥ 18,911.98 JPY /
QphH@100000GB ¥1,563,605,024 JPY Oct 19, 2013
Page 33
Page 23
TPC-Benchmark H Full Disclosure Report
© Hitachi, Ltd. 2013. All rights reserved.
8. Clause 8 – Supporting Files Index Table
An index for all files and/or directories included in the Supporting Files Archive as required by Clauses 8.3.2 through 8.3.8 must
be provided in the report.
Clause Description Archive File Pathname
Clause 1 OS and EFI Settings
SupportingFiles.zip
Clause1/OSandEFISettings
Scripts of setting OS Configuration Clause1/SetOSConfig
DB Creation Scripts Clause1/DBCreationScripts
System Verification Clause1/CONFIG_HW
Clause1/CONFIG_SW
Hitachi Advanced Data Binder Configuration Clause1/HADBConfig
Toolkit Environment Variables Clause1/ToolkitEnv
Toolkit Common Scripts Clause1/CommonScripts
Clause 2 Queries, Query Parameters, and Seeds SupportingFiles.zip
Clause2/RUN/ST_QUERY
Refresh Functions Clause2/RefreshFunction
Clause 3 ACID Test Scripts
SupportingFiles.zip
Clause3/ACIDtest
ACID Test Results
Clause3/ATOM
Clause3/CONS
Clause3/ISO
Clause3/DUR
Clause 4 Source codes and Scripts of Flat Files Sort and
Merge
SupportingFiles.zip
Clause4/Generate
DBGen Configuration for Porting to Hitachi
Advanced Data Binder Clause4/ModifiedSourceCode
DB Load Scripts Clause4/DataLoad
DB Load Results Clause4/DB_LOAD
Qualification Test Results
Clause4/BEFORE_AFTER_LOAD
Clause4/LOAD_QUAL_DB
Clause4/VRF_OUT_DIR
Clause4/VA_OUTPUT
Clause4/VERIFICATION
Database Verification Scripts Clause4/Verification
Database Verification Results Clause4/DB_VRF
Clause4/REF_VRF
Clause 5 Query Output Results
Run1Results_[1-12].zip
Run2Results_[1-12].zip Clause5/RUN
Refresh Functions Outputs of Failed Run SupportingFiles.zip
Clause5/FailedRun
Truncate tool of Query Output Results Clause5/Report
Clause 6 Source Codes and Scripts of Driver SupportingFiles.zip Clause6/PerformanceTest
Clause 7 There are no files required to be included for
Clause 7. N/A N/A
Clause 8 There are no files required to be included for
Clause 8. N/A N/A
Page 34
Page 24
TPC-Benchmark H Full Disclosure Report
© Hitachi, Ltd. 2013. All rights reserved.
9. Clause 9 – Audit Related Items
The auditor's agency name, address, phone number, and attestation letter with a brief audit summary report indicating
compliance must be included in the full disclosure report. A statement should be included specifying whom to contact in order to
obtain further information regarding the audit process.
The auditor’s attestation letter is included in the following section.
Page 35
Page 25
Benchmark Sponsor: Shinji Fujiwara
Chief Engineer
Hitachi, Ltd.
292 Yoshida-cho, Totsuka-ku,
Yokohama, 244-0817, Japan
October 15, 2013
I verified the TPC Benchmark H (TPC-HTM
v2.16.0) performance of the following configuration:
Platform: Hitachi BladeSymphony BS2000 using Hitachi Advanced Data Binder
Operating System: Red Hat® Enterprise Linux® 6.2
Database Manager: Hitachi Advanced Data Binder 01-02
Other Software: n/a
The results were:
Performance
Metric
82,678.0 QphH@100,000GB
TPC-H Power 64,244.1 TPC-H Throughput 106,401.3 Database Load Time 139:53:08
Server 4 x Hitachi BladeSymphony BS2000 CPUs 4 x 8 Intel Xeon Processor E7-8870 (2.13 GHz, 24MB Cache)
Memory 4 x 2 TB
Disks Qty Size Type
1600 900 GB SAS 10K rpm HDD
60 600 GB SAS 10K rpm HDD
In my opinion, these performance results were produced in compliance with the TPC requirements
for the benchmark.
The following verification items were given special attention:
• The database records were defined with the proper layout and size
• The database population was generated using DBGen
• The database was properly scaled to 100,000GB and populated accordingly
• The compliance of the database auxiliary data structures was verified
• The database load time was correctly measured and reported
• The required ACID properties were verified and met
• The query input variables were generated by QGen
Page 36
Page 26
• The query text was produced using minor modifications and no query variant
• The execution of the queries against the SF1 database produced compliant answers
• A compliant implementation specific layer was used to drive the tests
• The throughput tests involved 11 query streams
• The ratio between the longest and the shortest query was such that no query timings were
adjusted
• The execution times for queries and refresh functions were correctly measured and
reported
• The repeatability of the measured results was verified
• The system pricing was verified for major components and maintenance
• The major pages from the FDR were verified for accuracy
Additional Audit Notes:
Version 2.16.0 of the DBGen package was not available at the time of testing. DBGen
version 2.15.0 was used instead. The TPC did not make any modifications between the two
versions. Aside from the release number, the two versions are identical. QGen 2.15.0 was
used with the modifications approved by the TPC for release 2.16.0. These approved
modifications were detailed in the FDR of the TPC-H result published by Oracle on June 7,
2013 for the SPARC T5-4 Server. In addition, the reference dataset for the query
substitution parameters could not be verified since the 2.16.0 dataset is not available.
Respectfully Yours,
François Raab, President