40
Höegh LNG Partners LP – The Floating LNG Infrastructure MLP Investor Presentation June 2017

Höegh LNG Partners LP – The Floating LNG Infrastructure MLP
Investor Presentation
June 2017

Forward-Looking Statements
2
This presentation contains certain forward-looking statements concerning future events and our operations, performance and financial condition. Forward-
looking statements include, without limitation, any statement that may predict, forecast, indicate or imply future results, performance or achievements, and
may contain the words “believe,” “anticipate,” “expect,” “estimate,” “project,” “will be,” “will continue,” “will likely result,” “plan,” “intend” or words or phrases
of similar meanings. These statements involve known and unknown risks and are based upon a number of assumptions and estimates that are inherently
subject to significant uncertainties and contingencies, many of which are beyond our control. Actual results may differ materially from those expressed or
implied by such forward-looking statements. Important factors that could cause actual results to differ materially include, but are not limited to: FSRU and
LNG carrier market trends, including hire rates and factors affecting supply and demand; our anticipated growth strategies; our anticipated receipt of
dividends and repayment of indebtedness from subsidiaries and joint ventures; the effects of volatility in global prices for crude oil and natural gas; the
effect of the worldwide economic environment; turmoil in the global financial markets; fluctuations in currencies and interest rates; general market
conditions, including fluctuations in hire rates and vessel values; changes in our operating expenses, including drydocking and insurance costs; our ability
to make or increase cash distributions on our units and the amount of any such distributions; our ability to comply with financing agreements and the
expected effect of restrictions and covenants in such agreements; the future financial condition of our existing or future customers; our ability to make
additional borrowings and to access public equity and debt capital markets; planned capital expenditures and availability of capital resources to fund capital
expenditures; the exercise of purchase options by customers; our ability to maintain long-term relationships with our customers; our ability to leverage the
relationships of Höegh LNG Holdings (“HLNG”) and its reputation in the shipping industry; our ability to purchase the 49% interest in the Höegh Grace
entities or additional vessels from Höegh LNG in the future; our ability to integrate and realize the anticipated benefits from the acquisition of the 51%
interest in the Höegh Grace entities; our continued ability to enter into long-term, fixed-rate charters; the operating performance of our vessels; our ability to
maximize the use of our vessels, including the redeployment or disposition of vessels no longer under long-term charters; expected pursuit of strategic
opportunities, including the acquisition of vessels; our ability to compete successfully for future chartering and newbuilding opportunities; timely acceptance
of our vessels by their charterers; termination dates and extensions of charters; the cost of, and our ability to comply with, governmental regulations and
maritime self-regulatory organization standards, as well as standard regulations imposed by our charterers applicable to our business; demand in the
FSRU sector or the LNG shipping sector in general and the demand for our vessels in particular; availability of skilled labor, vessel crews and
management; our incremental general and administrative expenses as a publicly traded limited partnership and our fees and expenses payable under the
ship management agreements, the technical information and services agreement and the administrative services agreements; the anticipated taxation of
Höegh LNG Partners LP and distributions to our unitholders; estimated future maintenance and replacement capital expenditures; our ability to retain key
employees; customers’ increasing emphasis on environmental and safety concerns; potential liability from any pending or future litigation; potential
disruption of shipping routes due to accidents, political events, piracy or acts by terrorists; future sales of our common units in the public market; our
business strategy and other plans and objectives for future operations; our ability to successfully remediate any material weaknesses in our internal control
over financial reporting and our disclosure controls and procedures; and other factors listed from time to time in the reports and other documents that we
file with the SEC, including our Annual Report on Form 20-F for the year ended December 31, 2016 and subsequent quarterly reports on Form 6-K. All
forward-looking statements included in this presentation are made only as of the date hereof. We do not intend to release publicly any updates or revisions
to any forward-looking statements contained herein to reflect any change in our expectations with respect thereto or any change in events, conditions or
circumstances on which any such statement is based.
3
Glossary
“HMLP” – Höegh LNG Partners LP
“HLNG” – Höegh LNG Holdings Ltd.
“Höegh LNG Group” – HMLP and HLNG
“Grace Holding” – The sole owner of the entities that own and operate the Höegh Grace
“FSRU” – Floating Storage and Regasification Unit
“ABKN” – AB Klaipedos Nafta
“EGAS” – Egyptian Natural Gas Holding Company
“PGN” – Perusahaan Gas Negara
“GNL Penco” – Import terminal in Chile (JV of Biobiogenera , Cheniere and EDF)
“SPEC” – Sociedad Portuaria El Cayao S.A. E.S.P. (JV of Promigas and private equity)
“GEI” – Global Energy Infrastructure Ltd.

4
Höegh LNG Partners LP – A Differentiated LNG Infrastructure Provider
(1) HMLP assets only; $6.2 billion of firm contract backlog across Höegh LNG Group; backlog is calculated as the full monthly hire rate multiplied by the
number of months remaining on the contract, assuming full utilization.
(2) Consists of approximately 10.7% of the total outstanding common units and 100% of the outstanding subordinated units. HLNG also holds all of the
incentive distribution rights.
A Growth-Oriented MLP Providing Critical Energy Infrastructure on Stable, Long-term Contracts
Operations world-wide:
The only pure play FSRU company
Most modern FSRU fleet in the market
12.2 years average remaining contract length
Firm contract backlog of $2.2 billion(1)
53.6%
Höegh LNG
Holdings Ltd.
(Oslo Børs: HLNG)
46.4%(2)
LNG Infrastructure
asset development
MLP Investors
Höegh LNG Group
Green – operational
Yellow – development

5
Höegh LNG Partners LP (NYSE:HMLP) – Investment Summary
• The only publicly listed FSRU pure play
• Current fleet of five FSRUs on long-term, fixed-rate contracts Pure Play Owner and Operator of FSRUs
• Average vessel age of 3.8 years(1)
• Meeting critical energy infrastructure needs
• Leading player in highly concentrated FSRU market
Modern Fleet Providing Critical Energy Infrastructure
• Average remaining contract term of 12.2 years plus options(2)
• Earliest contract expiry in 2025(3), with no near-term debt maturities
• No direct commodity exposure and limited Opex exposure(4)
Full Employment on Fixed, Long-term
Contracts
• Committed pipeline of high-quality dropdown assets
• Dropdowns typically evaluated once assets go on long-term contract
• Accretive acquisitions of FSRUs expected to drive distribution growth
Dropdown Pipeline for Built-in Distribution
Growth
• LNG is especially competitive fuel at current prices
• Readily available LNG supply drives FSRU adoption globally
• Oil and coal displacement with environmental benefits over both
Attractive FSRU Market Conditions
• Recognized leader in the LNG space for 40+ years
• Extensive technical and maritime expertise and relationships
• Favorable financing terms highlight value of sponsor support
Supportive, Industry-Leading
Sponsor
(1) As of March 31, 2017
(2) As of March 31, 2017 including the Höegh Grace, 19.2 years including options
(3) Includes HMLP option to charter FSRU Höegh Gallant to HLNG after end of EGAS contract
(4) Extent of Opex exposure depends on vessel contract

Floating Storage and
Regasification Units
(“FSRUs”)
7
FSRUs Provide a Critical Link in the Global LNG Supply Chain
Seaborne
Transportation Regasification Market Liquefaction
Downstream Midstream Upstream
Production
Floating regasification grants access to inexpensive global LNG with a
significant advantage in both cost and lead-time vs. an onshore import terminal
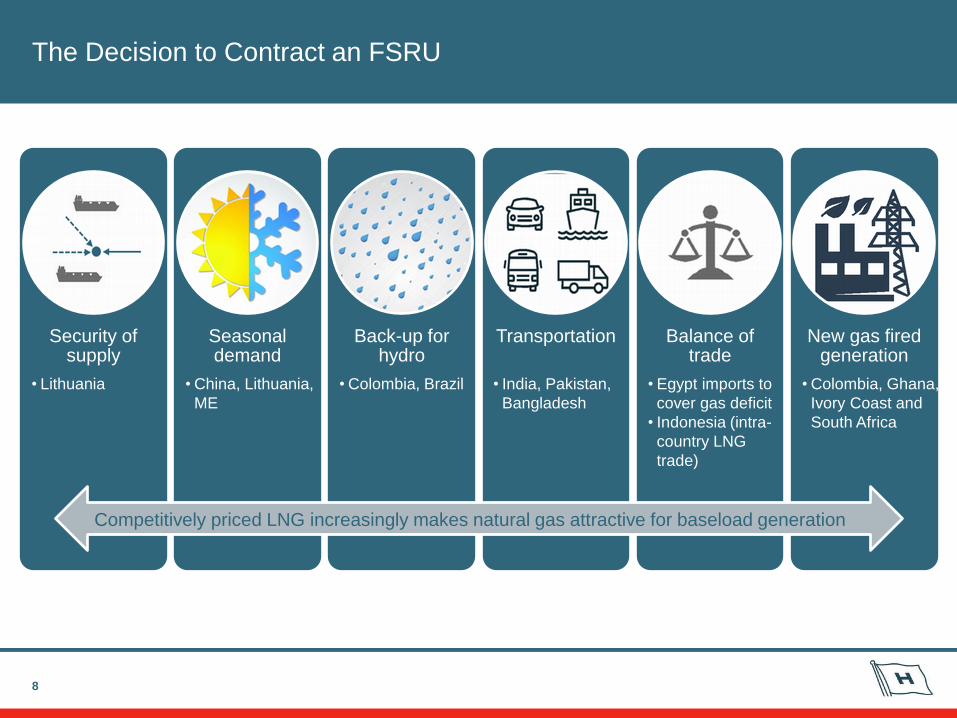
The Decision to Contract an FSRU
8
Security of supply
Seasonal demand
Back-up for hydro
Transportation Balance of trade
New gas fired generation
• China, Lithuania,
ME
• Colombia, Brazil • India, Pakistan,
Bangladesh
• Lithuania • Egypt imports to
cover gas deficit
• Indonesia (intra-
country LNG
trade)
• Colombia, Ghana,
Ivory Coast and
South Africa
Competitively priced LNG increasingly makes natural gas attractive for baseload generation

The FSRU – The Fastest and Most Cost Effective Path to LNG Imports
9
Compared to land-based terminals, an FSRU offers the following advantages:
– Half the time: six months to three years (order in advance)
– Half the cost: $0.3/MMBtu*
– Limited environmental footprint: terminal is floating, mooring can be removed
– Flexibility: can be relocated, re-employed, or traded as LNG carrier
*Based on open loop and full utilization

10
Successful Follow-on Offering and Acquisition of Höegh Grace
Acquisition
51% Höegh Grace
$370 million gross valuation
Minimum 10-year contract
Closed Jan 3, 2017
4.2% increase in distribution from 1Q17
Follow-on
$112 million net proceeds
$92 million cash consideration for Höegh
Grace
Upsized on strong demand
New unit count of 32,911,159(1)
HMLP trading liquidity much improved
(1) Consisting of 19,755,099 common units and 13,156,060 subordinated units
11
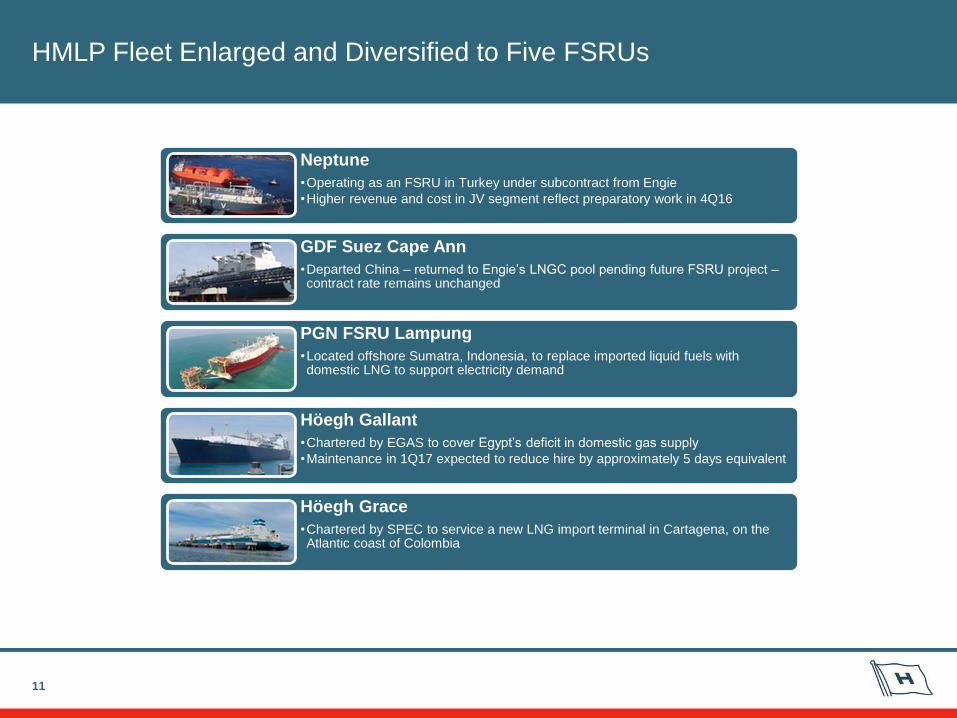
HMLP Fleet Enlarged and Diversified to Five FSRUs
Neptune
•Operating as an FSRU in Turkey under subcontract from Engie
•Higher revenue and cost in JV segment reflect preparatory work in 4Q16
GDF Suez Cape Ann
•Departed China – returned to Engie’s LNGC pool pending future FSRU project – contract rate remains unchanged
PGN FSRU Lampung
•Located offshore Sumatra, Indonesia, to replace imported liquid fuels with domestic LNG to support electricity demand
Höegh Gallant
•Chartered by EGAS to cover Egypt’s deficit in domestic gas supply
•Maintenance in 1Q17 expected to reduce hire by approximately 5 days equivalent
Höegh Grace
•Chartered by SPEC to service a new LNG import terminal in Cartagena, on the Atlantic coast of Colombia

Unit Type Ownership Built Region Charterer 2018
2020
2022
2024
2026
2028
2030
2032
2034
2036
2038
Current HMLP Fleet
Neptune FSRU 50% 2009 Turkey Engie
GDF Suez Cape Ann FSRU 50% 2010 China Engie
PGN FSRU Lampung FSRU 100% 2014 Indonesia PGN
Höegh Gallant FSRU 100% 2014 Egypt EGAS/HLNG
Höegh Grace FSRU 51% 2016 Colombia SPEC
Contracted Revenue Option
Long-Term Contracts with Stable Cash Flows and Distribution Coverage
12
(1) Economic interest; ownership interest 49%
(2) Previously GDF-Suez
(3) As of March 31, 2017
(2)
(1)
(2)
12.2 years(3) average remaining contract length, with earliest expiry in 2025(4)
No direct exposure to volatile commodity prices and limited Opex exposure(5)
Strong sovereign and utility counterparties reliant on HMLP for crucial energy infrastructure
– Additional guarantee from HLNG in case of FSRU Höegh Gallant
Fixed Rate, Contracted Cash Flow Supports Growing, Long-Term Distributions
(4) Includes HMLP option to charter FSRU Höegh Gallant to HLNG after end of EGAS contract
(5) Extent of Opex exposure depends on contract
Unit Type Ownership Built Region Charterer 2018
2020
2022
2024
2026
2028
2030
2032
2034
2036
2038
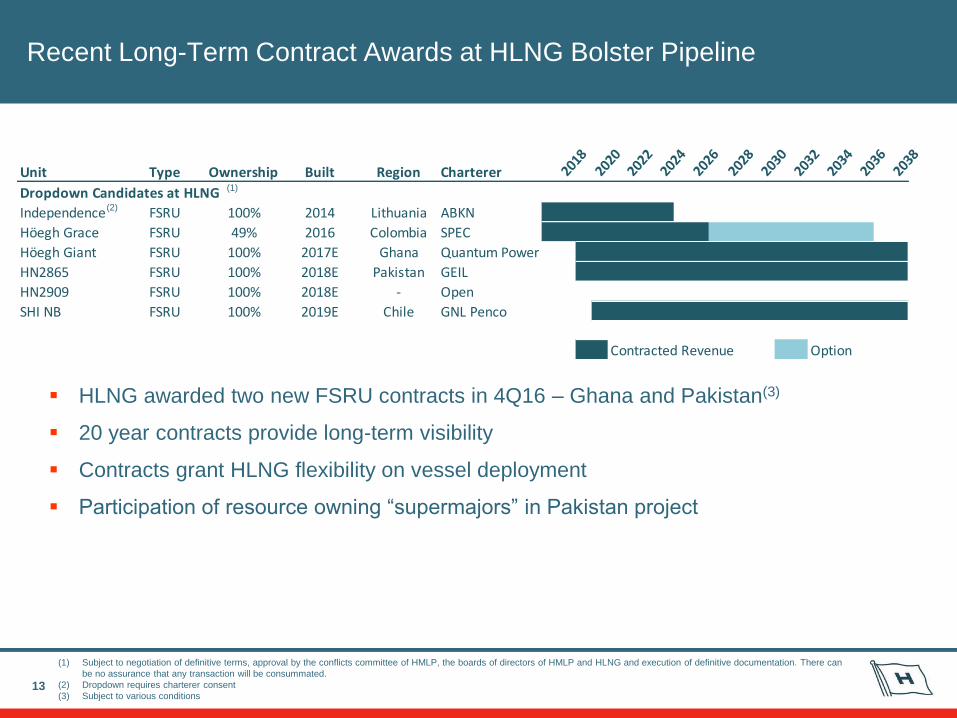
Dropdown Candidates at HLNG
Independence FSRU 100% 2014 Lithuania ABKN
Höegh Grace FSRU 49% 2016 Colombia SPEC
Höegh Giant FSRU 100% 2017E Ghana Quantum Power
HN2865 FSRU 100% 2018E Pakistan GEIL
HN2909 FSRU 100% 2018E - Open
SHI NB FSRU 100% 2019E Chile GNL Penco
Contracted Revenue Option
(2)
(1)
Recent Long-Term Contract Awards at HLNG Bolster Pipeline
13
(1) Subject to negotiation of definitive terms, approval by the conflicts committee of HMLP, the boards of directors of HMLP and HLNG and execution of definitive documentation. There can
be no assurance that any transaction will be consummated.
(2) Dropdown requires charterer consent
(3) Subject to various conditions
HLNG awarded two new FSRU contracts in 4Q16 – Ghana and Pakistan(3)
20 year contracts provide long-term visibility
Contracts grant HLNG flexibility on vessel deployment
Participation of resource owning “supermajors” in Pakistan project

Höegh LNG Group Delivering In Accordance With Strategy
14
Ordered newbuilding
Ordered newbuilding
Long-term contract
Long-term contract
•20 year contract with GEI in Pakistan with startup 2Q 2018
•Annual EBITDA: USD 36 million
•Signed LOI for one plus three optional FSRU newbuildings
•Firm agreement signed 17 January 2017
•20 year contract with Quantum Power in Ghana with startup 2018
•Annual EBITDA: USD 36 million
•Signed shipbuilding contract for one FSRU newbuilding
•Delivery 4Q 2018
Refinanced bond
•Issued new 5yr NOK 1,500 million senior unsecured bond
•13% buyback of HLNG01
Raised equity in HMLP
•Sold 51% of Höegh Grace to HMLP
•HMLP raised USD 112 million
Fin
an
cin
g m
ile
sto
nes
C
om
me
rcia
l m
ile
sto
ne
s

(2014)
(2015) (2017)
(2018)
(2018/19)
(T+12mo)
(2020)
(2017)
Another Milestone in HMLP’s Growth Trajectory
51% of Höegh Grace is the first step on path to HMLP’s goal of doubling in size by 2020
and diversifying its portfolio
Increased diversification set to add to a strong track-record of project execution
Strong FSRU fundamentals and support of HLNG underpin trajectory
Anticipated(1)
Expected to be offered to HMLP at start
of 5yr+ contract(1)
T Date of order
Existing HMLP Fleet (2019)
(1) There can be no assurance that any acquisition or dropdown transactions will be consummated.
15
Pakistan FSRU Project: Further Progress for the Infrastructure Project
16
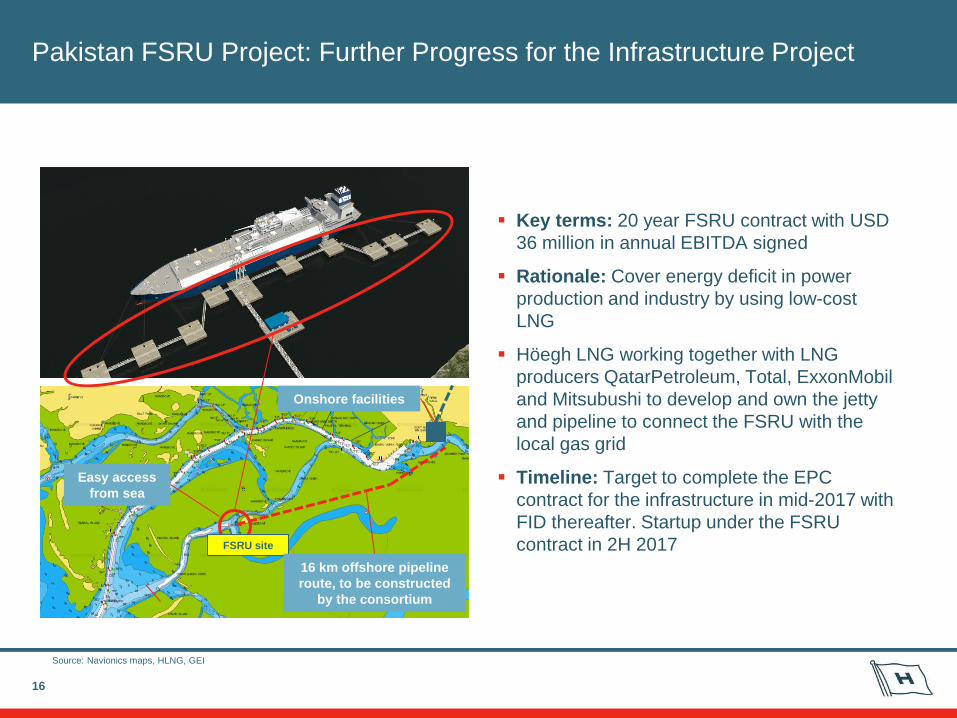
FSRU site
Source: Navionics maps, HLNG, GEI
Easy access
from sea
16 km offshore pipeline
route, to be constructed
by the consortium
Onshore facilities
Key terms: 20 year FSRU contract with USD
36 million in annual EBITDA signed
Rationale: Cover energy deficit in power
production and industry by using low-cost
LNG
Höegh LNG working together with LNG
producers QatarPetroleum, Total, ExxonMobil
and Mitsubushi to develop and own the jetty
and pipeline to connect the FSRU with the
local gas grid
Timeline: Target to complete the EPC
contract for the infrastructure in mid-2017 with
FID thereafter. Startup under the FSRU
contract in 2H 2017
Quantum Power/Ghana Working Towards FID in Mid-2017
17
Source: Navionics maps, Quantum Power
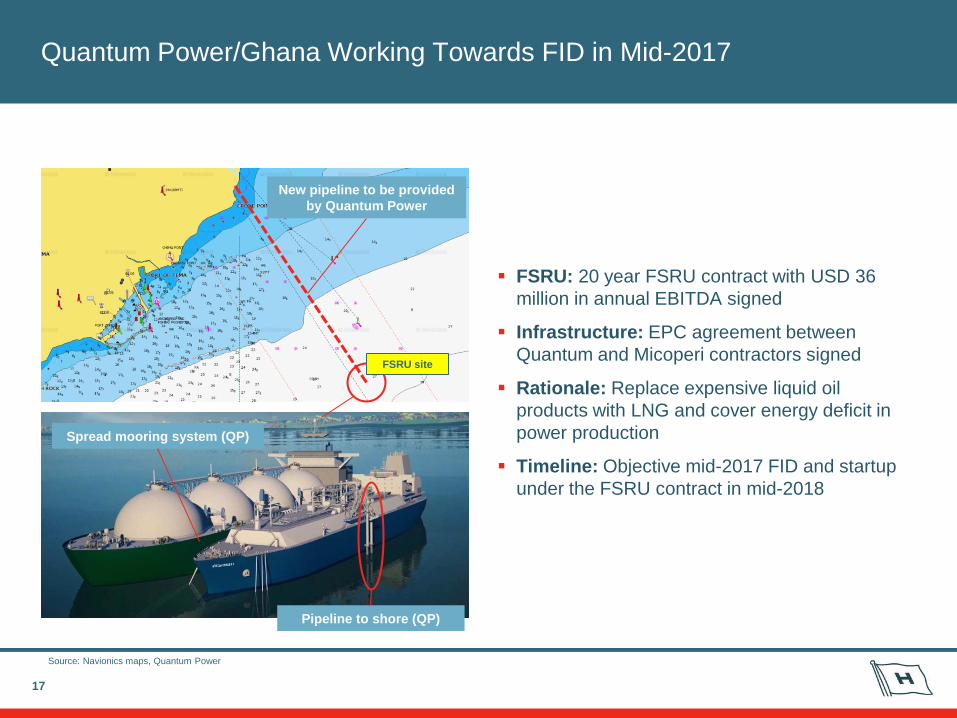
New pipeline to be provided
by Quantum Power
FSRU site
Spread mooring system (QP)
Pipeline to shore (QP)
FSRU: 20 year FSRU contract with USD 36
million in annual EBITDA signed
Infrastructure: EPC agreement between
Quantum and Micoperi contractors signed
Rationale: Replace expensive liquid oil
products with LNG and cover energy deficit in
power production
Timeline: Objective mid-2017 FID and startup
under the FSRU contract in mid-2018

LNG Supply to Exceed Demand and Keep Prices Competitive
18
Source: WoodMackenzie
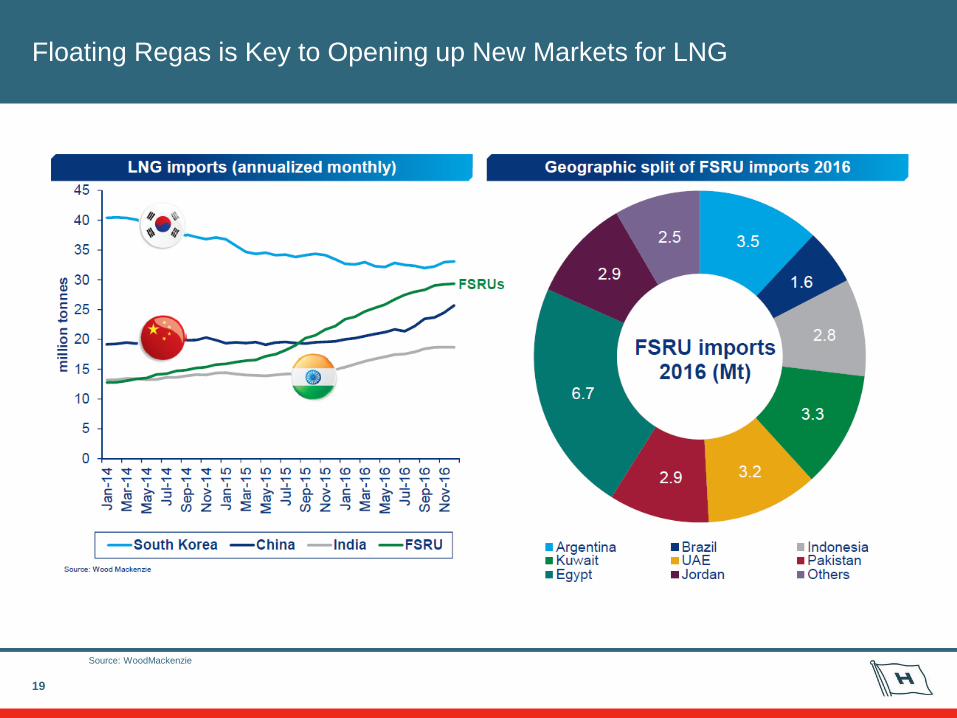
Floating Regas is Key to Opening up New Markets for LNG
19
Source: WoodMackenzie

20
Other Metrics that are Capturing the Attention of LNG Consumers
0
5
10
15
20
25
Contracted LNG price discount to oil maintained
Brent Japan LNG ($/MMBTU)
0
5
10
15
20
25
LNG's spot price advantage over oil increasing
Brent LNG Singapore Spot ($/MMBTU)
0
2
4
6
8
10
12
Gas increasingly competitive against coal in Europe
NBP ARA Coal ($/MMBTU)
0
10
20
30
40
50
60
Projected Top LNG Suppliers - 2020
0
100
200
300
400
500
LNG expected to remain attractively priced and available
LNG Supply LNG Contracted (MTPA)
CO2 ↓
NO2 ↓
Efficiency ↑
Flexibility ↑
Energy Security ↑
Source: Bloomberg, Poten & Partners, Japanese Ministry of Economy, Trade and Industry

Höegh LNG Group’s FSRUs and the Opportunity Set for the Future
21
Smaller markets
targeted by barges
and conversions
In Operation 21
Under
Construction 12
Planned or
Possible >40
Source: Press releases / public disclosures
Market Commentary
22
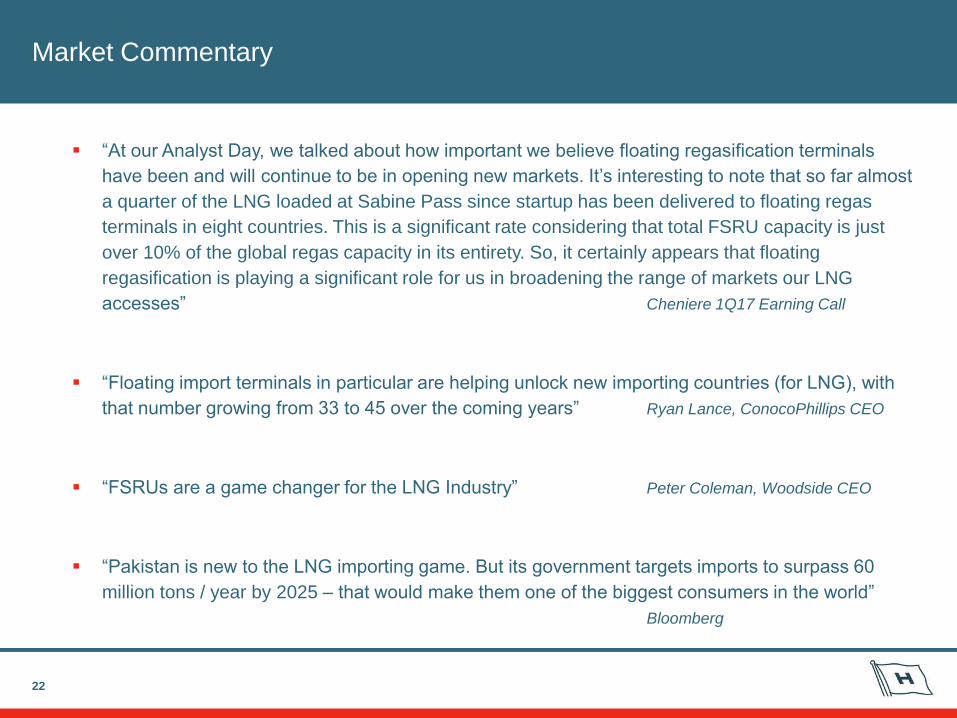
“At our Analyst Day, we talked about how important we believe floating regasification terminals
have been and will continue to be in opening new markets. It’s interesting to note that so far almost
a quarter of the LNG loaded at Sabine Pass since startup has been delivered to floating regas
terminals in eight countries. This is a significant rate considering that total FSRU capacity is just
over 10% of the global regas capacity in its entirety. So, it certainly appears that floating
regasification is playing a significant role for us in broadening the range of markets our LNG
accesses” Cheniere 1Q17 Earning Call
“Floating import terminals in particular are helping unlock new importing countries (for LNG), with
that number growing from 33 to 45 over the coming years” Ryan Lance, ConocoPhillips CEO
“FSRUs are a game changer for the LNG Industry” Peter Coleman, Woodside CEO
“Pakistan is new to the LNG importing game. But its government targets imports to surpass 60
million tons / year by 2025 – that would make them one of the biggest consumers in the world”
Bloomberg

Balanced, Largely Contracted Orderbook
The orderbook stands at 11
FSRUs, of which 4 are
uncommitted
Other category includes a
number of FSRUs that are
targeting bespoke projects
Uncommitted FSRUs (4
newbuildings, 1 existing
vessel) compare to 14% of
the total fleet and orderbook
of FSRUs
Four existing FSRUs are
serving contracts with
near/mid-term expiries or with
undetermined timelines
23
7
8
7
1 1
1
2
1
1
3
1
1
2
0
2
4
6
8
10
12
Höegh LNG Excelerate Golar LNG BW Gas Other
Un
its
FSRU fleet and orderbook1 by owner and employment
On contract Available Committed NB Uncommitted NB
OLT
MOL
Gazprom
Exmar
Maran
Kolin
FSRU fleet and orderbook1 by owner and employment
(2)
(1) Orderbook defined as firm orders, excluding LOIs, options, conversions
(2) Includes HMLP and HLNG units

24
Höegh LNG Partners LP (NYSE:HMLP) – Investment Summary
• The only publicly listed FSRU pure play
• Current fleet of five FSRUs on long-term, fixed-rate contracts Pure Play Owner and Operator of FSRUs
• Average vessel age of 3.8 years(1)
• Meeting critical energy infrastructure needs
• Leading player in highly concentrated FSRU market
Modern Fleet Providing Critical Energy Infrastructure
• Average remaining contract term of 12.2 years plus options(2)
• Earliest contract expiry in 2025(3), with no near-term debt maturities
• No direct commodity exposure and limited Opex exposure(4)
Full Employment on Fixed, Long-term
Contracts
• Committed pipeline of high-quality dropdown assets
• Dropdowns typically evaluated once assets go on long-term contract
• Accretive acquisitions of FSRUs expected to drive distribution growth
Dropdown Pipeline for Built-in Distribution
Growth
• LNG is especially competitive fuel at current prices
• Readily available LNG supply drives FSRU adoption globally
• Oil and coal displacement with environmental benefits over both
Attractive FSRU Market Conditions
• Recognized leader in the LNG space for 40+ years
• Extensive technical and maritime expertise and relationships
• Favorable financing terms highlight value of sponsor support
Supportive, Industry-Leading
Sponsor
(1) As of March 31, 2017
(2) As of March 31, 2017 including the Höegh Grace, 19.2 years including options
(3) Includes HMLP option to charter FSRU Höegh Gallant to HLNG after end of EGAS contract
(4) Extent of Opex exposure depends on vessel contract

Appendix

26
Prudent Replacement Capex, Coverage and Debt Maturity Profile
107
62 17
170
119
0.0
0.5
1.0
1.5
2.0
2.5
0
20
40
60
80
100
120
140
160
180
200
3q16 4q16 1q17 2q17 3q17 4q17 1q18 2q18 3q18 4q18 1q19 2q19 3q19 4q19 1q20 2q20 3q20 4q20 2021 2022
Co
ntr
act
backlo
g,
$b
n
Matu
rin
g d
eb
t, $
m
Maturity of HMLP debt
$34m Seller's Credit / RCF
Bank debt balloon
Bank debt amortization
Contract backlog
$85m RCF (2020)(2)
Gallant(1)
Lampung(1)
Grace #1(1)
(1) Excludes export credit tranches on Lampung, Gallant and Grace#1 that are repaid over 12 years provided commercial tranches are refinanced
(2) $10.2 million drawn as of March 2017
(3) Based on existing HMLP assets only
First debt maturity in 2019 at which time HMLP’s contracted backlog is expected to
exceed $1.5 billion(3)
Amortization of bank debt partially offset by $85 million RCF from HLNG(2)
Steady deleveraging through replacement capex and coverage
Scope to refinance Seller’s Credit and RCF externally
Importantly, replacement capex includes provision for dry-docking if for HMLP’s account
Neptune
CA

27
Income Statement
Three months ended
March 31,
(in thousands of U.S. dollars) 2017 2016
REVENUES
Time charter revenues $ 35,076 $ 21,670
Total revenues 35,076 21,670
OPERATING EXPENSES
Vessel operating expenses (6,177) (3,783)
Administrative expenses (2,757) (2,305)
Depreciation and amortization (5,263) (2,630)
Total operating expenses (14,197) (8,718)
Equity in earnings (losses) of joint ventures 4,809 (6,708)
Operating income (loss) 25,688 6,244
FINANCIAL INCOME (EXPENSE), NET
Interest income 130 273
Interest expense (7,736) (6,406)
Gain (loss) on derivative instruments 663 335
Other items, net (802) (1,037)
Total financial income (expense), net (7,745) (6,835)
Income (loss) before tax 17,943 (591)
Income tax expense (1,755) (449)
Net income (loss) $ 16,188 $ (1,040)
Non-controlling interest in net income 2,744 —
Partners’ interest in net income (loss) $ 13,444 $ (1,040)

28
Segment Reporting
(1) Segment EBITDA is a non-GAAP financial measure. For a definition of Segment EBITDA and reconciliations to net income, the most directly comparable US GAAP financial measure, please see the Appendix.
(2) Eliminations reverse each of the income statement line items of the proportional amounts for Joint venture FSRUs and record the Partnership's share of the Joint venture FSRUs net income (loss) to Equity in earnings
(loss) of joint ventures.
(3) Eliminations reverse the adjustment to Non-controlling interest in Segment EBITDA included for Segment EBITDA and the adjustment to reverse the Non-controlling interest in Segment EBITDA to reconcile to
operating income and net income.
Three months ended March 31, 2017
Joint venture
Majority FSRUs Total
held (proportional Segment Elimin- Consolidated
(in thousands of U.S. dollars) FSRUs consolidation) Other reporting ations reporting
Time charter revenues $ 35,076 10,924 — 46,000 (10,924) (2) $ 35,076
Total revenues 35,076 10,924 — 46,000 35,076
Operating expenses (7,262) (2,619) (1,672) (11,553) 2,619 (2) (8,934)
Equity in earnings (losses) of joint ventures — — — — 4,809 (2) 4,809
Less: Non-controlling interest in Segment EBITDA (4,994) — — (4,994) 4,994 (3) —
Segment EBITDA (1) 22,820 8,305 (1,672) 29,453
Add: Non-controlling interest in Segment EBITDA 4,994 — — 4,994 (4,994) (3) —
Depreciation and amortization (5,263) (2,440) — (7,703) 2,440 (2) (5,263)
Operating income (loss) 22,551 5,865 (1,672) 26,744 25,688
Gain (loss) on derivative instruments 663 2,496 — 3,159 (2,496) (2) 663
Other financial income (expense), net (7,455) (3,552) (953) (11,960) 3,552 (2) (8,408)
Income (loss) before tax 15,759 4,809 (2,625) 17,943 — 17,943
Income tax expense (1,755) — — (1,755) — (1,755)
Net income (loss) $ 14,004 4,809 (2,625) 16,188 — $ 16,188
Non-controlling interest in net income 2,744 — — 2,744 2,744
Partners’ interest in net income (loss) $ 11,260 4,809 (2,625) 13,444 — $ 13,444
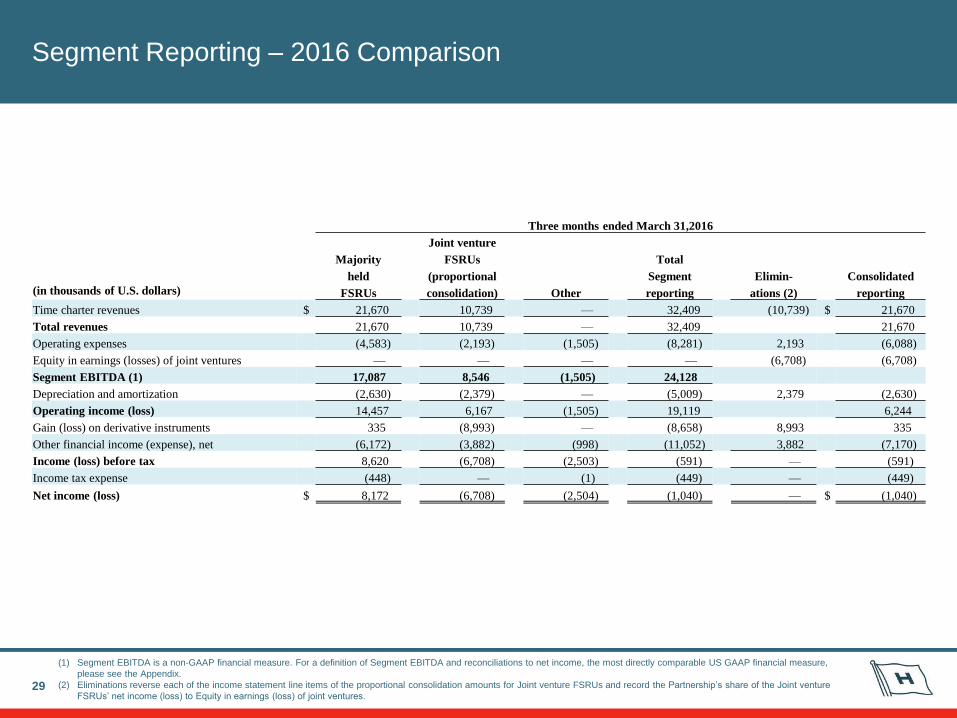
Segment Reporting – 2016 Comparison
29
(1) Segment EBITDA is a non-GAAP financial measure. For a definition of Segment EBITDA and reconciliations to net income, the most directly comparable US GAAP financial measure,
please see the Appendix.
(2) Eliminations reverse each of the income statement line items of the proportional consolidation amounts for Joint venture FSRUs and record the Partnership’s share of the Joint venture
FSRUs’ net income (loss) to Equity in earnings (loss) of joint ventures.
Three months ended March 31,2016
Joint venture
Majority FSRUs Total
held (proportional Segment Elimin- Consolidated
(in thousands of U.S. dollars) FSRUs consolidation) Other reporting ations (2) reporting
Time charter revenues $ 21,670 10,739 — 32,409 (10,739) $ 21,670
Total revenues 21,670 10,739 — 32,409 21,670
Operating expenses (4,583) (2,193) (1,505) (8,281) 2,193 (6,088)
Equity in earnings (losses) of joint ventures — — — — (6,708) (6,708)
Segment EBITDA (1) 17,087 8,546 (1,505) 24,128
Depreciation and amortization (2,630) (2,379) — (5,009) 2,379 (2,630)
Operating income (loss) 14,457 6,167 (1,505) 19,119 6,244
Gain (loss) on derivative instruments 335 (8,993) — (8,658) 8,993 335
Other financial income (expense), net (6,172) (3,882) (998) (11,052) 3,882 (7,170)
Income (loss) before tax 8,620 (6,708) (2,503) (591) — (591)
Income tax expense (448) — (1) (449) — (449)
Net income (loss) $ 8,172 (6,708) (2,504) (1,040) — $ (1,040)

30
Financial Income and Expense
Three months ended
March 31, (in thousands of U.S. dollars) 2017 2016
Interest income $ 130 $ 273
Interest expense:
Interest expense (7,259) (5,582)
Commitment fees (264) (301)
Amortization of debt issuance cost and fair value of debt assumed (213) (523)
Total interest expense (7,736) (6,406)
Gain (loss) on derivative instruments 663 335
Other items, net:
Unrealized foreign exchange gain (loss) (147) 50
Realized foreign exchange gain (loss) 14 (385)
Bank charges, fees and other (23) (80)
Withholding tax on interest expense and other (646) (622)
Total other items, net (802) (1,037)
Total financial income (expense), net $ (7,745) $ (6,835)
31
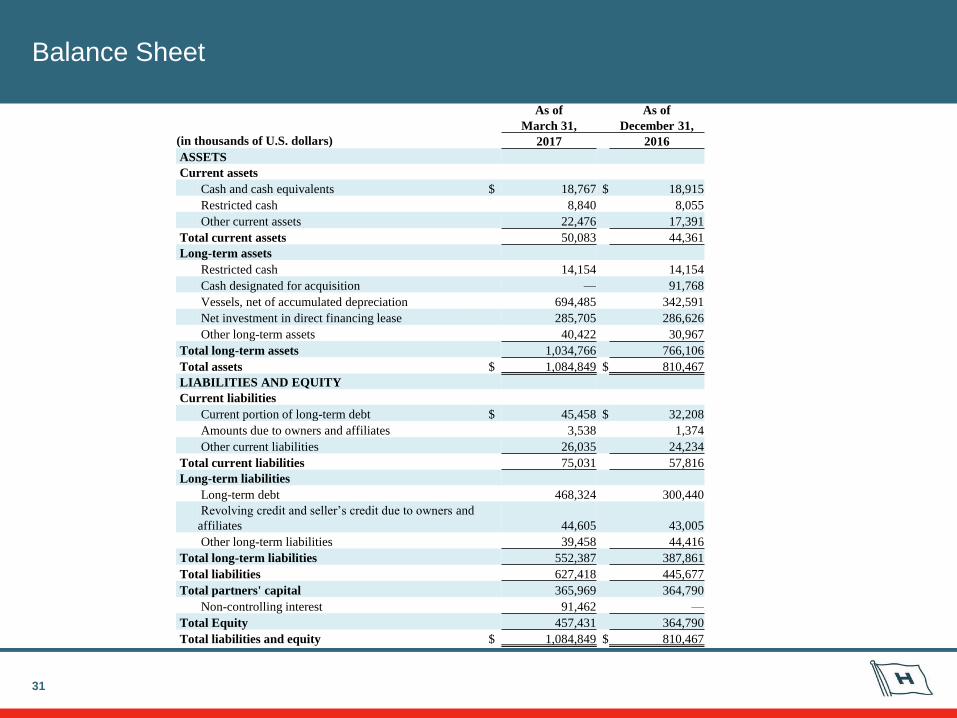
Balance Sheet
As of As of
March 31, December 31,
(in thousands of U.S. dollars) 2017 2016
ASSETS
Current assets
Cash and cash equivalents $ 18,767 $ 18,915
Restricted cash 8,840 8,055
Other current assets 22,476 17,391
Total current assets 50,083 44,361
Long-term assets
Restricted cash 14,154 14,154
Cash designated for acquisition — 91,768
Vessels, net of accumulated depreciation 694,485 342,591
Net investment in direct financing lease 285,705 286,626
Other long-term assets 40,422 30,967
Total long-term assets 1,034,766 766,106
Total assets $ 1,084,849 $ 810,467
LIABILITIES AND EQUITY
Current liabilities
Current portion of long-term debt $ 45,458 $ 32,208
Amounts due to owners and affiliates 3,538 1,374
Other current liabilities 26,035 24,234
Total current liabilities 75,031 57,816
Long-term liabilities
Long-term debt 468,324 300,440
Revolving credit and seller’s credit due to owners and
affiliates 44,605 43,005
Other long-term liabilities 39,458 44,416
Total long-term liabilities 552,387 387,861
Total liabilities 627,418 445,677
Total partners' capital 365,969 364,790
Non-controlling interest 91,462 —
Total Equity 457,431 364,790
Total liabilities and equity $ 1,084,849 $ 810,467
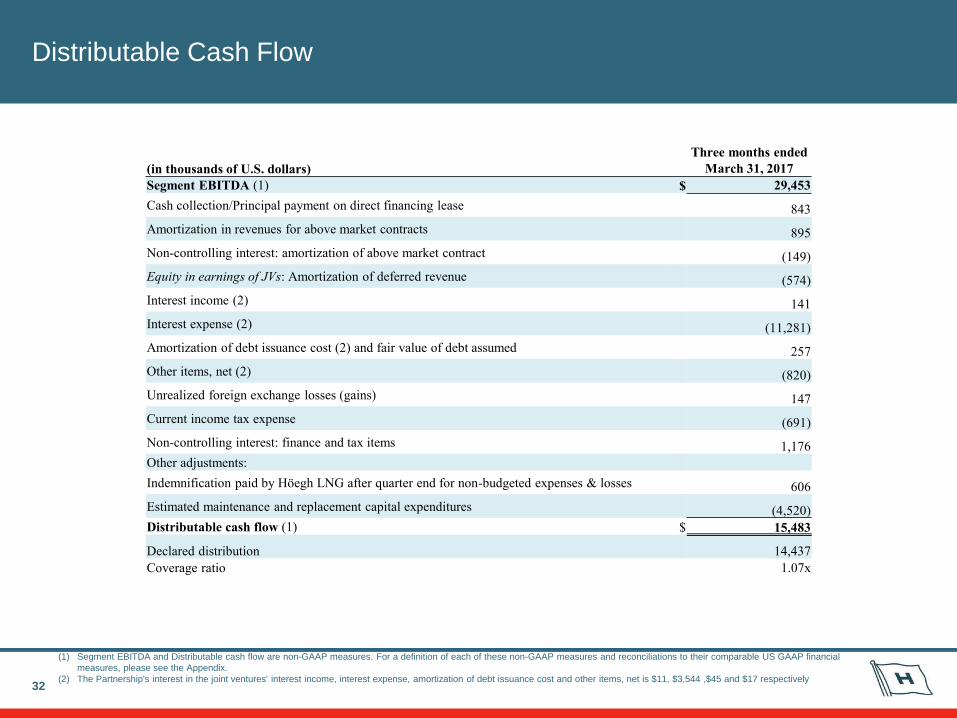
Distributable Cash Flow
32
(1) Segment EBITDA and Distributable cash flow are non-GAAP measures. For a definition of each of these non-GAAP measures and reconciliations to their comparable US GAAP financial
measures, please see the Appendix.
(2) The Partnership's interest in the joint ventures' interest income, interest expense, amortization of debt issuance cost and other items, net is $11, $3,544 ,$45 and $17 respectively
Three months ended
(in thousands of U.S. dollars) March 31, 2017
Segment EBITDA (1) $ 29,453
Cash collection/Principal payment on direct financing lease 843
Amortization in revenues for above market contracts 895
Non-controlling interest: amortization of above market contract (149)
Equity in earnings of JVs: Amortization of deferred revenue (574)
Interest income (2) 141
Interest expense (2) (11,281)
Amortization of debt issuance cost (2) and fair value of debt assumed 257
Other items, net (2) (820)
Unrealized foreign exchange losses (gains) 147
Current income tax expense (691)
Non-controlling interest: finance and tax items 1,176
Other adjustments:
Indemnification paid by Höegh LNG after quarter end for non-budgeted expenses & losses 606
Estimated maintenance and replacement capital expenditures (4,520)
Distributable cash flow (1) $ 15,483
Declared distribution 14,437
Coverage ratio 1.07x

Reconciliation of Distributable Cash Flow to Net Cash Provided by
Operating Activities
33
(1) Distributable cash flow is a non-GAAP liquidity measure. For a definition of distributable cash flow, please see the Appendix.
Three months
ended
(in thousands of U.S. dollars) March 31, 2017
Distributable cash flow (1) $ 15,483
Indemnification paid by Höegh LNG after quarter end for
non-budgeted expenses & losses (606)
Estimated maintenance and replacement capital expenditures 4,520
Non-controlling interest in EBITDA 4,994
Non-controlling interest: amortization of above market contract 149
Non-controlling interest: finance and tax items (1,176)
Equity in earnings of JVs: Amortization of deferred revenue 574
Equity in earnings of JVs: Amortization of debt issuance cost (45)
Equity in earnings of JVs: Depreciation and amortization (2,440)
Equity in earnings of JVs: Gain (loss) on derivative instruments 2,496
Equity in losses (earnings) of joint ventures (4,809)
Cash collection/Principal payment on direct financing lease (843)
Changes in accrued interest expense and interest income 1,008
Other adjustments 136
Changes in working capital 136
Net cash provided by (used in) operating activities $
19,577

Non-GAAP Financial Measures
Adjusted Net Income
34
Adjusted Net Income is defined as net income adjusted for unrealized gains and losses on derivative instruments, foreign exchange
gains and losses and non-controlling interest. The adjustment for unrealized gains and losses on derivative instruments includes our
share of such gains and losses related to the joint ventures accounted for under the equity method in addition to those gains and losses
reflected as financial income (expense), net in the consolidated statements of income. Adjusted Net Income is used as a supplemental
financial measure by management to assess its operating performance. The Partnership believes that Adjusted Net Income assists its
management and investors by increasing the comparability of its performance from period to period and against the performance of other
companies in the industry that provide Adjusted Net Income information. This increased comparability is achieved by excluding the
potentially disparate effects between periods, which items are affected by different accounting solutions for interest rate swaps and
swings in exchange rates which may significantly affect net income between periods. Adjusted Net Income should not be considered an
alternative to net income or any other measure of financial performance presented in accordance with U.S. GAAP. Adjusted Net Income
excludes some, but not all, items that affect net income, and these measures may vary among other companies. Therefore, Adjusted Net
Income as presented below may not be comparable to similarly titled measures of other companies. The following tables reconcile
Adjusted Net Income to net income (loss), the comparable U.S. GAAP financial measure, for the periods presented:
March 31, June 30, September 30, December 31, March 31, June 30, September 30, December 31, March 31,
(in thousands of U.S. dollars) 2015 2015 2015 2015 2016 2016 2016 2016 2017
Net Income (Loss) $
2,578
16,438
5,185
17,078
(1,040)
4,062
13,425 $
24,933 $ 16,188
Loss (gain) on derivatives in Majority
held FRSUs
(121)
8
(354)
(482)
(335)
(326)
(517)
(661)
(663)
Equity in earnings of JVs: Loss (gain)
on derivatives in Joint Ventures
3,932
(9,871)
2,109
(5,416)
8,993
4,174
(4,139)
(16,120)
(2,496)
Foreign exchange loss (gain)
426
246
643
(1,299)
337
27
66
(47) 133
Less non-controlling interest —
—
—
—
—
—
—
—
(2,744)
Adjusted Net Income (Loss) $
6,815
6,821
7,583
9,881
7,955
7,937
8,836 $
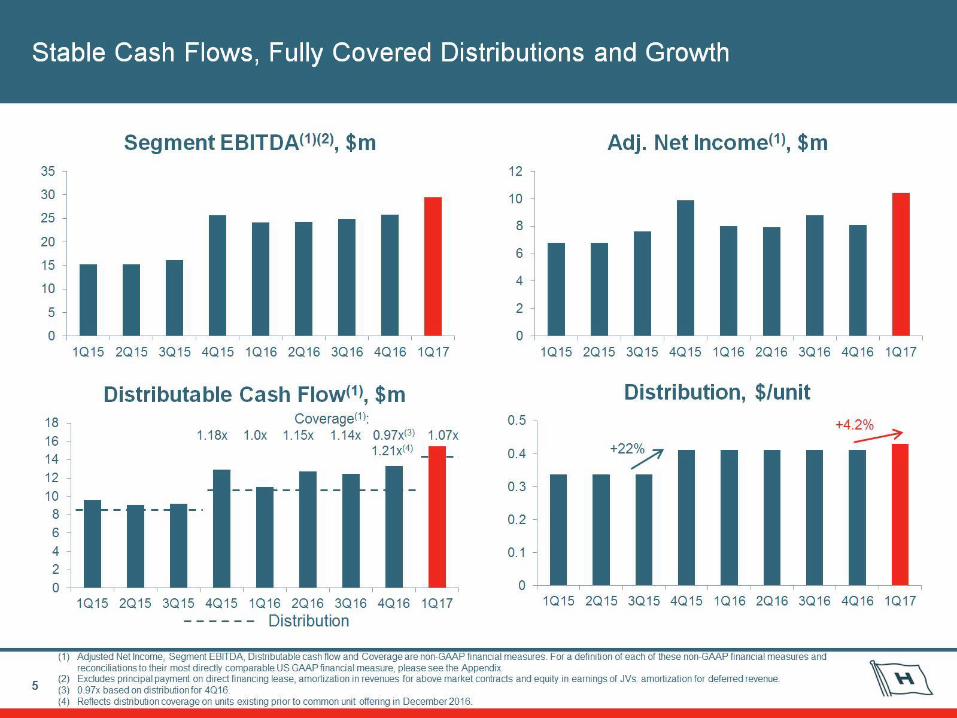
8,106 $ 10,418

Non-GAAP Financial Measures
Segment EBITDA
35
Segment EBITDA. EBITDA is defined as earnings before interest, depreciation and amortization and taxes. Segment EBITDA is defined
as earnings before interest, depreciation and amortization, taxes and other financial items less non-controlling interest in Segment
EBITDA. Other financial items consist of gains and losses on derivative instruments and other items, net (including foreign exchange
gains and losses and withholding tax on interest expenses). Segment EBITDA is used as a supplemental financial measure by
management and external users of financial statements, such as the Partnership's lenders, to assess its financial and operating
performance. The Partnership believes that Segment EBITDA assists its management and investors by increasing the comparability of
its performance from period to period and against the performance of other companies in the industry that provide Segment EBITDA
information. This increased comparability is achieved by excluding the potentially disparate effects between periods or companies of
interest, other financial items, depreciation and amortization and taxes, which items are affected by various and possibly changing
financing methods, capital structure and historical cost basis and which items may significantly affect net income between periods. The
Partnership believes that including Segment EBITDA as a financial and operating measure benefits investors in (a) selecting between
investing in it and other investment alternatives and (b) monitoring its ongoing financial and operational strength in assessing whether to
continue to hold common units. Segment EBITDA is a non-GAAP financial measure and should not be considered as an alternative to
net income, operating income or any other measure of financial performance presented in accordance with U.S. GAAP. Segment
EBITDA excludes some, but not all, items that affect net income, and these measures may vary among other companies. Therefore,
Segment EBITDA as presented below may not be comparable to similarly titled measures of other companies. The following tables
reconcile Segment EBITDA for each of the segments and the Partnership as a whole to net income (loss), the comparable U.S. GAAP
financial measure, for the periods presented:

(1) Other financial items consist of gains and losses on derivative instruments and other items, net including foreign exchange gains or losses and withholding tax on interest expense.
36
Segment EBITDA
Three months ended
March 31, June 30, September 30, December 31, March 31, June 30, September 30, December 31, March 31,
(in thousands of U.S. dollars) 2015 2015 2015 2015 2016 2016 2016 2016 2017
Reconciliation to net income (loss)
Net income (loss) $ 2,578 16,438 5,185 17,075 (1,040) 4,062 13,425 24,933 $ 16,188
Interest income
(2,427)
(2,425)
(2,423)
(293)
(273)
(232)
(192)
(160)
(130)
Interest expense, net 3,800 3,710 3,744
6,517 6,406 6,354
6,283 6,135 7,736
Depreciation and amortization 8 8 8
2,630 2,630 2,636
2,647 2,639 5,263
Income tax expense 93 59 109
52 449 501
476 2,446 1,755
Other financial items (1) 979 942 922
(1,114) 702 636
261
(107) 139
Equity in earnings of JVs:
Interest expense, net 4,027 4,089 4,029
3,968 3,865 3,787
3,755 3,685 3,534
Equity in earnings of JVs:
Depreciation and amortization 2,177 2,309 2,456
2,286 2,379 2,376
2,378 2,395 2,440
Equity in earnings of JVs:
Other financial items (1) 3,953
(9,897) 2,109
(5,422) 9,010 4,174
(4,139)
(16,120)
(2,478)
Non-controlling interest in EBITDA — — —
— — —
— —
(4,994)
Segment EBITDA $ 15,187 15,233 16,139 25,699 24,128 24,294 24,893 25,846 $ 29,453
Distributable Cash Flow
37
Distributable cash flow represents Segment EBITDA adjusted for cash collections on principal payments on the direct financing lease, amortization in
revenues for above market contracts less non-controlling interest in amortization in revenues for above market contracts, amortization of deferred revenues
for the joint ventures, interest income , interest expense less amortization of debt issuance cost and fair value of debt assumed, other items (net), unrealized
foreign exchange losses (gains), current income tax expense, non-controlling interest in finance and tax items and other adjustments including
indemnification paid by Hoegh LNG for non-budgeted expenses and losses and estimated maintenance and replacement capital expenditures. Cash
collections on the direct financing lease investment with respect to the PGN FSRU Lampung consist of the difference between the payments under time
charter and the revenues recognized as a financing lease (representing the payment of the principal recorded as a receivable). Amortization in revenues for
above market contracts consist of the non-cash amortization of the intangible for the above market time charter contract related to the acquisitions of the
Höegh Gallant and Höegh Grace. Amortization of deferred revenues for the joint ventures accounted for under the equity method consist of non-cash
amortization to revenues of charterer payments for modifications and drydocking to the vessels. Estimated maintenance and replacement capital
expenditures, including estimated expenditures for drydocking, represent capital expenditures required to maintain over the long-term the operating capacity
of, or the revenue generated by, the Partnership's capital assets.
Distributable cash flow is presented starting with Segment EBITDA taken from the total segment reporting using the proportional consolidation method for
the Partnership's 50% interests in the joint ventures as shown in this Appendix. Therefore, the adjustments to Segment EBITDA include the Partnership's
share of the joint venture's adjustments. The Partnership believes distributable cash flow is an important liquidity measure used by management and
investors in publicly traded partnerships to compare cash generating performance of the Partnership’ cash generating assets from period to period by
adjusting for cash and non-cash items that could potentially have a disparate effect between periods, and to compare the cash generating performance for
specific periods to the cash distributions (if any) that are expected to be paid to unitholders. The Partnership also believes distributable cash flow benefits
investors in comparing its cash generating performance to other companies that account for time charters as operating leases rather than financial leases, or
that do not have non-cash amortization of intangibles or deferred revenue. Distributable cash flow is a non-GAAP liquidity measure and should not be
considered as an alternative to net cash provided by operating activities, or any other measure of the Partnership's liquidity or cash flows calculated in
accordance with GAAP. Distributable cash flow excludes some, but not all, items that affect net cash provided by operating activities and the measures may
vary among companies. For example, distributable cash flow does not reflect changes in working capital balances. Distributable cash flow also includes
some items that do not affect net cash provided by operating activities. Therefore, distributable cash flow may not be comparable to similarly titled measures
of other companies. Distributable cash flow is not the same measure as available cash or operating surplus, both of which are defined by the Partnership's
partnership agreement. The first table below reconciles distributable cash flow to Segment EBITDA, which is reconciled to net income, the most directly
comparable GAAP measure for Segment EBITDA, in this Appendix. Refer to this Appendix for the definition of Segment EBITDA. The second table below
reconciles distributable cash flow to net cash provided by operating activities, the most directly comparable GAAP measures for liquidity.

Distributable Cash Flow
38
Three months ended
March 31,
2015
June 30,
2015
September 30,
2015
December 31,
2015
March 31,
2016
June 30,
2016
September 30,
2016
December 31,
2016
March 31,
2017 (in thousands of U.S. dollars)
Segment EBITDA $ 15,187 15,233 16,139 25,699 24,128 24,294 24,893 25,846 $ 29,453
Cash collection/Principal payment on direct financing lease 703 722 739 755 772 789 806 824 843
Amortization in revenues for above market contracts — — — 605 598 598 604 605 895
Non-controlling interest: amortization of above market contract — — — — — — — —
(149)
Equity in earnings of JVs: Amortization of deferred revenue
— — — —
(322)
(509)
(508)
(528)
(574)
Interest income 2,427 2,425 2,423 293 273 232 192 162 141
Interest expense
(7,827)
(7,799)
(7,773)
(10,485)
(10,271)
(10,141)
(10,037)
(9,822)
(11,281)
Amortization of debt issuance cost and fair value of debt assumed 694 694 696 580 568 565 548 512 257
Other items, net
(1,100)
(934)
(1,276) 632
(1,037)
(962)
(778)
(554)
(820)
Unrealized foreign exchange losses (gains) 446 258 646
(1,245)
(51) 18 63
(141) 147
Current income tax expense
(177)
(179)
(185)
(806)
(108)
(30)
(86)
(99)
(691)
Non-controlling interest: finance and tax items
— — — — — — — — 1,176
Other adjustments:
Indemnification paid by Höegh LNG after quarter end for non-budgeted
expenses & losses 1,797 1,149 310 751 291 1,701 699 404 606
Estimated maintenance and replacement capital expenditures
(2,550)
(2,428)
(2,550)
(3,870)
(3,870)
(3,870)
(3,870)
(3,870)
(4,520)
Distributable cash flow $ 9,600 9,141 9,169 12,909 10,971 12,685 12,526 13,339 $ 15,485
Declared distribution 10,967 10,967 10,971 10,971 13,717 14,437
Coverage ratio 1.18x 1.0x 1.15x 1.14x 0.97x 1.07x

Reconciliation of Distributable Cash Flow to Net Cash Provided by
Operating Activities
39
Three months ended
June 30,
2015
September 30,
2015
December 31,
2015
March 31,
2016
June 30,
2016
September 30,
2016
December 31,
2016
March 31,
2017 (in thousands of U.S. dollars)
Distributable cash flow $ 9,141 9,169 12,909 10,971 12,685 12,526 13,339 $ 15,483
Indemnification paid by Höegh LNG after quarter end for non-budgeted
expenses & losses (1,149) (310) (751) (291) (1,701) (699) (404) (606)
Estimated maintenance and replacement capital expenditures 2,428 2,550 3,870 3,870 3,870 3,870 3,870 4,520
Non-controlling interest in EBITDA — — — — — — — 4,994
Non-controlling interest: amortization of above market contract — — — — — — — 149
Non-controlling interest: finance and tax items — — — — — — — (1,176)
Equity in earnings of JVs: Amortization of deferred revenue — — — 322 509 508 528 574
Equity in earnings of JVs: Amortization of debt issuance cost (46) (46) (45) (45) (45) (45) (45) (45)
Equity in earnings of JVs: Depreciation and amortization (2,309) (2,456) (2,285) (2,379) (2,376) (2,378) (2,395) (2,440)
Equity in earnings of JVs: Gain (loss) on derivative instruments 9,871 (2,109) 5,416 (8,993) (4,174) 4,139 16,120 2,496
Equity in losses (earnings) of joint ventures (11,481) 249 (8,012) 6,708 1,866 (6,565) (18,632) (4,809)
Cash collection/Principal payment on direct financing lease (722) (739) (755) (772) (789) (806) (824) (843)
Changes in accrued interest expense and interest income (235) (270) 1,913 (113) (411) 53 987 1,008
Other adjustments (114) 192 52 10 231 56 302 136
Changes in working capital (578) 5,144 372 2,655 (2,172) 3,854 (7,366) 136
Net cash provided by (used in) operating activities $ 4,806 11,374 12,684 11,943 7,493 14,513 5,479 $ 19,577


