45
Natural Disturbance as a Template for Ecosystem-based Management Species and Spaces FEESA July 13, 1997
| Date post: | 28-Mar-2016 |
| Category: |
Documents |
| Upload: | fri-research |
| View: | 227 times |
| Download: | 3 times |
Natural Disturbance
as a Template for
Ecosystem-based
Management
Species and Spaces
FEESA
July 13, 1997
2
Outline
Relevance of natural disturbance to
ecosystem-based management (“Why?”)
Landscape Patterns
Island Remnants / Meso - scale patterns
Stand Structure
Summary
3
Why interest in natural disturbance?
Management for all species individually is
impractical
All species respond to patterns created by
natural disturbance (directly or indirectly) Wildfires have occurred for thousands of years
Some management practices already
resemble some natural disturbances Forest harvesting & wildfire
Increased similarity between managed and
natural disturbances would better conserve
populations

4
Operating Within the
Range of Natural Variability
“The unmanaged forest... is subject to a variety
of natural processes and disturbance such as
succession, nutrient cycling, fire, flood,
blowdown, insect attack and disease.
These processes vary in duration, frequency of
occurrences, size of affected area and severity.
For each type of process, there will be a
particular range of variability.
Alberta Forest Conservation Strategy, draft July 8, 1996
5
Operating Within the
Range of Natural Variability...
The result is a mosaic of natural communities
representing the range of natural variability in
forest ecosystems.
Each of these communities plays an integral role
in maintaining the diversity and function of the
forest ecosystem.
An understanding of “natural variability” is
fundamental to the implementation of ecological
management.
Alberta Forest Conservation Strategy, draft July 8, 1996
6
Operating Within the
Range of Natural Variability...
Human activities are replacing natural
disturbances.
This trend has the potential to simplify the
diversity of the forest and, over the next several
decades, may push it beyond the historic range
of natural variability.
Ecological management proposes that we use
human activities to maintain that range of natural
variability.
Alberta Forest Conservation Strategy, draft July 8, 1996

7
Achieving Ecological Management
through Adaptive Management
“The key idea behind ecological
management is that we can substitute
planned, human activities for random and
naturally occurring biological processes
within the range of variability of those
processes.”
Requires the following 4 new
assumptions:
Alberta Forest Conservation Strategy, draft July 8, 1996

8
Assumption 1
Human activities can approximate natural
processes, at least to some degree.
From a forestry perspective, this may be
accomplished through: the use of cutblocks of different sizes and
shapes,
by variation in rotation age, and
by varying the percentage of removal within
harvested areas.
Alberta Forest Conservation Strategy, draft July 8, 1996
9
Assumption 2
“That our treatment of the forest will fall
within the range of natural variability with
respect to area, shape, age class and
severity of disturbance (within socially
acceptable limits). Natural processes will
still inevitably occur.”
Alberta Forest Conservation Strategy, draft July 8, 1996
10
Assumption 3
That human activities carried out in a
manner that bears some resemblance to
natural ecological events, will result in the
conservation of biodiversity, maintenance
of ecosystem structure and function, and
generate a sustainable flow of goods and
services provided by the forest.
Alberta Forest Conservation Strategy, draft July 8, 1996

11
Assumption 4
That by a process of “adaptive
management”, forest managers will be
able to determine what practices work
and to detect problems, and correct them,
before irreversible damage occurs to
either individual species or the ecosystem
as a whole.
Alberta Forest Conservation Strategy, draft July 8, 1996

Scale is important
100 km
10 km
0.001 km
Mosaic of many wildfires
Structure within a wildfire
Structure
within a
stand
13
Landscape Disturbance Regimes
Describe natural disturbance regime across the
Foothills Model Forest, including frequency, size, and
spatial arrangement of stand-replacing wildfires Weldwood FMA area
Other Provincial lands
Jasper National Park
Assist ecological basis for management planning Harvest scheduling in working forests
Weldwood’s Hinton FMA area
Fire management in protected areas
Jasper National Park, Willmore Wilderness Park
Goal is to conserve biological diversity by maintaining
future seral stage representation and spatial
arrangement within the range of natural variability

Natural Subregion
Alpine
Subalpine
Montane
Upper Foothills
Lower Foothills
0 10 20 30 40 50 Kilometers
Jasper
National Park
Foothills East
15
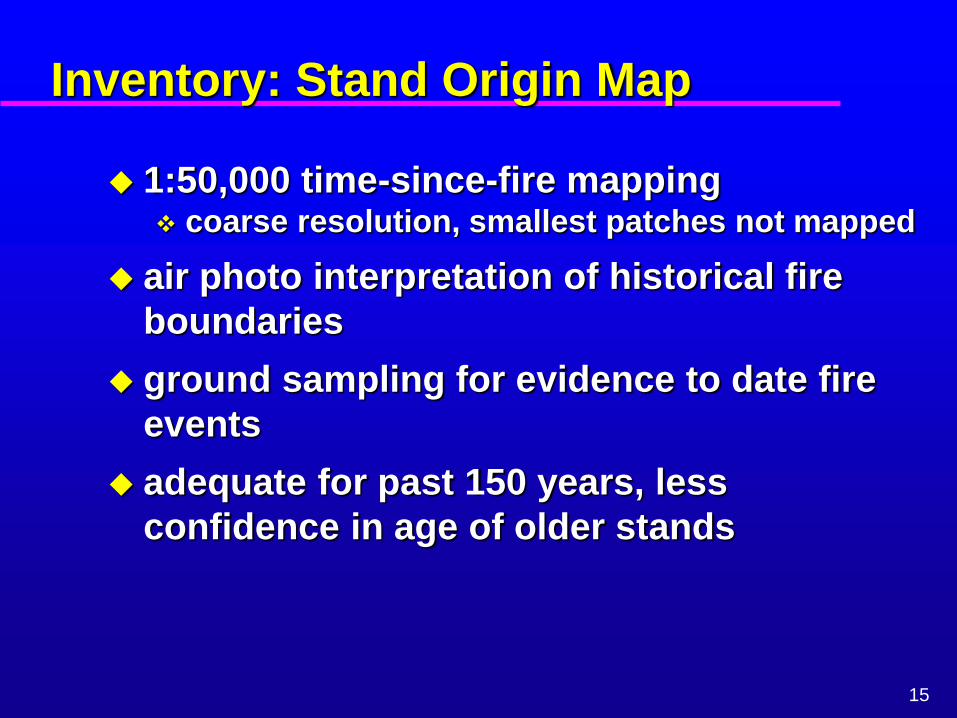
Inventory: Stand Origin Map
1:50,000 time-since-fire mapping coarse resolution, smallest patches not mapped
air photo interpretation of historical fire
boundaries
ground sampling for evidence to date fire
events
adequate for past 150 years, less
confidence in age of older stands

0 10 20 30 Kilometers
Age-class
<1800
1851 - 1900
1901 - 1950
1951 - 1996

17
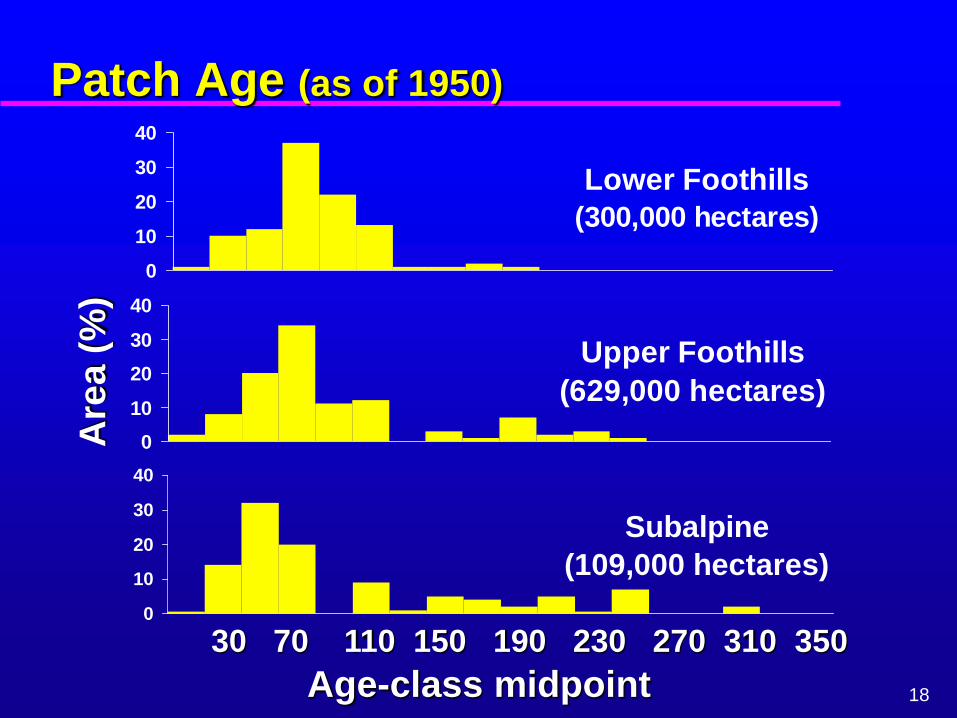
Analysis
Stratify by ecological units patch age
patch size
patch spatial arrangement
Relationships between stand origin and topography (slope, aspect)
watercourses
Understand process behind the observed
patterns
18 Age-class midpoint
Patch Age (as of 1950)
Lower Foothills
(300,000 hectares)
0
10
20
30
40
Upper Foothills
(629,000 hectares)
0
10
20
30
40
Subalpine
(109,000 hectares)
0
10
20
30
40
30 70 110 150 190 230 270 310 350
Are
a (
%)

Sizes of patches created by wildfire
10,000 hectares

20
Patch size
Lower Foothills
0
20
40
60
Upper Foothills
0
20
40
60
Subalpine
0
20
40
60
<40 40 80 200 600 2000 5000 >10,000
-80 -200 -600 -2000 -5000 -10,000
Patch size (ha)
Are
a (%
)
(20-yr classes)

21
Changes in area & patch size
Total Area
0
5
10
15
20
1950 1995
pe
rce
nt
of
are
a
Young forest Old forest
Mean Patch Size
0
200
400
600
800
1950 1995m
ean
patc
h a
rea (
ha)
Young forest Old forest
22
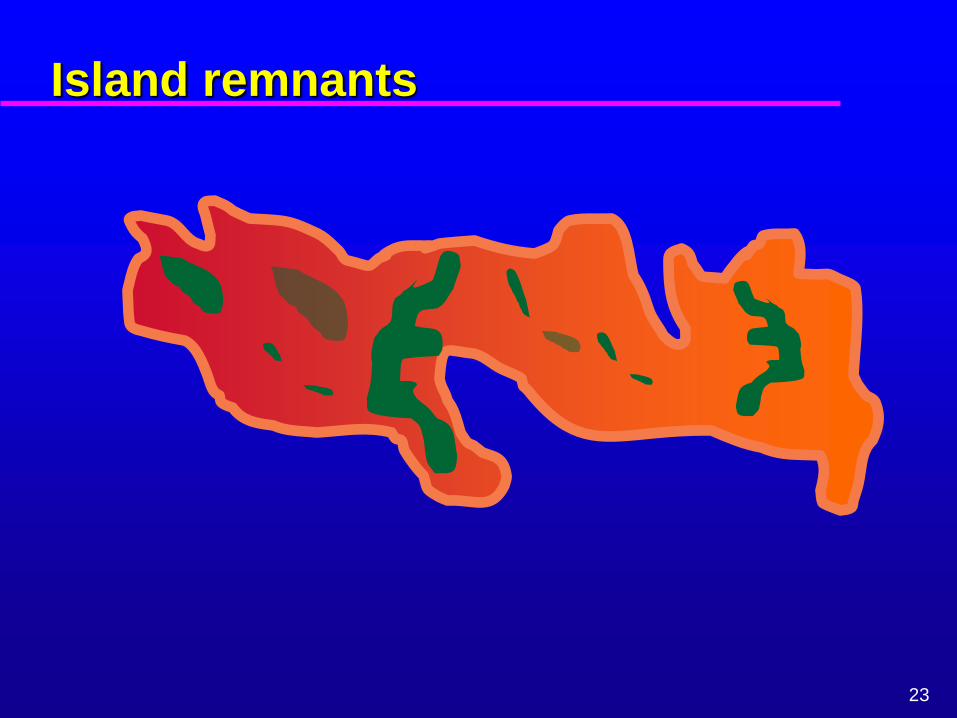
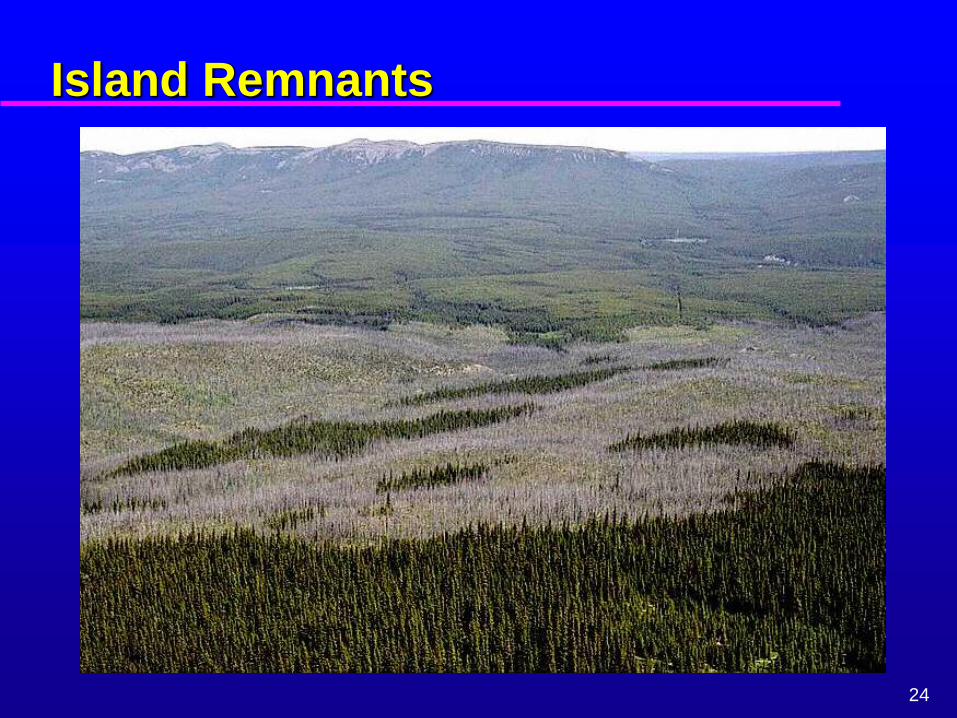
Island remnants
Wildfires create burned matrix in which
unburned residuals are embedded
These residuals are variable in size
These residuals are not arranged
randomly aspect, slope, watercourses
Post-burn structure in the burned matrix
is also variable, due to variable fire intensity
variable forest structure prior to wildfire
23
Island remnants
24
Island Remnants
25
Stand Structure
Estimate the range of variability in
deadwood structures of stands recently
disturbed by wildfire and by logging in the
Rocky Mountain Foothills of Alberta
Work in progress, results are preliminary
26
Deadwood in forest ecosystems
Disturbance can quickly generate large
inputs of deadwood wildfire, wind, insect outbreaks
Exists in 3 “pools” (Harmon et al. 1986): present before disturbance
created by disturbance
added after disturbance
Standing vs down “populations” of
deadwood
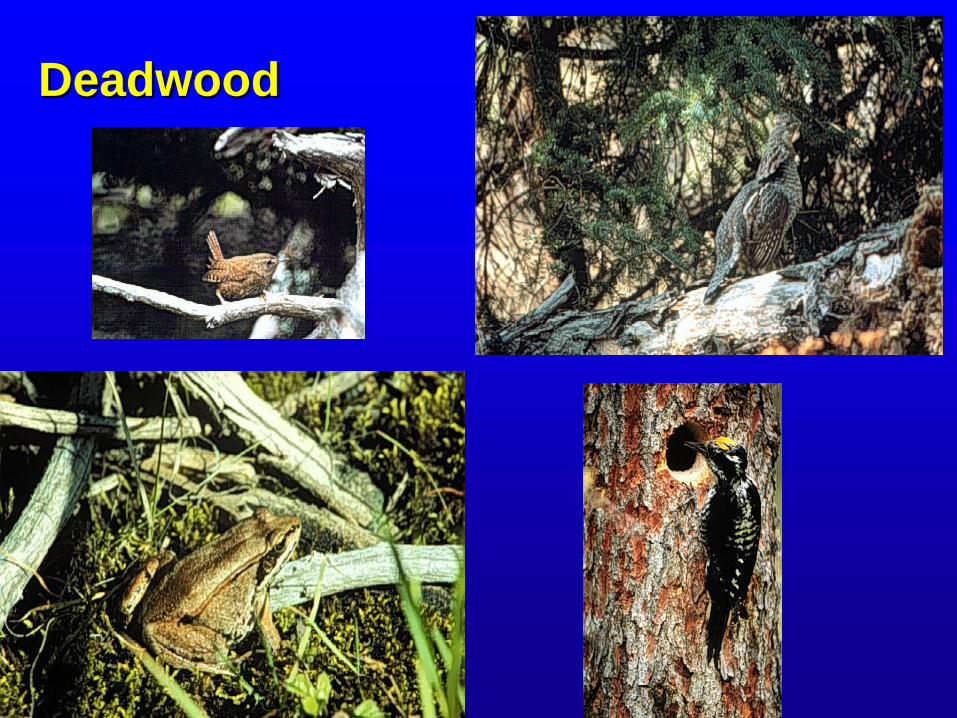
Deadwood
28
Deadwood in Rocky Mountain Foothills
Stand-replacing wildfire has been a dominant
process shaping the distribution and
structure of forest communities
Most of the landscape exists as patches
created by very large wildfires (over 100 km2)
Tree mortality following wildfire is variable,
but frequently very high
Tree boles usually remain, forming a
“cohort” of standing deadwood, which
eventually enters down deadwood
population
29
Deadwood and forest harvesting
500 km2 harvested in Alberta, 1994/95
Clearcutting is dominant harvest method
Historical trend increased utilization e.g., less than 5% merchantable wood
volume remaining
Recent trend decreased utilization (?)

30
What we don’t know
Range of variability in deadwood structures post-wildfire communities vs post-harvest
communities
Fate of the deadwood cohort after wildfire vertical arrangement (standing vs down)
colonization by lichen, fungi, plants
decay, assimilation into organic layer
Time to “convergence” after fire, logging Lee, Crites et al. (Boreal Mixedwood)

31
What we could do if we knew more
Identify extent to which the range of
“natural” variability in deadwood
structures is beyond the “managed” range
Have historical “catalogue” for
comparison with future managed forests
Design studies that assess the
effectiveness of management options
intended to expand the “managed” range
biodiversity
productivity

##
#
#
#
#
#
#
#
#
#
#
##
#
#
S
Alberta
Yukon
0 500 1000 1500 Kilometers

33
Study areas
1 Mountain wildfire 34 yr.
3 Foothills wildfires 35 - 40 yr.
3 Foothills harvests 23 - 27 yr.
34
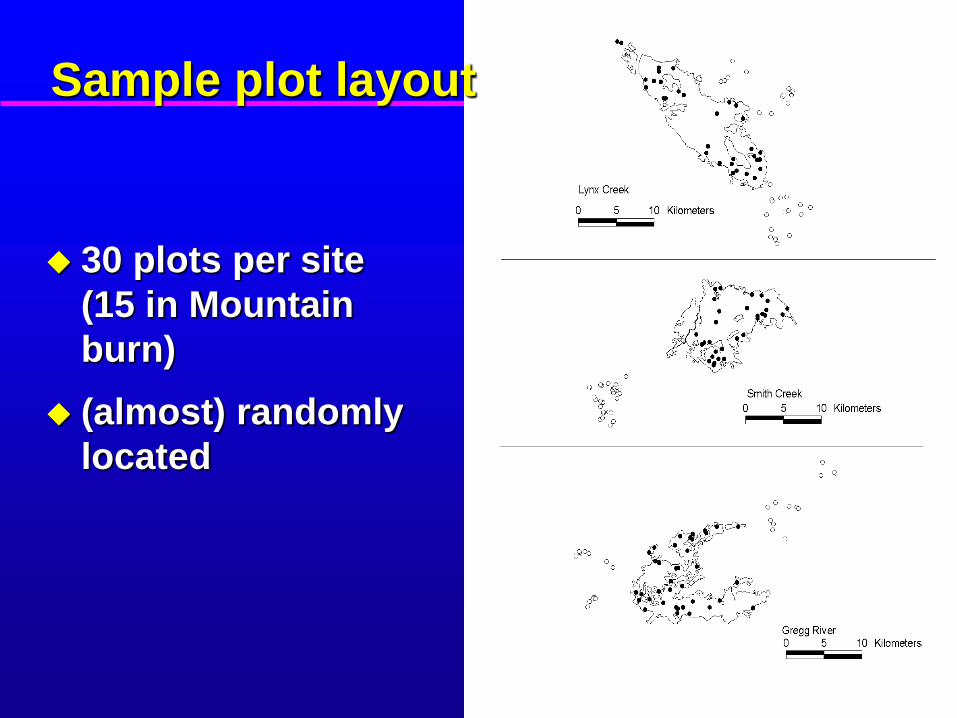
30 plots per site
(15 in Mountain
burn)
(almost) randomly
located
Sample plot layout
35
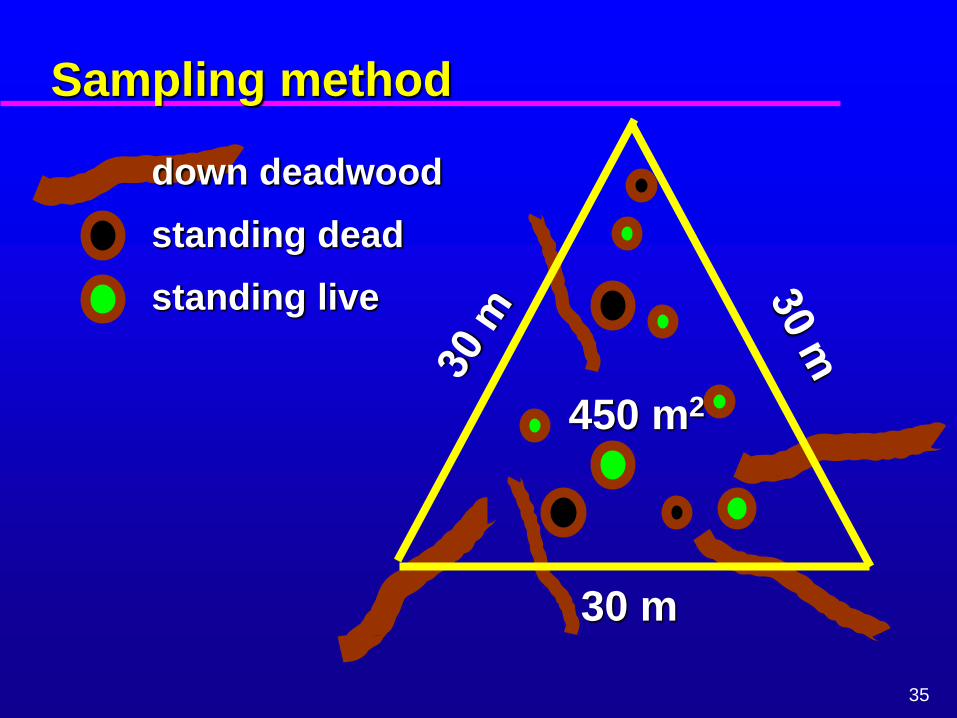
30 m
450 m2
Sampling method
down deadwood
standing dead
standing live
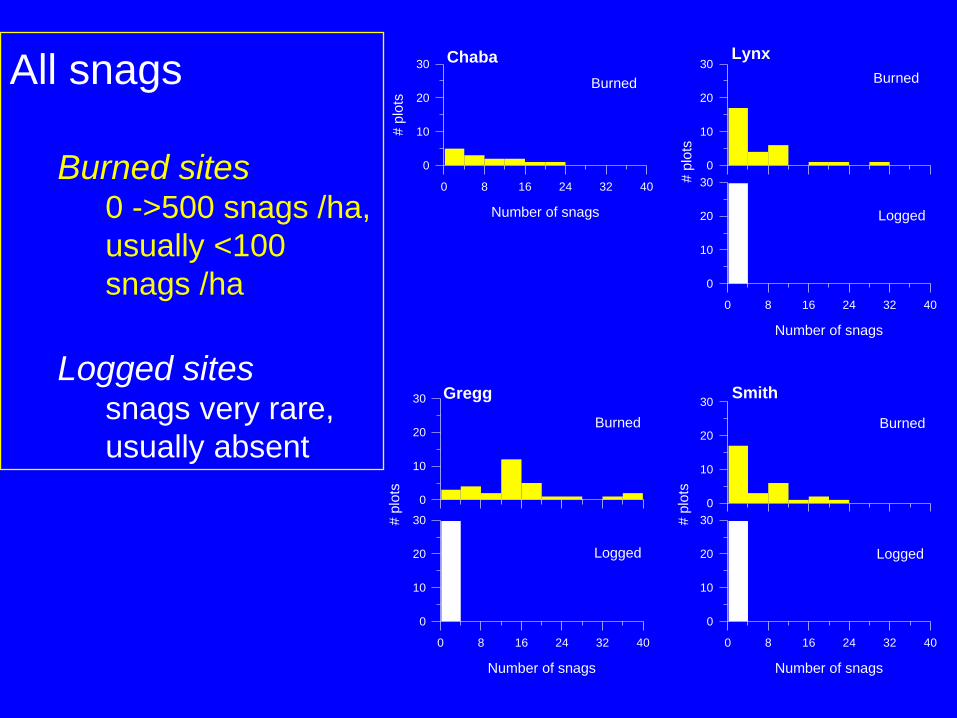
Chaba
Number of snags
0 8 16 24 32 40
# p
lots
0
10
20
30
Burned
0
10
20
30
Number of snags
0 8 16 24 32 40
# p
lots
0
10
20
30
0
10
20
30
Number of snags
0 8 16 24 32 40
# p
lots
0
10
20
30
0
10
20
30
Number of snags
0 8 16 24 32 40
# p
lots
0
10
20
30
Lynx
Gregg Smith
Logged
Burned Burned
Burned
Logged
Burned
Logged
All snags
Burned sites 0 ->500 snags /ha,
usually <100
snags /ha
Logged sites
snags very rare,
usually absent
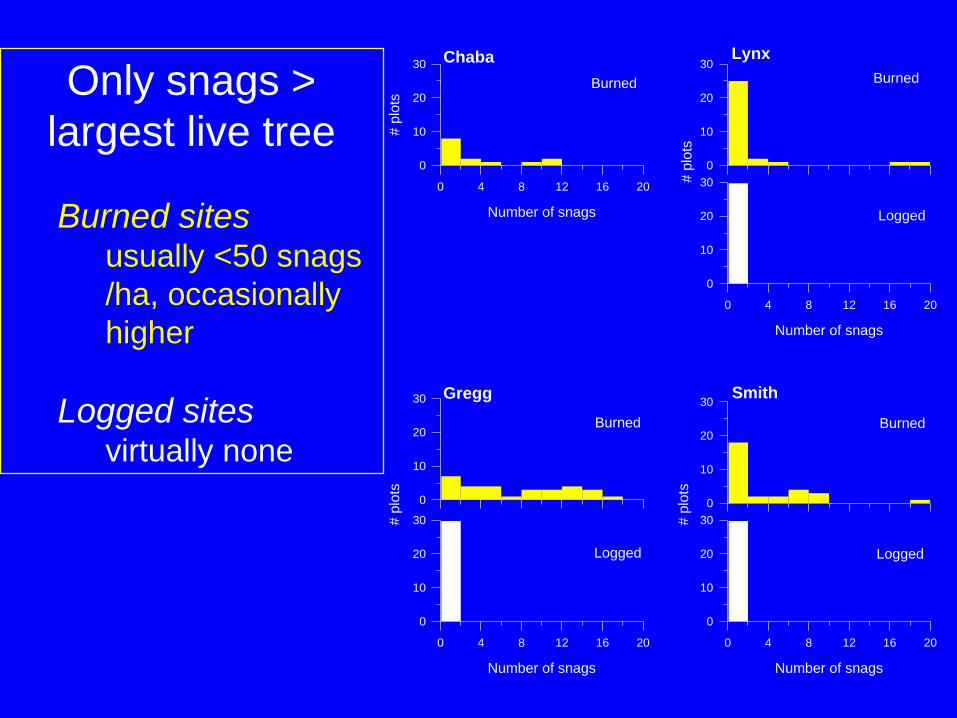
Chaba
Number of snags
0 4 8 12 16 20
# p
lots
0
10
20
30
Burned
0
10
20
30
Number of snags
0 4 8 12 16 20
# p
lots
0
10
20
30
0
10
20
30
Number of snags
0 4 8 12 16 20
# p
lots
0
10
20
30
0
10
20
30
Number of snags
0 4 8 12 16 20
# p
lots
0
10
20
30
Lynx
Gregg Smith
Logged
Burned Burned
Burned
Logged
Burned
Logged
Only snags >
largest live tree
Burned sites usually <50 snags
/ha, occasionally
higher
Logged sites virtually none

Gregg
0
10
20Burned
0
10
20
0 40 80 120
160
Number of pieces
# p
lots
Logged
0
10
20
0 40 80 120
160
Number of pieces
# p
lots
Logged
Chaba
0
10
20
# p
lots Burned
Lynx
0
10
20 Burned
Smith
0
10
20 Burned
0
10
20
# p
lots
Logged
0
10
200
10
20
0
10
20
0
10
20
0
10
20
0102001020
Number of pieces
of down deadwood
Burned sites highly variable
Logged sites less variable,
usually fewer

Chaba
0
5
10
15
# p
lots
Burned
Gregg
0
5
10
15 Burned
Lynx
0
5
10
15 Burned
Smith
0
5
10
15 Burned
0
5
10
15
0 4 8 12 16 20 24
Mean piece diameter (cm)
# p
lots
Logged
0
5
10
15
# p
lots
Logged
0
5
10
15
0 4 8 12 16 20 24
Mean piece diameter (cm)
# p
lots
Logged
Size of down
deadwood
> 7 cm diameter
Burned sites average 12 cm
diam.
Logged sites similar

Chaba
0
10
20
30
# p
lots
Burned
Gregg
0
10
20
30
Burned
Lynx
0
10
20
30Burned
Smith
0
10
20
30Burned
0
10
20
30
0 8 16 24 32 40 48
Mean piece height (cm)
# p
lots
Logged
0
10
20
30# p
lots
Logged
0
10
20
30
0 8 16 24 32 40 48
Mean piece height (cm)
# p
lots
Logged
Height of down
deadwood
Burned sites average up to 20
cm off ground
Logged sites usually on ground
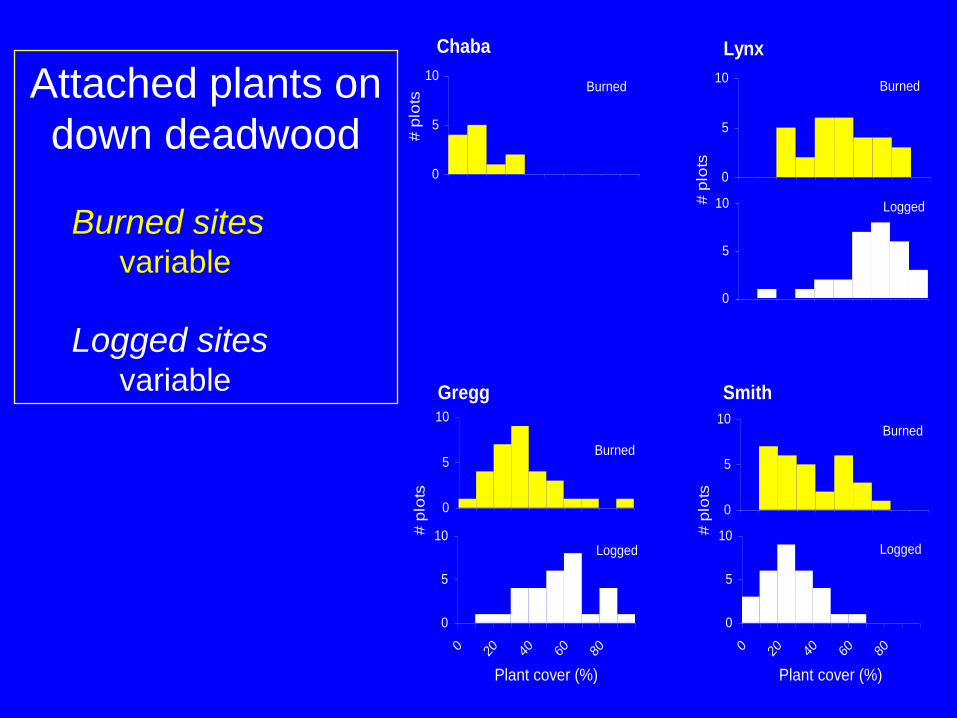
Chaba
0
5
10
# p
lots
Burned
Gregg
0
5
10
Burned
Lynx
0
5
10Burned
Smith
0
5
10Burned
0
5
10
0 20 40 60 80
Plant cover (%)
# p
lots
Logged
0
5
10# p
lots
Logged
0
5
10
0 20 40 60 80
Plant cover (%)
# p
lots
Logged
Attached plants on
down deadwood
Burned sites variable
Logged sites variable
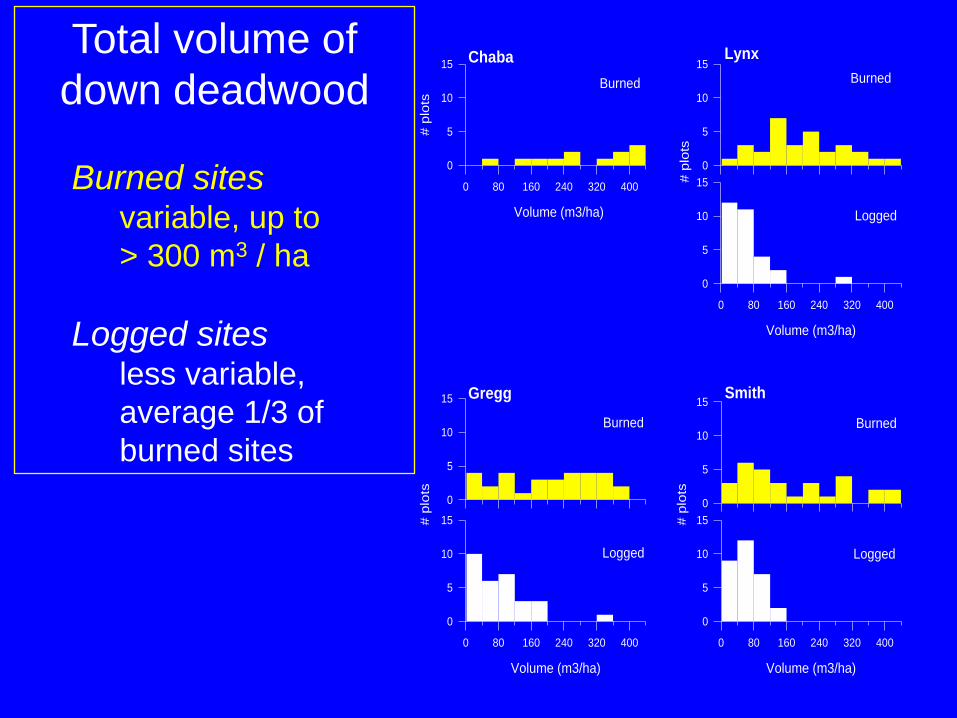
Chaba
Volume (m3/ha)
0 80 160 240 320 400
# p
lots
0
5
10
15
Burned
0
5
10
15
Volume (m3/ha)
0 80 160 240 320 400
# p
lots
0
5
10
15
0
5
10
15
Volume (m3/ha)
0 80 160 240 320 400
# p
lots
0
5
10
15
0
5
10
15
Volume (m3/ha)
0 80 160 240 320 400
# p
lots
0
5
10
15
Lynx
Gregg Smith
Logged
Burned Burned
Burned
Logged
Burned
Logged
Total volume of
down deadwood
Burned sites variable, up to
> 300 m3 / ha
Logged sites less variable,
average 1/3 of
burned sites

43
Summary
Natural disturbances are highly variable
and not well characterized
The range of variability created by natural
disturbances can be estimated at a range of
scales
Management options can be developed that
perpetuate at least part of the range of
variability caused by natural disturbances
Monitoring and research are needed to
estimate the effectiveness of alternative
management options

44
Natural Disturbance Program
Program Team Dan Farr, Foothills Model Forest
Don Harrison, Alberta Environmental Protection
Hugh Lougheed, Weldwood of Canada
Alan Westhaver, Jasper National Park
Project Collaborators Dave Andison, Bandaloop
Rick Bonar, Weldwood
George Mercer, Jasper NP
Luigi Morgantini, Weyerhaeuser
Marie-Pierre Rogeau, Banff
Chris Spytz, Weldwood