Page 1
Are householders moving on or sprucing up? A look at the trends in planning activity for households across the country
Home improvers of Great Britain 2016BROUGHT TO YOU BY…
BROUGHT TO YOU BY
To navigate just click on buttons below and they will take you directly to your chosen section.
Overview
Districts comparison
Region comparison
East of England
REGION FOCUS…
East Midlands
London
North East
North West
Scotland
South East
South West
Wales
Yorkshire & Humber
West Midlands
Outlook
Britain’s Home Improvers REPORT 2016
Hinderton Point, Lloyd Drive, Cheshire Oaks, Cheshire, CH65 9HQT: 0151 353 3500E: [email protected] : www.barbour-abi.com
@BarbourABI
Home
Page 2
Where are homeowners likely to dig deep into their
pockets to shell out on home improvement projects
and what might influence their decision? Well, we can
get some big indications from looking at the local
authorities that come top of the Barbour ABI Home
Improvers lists.
Barbour ABI captures data on all planning
applications made across Britain. Using this data
we can see where, in relation to the size of the
housing stock, most of the more substantial home
improvement takes place. Linking this to other
sources then gives us a better insight into what
factors make households in some places more likely
to invest in improving their home.
The first thing you will notice glimpsing the local
authorities topping the tables is that there is a higher
level of home improvement in areas where homes
tend to be more expensive.
It’s not just high house prices that drive home
improvement activity. While house prices in an area
will be a big factor, in each region and each borough
there will be differences in what prompts home
owners to improve their homes rather than move, or
buy and do up rather than buy a different home that
better fits their needs and aspirations.
Naturally, too, the health of the economy will play a
part in the confidence of those considering putting
their hands in their pockets to splash out on a major
investment in their home.
So, armed with the rankings of home improvers
nationally and regionally, plus an array of different
data, we’ve sought to establish some of the factors that
are likely to encourage home improvement activity.
The economyAll the data shows that home improvement activity
shifts with changes in the economy. If we follow
the dotted trend line in Fig. 1.1 for number of home
improvement applications, it is clear there is a strong
link. Applications dropped with the recession and
rose with the recovery, even taking a slight dip after
the economic recovery weakened in 2011 and 2012.
But recessions hit some people harder than others
and this can alter the pattern of home improvement
across the nation. For instance, closer examination of
the Barbour ABI data indicates that it slowed among
those with income more than those with wealth.
This meant those in employment were more likely to
hold back than those in or near retirement. So it was
the South West, a traditional retirement destination,
where the home improver market suffered less than
many other parts of Britain.
One indicator of how the economy influences home
improvement projects is to look at another big-ticket
expense for households, such as a car. And Fig. 1.2
shows how car sales and home improvement rise
and fall similarly. Economists will tell you that work
on home improvement tends to follow car sales
by about nine months. So it provides a neat early
warning indicator.
OVERVIEW…
What drives home improvement?
0
5,000
10,000
15,000
20,000
25,000
Priv
ate
hous
ing
RMI (
£m)
1997 1999 2001 2003 2005 2007 2009 2011 2013 20150
500
1,000
1,500
2,000
2,500
3,000
Thousands of new car registrations
60
70
80
90
100
110
120
130
Qua
rter
ly n
umbe
r of h
ome-
impr
over
app
licat
ions
Dec07
Dec08
Dec09
Dec10
Dec11
Dec12
Dec13
Dec14
Dec15
390
400
410
420
430
440
450
460
Quarterly GDP (£bn)
Applications quarterly moving average
FIG 1.2
Car sales and contracted-out housing repair, maintenance and improvementSource: ONS, SMMT
FIG 1.1
GDP and home improvement planning applicationsSource: Barbour ABI, ONS
Location is one of the big factors in the levels of home improvement
The health of the economy will play a part in the confidence of those considering home improvements
CONTINUED
BROUGHT TO YOU BY
To navigate just click on buttons below and they will take you directly to your chosen section.
Home
Districts comparison
Region comparison
East of England
REGION FOCUS…
East Midlands
London
North East
North West
Scotland
South East
South West
Wales
Yorkshire & Humber
West Midlands
Outlook
Britain’s Home Improvers REPORT 2016
Hinderton Point, Lloyd Drive, Cheshire Oaks, Cheshire, CH65 9HQT: 0151 353 3500E: [email protected] : www.barbour-abi.com
@BarbourABI
Overview
Page 3
House pricesIn Fig. 1.3 we plotted the average number of home
improvement applications for every 100 private
homes in each of Britain’s local authorities over three
years against the median house price. It seems pretty
conclusive that there is a strong link.
But look at the data regionally and the relationship
varies in strength from region to region. It is very strong
in Yorkshire & Humber and in the North East, but much
weaker in the South West, Wales and Scotland.
Why this is the case is not clear from the data. There
will be a number of factors at play. Certainly we
might reasonably speculate, at least for the South
West and Wales, that one reason for the weaker link
might be the high number of second homes. This
could moderate the relationship between home
improvement and house prices.
The key point, though, is that house prices in most
places have a significant bearing on how much larger
scale home improvement is undertaken.
TransactionsThe link between the number of sales of private
homes and the money spent on renovating homes
is generally accepted among economists who
track construction. Finding good data to back it
up isn’t that easy. But we can see when comparing
transactions with the official figures for work done by
contractors on private housing repair, maintenance
and improvement (Fig. 1.4) that the two follow a
similar path.
This isn’t proof of any causal link, but it supports the
idea that the more sales of homes the more home
improvement. And when we compare home sales
with home improvement planning applications
for local authorities across England and Wales
(see Fig. 1.5) it shows a tendency for more home
improvement activity in local authorities with
proportionately more home sales.
However, when we look more at the relationship
regionally we see fairly weak links. In some regions,
mainly in the north of England, we see only a modest
link in some regions between home sales and home
improvement applications. There are signs of a
moderate relationship in the northern regions of
England. But in London, the South East and South
West, there seems to be no discernible correlation.
And if we separately plot for Scotland there is again
no apparent link.
CONTINUED… What drives home improvement?
0 2 4 6 80
200
400
600
800
1,000
1,200
1,400
Med
ian
hous
e pr
ice
(£’0
00)
Home improvement applications per 100 private homes
10,000
12,000
14,000
16,000
18,000
20,000
22,000
Priv
ate
hous
ing
RMI (
£’00
0)
1997 1999 2001 2003 2005 2007 2009 2011 2013 20150
400
800
1,200
1,600
2,000
Thousands of transactions (England & Wales only) 0 1 2 3 4 5 6 7 8
2
3
4
5
6
7
Resid
entia
l tra
nsac
tions
per
100
priv
ate
hom
es
Home improvement applications per 100 private homes
FIG 1.4
Home sales and private housing repair, maintenance and improvementSource: ONS, HMRC
FIG 1.5
Home improvements and volume of house sales by local authority(England & Wales only). Source: Barbour ABI, HMRC, DCLG
FIG 1.3
Home improvements and house prices by local authoritySource: Barbour ABI, ONS, DCLG
One reason for the weaker link between house prices and home improvement, in the South West and Wales, might be the high number of second homes
CONTINUED
BROUGHT TO YOU BY
To navigate just click on buttons below and they will take you directly to your chosen section.
Home
Districts comparison
Region comparison
East of England
REGION FOCUS…
East Midlands
London
North East
North West
Scotland
South East
South West
Wales
Yorkshire & Humber
West Midlands
Outlook
Britain’s Home Improvers REPORT 2016
Hinderton Point, Lloyd Drive, Cheshire Oaks, Cheshire, CH65 9HQT: 0151 353 3500E: [email protected] : www.barbour-abi.com
@BarbourABI
Overview
Page 4
IncomeHome improvement tends to be expensive. So it’s no
surprise to find a strong relationship between average
earnings and the level of home improvement.
Over the past 10 years the top 20% of households
on the income scale have spent about 14 times the
amount on home improvements than the bottom
20%, according to the Office for National Statistics on
family spending (Fig. 1.6).
Fig. 1.7 plots the Barbour ABI home improvement
applications numbers for each local authority
against average income shows. It illustrates the
strong relationship.
This is no surprise as income will tend to determine
average house prices, so we’d expect to see similar
patterns. Interestingly though, finer regional analysis
shows a much weaker link in the South West, Scotland
and Wales. The link appeared stronger in the South
East and London. Interestingly, there was a similar
strong link between home improvement and income
in the North East as there was when comparing home
improvement activity and house prices.
PlanningDo people turn to home improvement more in areas
where planning for new homes is tougher to win?
Well, the data seems to suggest so. Using detailed
planning data we can measure the proportion of
applications rejected or withdrawn. This provides a
rough-and-ready measure of planning rigidity for each
local authority.
When we look at the national picture (Fig. 1.8) it
seems that there is a link between it being tougher
to get permission for new homes and more home
improvement. This doesn’t mean there’s a causal link.
It could well be that well-to-do people are both more
prone to improving their homes and also more averse
to new homes being built near them.
As with other factors, the impact of planning rigidity
seems to vary region to region. In London, Scotland,
the South West and North West, the correlation
between planning rigidity and home improvement
applications is negligible. The strongest relationship
seems to be in the North East, Yorkshire and Humber
and the West Midlands.
CONTINUED… What drives home improvement?
0 1 2 3 4 5 6 7 80
10
20
30
40
50
60
70
80
90
100
Mea
n in
com
e (£
’000
)
Home improvement applications per 100 private homes
FIG 1.7
Home improvements and average income by local authoritySource: Barbour ABI, ONS, DCLG
0 1 2 3 4 5 6 7 80
10
20
30
40
50
60
Plan
ning
rigi
dity
inde
x
Home improvement applications per 100 private homes
FIG 1.8
Housing improvements and planning rigidity by local authoritySource: Barbour ABI, DCLG
Data seems to suggest that people turn to home improvement when planning applications for new homes are difficult to get approved
There is a stronger link to income in the South East and London, compared to the South West, Scotland and Wales
54%
21.2%
12.6%
8.5%3.8%
FIG 1.6
Proportion of family spending on contracted-out home improvements by households, by incomeSource: ONS
Highest 20%
Second 20%
Third 20%
Fourth 20%
Lowest 20%
CONTINUED
BROUGHT TO YOU BY
To navigate just click on buttons below and they will take you directly to your chosen section.
Home
Districts comparison
Region comparison
East of England
REGION FOCUS…
East Midlands
London
North East
North West
Scotland
South East
South West
Wales
Yorkshire & Humber
West Midlands
Outlook
Britain’s Home Improvers REPORT 2016
Hinderton Point, Lloyd Drive, Cheshire Oaks, Cheshire, CH65 9HQT: 0151 353 3500E: [email protected] : www.barbour-abi.com
@BarbourABI
Overview
Page 5
Rural or urban?The most active locations for home improvement
are currently in London. But does an urban or
a rural setting influence the likelihood of the
owner submitting a home improvement planning
application?
We tested this nationally and regionally. If we look
nationally the urban-rural split doesn’t seem to make
much difference. But if we look within regions, we
see a different pattern emerging. Obviously leaving
out London, for many regions it seems rural areas are
far more likely to be hot spots of home improvement
activity than more urban locations.
Age profileCan you look at the age profile of an area and judge
whether it’s prime for home improvement work? The
answer is not that straightforward, but there are clues.
The Office for National Statistics produce family
expenditure figures that show how much different
households spend on home improvement. Fig. 1.9,
unsurprisingly, shows that it is the 65-74 age category
that have the highest average weekly spend on
home improvement.
Coming out of the recession those aged between
50 and retirement have spent more heavily on
home improvement. And we’ve seen an increase in
spending of those in retirement. This could of course
be in part down to the aging profile of home owners.
Nationally there’s little evidence that age profile
of a local authority makes a huge difference to the
level of home improvement planning applications.
Adversely, in Scotland the South West and the West
Midlands those boroughs with higher proportions of
people between 50 and retirement appear to receive
proportionately greater levels of home improvement
planning applications.
KidsAre you more likely to see home improvement in areas
where there are more homes with kids? That’s a very
different question and oddly the answer seems to be
no. That is if we look at where planning applications
are made. Fig. 1.10 shows the average annual spend
over five years from 2010 to 2014.
Looking at the areas where home improvement
planning applications are most prevalent suggests,
if anything, that there’s more chance of home
improvement in an area where there are more homes
without children, especially in Scotland, the South
West and Yorkshire and Humber. Even when we adjust
for different types of location it seems that home
improvement is more prevalent where there are more
homes without children.
CONTINUED… What drives home improvement?
0 5 10 15 20 25 30
75 or over
65 to 74
50 to 64
30 to 49
Under 30
Average weekly spend (£)
2005 to 20092010 to 2014
FIG 1.9
Changing pattern of spending on contracted-out home improvement work by ageSource: ONS
0 500 1000 1500
Retired one person
Retired two adults
Non-retired one person
One adult with children
Two adults with children
Three+ adults with children
Non-retired two adults
Average annual spend (£)
FIG 1.10
Average annual spend (£) by household typeSource: ONS
With the exception of London, rural areas are more likely to be hot spots of
home improvement activity
Nationally there’s little evidence that age profile of a local authority makes a huge difference to the level of home improvement planning applications
BROUGHT TO YOU BY
To navigate just click on buttons below and they will take you directly to your chosen section.
Home
Districts comparison
Region comparison
East of England
REGION FOCUS…
East Midlands
London
North East
North West
Scotland
South East
South West
Wales
Yorkshire & Humber
West Midlands
Outlook
Britain’s Home Improvers REPORT 2016
Hinderton Point, Lloyd Drive, Cheshire Oaks, Cheshire, CH65 9HQT: 0151 353 3500E: [email protected] : www.barbour-abi.com
@BarbourABI
Overview
Page 6
London and the southern regions of Britain continue
to dominate the Barbour ABI national home
improvement league, but the pattern is changing as
investment in refurbishing homes spreads from prime
central London to outer London boroughs, into the
wealthier commuter towns and further afield.
Kensington & Chelsea and Westminster still sat atop
the 2015 table of local authorities when it came to the
number of home improvement planning applications
received for every 100 private homes in the borough.
Despite a slight decrease in 2015, for every 100
homes in Kensington & Chelsea there were 7.3 home
improvement applications, more than three times the
national average and twice the average for London.
In total, almost 5,000 planning applications for home
improvements were submitted to the borough last
year, double the number in 2010.
But even for those outside London there’s plenty to
smile about. Across Britain as a whole there was a
steady rise in the number of applications for home
improvement in 2015 and the signs are for further
increases in the coming year.
Fig. 2.1 shows the monthly level of home
improvement applications in Britain and the path is
clearly up as the recession recedes.
Barbour ABI’s home-improver analysis supports
findings a year ago that the rising tide of home-
improvement planning applications is spreading
rapidly from central London.
This year’s biggest riser was Cambridge, which last
year was 69th in the Barbour ABI home-improver
capital of Britain table last year, leaping to 7th.
Demand for homes in the city has risen sharply and
with limited supply there was a 14.4% rise in prices in
2015, according to Hometrack’s 20-City Index. That
was a bigger rise than in any other major UK city,
including London. This appears to be a major factor in
leading homeowners and buyers in the city to turn to
home improvement.
The local authorities in London, the South East and
East of England continue to dominate the Top 25 in
this year’s national table.
The picturesque retirement locations of Devon, such
as South Hams that through the recession acted
as a beacon for home-improving affluent greys, no
longer feature in the Top 25, as spending on home
improvement seems to be shifting from equity-rich
downsizers to high earners. The only South West
district to feature in the top 50 is Cotswold, which now
sits top in the region’s home-improvers table. And you
have to look down the list to number 74 before you
see Harrogate, the highest ranked northern borough.
Ironically, perhaps, many of the areas where housing
may need most investment are those where home
improvement is least prevalent. It is the poorer more
urban areas of Blackpool and Stoke that prop up the
bottom of the table in close company with plenty
of Scottish districts. The chances of a planning
application being submitted for a private house in
Kensington & Chelsea is almost 18 times more than in
Blackpool or Stoke.
It is not just the increase in planning applications
that says home improvement is on the up. The
latest Office for National Statistics Family Spending
survey suggests that the average annual spend by
households on altering and improving their homes
was about £1,080 in 2014 up from about £920 in 2013.
This means that the nation spent, on the basis of
these figures, about £33 billion in 2014 on housing
alterations and improvements.
That said, the spread spending on home improvements
and alterations is far from even. The average spend in
London is about three and a half times that spent by the
average household in the North East.
DISTRICT OVERVIEW…
Which districts top the national table?
0
5,000
10,000
15,000
20,000
25,000
30,000
35,000
40,000
45,000
Mon
thly
hom
e-im
prov
er a
pplic
atio
ns
Dec07
Dec08
Dec09
Dec10
Dec11
Dec12
Dec13
Dec14
Dec15
Applications 12 month moving average
FIG 2.1
Monthly home-improver planning applications and 12 month moving averageSource: Barbour ABI
CLICK TO VIEWTop & bottom 25 districts
TOP25
The chances of a planning application being submitted for a private house in Kensington & Chelsea is almost 18
times more than in Blackpool or Stoke
In 2014, the nation spent about £33 billion on housing alterations and improvements, with London, the South East and East of England dominating
INCREASES
Yearly moving average
The 12 month moving average shows that the path is clearly up as the
recession recedes
BROUGHT TO YOU BY
To navigate just click on buttons below and they will take you directly to your chosen section.
Home
Overview
Region comparison
East of England
REGION FOCUS…
East Midlands
London
North East
North West
Scotland
South East
South West
Wales
Yorkshire & Humber
West Midlands
Outlook
Britain’s Home Improvers REPORT 2016
Hinderton Point, Lloyd Drive, Cheshire Oaks, Cheshire, CH65 9HQT: 0151 353 3500E: [email protected] : www.barbour-abi.com
@BarbourABI
Districts comparison
Page 7
Districts for home improvementNumber of home improvement applications for every 100 private homes.
Districts for home improvementNumber of home improvement applications for every 100 private homes.
Rank District Region 2013 2014 2015 Growth (%)*
25 Wirral NW 0.7 0.8 0.8 7
24 Nuneaton and Bedworth WM 0.7 0.7 0.8 15
23 Wolverhampton WM 0.6 0.6 0.8 28
22 Knowsley NW 0.7 0.9 0.8 -2
21 Halton NW 0.6 0.9 0.8 1
20 Tameside NW 0.8 0.9 0.8 -6
19 Burnley NW 0.5 0.6 0.8 37
18 Rossendale NW 0.8 0.6 0.7 13
17 West Lothian SC 0.7 0.8 0.7 -5
16 Rotherham YH 0.8 0.7 0.7 -3
15 Kingston upon Hull YH 0.5 0.6 0.7 29
14 Renfrewshire SC 0.6 0.6 0.7 15
13 Inverclyde SC 0.7 0.7 0.7 -4
12 Barnsley YH 0.7 0.7 0.7 -2
11 Wigan NW 0.7 0.7 0.7 5
10 Falkirk SC 0.7 0.8 0.7 -6
9 Hyndburn NW 0.9 0.8 0.7 -16
8 North Lanarkshire SC 0.7 0.6 0.7 6
7 Dundee SC 0.6 0.6 0.6 3
6 North Ayrshire SC 0.7 0.7 0.6 -11
5 Glasgow SC 0.6 0.6 0.6 3
4 Redditch WM 0.4 0.3 0.5 41
3 West Dunbartonshire SC 0.6 0.6 0.5 -18
2 Stoke on Trent WM 0.5 0.6 0.5 -18
★ Blackpool NW 0.4 0.4 0.4 -1
*2015 compared with average of 2013 and 2014 Source: Barbour ABI, ONS
Rank District Region 2013 2014 2015 Growth (%)*
★ Kensington and Chelsea LN 7.3 7.5 7.3 -1
2 Westminster LN 6.6 6.8 6.2 -7
3 Uttlesford EE 5.4 5.8 6.1 9
4 Hammersmith and Fulham LN 5.7 6.3 6.1 1
5 South Bucks SE 5.2 5.6 6.0 10
6 Richmond upon Thames LN 4.9 5.7 5.9 11
7 Cambridge EE 2.5 2.8 5.8 119
8 Elmbridge SE 4.7 5.5 5.7 11
9 Sevenoaks SE 5.1 5.6 5.6 4
10 St Albans EE 4.8 4.7 5.2 11
11 South Northamptonshire EM 3.1 4.3 5.1 39
12 Chichester SE 4.6 4.5 5.1 12
13 Guildford SE 3.5 4.6 5.0 22
14 Harrow LN 3.2 4.0 4.9 36
15 Chiltern SE 4.2 4.2 4.7 11
16 Barnet LN 3.5 4.2 4.7 21
17 Hounslow LN 3.4 4.1 4.5 22
18 East Hampshire SE 4.0 3.6 4.5 17
19 Tunbridge Wells SE 4.6 4.0 4.5 4
20 Oxford SE 3.9 4.3 4.4 8
21 Kingston upon Thames LN 3.2 3.8 4.4 25
22 Brent LN 3.1 4.0 4.3 23
23 Hertsmere EE 3.5 3.8 4.3 17
24 Redbridge LN 3.0 3.9 4.3 27
25 Lambeth LN 3.4 4.3 4.3 11
*2015 compared with average of 2013 and 2014 Source: Barbour ABI, ONS
BOTTOM
25TOP25
BROUGHT TO YOU BY
To navigate just click on buttons below and they will take you directly to your chosen section.
Home
Overview
Region comparison
East of England
REGION FOCUS…
East Midlands
London
North East
North West
Scotland
South East
South West
Wales
Yorkshire & Humber
West Midlands
Outlook
Britain’s Home Improvers REPORT 2016
Hinderton Point, Lloyd Drive, Cheshire Oaks, Cheshire, CH65 9HQT: 0151 353 3500E: [email protected] : www.barbour-abi.com
@BarbourABI
Districts comparison
Page 8
It’s hard to compare home improvement activity regionally
within Britain without immediately turning to London as the
benchmark. It dominates the home improver market and
continues to stretch its lead in 2015.
This is not surprising. It has huge demand for housing,
with a limited stock of new homes, high and fast rising
house prices and a large proportion of the richest people
in Britain.
What’s more interesting about London right now is just
how fast the home improvement boom in central London
is expanding to the outer boroughs. However the scorching
hot home improver district of Kensington & Chelsea and
Westminster still remain singularly hot.
The growth, though, is now coming from the outer
boroughs such as Harrow, which saw a leap of a third in
home improver planning applications in 2015 compared to
the average over the previous two years.
Scotland aside, the spread is occurring throughout Britain.
Unsurprisingly the East of England is seeing a surge, up 14%.
But so is Wales, which has seen a rise of more than 12%
comparing 2015 levels with the previous two years.
REGION OVERVIEW…
How do the regions and countries of Britain compare?
Rank Region/Country 2013 2014 2015 Growth (%)*
★ London 3.0 3.5 3.8 16
2 South East 2.4 2.6 2.7 10
3 East of England 2.1 2.2 2.5 14
4 South West 1.9 2.0 2.0 7
5 East Midlands 1.3 1.4 1.5 12
6 Yorkshire & Humber 1.3 1.3 1.4 8
7 West Midlands 1.2 1.2 1.4 11
8 North West 1.1 1.2 1.2 8
9 Wales 1.0 1.1 1.2 12
10 North East 1.0 1.1 1.1 5
11 Scotland 1.1 1.1 1.1 -2
England 1.6 1.6 1.9 17
Great Britain 1.8 1.8 1.9 5
*2015 compared with average of 2013 and 2014 Source: Barbour ABI, ONS
Home improvement across Britain’s regions and countriesNumber of home improvement applications for every 100 private homes.
16
GROWTH INLondon outer boroughs
The London borough of Harrow saw a leap of a third in
applications in 2015
STRENGTH NEARLondon
Home improvement is growing stronger in the regions nearest
to London
Not surprisingly, London dominates the home improver market and continues
to stretch its lead in 2015
BROUGHT TO YOU BY
To navigate just click on buttons below and they will take you directly to your chosen section.
Home
Overview
Districts comparison
East of England
REGION FOCUS…
East Midlands
London
North East
North West
Scotland
South East
South West
Wales
Yorkshire & Humber
West Midlands
Outlook
Britain’s Home Improvers REPORT 2016
Hinderton Point, Lloyd Drive, Cheshire Oaks, Cheshire, CH65 9HQT: 0151 353 3500E: [email protected] : www.barbour-abi.com
@BarbourABI
Region comparison
Page 9
Uttlesford, the north Essex local authority that takes in
Saffron Walden, Stansted, Thaxted and Great Dunmow,
continues to hold the top spot in the Barbour ABI Home
Improvement league table for the East of England. But the
big story this year is how Cambridge shot into second place.
Cambridge leapt from well outside the national top 50
for home improvement in 2014 to 7th in 2015, as planning
applications more than doubled. Undoubtedly a big prompt
pushing homeowners to invest in home improvement was
the rapid rise in demand for houses seen in and around
Cambridge over the past few years. Last year prices
rocketed 14.4%, putting Cambridge top of the Hometrack
20-City Composite Index and knocking London into
second place.
While Cambridge provided icing on the cake for local
builders, the region continues to provide rich pickings.
There was a 14% jump in 2015 in home improvement
planning applications in the East of England compared with
the average over the previous two years. Outside London
this was the biggest increase.
There were more than 53,000 applications made in
the region, which comes in at about 2.5 for every 100
privately-owned homes, ranking the region third after
London and the South East.
The Office for National Statistics Family Spending survey
suggests that households in the East of England on average
spent across 2013 and 2014 almost £1,300 a year altering
and improving their homes. That totals to about £3.2 billion
spent in the region.
Research using Barbour ABI data shows that homeowners’
incomes is a big driver of home improvement in the region. It
also suggests that where planning for new homes is hard to
come by there’s greater appetite among owners to alter or
improve their homes.
Another clue to finding budding home improvers in the
region is to look more to rural than urban areas, as on
balance there are more planning applications made for
every 100 homes in rural areas than in the bigger towns
and cities.
FOCUS ON…
East of England
East of England districts for home improvementNumber of home improvement applications for every 100 private homes.
Rank District 2013 2014 2015 Growth (%)*
★ Uttlesford 5.4 5.8 6.1 9
2 Cambridge 2.5 2.8 5.8 119
3 St Albans 4.8 4.7 5.2 11
4 Hertsmere 3.5 3.8 4.3 17
5 Three Rivers 3.5 3.9 4.2 12
6 Brentwood 3.3 3.5 3.9 16
7 Epping Forest 3.2 3.6 3.9 14
8 Welwyn Hatfield 3.4 3.7 3.5 -1
9 Watford 2.1 3.2 3.5 31
10 North Hertfordshire 2.7 3.1 3.4 18
*2015 compared with average of 2013 and 2014 Source: Barbour ABI, ONS
119made in the region for
home improvement
MORE THAN
APPLICATIONS
IS ON THE UP
53,000
Cambridge
leaping from well outside the national top 50 districts
for home improvement in 2014 to 7th in 2015
TOP10
Households in the region on average spent across 2013 and 2014 almost £1,300 a year altering and improving their homes
BROUGHT TO YOU BY
To navigate just click on buttons below and they will take you directly to your chosen section.
Home
Overview
Districts comparison
Region comparison
REGION FOCUS…
East Midlands
London
North East
North West
Scotland
South East
South West
Wales
Yorkshire & Humber
West Midlands
Outlook
Britain’s Home Improvers REPORT 2016
Hinderton Point, Lloyd Drive, Cheshire Oaks, Cheshire, CH65 9HQT: 0151 353 3500E: [email protected] : www.barbour-abi.com
@BarbourABI
East of England
Page 10
South Northamptonshire, centred on Towcester, held its
place at the top of the East Midlands home improvement
league, as planning applications in the borough soared for a
second year in 2015.
For every 100 homeowners in the borough more than five
put in a planning application for home improvement in 2015.
In 2013 it was just over three.
The fact that South Northamptonshire borough tops the
league should be no surprise, given its healthy stock of
wealthy executive types and flourishing families. For the
past two years income has increasingly become the driver of
home improvements, rather than the equity of more elderly
homeowners and downsizers as it was during the recession.
Over the past two years home improvement activity has
steadily increased, with the more affluent districts boosting
the overall numbers of planning applications in the region to
almost 26,000, more than a 12% rise in 2015 compared with
the average over the previous two years.
Despite increasing numbers of planning applications, with
an average of 1.5 made for every 100 private homes, the East
Midlands remains below the average across Britain of 2.0.
Looking at what drives home improvement in the East
Midlands, the evidence from Barbour ABI research seems
to point to three main factors in the region – income is
the biggest home improvement driver, secondly areas
where the proportion of homeowners are over 50 are likely
to see more applications and finally we are seeing more
applications in rural locations than in the larger urban areas.
Certainly this pattern is clear from the boroughs at the top
of the pile in the region. And it helps explain why boroughs
such as Mansfield, Derby and Corby take the bottom three
places in the regional table.
Looking at the amount spent by homeowners in the
region, the Office for National Statistics Family Spending
survey suggests they spent an average of about £2.1 billion
annually on home improvements over 2013 and 2014. This
averages out at almost £1,100 a year per household on
altering and improving their homes. That’s about on a par
with the national average.
FOCUS ON…
East Midlands
Rank District 2013 2014 2015 Growth (%)*
★ South Northamptonshire 3.1 4.3 5.1 39
2 Rutland 3.4 3.9 3.6 -1
3 Harborough 2.5 2.6 2.9 16
4 Rushcliffe 2.3 2.5 2.6 8
5 East Northamptonshire 1.9 2.2 2.3 9
6 Daventry 1.9 2.0 2.0 4
7 Melton 1.8 2.0 2.0 5
8 North East Derbyshire 1.6 1.6 1.9 17
9 South Kesteven 1.8 1.8 1.9 5
10 Charnwood 1.6 1.8 1.7 2
*2015 compared with average of 2013 and 2014 Source: Barbour ABI, ONS
East Midlands districts for home improvementNumber of home improvement applications for every 100 private homes.
39
TOP10
We see more applications in rural locations than in the larger urban
areas in the region
MORE THAN
DOMINANTION IN
RISE IN 201512%
rural locations
applications made for home improvement compared
with the previous two years
Households in the region on average spent across 2013 and 2014 almost £1,100 a year altering and improving their homes
BROUGHT TO YOU BY
To navigate just click on buttons below and they will take you directly to your chosen section.
Home
Overview
Districts comparison
Region comparison
East of England
REGION FOCUS…
London
North East
North West
Scotland
South East
South West
Wales
Yorkshire & Humber
West Midlands
Outlook
Britain’s Home Improvers REPORT 2016
Hinderton Point, Lloyd Drive, Cheshire Oaks, Cheshire, CH65 9HQT: 0151 353 3500E: [email protected] : www.barbour-abi.com
@BarbourABI
East Midlands
Page 11
London continued to dominate the Barbour ABI rankings
for home improvement planning applications in 2015
with another jump in numbers over the year. That rise was
despite a slight slowdown in the top London boroughs of
Kensington & Chelsea and Westminster.
There are clear signs that the massive home improvement
bug that bit the capital is spreading. Homeowners in
London were on average in 2015 almost twice as likely to put
in an application to improve their home as those in the rest
of Britain.
There were almost 100,000 applications submitted
to London planning authorities last year for home
improvements, a rise of more than 50% since 2012.
Kensington & Chelsea once again topped the league table
both for London and Britain, with more than seven in every
100 homeowners in the borough submitting an application
to improve their home.
The driver behind this upward trend in home improvement
in London is not surprising. With land values booming, the
economics of spending on enhancing and expanding an
existing home can be compelling. Add in the fact that there
is no shortage of people with sufficient wealth, income or
both to invest.
With prices having risen strongly across all London, the
boom in home improvement has spread from central
London boroughs outward. The fastest growth is now in the
outer boroughs. This year we saw Lambeth fall out of the top
10 and Redbridge sneak a place.
Generally speaking in London, as across most of the
country, we find high proportions of home improvement
planning applications where average earnings are highest.
It is not surprising to see Barking and Dagenham, where
average incomes are relatively low, propping up the table
for the capital. But the hunger for housing in London is
great and buyers are looking further afield to buy. The
opportunity to buy-and-do-up in previously less desirable
areas appears to be increasingly attractive. So we should
expect to see the outward spread of rising house prices
prompting increasing home improvement activity in the
outer boroughs.
The Office for National Statistics Family Spending survey
suggests that the total spend by households annually on
home improvements averaged £6.2 billion over 2013 and
2014. This means an annual average spend of about £1,900
a year per household, if we include those renting, on altering
and improving their homes.
FOCUS ON…
London
Rank District 2013 2014 2015 Growth (%)*
★ Kensington and Chelsea 7.3 7.5 7.3 -1
2 Westminster 6.6 6.8 6.2 -7
3 Hammersmith and Fulham 5.7 6.3 6.1 1
4 Richmond upon Thames 4.9 5.7 5.9 11
5 Harrow 3.2 4.0 4.9 36
6 Barnet 3.5 4.2 4.7 21
7 Hounslow 3.4 4.1 4.5 22
8 Kingston upon Thames 3.2 3.8 4.4 25
9 Brent 3.1 4.0 4.3 23
10 Redbridge 3.0 3.9 4.3 27
*2015 compared with average of 2013 and 2014 Source: Barbour ABI, ONS
London districts for home improvementNumber of home improvement applications for every 100 private homes.
36
TOP10
submitted to London planning authorities last year for home improvements. Up 50% since 2012
ALMOST
APPLICATIONS100,000
INCREASE
Outer boroughs
London’s boom in home improvement has spread
from the central to the outer boroughs
Households in the region on average spent across 2013 and 2014 almost £1,900 a year altering and improving their homes
BROUGHT TO YOU BY
To navigate just click on buttons below and they will take you directly to your chosen section.
Home
Overview
Districts comparison
Region comparison
East of England
REGION FOCUS…
East Midlands
North East
North West
Scotland
South East
South West
Wales
Yorkshire & Humber
West Midlands
Outlook
Britain’s Home Improvers REPORT 2016
Hinderton Point, Lloyd Drive, Cheshire Oaks, Cheshire, CH65 9HQT: 0151 353 3500E: [email protected] : www.barbour-abi.com
@BarbourABI
London
Page 12
The district of Northumberland once again tops the list of
boroughs in the Barbour ABI home improvement league for
the North East.
In 2015 the North East region saw 5% growth in the number
of planning applications made for home improvement
compared with the average over the previous two years.
This growth was less than across Britain as a whole putting
the region yet further behind the national average when
it comes to the likelihood of homeowners submitting a
planning application for home improvement.
The average number of planning applications for home
improvements in 2015 across Britain was two for every 100
private homes. The top of the improvers table in the North
East, Northumberland, came in at 1.5, while Sunderland was
at the bottom of the regional table saw roughly half that.
There is a strong link across Britain between the level of
home improvements, average earnings and rising house
prices. So the pattern we see in the North East should be
expected, with average earnings in the North East well
below the national average.
Within the region this pattern broadly holds.
Northumberland and Newcastle, which top the table, both
are at the top end for average earnings in the region and are
among the districts with the highest average house prices.
Interestingly, Durham, which does have a high number of
affluent residents, saw the fastest growth in the number of
home improvement planning applications in 2015 for the
North East.
One further factor having an influence in the region is that
where planning for homes is tougher, as measured using
Barbour ABI data, there is likely to be more applications for
home improvements.
The level of overall spending on home improvements in the
region is still running well below the amount spent in the
years immediately before the recession. Households on
average in the North East spent about £550 million on home
improvements annually across 2013 and 2014, according to
the Office of National Statistics Family Spending survey.
FOCUS ON…
North East
Rank District 2013 2014 2015 Growth (%)*
★ Northumberland 1.4 1.5 1.5 5
2 Newcastle upon Tyne 1.3 1.3 1.3 3
3 North Tyneside 1.1 1.2 1.3 18
4 South Tyneside 1.1 1.1 1.2 7
5 Stockton-on-Tees 1.2 1.1 1.1 -4
6 Darlington 1.1 1.1 1.0 -7
7 Durham 0.7 0.9 1.0 28
8 Hartlepool 0.9 1.1 1.0 -1
9 Middlesbrough 0.9 1.0 0.9 -1
10 Redcar and Cleveland 1.0 0.9 0.9 -5
*2015 compared with average of 2013 and 2014 Source: Barbour ABI, ONS
North East districts for home improvementNumber of home improvement applications for every 100 private homes.
28
TOP10
for where home improvement happens in the North East
NATIONAL AVERAGE
IS A BIG FACTOR
Further behind
Average earnings
Despite a rise in home improvement planning applications the
North East fell further behind the national average in 2015
Households in the region on average spent across 2013 and 2014 almost £550 a year altering and improving their homes
BROUGHT TO YOU BY
To navigate just click on buttons below and they will take you directly to your chosen section.
Home
Overview
Districts comparison
Region comparison
East of England
REGION FOCUS…
East Midlands
London
North West
Scotland
South East
South West
Wales
Yorkshire & Humber
West Midlands
Outlook
Britain’s Home Improvers REPORT 2016
Hinderton Point, Lloyd Drive, Cheshire Oaks, Cheshire, CH65 9HQT: 0151 353 3500E: [email protected] : www.barbour-abi.com
@BarbourABI
North East
Page 13
The Trafford district of Greater Manchester held its place as
the home improvement capital of the North West for 2015
having seen a surge in planning applications over the past
two years, according to the latest Barbour ABI analysis.
The boroughs in the region where homeowners
proportionately submit more planning applications for
home improvement do tend to be those where average
incomes are higher, although this relationship is perhaps
less strong in the North West than in the rest of Britain.
What is particularly interesting this year is how far the
emphasis for home improvements has shifted away from
the rural idylls, boroughs such as Ribble Valley and Eden,
which dominated the listings in previous years.
The pretty retirement homes and second-home hotspots
still rank high in the home improvement tables, but the
greatest growth appears to be in the old industrial towns of
the North West. While they may not feature in the region’s
top 10, the boroughs that have seen the fastest growth in
applications for home improvement over the past year are
Preston, Burnley and Salford.
At the bottom of the list of districts for home improvements
we once again find Blackpool. Here we also find the lowest
average earnings in the region. There may be much talk of
seaside towns being spruced up in the south of England, but
across most of the country coastal boroughs seem to be
nearer the bottom than the top of the home improvement
list of hotspots. In Blackpool last year there was just one
application made for home improvements for every 250
private homes. That was the lowest rate in Britain.
The North West in 2015 saw an average number of home
improvement applications received for every 100 private
homes of a shade above 1.2, well below the average of 2.0
across Britain. The total for the region was almost 32,000
in 2015.
The average spend per household is lower than the national
average too. The Office for National Statistics Family
Spending survey suggests that the average household in
2013 and 2014, including renters, spent about £850 annually
on home improvements against a UK average of more than
£1,100. That makes the market for home improvements in
the North West worth about £2.6 billion.
FOCUS ON…
North West
Rank District 2013 2014 2015 Growth (%)*
★ Trafford 2.0 2.0 2.1 8
2 Cheshire West and Chester 1.7 1.9 1.9 9
3 Ribble Valley 2.2 1.8 1.9 -4
4 Eden 1.7 1.8 1.9 6
5 Cheshire East 1.8 1.8 1.8 -2
6 West Lancashire 1.8 1.9 1.7 -4
7 Warrington 1.3 1.4 1.7 25
8 Stockport 1.4 1.5 1.7 17
9 Lancaster 1.3 1.4 1.6 22
10 Chorley 1.4 1.5 1.6 9
*2015 compared with average of 2013 and 2014 Source: Barbour ABI, ONS
North West districts for home improvementNumber of home improvement applications for every 100 private homes.
25
TOP10
made in the region for home improvement
ALMOST
APPLICATIONS
GROWTH IN
32,000
industrial townsThe greatest growth appears to have shifted
to the old industrial towns
Households in the region on average spent across 2013 and 2014 almost £850 a year altering and improving their homes
BROUGHT TO YOU BY
To navigate just click on buttons below and they will take you directly to your chosen section.
Home
Overview
Districts comparison
Region comparison
East of England
REGION FOCUS…
East Midlands
London
North East
Scotland
South East
South West
Wales
Yorkshire & Humber
West Midlands
Outlook
Britain’s Home Improvers REPORT 2016
Hinderton Point, Lloyd Drive, Cheshire Oaks, Cheshire, CH65 9HQT: 0151 353 3500E: [email protected] : www.barbour-abi.com
@BarbourABI
North West
Page 14
East Lothian topped the Scottish Barbour ABI home
improvement capital league table for 2015.
Overall, at just over one application submitted for each
100 private homes in the nation, Scotland now lies below
Wales and every English region and was the only part of
Britain that saw the number of home improvement planning
applications fall in 2015.
The Scottish home improvement market does appear to be
flagging relative to the rest of Britain. Planning applications
have fallen over the years in Scotland from more than 23,000
in 2011 to below 22,000 in 2015.
Dumfries & Galloway last year topped the table, but this year
it fell out completely. Its temporary rise to the top of the
table was down to a surge in planning applications for home
improvement in 2013 and 2014, how much of this may have
been connected to the flooding is hard to know.
Generally speaking a strong guide to where home
improvements are most likely is where average earnings
are high. In Scotland that relationship is weaker than across
Britain as a whole. However wealth is an indicator in Argyll
& Bute, which occupies the second to top slot in the table,
as it has a higher proportion of affluent greys and this is true
within other districts in the top 10.
Interestingly, across much of Britain home improvement
activity tends to be more prevalent in less urban areas.
This is very true of Scotland. So Glasgow and West
Dunbartonshire being at the bottom of the home
improvement table in Scotland should not be a surprise.
The overall spending on home improvements in Scotland
is running at about half the amount spent in the years
immediately before the recession. Households spent about
£650 annually across 2013 and 2014, according to the
Office of National Statistics Family Spending survey. The
means the total annual spend across the nation on home
improvements comes in at £1.5 billion.
On a happy note, for those looking to promote home
improvement in Scotland the data suggests that where
people are happier in the nation you are more likely to find
home improvers. That doesn’t necessarily mean improving
your home makes you happy.
FOCUS ON…
Scotland
Rank District 2013 2014 2015 Growth (%)*
★ East Lothian 2.0 1.8 2.0 1
2 Argyll and Bute 2.1 2.1 1.9 -8
3 East Renfrewshire 1.5 1.6 1.7 7
4 Aberdeenshire 2.0 1.7 1.7 -10
5 Midlothian 1.3 1.4 1.5 14
6 Scottish Borders 1.3 1.3 1.5 14
7 Edinburgh 1.3 1.4 1.5 8
8 East Dunbartonshire 1.4 1.3 1.4 6
9 Highland 1.5 1.4 1.4 -4
10 Perth and Kinross 1.5 1.4 1.4 -7
*2015 compared with average of 2013 and 2014 Source: Barbour ABI, ONS
Scotland districts for home improvementNumber of home improvement applications for every 100 private homes.
14
14
TOP10
Home improvement is more prevalent in less urban areas
in Scotland
IN APPLICATIONS
STRONGER IN
Decrease
Less urban areas
Applications for home improvement have fallen over the years in
Scotland from more than 23,000 in 2011 to below 22,000 in 2015
Scottish households on average spent across 2013 and 2014 almost £650 a year altering and improving their homes
BROUGHT TO YOU BY
To navigate just click on buttons below and they will take you directly to your chosen section.
Home
Overview
Districts comparison
Region comparison
East of England
REGION FOCUS…
East Midlands
London
North East
North West
South East
South West
Wales
Yorkshire & Humber
West Midlands
Outlook
Britain’s Home Improvers REPORT 2016
Hinderton Point, Lloyd Drive, Cheshire Oaks, Cheshire, CH65 9HQT: 0151 353 3500E: [email protected] : www.barbour-abi.com
@BarbourABI
Scotland
Page 15
Affluent Home Counties commuter towns still command
the heights in the latest in the South East regional table
of Barbour ABI’s home improvement capital of Britain,
with South Bucks topping the list ahead of Elmbridge
and Sevenoaks.
Key factors that promote planning applications for home
improvement tend to be earnings, wealth and rural
and semi-rural settings. These are in abundance in the
Home Counties, so it is not surprising that the South East
boroughs have a very strong showing in the national home
improver league.
The balance between wealth and earnings as a driver of
home improvement activity has shifted slightly over the past
few years with more emphasis appearing to be on earnings
than wealth, which became a major factor in the trough of
the recession.
It was the equity-rich downsizer moving to pleasant
retirement or semi-retirement that came to the forefront in
the recession, spending heavily to improve and add comfort
to the often newly-purchased home in their rural idyll. But
with rising house prices making home improvement a more
attractive investment and with more certainty over real
earnings growth playing its part, higher-earning families are
increasingly looking to invest in their existing homes.
So we see a very strong relationship between where plans
are submitted for home improvements and the average
earnings for the district, especially in the South East. So
it’s no surprise that the affluent boroughs of South Bucks,
Sevenoaks and Elmbridge feature high in the regional list.
Meanwhile, at the bottom of the list of boroughs in the
South East for home improvement come Portsmouth,
Southampton and Gosport, districts with some of
the lowest average annual earnings. Here these local
authorities, along with Thanet, received about one
application for home improvement for every 100 private
homes, compared with South Bucks which receives six.
Measured on the number of applications for home
improvements made per 100 private homes, the South
East at 2.7 comes well above the 2.0 average for Britain, and
second only to London. Across the region there were more
than 88,000 applications in 2015.
The Office for National Statistics Family Spending survey
suggests that households across the region spent about
£4.4 billion on home improvements annually across 2013
and 2014. This means the average household, including
renters, spends about £1,200 a year per household on
altering and improving their home.
FOCUS ON…
South East
Rank District 2013 2014 2015 Growth (%)*
★ South Bucks 5.2 5.6 6.0 10
2 Elmbridge 4.7 5.5 5.7 11
3 Sevenoaks 5.1 5.6 5.6 4
4 Chichester 4.6 4.5 5.1 12
5 Guildford 3.5 4.6 5.0 22
6 Chiltern 4.2 4.2 4.7 11
7 East Hampshire 4.0 3.6 4.5 17
8 Tunbridge Wells 4.6 4.0 4.5 4
9 Oxford 3.9 4.3 4.4 8
10 Windsor and Maidenhead 4.0 4.3 4.2 1
*2015 compared with average of 2013 and 2014 Source: Barbour ABI, ONS
South East districts for home improvementNumber of home improvement applications for every 100 private homes.
22
TOP10
made in the region for home improvement
MORE THAN
APPLICATIONS88,000
The relationship between average
earnings and home improvement applications is
particularly strong in the South East
ARE KEY
Average earnings
Households in the region on average spent across 2013 and 2014 almost £1,200 a year altering and improving their homes
BROUGHT TO YOU BY
To navigate just click on buttons below and they will take you directly to your chosen section.
Home
Overview
Districts comparison
Region comparison
East of England
REGION FOCUS…
East Midlands
London
North East
North West
Scotland
South West
Wales
Yorkshire & Humber
West Midlands
Outlook
Britain’s Home Improvers REPORT 2016
Hinderton Point, Lloyd Drive, Cheshire Oaks, Cheshire, CH65 9HQT: 0151 353 3500E: [email protected] : www.barbour-abi.com
@BarbourABI
South East
Page 16
Cotswold District has taken the title of home improvement
capital of the South West, knocking the long-time
holder South Hams into second place in the Barbour ABI
league tables.
The Cotswolds ticks most of the boxes you’d expect for an
area where home improvement is rampant. Average earnings
are high, wealthy folk are moving in, it is picturesque and
suitably rural and house prices are on the rise.
For all that in the national table the district of Cotswold
doesn’t rank among the top 10% of local authorities when it
comes to the private homeowners submitting planning for
home improvements.
That said the South West is a big region for home
improvement. The Office for National Statistics Family
Spending survey suggests that households across the region
spent about £3.6 billion on home improvements annually
across 2013 and 2014. And looking at the Barbour ABI and
Family Spending data together suggests the cost of home
improvement projects in the region are well above average.
In the region the average household spends almost £1,600
a year on altering and improving their homes and that
includes those who rent. That’s more on average than
households in any other region outside of London.
But as was becoming evident last year from the Barbour
ABI figures, the starring role of the region in the home
improvement market may have reached its zenith.
Compared with the other southern regions there was
relatively subdued growth in planning applications
submitted for home improvements. That said, the region still
saw 43,000 applications for home improvements in 2015.
While builders suffered across the nation through more
recessionary times, equity-rich downsizers moving
to the South West spent heavily on improving their
newly-purchased homes. This provided much sustenance
for local builders. But as the economy has turned up
it is in regions where average incomes are higher that
we have seen the greatest uplift in home improvement
planning applications.
The South West home improvement market is buoy by the
migration of equity-rich downsizers spending heavily on
improving their homes and by investment in second and
holiday homes. This makes the home improvement market
more recession-proof than most other regions.
FOCUS ON…
South West
Rank District 2013 2014 2015 Growth (%)*
★ Cotswold 2.8 2.8 3.8 32
2 South Hams 3.1 3.6 3.4 2
3 North Dorset 3.0 3.1 3.3 10
4 Stroud 3.0 3.2 3.1 0
5 Bath and NE Somerset 2.6 2.7 3.0 12
6 West Dorset 2.1 3.0 2.8 10
7 Tewkesbury 2.1 2.3 2.6 19
8 Cornwall 2.4 2.6 2.5 1
9 Mendip 2.5 2.5 2.5 1
10 Cheltenham 2.3 2.5 2.5 5
*2015 compared with average of 2013 and 2014 Source: Barbour ABI, ONS
South West districts for home improvementNumber of home improvement applications for every 100 private homes.
32
TOP10
made in the region for home improvement
MORE THAN
APPLICATIONS43,000
STRENGTHENED BYequity-rich downsizers
The South West home improvement market is buoy by the migration of equity-rich downsizers
Households in the region on average spent across 2013 and 2014 almost £1,600 a year altering and improving their homes, the highest outside London
BROUGHT TO YOU BY
To navigate just click on buttons below and they will take you directly to your chosen section.
Home
Overview
Districts comparison
Region comparison
East of England
REGION FOCUS…
East Midlands
London
North East
North West
Scotland
South East
Wales
Yorkshire & Humber
West Midlands
Outlook
Britain’s Home Improvers REPORT 2016
Hinderton Point, Lloyd Drive, Cheshire Oaks, Cheshire, CH65 9HQT: 0151 353 3500E: [email protected] : www.barbour-abi.com
@BarbourABI
South West
Page 17
A recent strong surge in planning applications over the past
two years has brought Monmouthshire to the top of the
Barbour ABI home improvement league in Wales.
But even though Monmouthshire tops the list of Welsh
local authorities, homeowners in the district still lag behind
the British average when it comes to submitting planning
applications for home improvement. In Monmouthshire the
average number of applications for home improvements per
100 private homes in 2015 stood at 1.8, lower than the 2.0%
average across Britain.
It must, however, be borne in mind that Wales has different
planning rules that can influence home improvement,
so direct comparisons with English regions are not
straightforward.
While most of the districts at the top of the table tend to be
populated with more affluent households, such as Vale of
Glamorgan, Cardiff and Monmouthshire, the relationship
between income and home improvement is much weaker
in Wales than in many other parts of Britain. However,
the link between house prices and the level of home
improvements does seem to be stronger, which makes
sense as an improvement will add greater value to a more
expensive home.
Across Wales there was a solid rise in applications in
2015 of about 12% when compared with the average
over the previous two years. This raised the number of
applications to 14,000.
There is also a hint in the data that where gaining planning
permission for new homes, the proportion of home
improvement applications is greater.
One Welsh district well worth keeping an eye on is
Ceredigion. With the University town of Aberystwyth its
beating heart and a high proportion of affluent greys in the
population, it appears to be stealthily moving up the Welsh
home improver league.
The Office for National Statistics Family Spending survey
suggests that households across Wales spent an average
of about £1.1 billion on home improvements a year over
2013 and 2014. So the average Welsh household, when you
include renters as well as homeowners, spends about £840
a year on altering and improving their homes, which is about
two thirds the UK average.
FOCUS ON…
Wales
Rank District 2013 2014 2015 Growth (%)*
★ Monmouthshire 1.0 1.5 1.8 40
2 Vale of Glamorgan 1.3 1.5 1.6 12
3 Cardiff 1.3 1.5 1.5 10
4 Anglesey 1.4 1.6 1.4 -4
5 Ceredigion 1.1 0.9 1.4 44
6 Denbighshire 1.3 1.4 1.4 4
7 Flintshire 1.0 1.3 1.4 20
8 Swansea 1.1 1.1 1.3 18
9 Newport 1.1 1.1 1.2 13
10 Powys 1.2 1.2 1.2 5
*2015 compared with average of 2013 and 2014 Source: Barbour ABI, ONS
Wales districts for home improvementNumber of home improvement applications for every 100 private homes.
44
TOP10
made for home improvement in Wales
MORE THAN
APPLICATIONS14,000
IS WEAKERLink to income
The link between income and home improvement is much weaker in Wales
than in many other parts of Britain
Households on average spent across 2013 and 2014 almost £840 a year altering and improving their homes
BROUGHT TO YOU BY
To navigate just click on buttons below and they will take you directly to your chosen section.
Home
Overview
Districts comparison
Region comparison
East of England
REGION FOCUS…
East Midlands
London
North East
North West
Scotland
South East
South West
Yorkshire & Humber
West Midlands
Outlook
Britain’s Home Improvers REPORT 2016
Hinderton Point, Lloyd Drive, Cheshire Oaks, Cheshire, CH65 9HQT: 0151 353 3500E: [email protected] : www.barbour-abi.com
@BarbourABI
Wales
Page 18
Stratford-upon-Avon not only topped the Barbour ABI home
improvements league in the West Midlands yet again in
2015, but it also saw more than a 40% jump in the number of
planning applications for home alterations.
This should be no surprise. In today’s housing market,
major investment in home improvement tends to be
more prevalent among the wealthy, the high earners, the
well-to-do older homeowners and in places of beauty and
in less urban settings. Homes in such districts tend to be
well above average and if planning is tight for new homes or
the desirable stock is limited, that adds to the incentive to
upgrade existing homes.
In the West Midlands, Stratford-upon-Avon scores high on
all these counts. Warwick, second in the table, also ticks
the boxes.
Naturally the hot spots of home improvement activity will
shift over time. In more recessionary times the big spending
on renovating homes seemed to be weighted towards
those with wealth, particularly older well-to-do downsizing
householders. But, as the recession eased, it is the higher
earners that have come to the fore.
We see this in the West Midlands. Stratford-upon-Avon has
attracted plenty of wealthy downsizers keen to invest equity
they’ve released into improving their new home. But the
borough also boasts the highest average earnings in the
region, so little wonder it has seen a further boost in home
improvement planning applications.
However, Solihull, a more urban and less picturesque
district, can boast plenty of high earners. In line with the
national trend this appears to have prompted a rapid rise in
investment in home improvement.
There’s one more quirky link worth noting in the West
Midlands. Where the population of a borough scores high for
life satisfaction in the Office for National Statistics wellbeing
statistics there’s a good chance you’ll find more home
improvement activity.
West Midlands saw 11% growth in 2015 in the number of
applications submitted, with submissions rising to 26,000
for the region.
Add all the factors together and it becomes pretty clear why
districts like Wolverhampton, Redditch, and Stoke occupy
the lower end of the table.
In cash terms the Office for National Statistics Family
Spending survey suggests that households across the
region spent about £1.5 billion on home improvements
annually across 2013 and 2014. This averages at about
£640 a year per household, if you include renters and
homeowners, on altering and improving their homes. This is
about 40% below the UK average.
FOCUS ON…
West Midlands
Rank District 2013 2014 2015 Growth (%)*
★ Stratford-upon-Avon 2.8 2.8 4.1 43
2 Warwick 2.0 2.1 2.3 12
3 Solihull 1.6 1.3 2.3 59
4 Wychavon 1.8 1.8 2.2 19
5 Shropshire 2.0 2.0 2.0 3
6 North Warwickshire 1.5 1.7 1.8 12
7 Malvern Hills 2.0 1.7 1.7 -8
8 Herefordshire 1.6 1.4 1.6 9
9 Staffordshire Moorlands 1.0 1.4 1.6 31
10 Lichfield 1.3 1.4 1.6 15
*2015 compared with average of 2013 and 2014 Source: Barbour ABI, ONS
West Midlands districts for home improvementNumber of home improvement applications for every 100 private homes.
59
TOP10
made in the region for home improvement, a rise
of 11% in 2015
APPLICATIONS26,000
INCREASE43%
in applications made for home improvement in Stratford-upon-Avon
Households in the region on average spent across 2013 and 2014 almost £640 a year altering and improving their homes
BROUGHT TO YOU BY
To navigate just click on buttons below and they will take you directly to your chosen section.
Home
Overview
Districts comparison
Region comparison
East of England
REGION FOCUS…
East Midlands
London
North East
North West
Scotland
South East
South West
Wales
Yorkshire & Humber
Outlook
Britain’s Home Improvers REPORT 2016
Hinderton Point, Lloyd Drive, Cheshire Oaks, Cheshire, CH65 9HQT: 0151 353 3500E: [email protected] : www.barbour-abi.com
@BarbourABI
West Midlands
Page 19
Harrogate regained its place at the top of the Yorkshire
& Humber Barbour ABI home improvement league table
for 2015 having briefly in 2014 relinquished the crown to
Hambleton, its neighbouring North Yorkshire borough.
Harrogate’s planners received almost three applications
for every 100 private homes in Harrogate. This was twice
the average for the region and almost 50% above the
national average.
If you’re seeking a place in Yorkshire & Humber where
households are most likely to undertake improvements
there are some clear signs to look for. The first is high
house prices. There is a strong link at the moment between
the average price of a home and the propensity of local
homeowners to invest in improving their homes.
Interestingly, in those districts where home improvement
is popular the population tends to score relatively high on
the life satisfaction scores found in the Office for National
Statistics on wellbeing statistics.
But, as in other parts of Britain, change is in the air. Heavy
investment in the rural idyll by equity-rich downsizers and
high earners remains strong. Now, though, there’s a hint that
a more settled economic recovery, rising house prices and
greater job security are encouraging more of the younger
well-paid homeowners living in larger towns and cities to be
more confident about investing in improving their homes.
Over the past three years, planners in both York and Leeds
have seen higher levels of applications submitted for
home improvements.
Across the region home improvement planning applications
rose 8% in 2015 compared with the previous two years. This
raised the total to more than 27,000.
In cash terms builders and merchants have seen a strong
rise in the money spent on home improvement in the region.
The Office for National Statistics Family Spending survey
suggests that the average household in the region, including
owners and renters, spent £800 on home improvements
annually over 2013 and 2014. This puts the total annual
spend in the Yorkshire & Humber at £1.8 billion.
FOCUS ON…
Yorkshire & Humber
Rank District 2013 2014 2015 Growth (%)*
★ Harrogate 2.6 2.6 2.9 14
2 Hambleton 2.4 3.0 2.6 -6
3 Richmondshire 2.0 2.2 2.3 10
4 Craven 1.7 1.8 2.2 22
5 York 2.0 2.2 2.2 2
6 Ryedale 1.8 1.5 2.1 23
7 East Riding of Yorkshire 1.7 1.6 1.6 0
8 Bradford 1.4 1.4 1.6 13
9 Calderdale 1.4 1.4 1.6 15
10 Leeds 1.3 1.5 1.6 13
*2015 compared with average of 2013 and 2014 Source: Barbour ABI, ONS
Yorkshire & Humber districts for home improvementNumber of home improvement applications for every 100 private homes.
23
TOP10
STILL TOPHarrogate
Harrogate regained its place at the top of the Yorkshire & Humber Barbour ABI home improvement
league table for 2015
Heavy investment in the rural idyll by equity-rich downsizers and high earners remains strong
REMAIN ATTRACTIVERural locations
Households in the region on average spent across 2013 and 2014 almost £800 a year altering and improving their homes
BROUGHT TO YOU BY
To navigate just click on buttons below and they will take you directly to your chosen section.
Home
Overview
Districts comparison
Region comparison
East of England
REGION FOCUS…
East Midlands
London
North East
North West
Scotland
South East
South West
Wales
West Midlands
Outlook
Britain’s Home Improvers REPORT 2016
Hinderton Point, Lloyd Drive, Cheshire Oaks, Cheshire, CH65 9HQT: 0151 353 3500E: [email protected] : www.barbour-abi.com
@BarbourABI
Yorkshire & Humber
Page 20
Methodology & notesThe Barbour ABI Home Improver survey is based on the number of planning applications
for residential improvements received by each planning authority compared with the
estimate for the number of private homes within that authority.
The estimates of the housing stock are taken from DCLG, Welsh Government and Scottish
Government data sources.
From this a number is arrived at which represents however many home improvement
applications there are for each 100 private homes in a local authority.
Some local authorities are excluded – these being the Channel Islands, Isles of Scilly, Isle of
Man and London Legacy (the Olympic Park). All national parks are excluded except South
Downs, where the applications are assigned to the local authority within which they fall.
Also while calculations were done for all boroughs, omitted from the lists and rankings
are authorities where there are fewer than 10,000 private homes. These include City of
London, Orkney and Shetland.
Because the data tends to be erratic, to get a more sensible picture of growth in the latest
year we compare the figure with the average of the previous two years. This we believe
provides a better base.
The spending data used comes from the Office for National Statistics Family Spending
data. This fluctuates greatly so two year averages are generally used.
2011 Census data are used for population comparisons. House prices are taken from the
Office for National Statistics. Income data is the mean average taken from the Annual
Survey on Hours and Earnings.
Data for new car registration are taken from the trade body SMMT.
The planning rigidity data are taken from work undertaken by Barbour ABI and represent
the number of project rejected or withdrawn within a planning authority compared with
the number of applications for new residential schemes.
There may be apparent discrepancies with the historic figures published in previous years.
These are inevitable as data are revised.
Looking forward the prospects for home improvement
remains rosy.
The economy is on an upward path and the employment
opportunities are increasingly improving. With inflation
low we are still seeing real wage growth despite the rate of
nominal wages easing of late.
Certainly if we look to the continued rise in car sales, which
tends to be a lead indicator of home improvement we
should expect another bumper year in 2016.
Housing demand remains strong relative to housing
supply, suggesting the underlying pressure on house
prices will remain strongly upward. And as we have seen
in previous years, high house prices help to lift home
improvement activity.
Certainly the current momentum suggest house price rises
and home improvement activity are spreading from the
hyper-active central London markets to further afield, with
growth occurring across many parts of the country.
The number of potential downsizers with plenty of housing
equity continues to grow. This may well continue to feed
demand for more home improvement areas that are
attractive to those heading into retirement.
Other potential prompts for home improvement look
positive. For instance, the number of home workers for
at least part of the week has risen over the years, making
investment in home improvement more desirable for some.
However, it is always worth considering factors that suggest
caution. One thing that we can’t know is the effect of
payments for PPI mis-selling and if these have caused a one-
off surge in big-ticket purchases. Have people seen these
payment as an unexpected bonus payment and decided to
invest in either a new car or invest in some long-dreamed-of
home improvement?
Growth in the economy, while positive, has been
increasingly lacklustre of late. And we saw how susceptible
investment in home improvement can be to dips in growth.
And on top of this there is the big unknown, the outcome of
the EU Referendum. Firstly we can’t predict the result and
secondly, if we do choose to leave we have little experience
to tell us just how this will impact on both the economy and
more directly on the appetite for home improvement.
But looking at all the data with a cold eye, the best guess is
that those making a living out of home improvement have a
good year ahead of them.
OUTLOOK…
Looking forward
The current momentum suggest house price rises and home improvement activity are spreading further afield from London, with growth across many parts of the country
BROUGHT TO YOU BY
To navigate just click on buttons below and they will take you directly to your chosen section.
Home
Overview
Districts comparison
Region comparison
East of England
REGION FOCUS…
East Midlands
London
North East
North West
Scotland
South East
South West
Wales
Yorkshire & Humber
West Midlands
Britain’s Home Improvers REPORT 2016
Hinderton Point, Lloyd Drive, Cheshire Oaks, Cheshire, CH65 9HQT: 0151 353 3500E: [email protected] : www.barbour-abi.com
@BarbourABI
Outlook

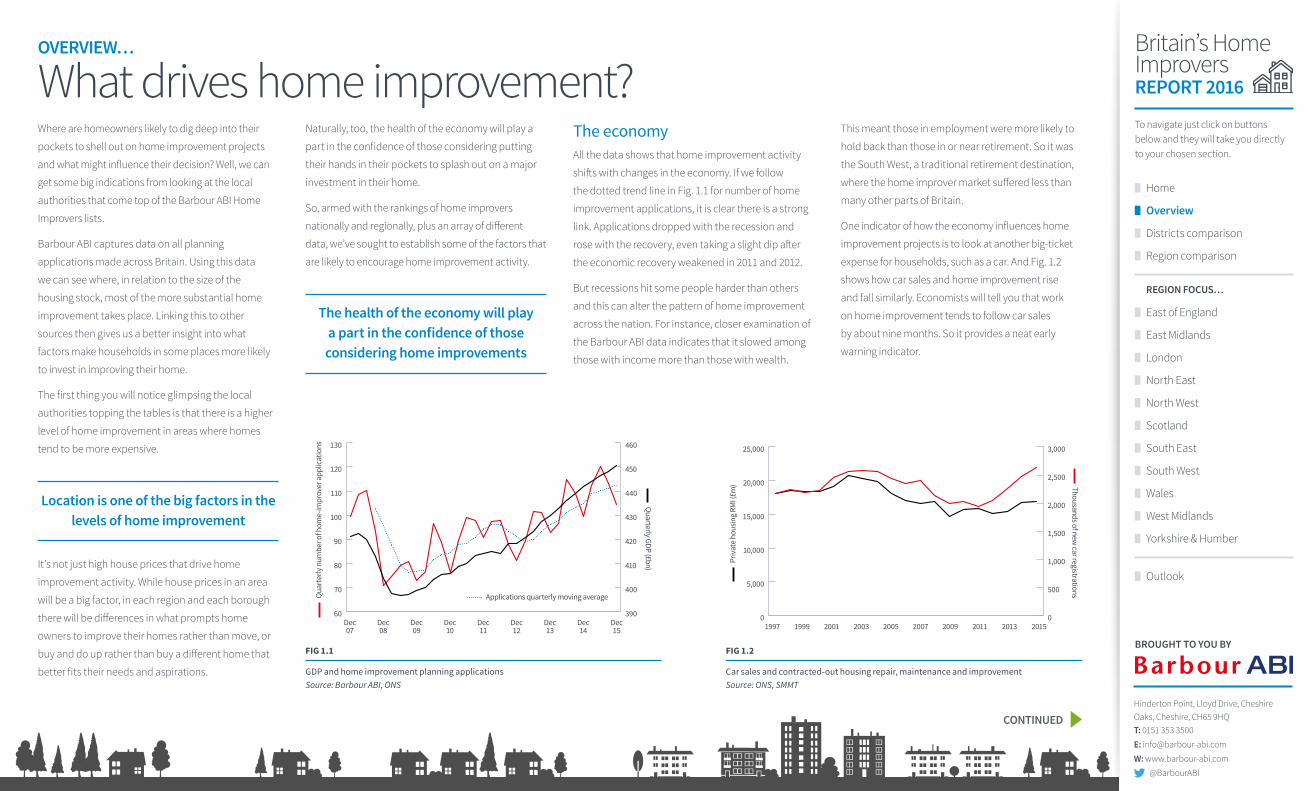


![Protestant Householders' Returns (1740) for County ... Householders' Returns (1740) for County Londonderry [T808/152258] [Sorted by Surname, Barony, Parish and Townland] Record No.](https://static.documents.pub/doc/80x56/5afe4b5f7f8b9a814d8ec9ea/protestant-householders-returns-1740-for-county-householders-returns-1740.jpg)


