30
Hope Opportunity Jobs Community College Budgets: Process and Prospects Jennifer Haygood, EVP and Chief Financial Officer North Carolina Community College System
| Date post: | 25-Dec-2015 |
| Category: |
Documents |
| Upload: | junior-daniels |
| View: | 214 times |
| Download: | 1 times |

Hope Opportunity Jobs
Community College Budgets:Process and Prospects
Jennifer Haygood, EVP and Chief Financial Officer
North Carolina Community College System

Hope Opportunity Jobs
Overview• Overview of State and NCCCS Budget
• Budgeting Process
• College Budget Allocation Process
• On the Horizon: Prospects for the Future
Please feel free to ask questions at any point!
FY 2013-14

Hope Opportunity Jobs
State General Fund Budget by Revenue Source: FY 2011-12 (in millions)
FY 2013-14
Individual Income Tax, $9,921, 50%
Sales and Use Tax, $5,270, 27%
Corporate Income Tax, $856, 4%
Non-Tax Revenue, $693, 4%
Franchise Tax, $650, 3%
Insurance Tax, $511, 3%
All Other, $1,275, 6%
Fund Balance, $522, 3%
Total: $19.7 billion
Source: Fiscal Research Division, August 8, 2011

Hope Opportunity Jobs
FY 2013-14 State General Fund Budget
Area Net Appropriation % of Total
Education• Public Schools• Higher Education (UNC & CCs)
$11.5 billion• $7.9 billion• $3.6 billion
56%• 38%• 18%
Health and Human Services $5.0 billion 24%
Justice and Public Safety $2.4 billion 12%
All Other $1.7 billion 8%
Total $20.6 billion 100%
FY 2013-14
Of the State funds allocated to community colleges for current operating:• 83% supports direct classroom instruction (66%) and academic and
student support (17%).• 90% supports salaries and benefits of community college employees.

Hope Opportunity Jobs
State General Fund Appropriations for Education: FY 2013-14 (in millions)
FY 2013-14
Public Schools; 7867; 69%
Community Col-leges, $1,021, 9%
UNC; 2583; 23%
Total: $11.5 billion

Hope Opportunity Jobs
Financial Support of Institutions
FY 2013-14
LocalG.S. 115D-32
• Operation and maintenance of plant
StateG.S. 115D-31
• Operating costs for instruction, administration, and support services
Capital construction is the legal responsibility of the county. However, G.S. 115D-31 authorizes the State to provide capital funds to local institutions, provided that it is matched on a dollar-to-dollar basis.

Hope Opportunity Jobs
Sources of NCCCS Funding:FY 2013-14 (in millions)
State General Fund,
$1,021.3, 56%
Tuition and Fees; 367.1; 20%
Local; 227.8; 13%
Institu-tional,
$117.4 , 6%
Federal, $36.7 , 2%
Other; 48; 3%
FY 2013-14
Total: $1.8 billion
Source: August 2012 BD-701, DCC 2-1 Summary. Includes college current expense (Purposes 1XX-6XX) and equipment; chart does not include proprietary activities, student aid, and capital improvement projects.

Hope Opportunity Jobs
NCCCS State Budget: FY 2002-2014
2002-03 2003-04 2004-05 2005-06 2006-07 2007-08 2008-09 2009-10 2010-11 2011-12 2012-13 2013-14 $-
$200.0
$400.0
$600.0
$800.0
$1,000.0
$1,200.0
$1,400.0
$1,600.0
Receipts Appropriations
In m
illio
ns
FY 2013-14
Budget Drivers: Enrollment Growth and Salary Increases
Source: BD 701: FY 2002-2013 June 30 Authorized Budgets, FY 2013-14 Aug 31 Authorized Budget

Hope Opportunity Jobs
NCCCS State Budget: FY 2002-2014
2002-03 2003-04 2004-05 2005-06 2006-07 2007-08 2008-09 2009-10 2010-11 2011-12 2012-13 2013-14$0
$1,000
$2,000
$3,000
$4,000
$5,000
$6,000
$7,000
Receipts/FTE General Fund App/FTE
FY 2013-14
Source: BD 701: FY 2002-2013 June 30 Authorized Budgets, FY 2013-14 Aug 31 Authorized Budget

Hope Opportunity Jobs
Biennial Budget Cycle: FY 2013-15• Summer and Fall 2012:– Develop continuation budget– Develop expansion budget request– Identify reduction options
• 2013 Long Session (begins in January):– Adopt a two-year budget
• 2014 Short Session (begins in May):
– Adjust second year of the budget
FY 2013-14

Hope Opportunity Jobs
The Gubernatorial Process• Per the NC Constitution, the Governor shall:– Serve as “Director of the Budget”– Prepare and recommend a budget to the General
Assembly – Administer the budget as enacted by the General
Assembly
FY 2013-14

Hope Opportunity Jobs
Legislative Budget ProcessGovernor’s Recommended Budget
Full Appropriations
Appropriations Subcommittees
Full Appropriations
House/Senate Floor
Sent to Other Chamber
House and Senate Appoint Conferees
House and Senate Vote on Conference Report
Conference Report Adopted
Budget Bill Enrolled, Ratified, and Sent to the Governor to be Signed into Law
FY 2013-14
Originating Chamber Fails to Concur
The Conference Report must be voted up or down as submitted by the conference committee; it cannot be amended on the House or Senate floors.
The House and Senate alternate preparation of the initial budget bill.
Gov. veto can be overridden by 3/5 vote of each chamber.

Hope Opportunity Jobs
State Board Approval• State Aid Allocations and Budget Policies
– Guidelines Related to Salaries and Benefits of Community College Employees
– Formula and Categorical Allotments– Use of State Funds and Budget Flexibility– Tuition and Fees– Other Budget Policy Issues
FY 2013-14

Hope Opportunity Jobs
College Allotments: FY 2013-14
FY 2013-14
Instructional Formula Funding
Inst. & Ac. Support Formula Funding
Performance Based Allocation
3yr vs 2yr Transition Funds
Categorical Aid Equipment & Instruc-tional Resources
$0
$100
$200
$300
$400
$500
$600
$700
$800
$900
$827.9
$486.0
$9.0 $4.0$27.5
$61.5
In M
illi
ons
.7%4%
59%
34%
2%
Source: FY 2013-14 Summary of Budget Allocations. Note that this graph only captures funds distributed to colleges through the routine budget allocation process. This graph does NOT account for any subsequent reversions required by the Governor or allocations.
Total Allotments: $1.41 billionLess Management Flex Cut: $0.07 billionNet Allotments: $1.34 billion
.3%

Hope Opportunity Jobs
Full-Time Equivalent (FTE) Student• Curriculum FTE
= 16 hours x 16 weeks x 2 semesters = 512 Membership Hours
• Non-Curriculum FTE = 16 hours x 16 weeks x 2 semesters
+ 16 hours x 11 Weeks = 688 Membership Hours
FY 2013-14

Hope Opportunity Jobs
Budgeted FTE• Budgeted FTE means the number of FTE which
determines a college’s operating budget
• Curriculum budgeted FTE counting period = Fall, Spring (academic year)
• Non-curriculum budgeted FTE counting period = Spring, Summer, Fall (calendar year)
FY 2013-14

Hope Opportunity Jobs
Budget FTE• For each instructional area (curriculum, con ed, and basic skills), a college’s
budget FTE is determined by calculating the higher of :– the prior year; or – the average of the two previous years’ enrollment
• Budget FTE are further categorized based on actual FTE proportions :– Curriculum:
• Tier 1: FTE in high cost areas of health care, technical education (construction, engineering, industrial systems, and transportation system sciences), lab-based science, and college-level math courses
• Tier 2: All other curriculum FTE
– Con Ed (OE):• Tier 2: Con ed courses that are a) mapped to a third-party credential, certification, or
industry-designed curriculum and b) are 96 hours in length.• Tier 3: All other con ed FTE
– Basic Skills FTE: All Basic Skills FTE are designated Tier 2.
FY 2013-14

Hope Opportunity Jobs
Curriculum Instruction Allotment
FY 2013-14
Example College: Curriculum FTE – 1,500 Con Ed FTE – 600 Basic Skills FTE - 115
FY 2013-14 Equivalent Values
Tier 1: $3,636.31Tier 2: $3,160.79
Step 1 Base Allotment: $383,579
Step 2 Multiply Tier 1 BFTE by Tier 1 equivalent value: = 500 X $3,636.31 = $1,818,155
Step 3 Multiply Tier 2 BFTE by Tier 2 equivalent value: = 1,000 X $3,160.79 = $3,160,790
Step 4 Sum steps 1 through 3: $5,362,524
Total Curriculum Allotment: $5,362,524

Hope Opportunity Jobs
Con Ed Instruction Allotment
FY 2013-14
Example College: Curriculum FTE – 1,500 Con Ed FTE – 600 Basic Skills FTE - 115
FY 2013-14 Equivalent Values
Tier 2: $3,160.79Tier 3: $2,685.38
Step 1 Base Allotment: $63,930
Step 2 Multiply Tier 2 BFTE by Tier 2 equivalent value: = 300 X $3,160.79 = $948,237
Step 3 Multiply Tier 3 BFTE by Tier 3 equivalent value: = 300 X $2,685.38 = $805,614
Step 4 Sum steps 1 through 3: $1,817,781
Total Curriculum Allotment: $1,817,781

Hope Opportunity Jobs
Basic Skills Formula Calculation
FY 2013-14
Example College: Curriculum FTE – 1,500 Con Ed FTE – 600 Basic Skills FTE - 115
FY 2013-14 Values
FTE Allotment: • Tier 2: $3,160.79
• State: $2,545.30• Federal: $615.49
Performance-Based Allotment:
• $874.53 per GED/AHS Diploma
Step 1 FTE Allotment: • State: 115 X $2,545.30 = $292,710• Federal: 115 X $ 615.49 = $ 70,782
115 X $3,160.79 = $363,492
Step 2 Performance-Based Allotment: • GEDs/AHS Diplomas Awarded = 100• 100 X $874.53 = $87,453
Step 3 Sum steps 1 through 2: $450,945
Total Basic Skills Allotment: $450,945

Hope Opportunity Jobs
Institutional Support Calculation
FY 2013-14
Example College: Total Budgeted FTE 2,215
Step 1 Base allotment: $2,154,280
Step 2 MCC Allotment (if applicable): $0
Step 3 Enrollment Allotment:• Calculate allowable FTE: 2,215 – 750 = 1,465• Calculate FTE allotment: 1,465 x $1,676 = $2,455,340
Step 4 Determine President’s Salary with Salary Schedule
Total President’s Salary Requirements: $144,477
Step 5 Sum steps 1 through 4: $4,754,097
Total Administrative Allotment: $4,754,097
FY 2013-14 Values
Base Allotment$2,154,280
MCC Allotment (if applicable)
Level 1: $500,919Level 2: $839,311
Enrollment Allotment $1,676 per FTE above 750
President’s SalaryPer Salary Schedule

Hope Opportunity Jobs
Why Do the Formula Factors Change?• Legislative salary increases (if provided)
• Other changes in benefit rates (i.e. hospitalization, retirement)
• Legislative or State Board adjustments to the formula
FY 2013-14

Hope Opportunity Jobs
Performance-Based AllocationsIn FY 2013-14, $9 million was allocated to colleges based on performance on six performance measures:
1. Success rates of developmental students in subsequent college-level English courses2. Success rates of developmental students in subsequent college-level math courses3. Progress of first-year curriculum students4. Curriculum student retention and graduation5. Attainment of licensure and certifications by students 6. Performance of students who transfer to a four-year institution
In FY 2014-15, the General Assembly has directed the State Board to allocate $24 million based on performance. In addition to the six measures above, two additional measures will be added:
7. Progress of basic skills students8. Attainment of GED diplomas by students
For each measure, funds are allocated based on two factors:• Quality: Funds allocated based on percentage of students who succeed on each measure• Impact: Funds allocated based on the number of students who succeed on each measure
FY 2013-14
Hope Opportunity Jobs
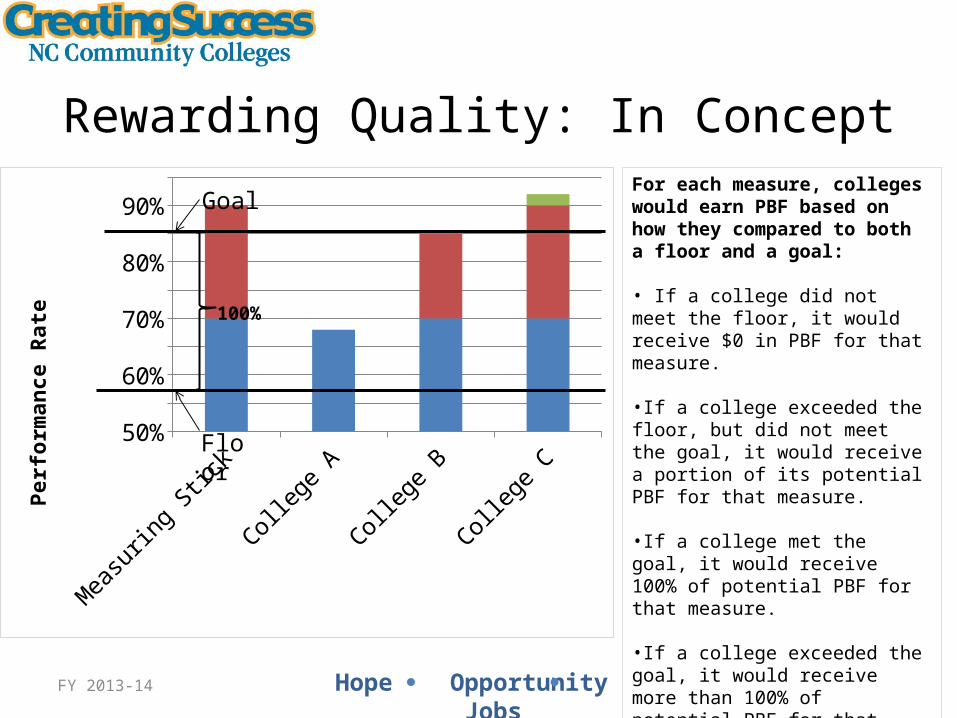
Rewarding Quality: In Concept
Measuring Stick
College A College B College C50%
55%
60%
65%
70%
75%
80%
85%
90%
95%
Perf
orm
ance
Rat
e
100%
FY 2013-14
Goal
Floor
For each measure, colleges would earn PBF based on how they compared to both a floor and a goal:
• If a college did not meet the floor, it would receive $0 in PBF for that measure.
•If a college exceeded the floor, but did not meet the goal, it would receive a portion of its potential PBF for that measure.
•If a college met the goal, it would receive 100% of potential PBF for that measure.
•If a college exceeded the goal, it would receive more than 100% of potential PBF for that measure.

Hope Opportunity Jobs
Rewarding Impact: In Concept• Funds not allocated through the Quality
component would be allocated among colleges through the Impact component.
• Impact = the number of students that succeed on the measure– Step 1: Determine Impact Funding
= Total PBF Funding – Quality Allocation
– Step 2: Determine Impact Funding per Student= Impact Funding / Total # of Successful Students
– Step 3: Determine College’s Impact Allocation= Impact Funding per Student * College A’s # of successful students
FY 2013-14

Hope Opportunity Jobs
Example College’s Total Formula Allotment
• Curriculum: $ 5,362,524
• Continuing Education: $ 1,817,781
• Basic Skills: $ 450,945
• Institutional Support: $ 4,754,097
• Performance-Based Funding: $ 78,252
FY 2013-14
Total Formula Allotment: $12,463,599

Hope Opportunity Jobs
Budget Flexibility
• The General Assembly has allowed colleges to have flexibility in order to meet individual college needs
• Formulas are for allocation purposes only
• Colleges can spend the money however they choose with the following exceptions:– Basic Skills funding may only be used for basic skills programs– Federal vocational education funding may not be transferred– Customized Training funds may not be transferred– Certain State-supported allocations approved by the State Board
outside the budget package
FY 2013-14

Hope Opportunity Jobs
On the Horizon: Summer Term FTE• Section 10.4 of S.L. 2013-360 amends G.S. 115D-5:
“Community colleges may teach technical education, health care, developmental education, and STEM-related courses at any time during the year, including the summer term. Student membership hours from these courses shall be counted when computing full-time equivalent students (FTE) for use in the budget funding formulas at the State level.”
• Effective Summer 2014 termFY 2013-14

Hope Opportunity Jobs
On the Horizon: Fourth Tier?• Section 10.4A of S.L. 2013-360:
“It is the intent of the General Assembly that, beginning with the 2014-15 fiscal year, the State Board of Community Colleges shall implement a fourth tier….in order to fund curriculum programs leading to immediate employment at the highest available funding level.”
FY 2013-14

Hope Opportunity Jobs
On the Horizon: NC GAP?• Section 11.17 of S.L. 2013-360, as amended:“The Joint
Legislative Education Oversight Committee…shall study the feasibility of establishing an alternative admission program to be known as NC Guaranteed Admission Program (NC GAP).” The goals of NC GAP shall be :– To encourage and assist students to obtain a baccalaureate
degree within a shorter time period; – To provide students with a college education at significantly lower
costs for both the student and the State; – To help decrease the amount of debt resulting from loans that a
student may owe upon graduation; and – To provide easier access to academic counseling.
FY 2013-14


