For professionals and qualified investors only | For promotional purposes | Not for onward distribution. Investing in a world of opportunities A global equity fund that seeks consistent outperformance by investing in REITs and real estate-related businesses. Our emphasis on local property market knowledge combined with a repeatable, disciplined investment process seeks to provide diversification for investors. Why invest in the fund High-conviction approach All-cap portfolio investing in REITs and property related securities, with a sector leading active share. Active management Differentiated approach to fundamental research and portfolio construction, focused on opportunities across the asset class including alternatives and non-benchmark sectors. Property expertise Global team of property experts leveraging local insights and industry relationships, seeking to generate alpha. Disciplined and consistent investment process HORIZON GLOBAL PROPERTY EQUITIES FUND PROFILE Page 1 of 5 Expanded investment universe 500+ Stocks HIGH-CONVICTION PORTFOLIO 50 – 60 Stocks Differentiated approach to fundamental research Valuation framework Quality scorecard Quality adjusted valuation Expected total return (ETR) Portfolio construction Top 100 Stocks ranked by expected total return (ETR) Intensive analysis Risk controls* Note: There is no assurance that the investment process will consistently lead to successful investing. Any risk management process discussed includes an effort to monitor and manage risk which should not be confused with and does not imply low risk or the ability to control certain risk factors. *Risk Controls reference limits on exposure.
Transcript
For professionals and qualified investors only | For promotional purposes | Not for onward distribution.
Investing in a world of opportunitiesA global equity fund that seeks consistent outperformance by investing in REITs and real estate-related businesses. Our emphasis on local property market knowledge combined with a repeatable, disciplined investment process seeks to provide diversification for investors.
Why invest in the fundHigh-conviction approachAll-cap portfolio investing in REITs and property related securities, with a sector leading active share.
Active managementDifferentiated approach to fundamental research and portfolio construction, focused on opportunities across the asset class including alternatives and non-benchmark sectors.
Property expertiseGlobal team of property experts leveraging local insights and industry relationships, seeking to generate alpha.
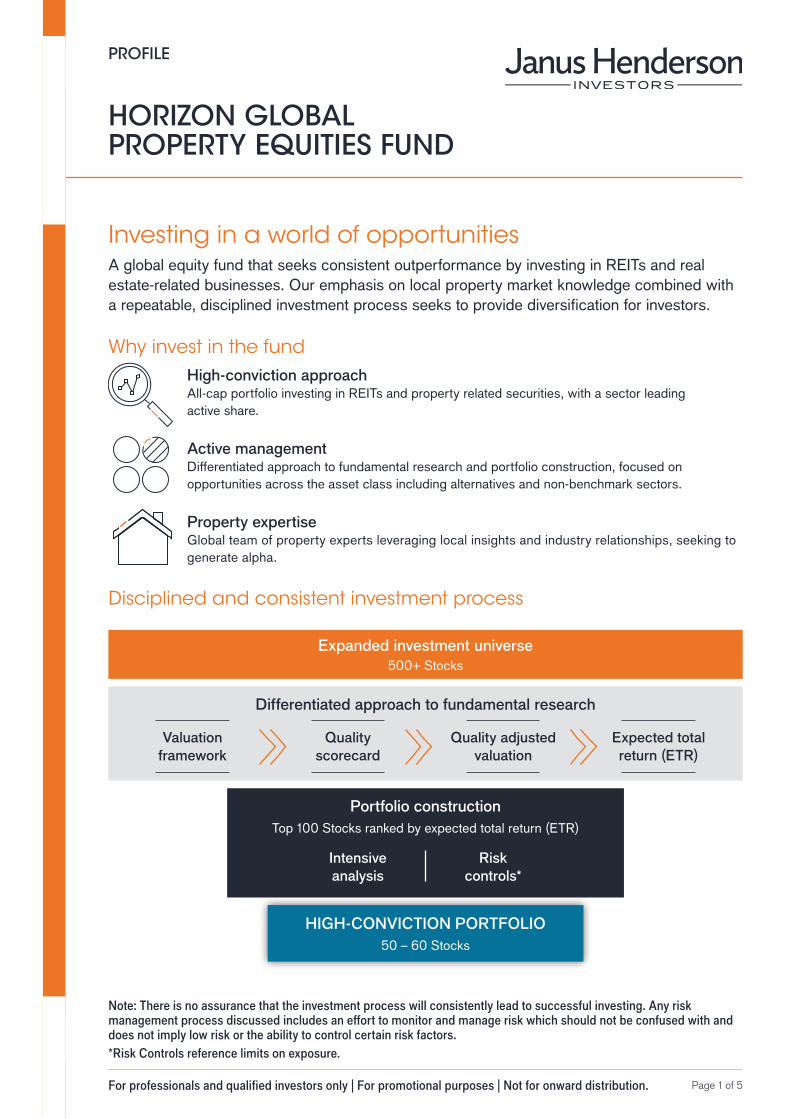
Disciplined and consistent investment process
HORIZON GLOBAL PROPERTY EQUITIES FUND
PROFILE
Page 1 of 5
Expanded investment universe500+ Stocks
HIGH-CONVICTION PORTFOLIO50 – 60 Stocks
Differentiated approach to fundamental research
Valuation framework
Quality scorecard
Quality adjusted valuation
Expected total return (ETR)
Portfolio constructionTop 100 Stocks ranked by expected total return (ETR)
Intensive analysis
Risk controls*
Note: There is no assurance that the investment process will consistently lead to successful investing. Any risk management process discussed includes an effort to monitor and manage risk which should not be confused with and does not imply low risk or the ability to control certain risk factors.*Risk Controls reference limits on exposure.
HORIZON GLOBAL PROPERTY EQUITIES FUND
Page 2 of 5
The case for global property equitiesREITs and property-related securities are often considered an important part of a balanced portfolio as they may offer investors potential for dividends, stable and growing cash flows, and diversification.
Large and expanding opportunity set
Global property is the third-largest asset class after bonds and equities, yet only 40 countries have REIT structures which support access for everyday investors. As more countries adopt REIT models, and expand them to include more property types, the investable universe is poised to expand.
Portfolio enhancement
Compared to global equities and bonds, the asset class has historically offered the potential for attractive risk-adjusted returns, with lower correlations to both.
Income
Dividends have contributed two thirds of global property returns over time, offering steady and growing income, and typically mitigating losses during broad market corrections.
Accessible diversification
Excessive exposure to individual property types, geographical locations or underlying tenants can introduce additional risk into a real estate allocation. The instant diversification provided by listed REITs can be an effective way to mitigate this risk.
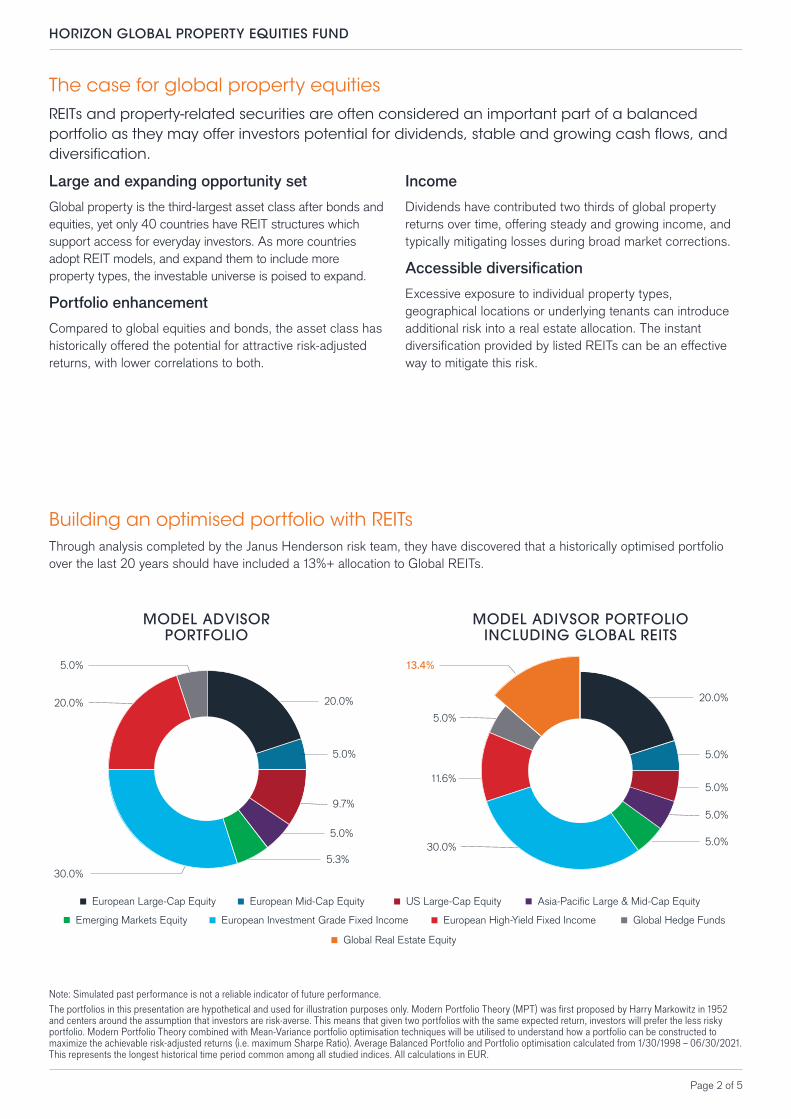
Building an optimised portfolio with REITsThrough analysis completed by the Janus Henderson risk team, they have discovered that a historically optimised portfolio over the last 20 years should have included a 13%+ allocation to Global REITs.
30.0%
20.0%
9.7%
5.0%
5.0%
5.3%
20.0%
5.0% 13.4%
20.0%
5.0%
5.0%
5.0%
5.0%
11.6%
30.0%
5.0%
Global Real Estate Equity
European High-Yield Fixed IncomeEuropean Investment Grade Fixed IncomeEmerging Markets Equity
Note: Simulated past performance is not a reliable indicator of future performance. The portfolios in this presentation are hypothetical and used for illustration purposes only. Modern Portfolio Theory (MPT) was first proposed by Harry Markowitz in 1952 and centers around the assumption that investors are risk-averse. This means that given two portfolios with the same expected return, investors will prefer the less risky portfolio. Modern Portfolio Theory combined with Mean-Variance portfolio optimisation techniques will be utilised to understand how a portfolio can be constructed to maximize the achievable risk-adjusted returns (i.e. maximum Sharpe Ratio). Average Balanced Portfolio and Portfolio optimisation calculated from 1/30/1998 – 06/30/2021. This represents the longest historical time period common among all studied indices. All calculations in EUR.
Page 3 of 5
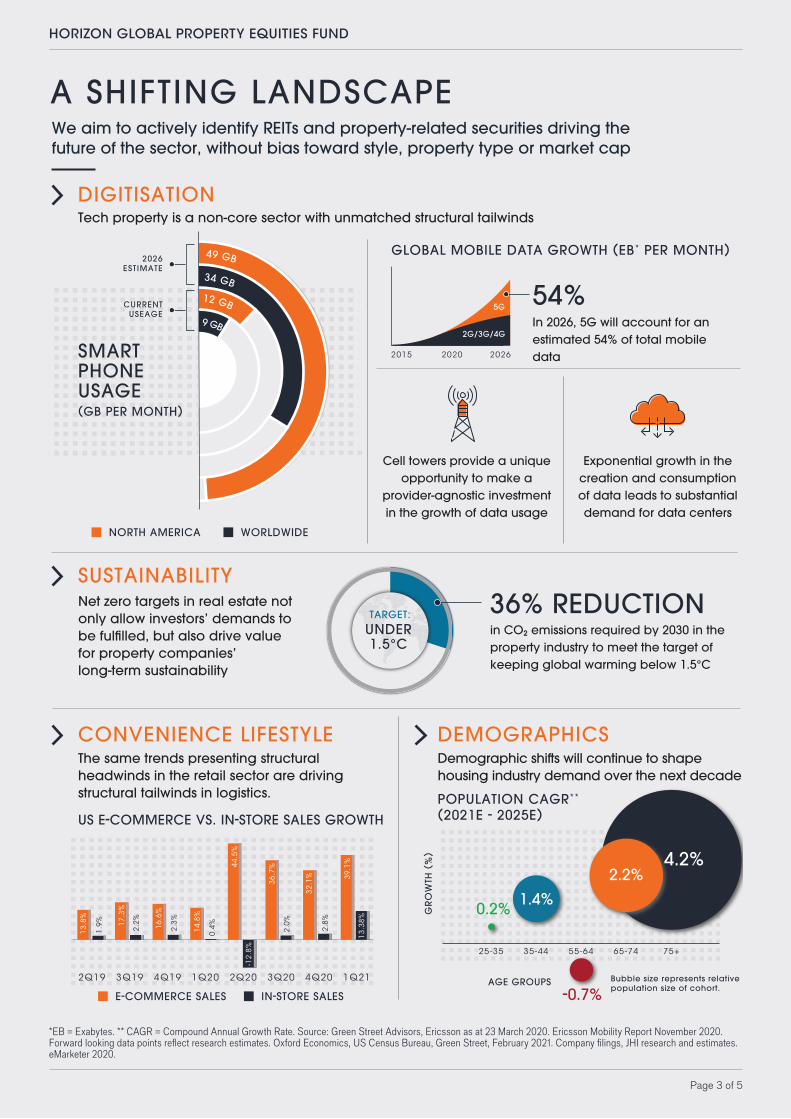
NORTH AMERICA WORLDWIDE
A SHIFTING LANDSCAPEWe aim to actively identify REITs and property-related securities driving the future of the sector, without bias toward style, property type or market cap
DIGITISATIONTech property is a non-core sector with unmatched structural tailwinds
Cell towers provide a unique opportunity to make a
provider-agnostic investment in the growth of data usage
Exponential growth in the creation and consumption of data leads to substantial demand for data centers
In 2026, 5G will account for an estimated 54% of total mobile data20262020
5G
SUSTAINABILITYNet zero targets in real estate not only allow investors’ demands to be fulfilled, but also drive value for property companies’ long-term sustainability
in CO2 emissions required by 2030 in the property industry to meet the target of keeping global warming below 1.5°C
36% REDUCTIONUNDER1.5°C
TARGET:
E-COMMERCE SALES IN-STORE SALES
DEMOGRAPHICSDemographic shi�s will continue to shape housing industry demand over the next decade
CONVENIENCE LIFESTYLEThe same trends presenting structural headwinds in the retail sector are driving structural tailwinds in logistics.
2Q19 3Q19 4Q19 1Q20 2Q20 3Q20 4Q20 1Q21
1.4%
2.2%4.2%
0.2%
-0.7%
25-35 35-44 55-64 65-74 75+
POPULATION CAGR**
(2021E - 2025E)US E-COMMERCE VS. IN-STORE SALES GROWTH
GR
OW
TH (
%)
AGE GROUPS Bubble size represents relative population size of cohort.
49 GB
34 GB
12 GB 9 GB
2026ESTIMATE
CURRENTUSEAGE
SMARTPHONEUSAGE(GB PER MONTH)
2015
GLOBAL MOBILE DATA GROWTH (EB* PER MONTH)
2G/3G/4G
54%
44.5
%
-12.
8%
13.3
8%
2.0%
2.8%
0.4%2.
3%
2.2%
1.9%
32.1
% 39.1
%
13.8
%
17.3
%
16.6
%
14.8
%
36.7
%
*EB = Exabytes. ** CAGR = Compound Annual Growth Rate. Source: Green Street Advisors, Ericsson as at 23 March 2020. Ericsson Mobility Report November 2020. Forward looking data points reflect research estimates. Oxford Economics, US Census Bureau, Green Street, February 2021. Company filings, JHI research and estimates. eMarketer 2020.
HORIZON GLOBAL PROPERTY EQUITIES FUND
Tim Gibson ■ Portfolio Manager
since 2014 ■ Industry since 2001
Greg Kuhl, CFA ■ Portfolio Manager
since 2015 ■ Industry since 2005
Guy Barnard, CFA ■ Portfolio Manager
since 2008 ■ Industry since 2003
Portfolio management Fund facts
Structure Luxembourg SICAV
Inception date 3 January 2005
AUM USD 1.69bn (as at 30 June 2021)
Benchmark FTSE EPRA NAREIT Developed Index
Performance target To outperform the FTSE EPRA NAREIT Developed Index by at least 2% per annum, before the deduction of charges, over any 5 year period
Sector Morningstar Property – Indirect Global
Expected tracking error range
Typically 2 – 4%
Holdings range 50-60
Expected annual turnover 50% - 100%
Position size Max 10% position size, 5% max active weight
Market cap range All-cap
Base currency USD
Ranges are reflective of the portfolio managers investment process and style at time of publication. They may not be hard limits and are subject to change without notice. For a list of available share classes, please contact your local sales representative.
Role in a diversified portfolioPortfolio position
Diversifying equityProperty exposure
Portfolio implementation ■ Diversification from traditional equity
strategies
What this aims to offer investors
■ Appreciation and current income ■ Experienced team
HORIZON GLOBAL PROPERTY EQUITIES FUND
Page 4 of 5
FOR MORE INFORMATION, PLEASE VISIT JANUSHENDERSON.COM
HORIZON GLOBAL PROPERTY EQUITIES FUND
Important information: The investments underlying this financial product (referred to as the Fund) do not take into account the EU criteria for environmentally sustainable economic activities. While the analysis of ESG factors is an integral component across the Investment Manager’s investment capabilities, the Investment Manager does not maximise portfolio alignment with sustainability risks as a separate goal in its own right nor does it precisely attribute the impact of ESG factors on returns for the Fund. This document is intended solely for the use of professionals and is not for general public distribution. Any investment application will be made solely on the basis of the information contained in the Fund’s prospectus (including all relevant covering documents), which will contain investment restrictions. This document is intended as a summary only and potential investors must read the Fund’s prospectus and key investor information document before investing. A copy of the Fund’s prospectus and key investor information document can be obtained from Henderson Global Investors Limited in its capacity as Investment Manager and Distributor. We may record telephone calls for our mutual protection, to improve customer service and for regulatory record keeping purposes. Past performance is not a guide to future performance. The performance data does not take into account the commissions and costs incurred on the issue and redemption of units. The value of an investment and the income from it can fall as well as rise and you may not get back the amount originally invested. Tax assumptions and reliefs depend upon an investor’s particular circumstances and may change if those circumstances or the law change. If you invest through a third party provider you are advised to consult them directly as charges, performance and terms and conditions may differ materially. The securities included in this document are not registered in the Foreign Securities Registry of the Superintendencia de Valores y Seguros for public offering and, therefore, the use of this document is only for general information purposes. Nothing in this document is intended to or should be construed as advice. This document is not a recommendation to sell or purchase any investment. It does not form part of any contract for the sale or purchase of any investment. The Fund is a recognised collective investment scheme for the purpose of promotion into the United Kingdom. Potential investors in the United Kingdom are advised that all, or most, of the protections afforded by the United Kingdom regulatory system will not apply to an investment in the Fund and that compensation will not be available under the United Kingdom Financial Services Compensation Scheme.The Janus Henderson Horizon Fund (the “Fund”) is a Luxembourg SICAV incorporated on 30 May 1985, managed by Henderson Management S.A. Issued by Janus Henderson Investors. Janus Henderson Investors is the name under which investment products and services are provided by Janus Capital International Limited (reg no. 3594615), Henderson Global Investors Limited (reg. no. 906355), Henderson Investment Funds Limited (reg. no. 2678531), Henderson Equity Partners Limited (reg. no.2606646), (each registered in England and Wales at 201 Bishopsgate, London EC2M 3AE and regulated by the Financial Conduct Authority) and Henderson Management S.A. (reg no. B22848 at 2 Rue de Bitbourg, L-1273, Luxembourg and regulated by the Commission de Surveillance du Secteur Financier).Copies of the Fund’s prospectus, Key Investor Information Document, articles of incorporation, annual and semi-annual reports are available in English and other local languages as required from www.janushenderson.com. These documents can also be obtained free of cost from the local offices of Janus Henderson Investors: 201 Bishopsgate, London, EC2M 3AE for UK, Swedish and Scandinavian investors; Via Dante 14, 20121 Milan, Italy, for Italian investors and Roemer Visscherstraat 43-45, 1054 EW Amsterdam, the Netherlands. for Dutch investors; and the Fund’s: Austrian Paying Agent Raiffeisen Bank International AG, Am Stadtpark 9, A-1030 Vienna; French Paying Agent BNP Paribas Securities Services, 3, rue d’Antin, F-75002 Paris; German Information Agent Marcard, Stein & Co, Ballindamm 36, 20095 Hamburg; Belgian Financial Service Provider CACEIS Belgium S.A., Avenue du Port 86 C b320, B-1000 Brussels; Spanish Representative Allfunds Bank S.A. Estafeta, 6 Complejo Plaza de la Fuente, La Moraleja, Alcobendas 28109 Madrid (Registered in Spain under CNMV 353. The Custodian in Spain is BNP PARIBAS SECURITIES SERVICES S.C.A.); Singapore: Singapore Representative Janus Henderson Investors (Singapore) Limited,138 Market Street, #34-03/04 CapitaGreen, Singapore 048946; or Swiss Representative BNP Paribas Securities Services, Paris, succursale de Zurich, Selnaustrasse 16, 8002 Zurich who are also the Swiss Paying Agent. RBC Investor Services Trust Hong Kong Limited, a subsidiary of the joint venture UK holding company RBC Investor Services Limited, 51/F Central Plaza, 18 Harbour Road, Wanchai, Hong Kong, Tel: +852 2978 5656 is the Fund’s Representative in Hong Kong. The summary of Investors Rights is available in English from https://www.janushenderson.com/summary-of-investors-rights-english. Henderson Management SA may decide to terminate the marketing arrangements of this Collective Investment Scheme in accordance with the appropriate regulation.