Page 1
IRCWD-Report No. 0 6 / 8 6
255 .4
86 H 0
HORIZONTAL-FLOW ROUGHING FILTRATION (HRF)
A Design, Construction and Operation Manual
MARTIN WEGELIN
International Reieience Centre for Waste Disposal (IRCWD) Ueberlandstrasse 133, CH-8600 Duebendorf, Switzerland
255.i(-Mo-3GJO
Page 2
IRCWD Report No 06/86
October 1986
HORIZONTAL-FLOW ROUGHING FILTRATION (HRF)
a design, construction and operation manual
Marti-n-Wegel i n, Sanitary Engineer, IRCWD"
I .... v. c.t. 14!/i.:2
I LO: :iS£.M duo i 3 N •= l>o rbG
Text Revisor: Sylvie Peter
Script Processing: Brigitte Hauser
Illustrations: Heidi Bolliger
(A project sponsored by the Swiss Development Cooperation)
Page 3
FOREWORD
The present manual is a state-of-the-art review of Horizontal-
flow Roughing Filtration (HRF). It covers design, construction,
operation and maintenance aspects of this technology. The manual
addresses primarily the design engineer, the construction fore
man and the trainer of treatment plant caretakers.
Horizontal-flow Roughing Filtration is used as pretreatment
process prior to Slow Sand Filtration for the reduction of the
raw water turbidity. The treatment combination is based on
natural purification processes and therefore does not depend on
any chemical supply. However, the filter units are relatively
large but usually constructed with local resources. The techno
logy is primarily meant for rural and small urban water sup
plies.
The method has been tested in the laboratory of the University
of Dar es Salaam. The purification potential of such filters
was confirmed by subsequent field tests carried out in Tanza
nia. Thanks to the support of the Swiss Development Cooperation
and the Swiss Federal Institute for Water Resources and Water
Pollution Control (EAWAG), the International Reference Centre
for Waste Disposal (IRCWD) had the opportunity to test inten
sively the HRF process on a laboratory scale. These investiga
tions lead to a better understanding of the mechanlms taking
place in the HRF and to practical design criteria. This manual
1s the outcome of these investigations and represents the pre
sent state-of-knowledge of the HRF technology.
Grateful acknowledgment is made for the review of the manual
to:
Mr H. Egerrup, DANIDA, Iringa/Tanzania
Mr D. Gubler, Ex-SATA-Helvetas, Zurich/Switzerland
Mr A. Hartmann, SDC, Berne/Switzerland
Messrs B. Lloyd and M. Pardon, CEPIS, Lima/Peru
Mr T.S.A. Mbwette, Imperial College, London/England
Page 4
Mr V. Nllsgard, NORAD, Sumbawanga/Tanzania
Dr S. Stoveland, Ministry of Water Dev., Nairobl/Kenya
Prof. E. Trueb, ETH, Zurich/Switzerland
Mr J.T. Visscher, IRC, The Hague/The Netherlands
Mr K. Wehrle, SKAT, St. Gallen/Sw1tzerland
Dr M. Boiler, EAWAG, Ouebendorf/Sw1tzerland
Mr M. Strauss, IRCWD, Duebendorf/Switzerland
The Hor1zontal-f1ow Roughing Filtration technology is still
under development. The filter efficiency for different raw
water characteristics has to be established. Practical experi
ence reveals that reasonable filter operation can be expected
with average raw water turbidities between 50 and 200 turbidity
units. Nevertheless, preliminary field tests indicated that for
a few weeks the same filters can also handle turbidity peaks of
1000 turbidity units. Filter regeneration and cleaning Is an
other aspect currently under Investigation.
Therefore, the present manual provides tentative guidelines to
allow people to introduce this filter technique and to collect
more information on operation and maintenance. We hope to re
ceive your valuable comments on this manual as well as your
practical experience with Horizontal-flow Roughing Filtration,
1n order to publish a revised version in approx. 1-2 years.
I should like to take this opportunity to also express my gra
titude to the people who have been strongly supporting our HRF
project, particularly to Prof. E. Trueb, Dr M. Boiler and Mr A.
Hartmann.
Roland Schertenlelb
Director IRCWD
Page 5
CONTENTS
Page
Part A: for a brief review:
EXECUTIVE SUMMARY 1
The scope of the problem
and its possible solution
for the fans of cartoons:
A serious problem 3
and its possible happy end
Part B: for more details:
why opt for a HRF ?
1. INTRODUCTION AND PROBLEM IDENTIFICATION 5
how to design a HRF ?
2. MAIN FEATURES AND LAY-OUT OF HRF 12
where to integrate a HRF ?
3. LAY-OUT OF WATER TREATMENT PLANTS 24
how to construct a HRF ?
4. HRF CONSTRUCTION 37
Page 6
Page
how to operate and maintain a HRF ?
5. HRF OPERATION AND MAINTENANCE 46
what are the costs of a HRF ?
6. ECONOMIC CONSIDERATIONS 65
how to dimension a HRF ?
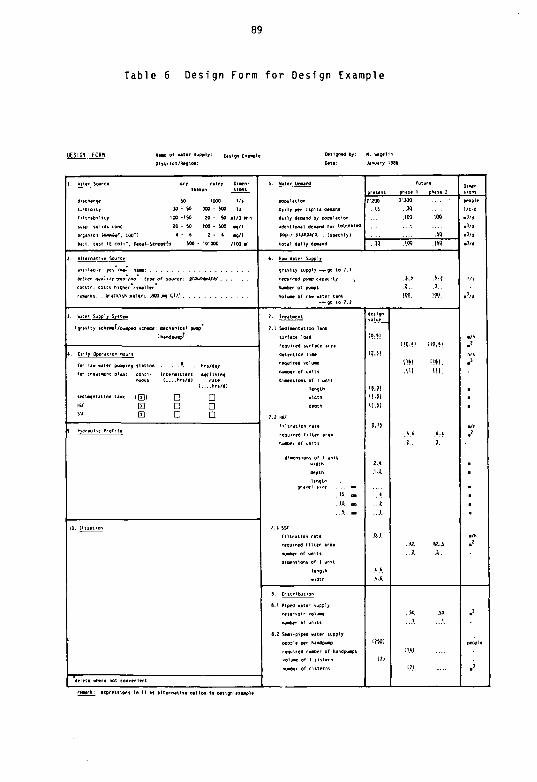
7. DESIGN EXAMPLE 72
are you convinced of HRF ?
8. CONCLUSIONS AND FINAL REMARKS 91
References 93
Abbreviations 95
Detailed Table of Contents 96
PART C: for the motivated practitioner: 100
Appendix 1 Nomogram for HRF design
2 Simple methods for water quality analysis
3 Simple methods for discharge measurements
4 Construction details of a HRF
5 Salient data and features of a SSF
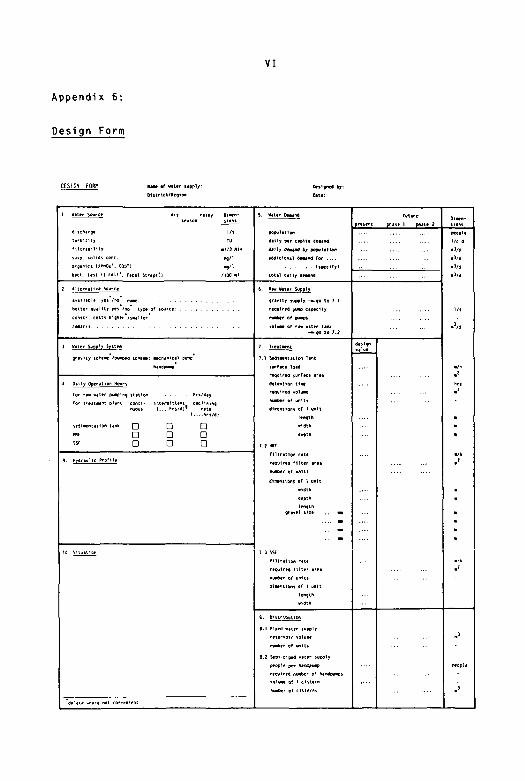
6 Design form
7 Outline for caretaker training
8 HRF and SSF monitoring programme
9 Examples of HRF application
Page 7
1
Part A:
EXECUTIVE SUMMARY
THE SCOPE OF THE PROBLEM
AND ITS POSSIBLE SOLUTION
Slow Sand Filtration is commonly considered an appropriate
water treatment process most suitable for developing countries.
The ability to significantly improve the bacteriological quali
ty of the water without the use of any chemicals speaks in
favour of this process. However, the slow sand filters are
frequently overloaded with suspended solids thereby causing
unacceptable short filter runs. Hence, pretreatment of the raw
water is almost a necessity.
Plain sedimentation and even prolonged storage are usually not
able to reduce the suspended solids concentration to the required
level for successful slow sand filter operation. Destabiliza-
tion of the suspension by chemical flocculation creates many
operational and practical problems for a reliable application
of this process in developing countries. Finally, conventional
types of rapid sand filters require complicated backwash sys
tems of a higher technical standard than that of slow sand
filters. Therefore, all these processes are often inappropriate
in combination with slow sand filters.
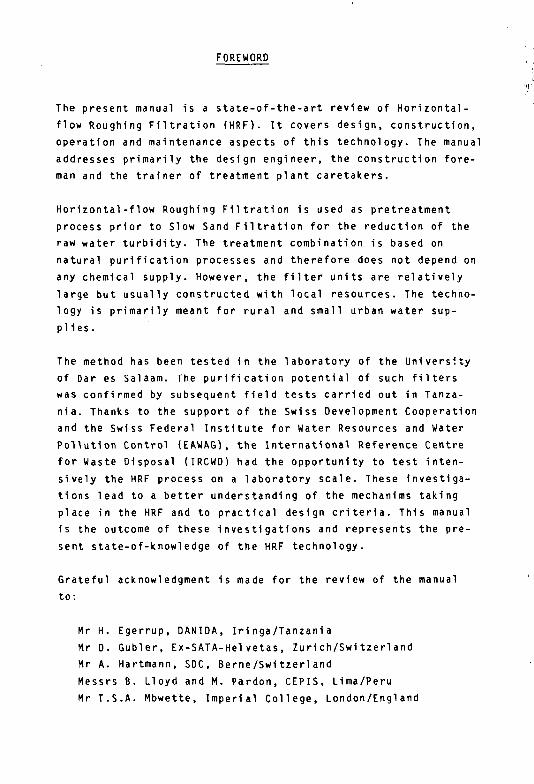
Horizontal-flow Roughing Filtration might close this gap. The
filter is composed of a simple box filled with gravel of differ
ent sizes (from coarse to fine) as can be seen in Fig. 1.
Horizontal-flow roughing filters have long operational times
due to their large silt storage capacity, i.e. in the order of
months, similar to efficiently operating slow sand filters.
Page 8
2
This manual addresses design engineers, construction foremen
and trainers of plant caretakers. It is meant as a practical
tool for the implementation of Horizontal-flow Roughing Fil
ters. Through this sturdy and self-reliant pretreatment method,
it is possible to achieve a sound and efficient application of
the slow sand filter process.
inlet channel -with weir aA%^-
t" 4 '
outlet channel
filtrate toSSF
outlet chamber with drain
inlet chamber
Fig. 1 Main Features of a Hor1zontal-f1ow Roughing Filter
Page 9
3
for the fans of aavtoone:
A SERIOUS PROBLEM
AND ITS POSSIBLE HAPPY END
Hello, I'm Miss Slow Sand Filter. How are you?
I'm fine because people admire me. Why? Because
of my quality to produce clean drinking water
and perhaps also because of my modesty which is
highly appreciated by men ....
However, I'm not as modest and quiet as most
people think. I can get quite upset, especially
if I'm fed nasty turbid water. Then I get dizzy
because the water pressure almost blocks and
bursts my head, and I am no longer able to
produce water.
Page 10
4
Some people have become aware of my difficult
condition and tried to help me by adding chemi
cals. Aluminum sulfate was thrown into the
turbid water to improve my condition. However,
quite often I felt no improvement because
either the floes bothered me or the chemicals
ran out - so, I had a new attack! The only
remedy to restore my health 1s: no turbid
water! But how can it be achieved ?
Well, I found what I was looking for: a nice
clean-cut boyfriend whose name 1s Mister
Horizontal-flow Roughing Filter - a somewhat
strange name so, I nicknamed him "HORFI".
Anyhow, he behaves like a real gentleman and
protects me from turbid water with his mighty
strength. I'm really looking forward to our
honeymoon which I hope will never
END
Page 11
5
Part B: ahy opt for a HRF ?
(HRF = horizontal-flow Roughing filtration / Fj'lter)
1. INTRODUCTION AND PROBLEM IDENTIFICATION
Ground and springwater are generally safe for consumption.
The water drawn from such sources undergoes natural purifica
tion when percolating and flowing through the pore system of
the soil. Especially the harmful bacteria, viruses, protozoas,
eggs and worms - known as pathogens - are most effectively
removed to a level which will no longer endanger human health.
Surface water, however, is unprotected and permanently exposed
to possible faecal contamination. The natural purification
processes in a free water body are less pronounced due to a
smaller interface between water and solid material. Furthermore,
flowing water which acts as a transport vehicle can spread the
pathogens to consumers located downstream of a polluted site.
A large part of mankind is forced to use surface water, water
drawn from polluted rivers, irrigation canals, ponds and lakes.
Where no alternative water sources are available, treatment of
such water, especially with respect to its bacteriological
improvement, is necessary if contamination by man and/or ani
mals is significant (e.g. if it contains more than 100 E.coli/
100ml ).
Sloa Sand Filtration/Filter (SSF) copies the natural purifi
cation processes which take place in an aquifer. When flowing
through a sand layer, the unsafe surface water is converted
into a water whose quality can be compared with a safe "ground
water". Last century, under the menace of cholera epidemics,
European waterworks discovered the benefits of SSF. The techni
que proved to be efficient against water-borne diseases and, 1n
combination with other sanitation improvements, these epidemics
were eradicated from Europe. Even today, numerous water supplies
in industrialized countries are still using SSF as part of their
water purification system.
Page 12
6
The main features of a SSF are shown in Fig. 2. A SSF consists
of an open box containing a sand layer of approx. 1 m depth.
The upper part of the filter box is filled with water to be
filtered. This water which flows by gravity through the sand
bed is then collected by an underdrain system and conveyed
through flow control devices to a clear water tank. An area of
1 m' sand has a daily water output of 2.5 to 5 m^.
flow control
filtered water
Fig. 2 Main Features of a Slow Sand Filter (SSF)
SSF offers the great advantage of being safe and stable, simple
and reliable and can therefore be considered a most appropriate
water treatment technology for developing countries. Filter
construction makes extensive use of local material and skills.
Construction, operation and maintenance of the filters are easy
and require only limited professional skills. Neither mechani-
Page 13
7
cal parts nor chemicals are necessary for SSF. If the water fed
to the SSF does not contain more than 5000-10000 E.coli/ 100ml,
then the quality of the treated water is good since it 1s vir
tually pathogen-free.
The purification processes of a SSF are located mainly in
the top part of the sand bed. A biologically active layer, on
which filter performance greatly depends, reaches its required
efficiency after a ripening period of 2-4 weeks at the initial
start of operation. Later on, after subsequent cleanings, a
period of a few days to 1 week might be sufficient for the
redevelopment of this layer.
Accumulation of solid matter and gradual growth of the biologi
cal layer at the filter surface increase filter resistance. The
filter has to be cleaned when the filter resistance attains a
maximum permissible filter resistance of approx. 1 m. The fil
ter bed 1s drained and a few cm of sand from the filter top are
removed.
SSF should run for at least 1-2 months between two cleanings to
ensure economic and reasonable operation. Large concentrations
of solid matter in the raw water will rapidly clog the filter
and impair the development of the biological layer. Therefore,
a sound SSF application is questionable with operation times of
a few days or weeks only.
More information on SSF is compiled in a design and construc
tion manual published by IRC, The Hague/The Netherlands (1).
However, practical experience with SSF in developing countries
reveals that many installations are facing operational problems
or are even out of operation. One major reason for the existing
situation is the poor raw water quality fed to the filters. SSF
is very sensitive to high suspended solids concentrations since
they will block the filter after a short time. SSF will there
fore only operate satisfactorily with raw water of low turbidi
ty (lower than 10 N T U ) . Filtration of raw waters with higher
turbidities will cause a rapid increase of the filter resist-
Page 14
8
ance. Short filter runs and frequent cleaning are the conse
quence of a poor raw water quality.
Throughout or during part of the year, most flowing surface
waters in the tropics are of a higher turbidity than the stand
ard required by SSF. Therefore, in order to achieve a reason
able SSF operation, raw water pretreatment is generally a ne
cessity since it will reduce turbidity or, more specifically,
it will separate the suspended solids responsible for most of
the turbidity.
Conventional Pretreatment
The solid matter in the water is usually either removed by
sedimentation tanks, possibly supported by flooaulators or,
alternatively, by rapid sand filters. Conventional settling
tanks are able to separate solids larger than about 20 um.
However, finer material, which might represent a large part of
the solids found in river water, will only partially be retained
by sedimentation tanks and cause premature clogging of the SSF.
Consequently, plain sedimentation will hardly meet the high
standard required by SSF. The settling rate of the fine matter
can be accelerated by the addition of chemicals (such as alu
minum sulfate or ferric c h l o r i d e ) . These salts destabilize the
suspension as the small particles can come together to form
floes. However, the flocculation process is an advanced treat
ment technique which requires highly qualified personnel and
well equipped facilities; both hardly available in rural areas.
Due to the great difficulties encountered with the supply of
chemicals, the correct dosage of flocculants and flocculant
aids and the lack of qualified staff to operate the installa
tions, a reliable and successful application of this process is
rather doubtfull in small water supply schemes. Finally, rapid
sand filters are often applied to remove fine solids from the
water. Conventional filters must be frequently cleaned by a
backwash process requiring rather complicated mechanical equip
ment. The technical level of rapid sand filters stands in dis
crepancy to the relatively simple SSF process. Rapid sand fil
ters are thereby generally not combined with SSF.
Page 15
9
It can be concluded that the conventional pretreatment tech
niques for the removal of fine particles from the water are ei
ther not efficient enough or too sophisticated for rural and
small urban water supplies.
HRf_as Alternative Pretreatment
Since gravel and sand layers of aquifers significantly improve
the water quality of infiltrated surface water, why ignore such
an excellent process just because nature has not provided the
specific hydrogeological conditions at the site? An artificial
aquifer might act in the same way and produce a hygienically
safe drinking water.
Horizontal-flow Roughing Filtration copies nature. The main
characteristics of the process are its horizontal flow direc
tion and the graduation of the filter material. This specific
flow direction enables to construct a shallow and structurally
simple filter of unrestricted length. Three to four subsequent
gravel packs, ranging from coarse to fine material, effect a
gradual removal of the solids from the water. The coarse filter
material, contained in the first part of the filter, retains
all the larger particles and some of the finer matter, while
the last filter part with the finest filter material has to
cope with the remaining smallest particles. Since the effluent
of a HRF is virtually free from any solids, the standards re
quired by SSF are easily met.
HRF is very similar to SSF. Since both filter techniques make
use of natural purification processes, no chemicals are neces
sary to assist the treatment process. The installation of such
filters requires only local resources such as construction
material and manpower. Furthermore, no mechanical parts are
required to operate or clean the filters. A wel1-designed fil
ter combination will work for several months between two subse
quent cleanings.
Page 16
10
Hence, why not use HRF in combination with SSF? As pre-
treatment process, HRF acts mainly as physical filter and re
tains the solid matter. As main treatment process, SSF is a
biological filter which substantially improves the bacterio
logical water quality. The thereby treated water is similar to
a good groundwater and safe for consumption. Therefore, let's
copy nature where no suitable aquifer is available to supply
safe and reliable drinking water.
Historical Background of HRF
Last century already, coarse media filters were used in England
and France for raw water pretreatment prior to SSF. For the
past 25 years, gravel prefilters have been used in combination
with sand beds for artificial groundwater recharge in Germany,
Switzerland and Austria (2). More recently, investigations on
coarse media prefilters were carried out at the Asian Insti
tute of Technology in Bangkok/Thailand (3, 4) and at the Univer
sity of Dar es Salaam/Tanzania (5, 6 ) , to examine the treatment
efficiency of these filters with highly turbid water. Five
years ago, the International Reference Centre for Waste Disposal
(IRCWD), attached to the Swiss Federal Institute for Water
Resources and Water Pollution Control (EAWAG) in Duebendorf/
Switzerland, started extensive laboratory investigations on HRF
(7). A demonstration project, sponsored by the Swiss Develop
ment Cooperation, is in progress. Its objective is to introduce
the HRF technology in different developing countries and to
gain more practical experience with this process.
Page 17
11
Note:
- groundwater and springs should be used
whenever possible. Surface water is often of
poorer quality
- SSF makes the most use of local resources and
is hence independent of imported supplies such
as chemicals, mechanical spare parts etc
- SSF is able to produce hygienically safe water
- since SSF is very sensitive to solid matter
in the water, pretreatment is in most cases a
necessity
- Conventional pretreatment (sedimentation tanks,
flocculation, rapid sand filter) is not effi
cient enough or often fails due to operational
reasons
- HRF uses the purification potential of nature
and is on the same technical level as SSF
- HRF and SSF complement each other, and their
application is a very valuable and reliable
option
Page 18
12
how to design a HRF ?
2. MAIN FEATURES AND LAY-OUT OF A HRF
The schematic lay-out of a HRF 1s illustrated in Fig. 3. The
filter 1s divided Into three parts: the inlet structure, the filter bed and the outlet structure. In and outlet structures
are flow control Installations required to maintain a certain
water level and flow along the filter as well as to establish
an even flow distribution across the filter. The main part of
a HRF consists of the filter bed composed of 3 to 4 gravel
packs of different sizes.
inlet channel with weir
inlet chamber
outlet channel
filtrate to SSF
outlet chamber with drain
Fig. 3 Main Features of a Horizontal-
flow Roughing Filter (HRF)
Page 19
13
The raw water falls over a weir into an inlet chamber where
coarse solids settle and floating material is retained by a
separation wall. The water passes through the perforated sepa
ration wall and flows in horizontal direction through a sequence
of coarse, medium and fine filter material. The pretreated
water is collected at the filter end by an outlet chamber,
discharged for flow measurements over a weir and conveyed to
the SSF.
HRF acts as a multistore sedimentation tank
Accumulation of solids on the upper collector surface
Sedimentation ie the main
process in HRF responsible
for the separation of the
solid matter from the
water as observed in labo
ratory tests conducted at
EAWAG (2, 7 ) . The filter
acts as a multi-store
sedimentation basin, thus
providing a large surface
area for the accumulation
of settleable solids. The
solids accumulate on top
of the collectors and grow
into dome-shaped aggre
gates with advanced fil
tration time. Part of the
small heaps drifts towards
the filter bottom once the
heaps reach instability.
This drift regenerates the
filter efficiency of the
the upper gravel layers
and enables accumulation of a considerable amount of retained
material. Fig. 4 schematizes the different mechanisms of sedi
mentation taking place in a HRF. Depending on the organic cha
racteristics of the raw water, other processes such as biolo
gical oxidation or adsorption of solid matter at the slimy
filter surface might also occur.
Drift of separated solids to the filter bottom
F i g . 4 M e c h a n i s m o f HRF
Page 20
14
DesignVari abl es
The objective of a HRF design is the reduction of the suspended
solids in the raw water from a certain, in many cases unknown
concentration and hence assumed value, to a standard required
by SSF. The characteristics of the raw water determine filter
lay-out and its operation, whereas the required capacity only
determines the cross-section area of the filter bed.
The following four design criteria have to be considered
for HRF design:
1) the required effluent quality for a specific raw water
quality in terms of separated suspended solids concen
tration AC in mg/1
2) the required daily output Q in terms of m^/d
3) the required filter run period T r in terms of weeks
4) the maximum allowable filter resistance AH in terms of cm
The following four design variables determine the HRF
1 ay-out:
1) the filtration rate Vp in m/h, which is the hydraulic
load in m^/h on the filter's cross-section area in m2
2) the individual sizes dgi of the filter material in mm
3) the individual lengths If, of each filter material
in m
4) the cross-section area A of the filter in m^
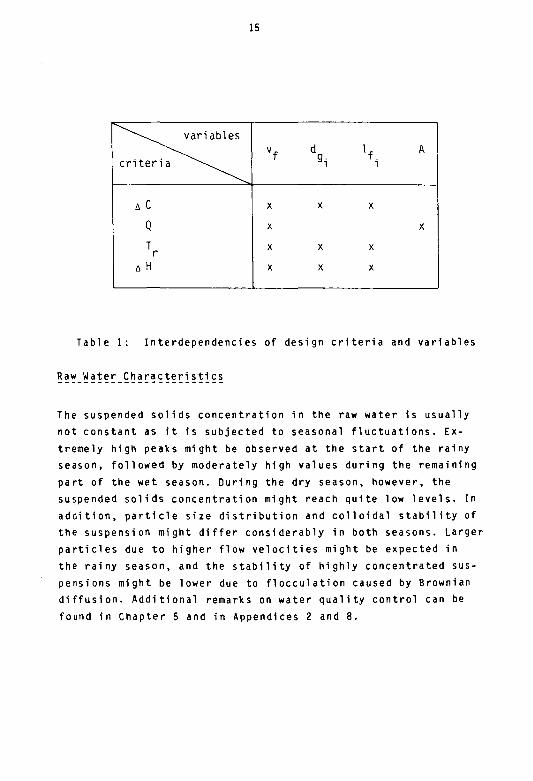
For a constant suspended solids concentration 1n the raw water,
the design criteria and variables are correlated to each other
according to the following matrix:
Page 21
15
^ • ^ ^ variables
c r i t e r i a ^ ^ ^ ^
AC
Q
T r A H
v , d 1 , A f g. f .
X X X
X X
X X X
X X X
Table 1: Interdependencies of design criteria and variables
Raw Water Characteristics
The suspended solids concentration in the raw water is usually
not constant as 1t is subjected to seasonal fluctuations. Ex
tremely high peaks might be observed at the start of the rainy
season, followed by moderately high values during the remaining
part of the wet season. During the dry season, however, the
suspended solids concentration might reach quite low levels. In
addition, particle size distribution and colloidal stability of
the suspension might differ considerably in both seasons. Larger
particles due to higher flow velocities might be expected in
the rainy season, and the stability of highly concentrated sus
pensions might be lower due to flocculation caused by Brownlan
diffusion. Additional remarks on water quality control can be
found in Chapter 5 and in Appendices 2 and 8.
Page 22
16
D e s i g n A s p e c t s
HRF has to be dimensioned for extreme situations, i.e. for
maximum suspended solids concentration in the raw water. As
filter efficiency decreases with increasing filter load a (g/1)
defined as dry weight of accumulated solids (in g) per unit of
filter volume (in 1 ) , peak loads in the raw water should pref
erably be treated with a recently cleaned filter. The annual
operational plan should therefore consider seasonal quality
fluctuations of the raw water. Details in this respect are
given in Chapter 5.
In order to guarantee an economic lay-out of HRF, moderately
higher effluent concentrations of suspended solids might be
permitted during extreme situations. Furthermore, the filtration
velocity vp can normally be increased when the mean suspended
solids concentrations of the river water is moderate or low.
Higher filtration rates permit smaller filter cross-sections
although the filter length 1 f may, as a consequence, have to
be increased. The three design variables Vp, A and If are
interrelated. An economic optimization of the filter bed volume
by a variation of these three variables is possible within
narrow limits only. The detention time of the water in the
filter is one major operational filter characteristic since
sedimentation remains the main process in HRF. However, a reduc
tion of the filter run period T r will not only reduce the re
quired filter length 1* but also the filter bed volume. Thus,
economic filter optimization can more readily be achieved by a
variation of T r and l f.
With respect to the grain size d_ of the filter medium, one
would primarily tend to use finer material as coarser filter
aggregates have a lower efficiency. However, besides efficiency
in the separation of suspended solids, other criteria such as
final headloss AH, filter run period T r and filter cleaning
aspects have to be considered. With the use of only one fine
filter material, it might be possible to pretreat the raw water
sufficiently but at the expense of high head losses, short
Page 23
17
filter runs and difficulties in filter cleaning. Such problems
arise with filter material of less than 4 mm in size. A graded
filter bed with differently sized fractions overcomes the afore
mentioned difficulties.
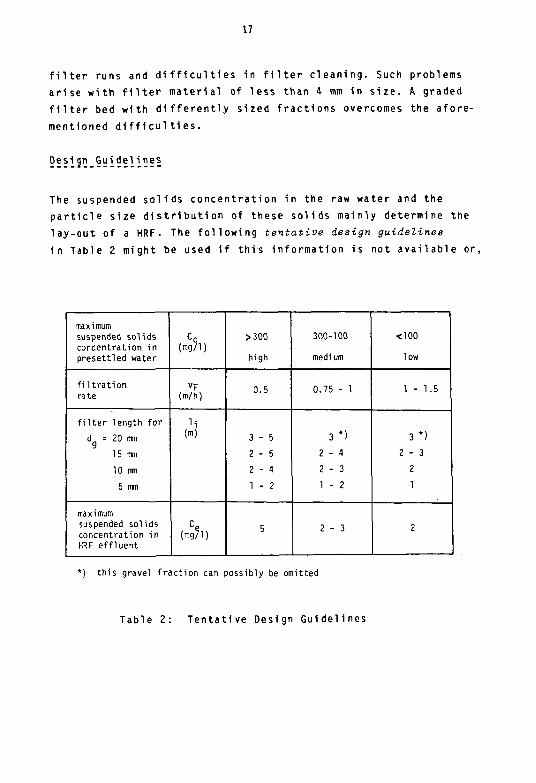
Design Guidelines
The suspended solids concentration in the raw water and the
particle size distribution of these solids mainly determine the
lay-out of a HRF. The following tentative design guidelines in Table 2 might be used if this information is not available or,
maximum suspended sol ids concentration in presett led water
f i l t r a t i o n rate
f i l t e r length fo r
d = 20 mm
15 mm
10 mm
5 mm
maximum suspended solids concentration in HRF ef f luent
Co (mg/1)
VF (m/h)
11 (m)
(mg/1)
>300
high
0.5
3 - 5
2 - 5
2 - 4
1 - 2
5
300-100
medium
0.75 - 1
3 * )
2 - 4
2 - 3
1 - 2
2 - 3
-
<100
low
1 - 1.5
3 * )
2 - 3
2
1
2
*) this gravel fraction can possibly be omitted
Table 2: Tentat ive Design Guidelines
Page 24
18
alternatively, as a baseline for preliminary design considera
tions. To reduce the solids load on the HRF, coarse, settleable
matter is separated preferably by a small settling tank prior
to filtration. Therefore, the values in Table 2 apply to pre
s e t t e d raw water (detention time less than 3 h o u r s ) .
The tentative design guidelines are listed for 3 different
maximum suspended solids concentrations in presettled water.
Table 2 suggests the use of a HRF with 4 differently sized
filter materials, i.e. filter media of 20, 15, 10 and 5 mm
average sizes. The total filter length amounts to 8 - 16 m for
highly turbid water and can possibly be reduced to 5 m if a
lower filtration rate is used for raw water of medium or low
suspended solids concentration.
A nomogram presented in Appendix 1 might be used for further
design evaluations or for the development of an individual
filter configuration. This nomogram is based on laboratory
filtration tests carried out with a suspension of kaolin ( 7 ) .
The raw water characteristics of a specific river might not
necessarily coincide with the ones of the tested suspension.
Further specifications and the design procedure are explained
1n Appendix 1.
Finally, a computer programme for dynamic HRF modelling
is available at EAWAG. This programme considers the filter
efficiency reduction caused by the filter load. The fluctuation
of the suspended solids concentration in the raw water can
thereby be simulated and the design will consequently no longer
be based on a specific maximum concentration. The development
of the HRF effluent quality, in terms of suspended solids con
centration, can be examined for different filter configurations
to achieve best filter operation. However, detailed information
on the raw water characteristics is required to attain optimum
benefits. Details on the required input and the conditions for
a computerized HRF design are available from EAWAG at special
request.
Page 25
19
Neither the height H nor the width W of a HRF are dependent on the raw water characteristics but are influenced by structural and operational criteria. The following aspects were taken into account for the recommendation of the respective dimensions:
- although the efficiency of a HRF can partly be restored by intermittent drainage, the filter media has to be taken out and cleaned manually to remove the sticky sludge which will have accumulated in the lower part of the filter after longer operational periods. Therefore, a convenient side walls height will allow for easier removal and refilling of gravel from and into the filter box respectively. In addition, a shallow height will also enable the construction of non-reinforced side walls and thus effectively reduce construction costs. On the other hand, too small structures require extensive land. Therefore, the height of the side walls should lie between 1.0 and 1.5 m.
Hmax. = !-5 m
^recommended = 1 ~ !•' m
- the width W of a HRF depends on the required capacity of the treatment plant. In general, at least 2 HRF units should be provided in order to allow for treatment continuity during maintenance of any one unit. For hydraulic reasons and 1n order to limit the interruption period necessary for manual filter cleaning, the maximum width should not exceed 5 m, whereas the minimum width should be at least 1 m to ease cleaning.
Wmax. = 5 m
wrecommended = 1 - 4 m
Page 26
20
Q°*.?5^-!!!?? l o s s Control
The hydraulic conditions in a HRF are determined by the hydrau
lic load and by the water depth in the filter. These conditions
are controlled by certain installations such as weirs and valves.
Filter control is essential to maintain specific flow condi
tions and to detect leakages.
A distributor box or channel divides the flow to the different
HRF units into equal parts. The simplest control device is a
V-notch weir. Maximum flow through the treatment plant can be
limited by an overflow located in the distributor box or chan
nel .
The water level in the HRF 1s influenced by the outlet control
system. In general, either a fixed or a variable water level 1n
the outlet chamber is possible. The simplest option here 1s
also the Installation of a weir or an effluent pipe which main
tains the effluent water level at a fixed height.
inlet filter outlet
coarse medium fine
gravel
© water table in clean filter (at begin of filter operation)
© water table in loaded filter (at end of filter operation)
Fig. 5 Fixed Water Level Filter Control (recommended)
Page 27
21
The filter resistance increases with progressive filter opera
tion. Since the water flows through coarse material at low
velocities, the final headloss in a HRF will usually be in the
range of 10 to 20 cm, but should not exceed 30 cm. The headloss
variation in the filter is accommodated in the top part of the
filter material. Therefore, filter material should be filled to
approx. 30 to 40 cm above the effluent's weir level. Fig. 5
illustrates the general lay-out of this option. More details on
discharge measurements are given in Appendix 3.
A variable water level at the effluent side is achieved by the
installation of either a manually operated valve, a self-regu
lating floating weir or a constant flow device. The general
lay-out of the variable water level system is illustrated 1n
F1g. 6, and details of self-regulating devices are given in
Fig. 7. The filter resistance can be compensated by a variable
water level system which will enable higher headlosses ( 8 ) .
However, since the final headlosses for the discussed HRF are
relatively small, the use of variable effluent and mechanical
flow rate devices are not advisable for flow control of HRF.
inlet filter outlet
coarse medium fine
gravel
© water table in clean filter (at begin of filter operation)
© water table in loaded filter (at end of filter operation)
Fig. 6 Variable Water Level Filter Control
(not recommended)
Page 28
22
filter outlet
, floats
filter outlet floating ball
C3
floating effluent weir
floating effluent orifice
Fig. 7 Mechanical Flow Rate Devices (1), (9)
Further information on the dimensioning and lay-out of a HRF
can be found in Chapter 7. An example illustrates the HRF
design procedure.
Page 29
23
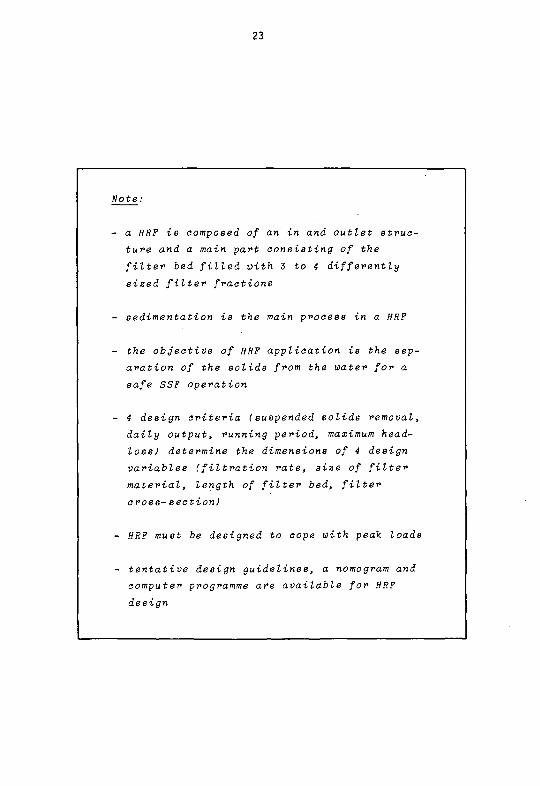
Note:
- a HRF is composed of an in and outlet struc
ture and a main part consisting of the
filter bed filled with 3 to 4 differently
sized filter fractions
- sedimentation is the main process in a HRF
- the objective of HRF application is the sep
aration of the solids from the water for a
safe SSF operation
- 4 design criteria (suspended solids removal,
daily output, running period, maximum head-
loss) determine the dimensions of 4 design
variables (filtration rate, size of filter
material, length of filter bed, filter
cross-section)
- HRF must be designed to cope with peak loads
- tentative design guidelines, a nomogram and
computer programme are available for HRF
design
Page 30
24
where to integrate a HRF ?
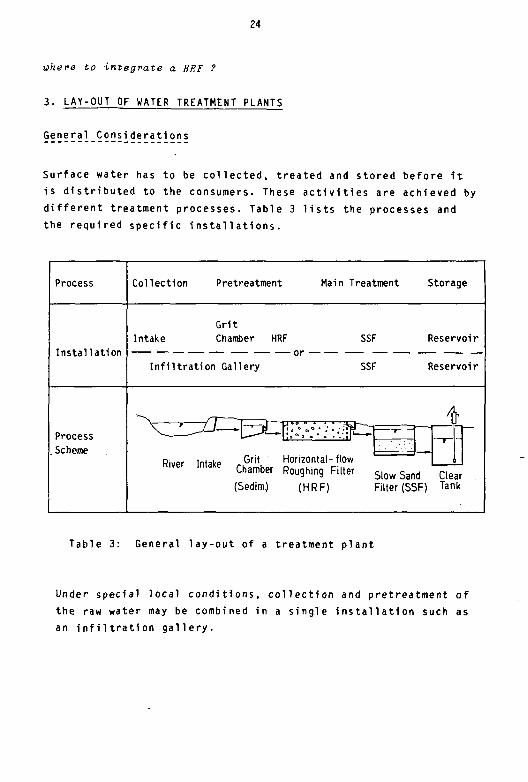
3. LAY-OUT OF WATER TREATMENT PLANTS
GeneralConsiderations
Surface water has to be collected, treated and stored before it
is distributed to the consumers. These activities are achieved by
different treatment processes. Table 3 lists the processes and
the required specific installations.
Process
Insta l la t ion
Process .Scheme
Collection Pretreatment Main Treatment Storage
Gri t Intake Chamber HRF SSF Reservoir
I n f i l t r a t i o n Gallery SSF Reservoir
V_J_-^—~lz^-* :."« . • . . v . : ' — -
River Intake „ G r l t Horizontal-flow Kiver intake C h a m b e r
(Sedim.)
Roughing Filter
(HRF)
r ti
Slow San Filter (SJ
d >F)
i
Clear Tank
Table 3: General lay-out of a treatment plant
Under special local conditions, collection and pretreatment of
the raw water may be combined in a single installation such as
an infiltration gallery.
Page 31
25
All the installations work at free water tables. The total
headloss through the treatment plant, schematized in Table 3,
will be in the order of 2 or 3 m. Gravity flow through
the system can therefore be achieved and pumping steps avoided.
In general, all water lifting devices, apart from handpumps,
should be avoided in order not to depend on energy supplies and
sophisticated spare parts which, in most cases, increase the
unreliability of a system. If water has to be lifted due to
topographical reasons, a 1-stage pumping scheme should be
chosen to pump the raw water to an elevated site where the
treatment plant and the reservoir are located. A 1-stage pump
ing scheme is more advantageous than a 2-stage scheme as it
increases the reliability of the scheme by a factor of 2. In
addition, the risk of flooding in the lowland area may often
not be completely avoided. A high-lift pumping station is more
easily protected from floods than a full-size treatment plant.
The two discussed schemes are illustrated in F1g. 8. However,
the installation of a 2-stage pumping system cannot be avoided
for a piped system in a flat area devoid of natural elevation.
2 stage pumping scheme
1 stage pumping scheme (recommended, if feasible)
Fig. 8 Longitudinal Profiles of Water Supply Schemes
Page 32
26
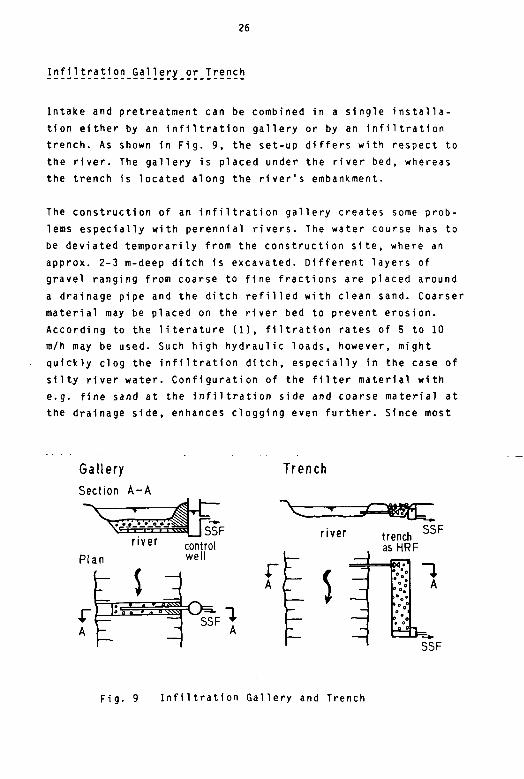
Infiltration Gallery or Trench
Intake and pretreatment can be combined 1n a single Installa
tion either by an Infiltration gallery or by an infiltration
trench. As shown In Fig. 9, the set-up differs with respect to
the river. The gallery is placed under the river bed, whereas
the trench 1s located along the river's embankment.
The construction of an infiltration gallery creates some prob
lems especially with perennial rivers. The water course has to
be deviated temporarily from the construction site, where an
approx. 2-3 m-deep ditch 1s excavated. Different layers of
gravel ranging from coarse to fine fractions are placed around
a drainage pipe and the ditch refilled with clean sand. Coarser
material may be placed on the river bed to prevent erosion.
According to the literature (1), filtration rates of 5 to 10
m/h may be used. Such high hydraulic loads, however, might
quickly clog the Infiltration ditch, especially in the case of
silty river water. Configuration of the filter material with
e.g. fine sand at the infiltration side and coarse material at
the drainage side, enhances clogging even further. Since most
Gallery
Section A - A
Plan
r i v e r control well
A :——==\ S S F 4-
A
Trench
r iver
r A U5
trench asHRF
SSF
—
— • 0
- _a_£
1 A
SSF
Fig. 9 Infiltration Gallery and Trench
Page 33
27
infiltration galleries are not accessible, cleaning and mainte
nance operations are hardly possible. The installation of man
holes might allow flushing of the collection pipe but not effi
cient cleaning of the filter packages. Such galleries are
therefore not recommended for common application and should
only be used 1n special cases.
Infiltration trenches installed along or across the river em
bankment create less structural and operational problems. Most
of the construction work can be carried out under dry condi
tions. The excavated trench is filled with filter material and
operated according to the guidelines valid for HRF. One draw
back might be the variable water level communicating between
river and trench, although smaller filtration rates are of
advantage at flood periods with correspondingly high silt loads.
During cleaning and maintenance operations, the water flow to
the infiltration trench must be stopped either by water-tight
stop logs, in the case of a river intake structure, or by a
valve if the raw water is conveyed to the trench by a pipe. A
regeneration of the filter efficiency by drainage of the infil
tration trench will, however, require additional installations
and equipment such as a drainage well equipped with a high-dis
charge pump.
Finally, pretreated water can also be collected from a river if
a small scale proprietary filtration unit is burried into the
river bed and the water pumped to the SSF. Practical experience
(10) with such installations reveal the main drawbacks. The
need of a relatively powerful pump and fairly frequent mainte
nance in the form of backwashings are the main disadvantages of
this system. The use of such small filter boxes should be limited
to exceptional circumstances, e.g. emergency water supply for a
refugee camp.
Page 34
28
Removal of Coarse Material
Floating matter might block and damage the water supply
installations. Therefore, this undesirable material is retained
right at the beginning either by screens or by a scum-board.
The latter is applicable only at a constant water level intake.
Screens, as illustrated in Fig. 10, are therefore commonly used
for the removal of coarse floating matter. Water abstraction
below the water surface by a floating intake is another alter
native.
Flowing surface water might also carry solide of different
sizes, varying from coarse sand and silt to fine clay. By
sound location of the intake structure or installation of a
guide dam, as sketched in Fig. 11, coarse and fine solids are
separated to a certain degree. Since silt accumulation at the
intake causes operational difficulties, the intake should be
located at a rivier bend's erosion side.
Section F i g . 10 Screen
rake for
manual cleaning
P l a n
Section
F i g . 1 1 L o c a t i o n Of I n t a k e natural river bend art i f ic ia l bend
Page 35
29
The separation of coarse solids from the water is carried out
preferably by a high-load sedimentation tank since sludge
removal from such a tank is less troublesome than from HRF. The
design values listed in Fig. 12 are applicable for the removal
of coarse solid particles larger than approx. 50 urn, or 20 p m
respecti vely.
Earth basin as sedimentation tank
Plan access for cleaning \ M ' I ' I ' I ' I ' I ' I ' I ' /y
/ I • ! • I • I • I .1 • I • I .VKI
w
/'particle ~ 2.6
removal of particles >50um:
surface load s0 = 6m/h
detention time Td = 15Min
removal of particles > 20^m:
surface load s0 = 0.6 m/h
detention time T,j = 2'/2 h
Section perforated distribution pipe
Ef3"1^"-
prefabricated concrete slabs
IK
effluent trough
H ~ 1.5m
L / W ~ 5 -10
F i g . 12 S i m p l e S e d i m e n t a t i o n Tank
One s e d i m e n t a t i o n tank s h o u l d be enough f o r a s m a l l - s c a l e w a t e r
supp ly scheme. The a c c u m u l a t e d s ludge can be removed d u r i n g
p e r i o d s of low s i l t l o a d . A b y - p a s s i s r e q u i r e d i n o r d e r not to
i n t e r r u p t o p e r a t i o n of the t r e a t m e n t p l a n t d u r i n g c l e a n i n g
p e r i o d s . Two or more s e d i m e n t a t i o n u n i t s s h o u l d be p r o v i d e d f o r
l a r g e r schemes.
Page 36
30
Aerati on
The oxygen content of the water plays an Important role
In the biology of the SSF process. The activity of the aerobic
biomass decreases considerably if the oxygen concentration of
the water falls below 0.5 mg/1. Physical processes are the
major mechanisms in HRF. Nevertheless, biochemical reactions do
also occur in the prefilter, especially with water containing a
high organic load.
There is usually sufficient oxygen content in turbulent surface
water. Standing water, however, can exhibit low oxygen contents
and therefore requires to be aerated.
Cross - Section
weir load :
10 I/s • m
H < 70 cm
B > 2/3 H
2
F1g. 13 Cascade
Caeoadee are simple but efficient aeration devices. The
installation of a submerged cascade aerator as described 1n
Fig. 13 should be constructed whenever the natural gravity
allows for such a provision. It should preferably be placed
prior to the HRF 1n order to cope with a possible oxygen demand
of this filter.
The different weirs used for filter control are an additional
source of oxygen supply.
Page 37
31
HRF as Pretreatment
HRF separates the fine solids which are not retained by the
preceding sedimentation tank. The effluent of HRF should not
contain more than 2-3 mg/1 filterable matter in order to meet
the SSF raw water quality requirements. When the required HRF
effluent quality is exceeded, the filter will have to be cleaned
to restore filter efficiency.
HRF mainly improves the physical water quality by removing
suspended solids and reducing the turbidity. Additionally,
bacteriological improvement of the water can also be
expected since bacteria and viruses are solids too, ranging in
size from approx. 10 to 20 urn or 0.4 to 0.02 urn, respectively. Furthermore, the specific literature states that these organ
isms are frequently attached to the surface of other solids
found in water. Hence, a removal of the solids also means a
reduction of the pathogens (disease-causing microorganisms).
HRF efficiency in reducing microorganisms might hypothetically
be of the same order of magnitude as that for suspended solids,
e.g. an inlet concentration of 100 mg/1 can be reduced by a HRF
to say 1 mg/1. The removal ratio for this example amounts to
99% or to a 2 log reduction. Pathogens of a larger size (eggs,
worms) might be removed even further. These hypothetic consid
erations, however, need to be verified in the field since
little practical information 1s available so far.
HRF is meant as pretreatment step prior to SSF. SSF might be
omitted if the bacteriological pollution of the water to be
treated is absent or minimal. This may be the case with surface
water draining an unpopulated catchment area, or where contami
nation of the water by human waste 1s prevented by controlled
sanitation. Permanent or periodic high silt loads in the surface
water, however, might call for physical improvement of the
water. Excessive amounts of solids 1n the water result in a
silting-up of pipes and reservoirs. In view of such technical
considerations, HRF may be used without SSF if the bacteriolo
gical water quality level 1s acceptable, i.e. containing less
than 100 E.coli/100 ml.
Page 38
32
Operational aspects call for at least 2 HRF units to be in
stalled in a treatment plant. Manual cleaning and maintenance
work may take some time during which the remaining HRF unit(s)
is (are) operated at higher hydraulic loads. A single HRF unit
might be appropriate for small water supply schemes treating
water of periodically low turbidity.
S S F a s M a i n T r e a t m e n t
SSF is supposed to remove the finest impurities found in the
water and is therefore placed at the end of the treatment line.
The filters act as strainers since the small suspended solids
are retained at the top of the filter in the pore system of the
fine sand. However, the biological activities of the filter are
more important than this physical process. Solid and dissolved
organic matter causes oxygen depletion when decomposing. The
SSF biology turns the organic material into stable inorganic
products. Even more important from the hygienic point of view
is the substantial reduction of bacteria and viruses by the
SSF. Oxidation of the organics as well as separation of the
pathogens is mainly performed by the biological layer located
on top of the filter bed, the so-called "Schmutzdecke", and in
the additional 30-40 cm of the sand bed. A SSF will produce
hygienically safe water once this layer 1s fully developed.
Unlike HRF, the time for SSF cleaning is not determined by the
deterioration of the effluent quality but by the achievement of
the maximum available headloss. This is of some advantage as
the determination of a hydraulic criteria 1s easier than that
of a quality parameter.
Additional information on SSF Is summarized in Appendix 5.
However, details concerning the design and construction of a
SSF are referred to in a special manual ( 1 ) .
Page 39
33
Water Disinfection
A SSF with a wel1-developed biological layer produces hygieni-
cally safe drinking water. Any further treatment such as disin
fection of the water 1s therefore unnecessary. Apart from the
water quality aspect, numerous examples from many developing
countries reveal that a reliable disinfection is practically
impossible in small water supply schemes. An uninterrupted
supply of mostly imported chemicals and the accurate dosage of
the disinfectant are the main practical problems encountered in
developing countries.
If water is disinfected, it is also possible to use the water
produced in the initial operation phase of a SSF. Furthermore,
the chlorine acts as a safe-guard against pathogens introduced
by secondary contamination, i.e. either in the distribution
system or at the consumer's side. Bleaching powder or a sodium
hypochlorite solution are commonly used as disinfectants.
A more judicious measure than preventive disinfection is the
production of an acceptable water quality level and the imple
mentation of a general health education programme including
special training in water handling.
Water_Storage
SSF is either operated at a constant filtration rate for 24
hours/day or at a declining filtration rate at night. Smaller
filter units and a continuous supply of nutrients and oxygen to
the biological layer are, besides water quality aspects, the
main reasons why SSF should not run intermittently. HRF is less
sensitive to such operational variations, although careful
restarting of filtration should be observed in order not to
resuspend the solids accumulated in the filter. As daily water
demand is more or less concentrated 1n 2 peaks, a storage volume
of approx. 30 to 50% of the daily treatment capacity has to be
provided to compensate for this uneven demand.
Page 40
34
Water_Distribution
For the water to reach the consumers, installation of a piped
gravity system might be considered if the economic conditions
and local topography are favourable. However, an increased
water demand resulting in a possible overload of the treatment
plant and in serious drainage problems in the housing area of
the community might be the consequence of such a distribution
system.
In many situations, however, the economic as well as the topo
graphic conditions do not enable a piped gravity system. Dif
ference in altitude can be overcome by water lifting. However,
pumps require additional investment and operation costs but
energy in particular - an aspect which will gain increasing
importance in the future. Pumped systems should therefore be
limited to special situations.
The walking distance between house and water source is more
important to the water consumer than the water quality. Conse
quently, a new water source has to compete with the traditional
source and bring the water nearer to the users. Treated river
water as a new source will be accepted for instance if the
original walking distance to the river is significantly reduced.
A semi-piped system equipped with handpumpe is a judicious
choice and best combination of the different aspects discussed.
The treated water could be distributed by gravity to different
water cisterns placed between treatment plant and village. The
cisterns would not only act as reservoirs but also as water
points. The energy supplied by the consumers operating the
handpump keeps the system running and greatly contributes
towards reducing the operation costs.
Fig. 14 illustrates a possible water treatment plant lay-out
independent of any foreign chemicals or energy supply.
Page 41
35
>
i JA/-uLL
Fig. 14 Lay-out of a Water Treatment Plant for 60 m 3/d
(2000 people at 30 1/c-d)
Page 42
36
Note:
- design your treatment plant for gravity flow
- avoid whenever possible any pumping
- if pumping is unavoidable, install a semi-
piped system equipped with handpumps or at
most a one-stage pumping and distribution
scheme
- trenches excavated along the embankment
are more suitable for river water infiltra
tion than infiltration galleries
- coarse material is separated by screens,
scum-boards and high-load sedimentation
tanks
- cascades should be introduced in front of
the filters to aerate in particular standing
surface water
- HHF is a physical filter which mainly
removes the solid matter
SSF is a biological filter which reduces
organias, bacteria and viruses
Page 43
37
how to construct a HRF ?
4. HRF CONSTRUCTION
As a matter of principle, local material, manpower and communi
ty participation should be used whenever possible in the con
struction of any water supply scheme. The installations should
be simple, sturdy and of good finish, as well as maintainable
with local means. The lay-out should facilitate both operation
and mai ntenance.
Filter Box Location
HRF can generally be located below or above ground level as
illustrated in Fig. 15. The choice of the HRF type depends on
the hydraulic profile, soil characteristics and available con
struction material. In a flat topography, gravity flow often
requires the structures to be placed below ground level. A
partially burled HRF has the advantages of requiring less exca
vation work, of providing support to the side walls by the
back-filled soil and of presenting greater protection against
dust and sand.
HRF with side walls above the ground surface
HRF with partially buried side walls
HRF below ground surface
stone masonry
reinforced concrete ~~^-^
bricks or blocks
prefabri cated slabs
Fig. 15 Location and Materials of HRF Boxes
Page 44
38
The most modest box consists of a trench excavated 1n an imper
vious soil such as clay, silt or laterite. The ditch has in
clined side walls not exceeding the slope stability of the
water-saturated soil (slope approx. 1:1).
Lining of the base and the side walls of such a basin prevents
the mixing of clean filter material with the underground. The
type of lining depends on the degree of soil impermeability and
stability to be investigated in the design phase. A layer of
sand, prefabricated slabs, in-situ applied coatings (concrete
lining, ferrocement, lime mortar) or, in emergency cases (e.g.
refugee camps), prefabricated plastic can be used as lining
material. A watertight box has to be constructed if the under
ground is permeable or if the filter is Installed above the
ground surface. In such cases, vertical side walls are recom
mended. Burnt clay bricks with a cement mortar lining, concrete
bricks or reinforced concrete are the filter box's building
materials.
In order to avoid cracks in the box resulting from uneven set
tling of the soil, construction of the foundation and the floor
of the box require special attention. Finally, dilatable joints
will eventually be necessary in long filter boxes constructed
with material prone to shrinking or the HRF can alternatively
be divided into two interconnecting compartments. Another alter
native to reduce the total length of the filter box 1s the
design of a U-shaped unit. In and outlet are on the same filter
side and the filter box 1s divided by a longitudinal separation
wall into two equal parts.
The filter box should be tested for watertightness, preferably
before it 1s filled with filter material, as leakages are more
easily detected and repaired in empty structures.
Page 45
39
Fi1ter Material
The filter material should have a large specific surface in
order to enhance the sedimentation process taking place in the
HRF. Furthermore, it should provide high porosity necessary for
the accumulation of the separated solids. Generally speaking,
any inert, clean, insoluble and mechanically resistant material
fulfilling the above two criteria can be used as filter medium.
Filtration tests revealed that neither the surface roughness
nor the shape or structure of the filter material have an ap
preciable influence on filter efficiency.
The following filter material can for instance be used:
- gravel from a river bed or present in soils
- broken stones or rocks from a quarry
- broken burnt bricks made of clay
- plastic material either as chips or as modules,
e.g. used in trickling filters (self-reliance as regards
the use of locally-available material is no longer con
sidered here; attention should be paid to the uplift
forces of the water)
- possibly burnt charcoal (risk of disintegration
when cleaning the filter material)
- possibly coconut fibre (risk of odour nuisance
during longer filter operation periods)
A HRF is composed of 3 to 4 differently sized filter fractions
which range from coarse to fine. The coarse and most of the
finer suspended solids are removed by the first filter pack. A
large pore volume should therefore be provided in this part of
the filter. This 1s best achieved by locating a coarse filter
material along a substantial part of the filter length. The
subsequent filter material is of finer size and the packs of
shorter length. The last filter fraction should only resume
polishing functions as 1t is supposed to remove the last traces
of the finest suspended solids found in the water.
Page 46
40
Table 4 lists some general guidelines for the size and
length of the different filter fractions. These guidelines
should not be too rigidly applied. However, the average size of
the aggregates should not be smaller than 4 mm to enable regen
eration of the filter efficiency as described in Chapter 5.
filter
fraction
approx. size of
filter material
approx. length of
filter fraction
first
second
third
fourth
15 - 25 mm
10 - 20 mm
5 - 15 mm
3 - 8 mm
3 - 5 m
2 - 5 m
2 - 4 m
1 - 3 m
*) can possibly be omitted
Table 4: Size and Length of Filter Material
The Asian Institute of Technology (AIT) in Bangkok has also
carried out some investigations on HRF. The authors of (3,4)
recommend the installation of 6-8 small gravel layers. The
gravel size should subsequently be reduced from 20 to 2.5 mm,
and thereafter increased again to 25 mm. No advantage can be
gained by locating the smallest gravel fraction 1n the centre
of the filter bed since the following gravel packs have by
nature a lower removal efficiency.
When choosing filter material size, practical aspects such as
the availability of specifically sized material from a quarry
is also an important criteria. F1g. 16 Illustrates 2 simple
possibilities of on-site sieving installations if graded filter
material 1s not available.
Page 47
41
In order to remove all loose and dirty material from the sur
face of the filter, the aggregates should be washed thoroughly.
If this recommendation is not observed, the HRF's initial ef
fluent quality will be poor and result in a rapid clogging of
the SSF.
wooden logs as support
fixed sieve installation
swinging sieve installation
Fig. 16 On-site Sieving Installations
Separation Walls
The different filter fractions should be separated from each
other in order to avoid mixing of the aggregates during manual
cleaning of the filter. Burnt brick or cement block walls with
open vertical joints are best suited for such a separation. The
total area of the open joints should idealy cover 10 to 20% of
the total filter cross-section area, and be equally distributed
over the entire cross-section in order to maintain even flow
throughout the HRF. Prefabricated perforated bricks or blocks
(e.g. holes 8 3 cm, spacing 5 x 5 cm) or loose rubble could be
installed as an alternative to the open joints. Finally, wooden
boards might be used to separate the different gravel fractions.
In loose or weak separation wall structures, the filter material
should be filled simultaneously on both sides of the wall.
Page 48
42
In and Outlet Structures
Even distribution of the raw water and abstraction of the trea
ted water, flow regulation and water level control as well as
separation of coarse settleable and floating matter at the
filter inlet are the objectives of the in and outlet structures.
Examples are illustrated in F1g. 17.
Inlet distribution inlet
channel chamber ~i possibly
Outlet outlet chamber
gauging rod fixed weir for
flow control
60 cm drainage
F i g . 17 I n and O u t l e t S t r u c t u r e s of HRF
I f w e i r s o v e r f l o w of a p p r o x . 30 cm h e a d l o s s can be I n s t a l l e d i n
t h e h y d r a u l i c p r o f i l e of t h e t r e a t m e n t p l a n t , t h e 1n and o u t l e t
a r e p r e f e r a b l y e q u i p p e d w i t h V - n o t c h w e i r s f o r f l o w c o n t r o l .
The V - n o t c h w e i r a t t h e o u t l e t can be r e p l a c e d by a f i x e d
e f f l u e n t p i p e 1n t r e a t m e n t p l a n t s w i t h minimum a v a i l a b l e
h y d r a u l i c heads .
Page 49
43
Even distribution of the flow over the full filter's cross-
section area is achieved by an inlet chamber. The separation
wall between this compartment and the first filter package
should contain openings in its middle part as shown in Fig. 17.
A solid wall at the bottom and at the top respectively, hinders
penetration of coarse settled solids or floating matter into
the filter. The minimum width of the Inlet chamber should not
be smaller than 80 cm to ease cleaning.
A similar outlet chamber is Installed at the effluent side.
However, the openings in the separation wall located after the
last filter package are distributed all over the filter's
cross-section.
A weir or an effluent pipe maintains the water table of the
filter outlet zone at a specific level. The progressively In
creasing filter resistance must be accommodated within the
filter bed. For this reason and to avoid mosquito breeding, it
is necessary to fill filter material up to approx. 30 to 40 cm
above the weir's level.
Drainage System
Drainage facilities, as Illustrated 1n Fig. 18, are required
for filter cleaning and filter efficiency regeneration (see
Chapter 5 ) . For manual cleaning of the filter medium, a
drain, placed in the outlet chamber, enables complete drainage
of the filter box. The filter bottom should thereby be slightly
inclined by 1 to 2 % in the direction of flow. A side effect of
this proposed slope is the saving of some filter material.
Hydraulic cleaning consists of a fast filter drainage and
a slow refilling of the filter with water. Drainage facilities
such as perforated pipes, troughs or culverts enable hydraulic
cleaning of the filter medium. The system is placed perpendicu
lar to the direction of flow at the filter bottom. The spacing
between the drains should amount to about 1-2 m. The hydraulic
Page 50
44
capacity of these Installations should permit an initial verti
cal filter drainage velocity of 60-90 m/h necessary for effi
cient cleaning. Valves, slide gates or flexible hose pipes can
be used to operate the drainage system. Each drain should dis
charge into an open channel to allow visual supervision of any
drainage operation. Facilities for safe washwater disposal are
necessary to prevent erosion and water ponding.
longitudinal section HRF
drainage points spacing 150-200cm
a) perforated pipe with valve
b) semi-covered trough with slide gate
gravel pack for small aggregates o—^,^
150mm
holes ^6 mm spacing
1100 mm
floor of filter box
30cm
C) prefabricated culvert with slide gate
50 cm .
1 \-^Wv^^-E 10cm
Fig. 18 Drainage Systems
Page 51
45
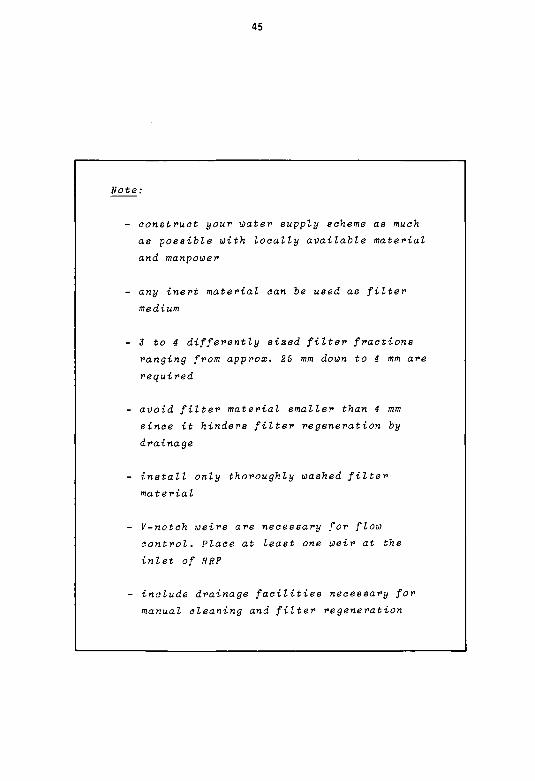
Note:
- construct your water supply scheme as much
as possible with locally available material
and manpower
- any inert material can be used as filter
medium
- 3 to 4 differently sized filter fractions
ranging from approx. 25 mm down to 4 mm are
required
- avoid filter material smaller than 4 mm
since it hinders filter regeneration by
drainage
- install only thoroughly washed filter
material
- V-notch weirs are necessary for flow
control. Place at least one weir at the
inlet of HRF
- include drainage facilities necessary for
manual cleaning and filter regeneration
Page 52
46
how to operate and maintain a HRF ?
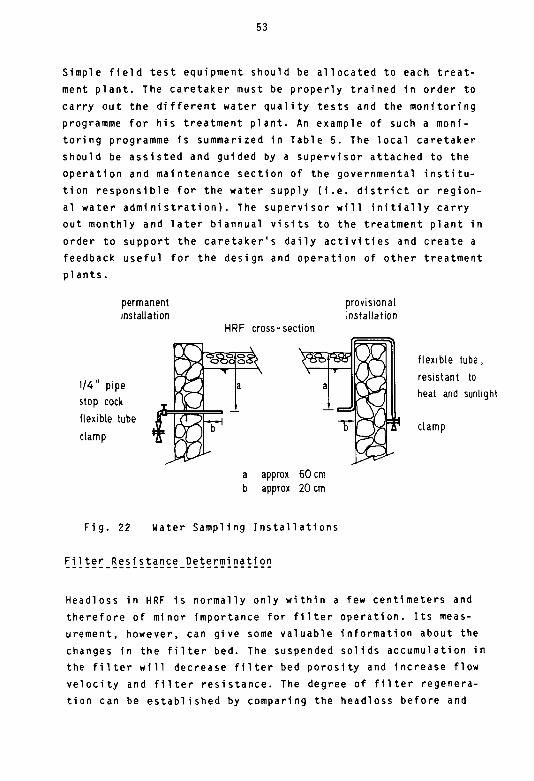
5. HRF OPERATION AND MAINTENANCE
HRF can easily be operated and maintained by trained local
caretakers. It does not depend on external inputs provided the
necessary materials and tools are available. The daily activi
ties of the caretaker are preferably supported by occasional
visits of a supervisor attached to the operation and maintenance
section of the governmental institution responsible for the
water supply sytem. Important maintenance work should be car
ried out at the time when village participation can be involved.
This is of particular importance as regards manual cleaning of
the HRF.
Commissioning of_the_F1 l^ter
Filter operation should only start when construction work 1s
totally completed. The efficiency of a HRF filled only partial
ly with gravel will be poor as the unit will not act as a fil
ter but as an inadequate sedimentation tank. Emphasis should
therefore be placed on a good finish of the construction work
including the installation of proper flow control and drainage
facilities as well as a full supply of filter material. Before
starting filter operation, it is recommended to wash the in
stalled filter material by drainage. The filter unit should be
filled with water up to the effluent's weir level at low flow
rates of 0.5-1 m/h. Thereafter, the water should be drained off
through the first drainage installation located next to the
inlet. Any dust on the surface of the filter material is rinsed
to the filter bottom. The Impurities accumulated around the
drainage system will be flushed out of the filter. This proce
dure should be repeated if necessary 2 to 3 times by changing
the point of drainage from filter inlet to filter outlet side.
Filter cleaning will prevent dust from penetrating Into the
fine gravel fraction which would otherwise increase the Initial
filter resistance. Operational check of the complete drainage
system is a positive side effect of the described cleaning pro
cedure.
Page 53
47
Flow Pattern
A 24 hours (per day) continuous filter operation makes the best
use of the installations, provides maximum production and a
constant flow pattern. However, full gravity flow will be re
quired for such an Ideal situation.
If pumping is necessary, the treatment plant can be staffed for
8 or 16 hours a day, depending whether 1 or 2 shifts are avail
able. For quality reasons it is not recommended to operate SSF
intermittently. In order not to affect the biological activi
ties in the SSF, this filter can be operated at declining fil
tration rate during the unstaffed period of the day. This means
1n practice that at night the stock of supernatant water is
drained through the filter at continuously declining flow rate.
During the morning hours, the filter has to be refilled with
pretreated water to resume normal operation. Such an operation
calls for special provisions since water must be supplied inter
mittently and at higher rates during the day.
HRF acts as physical filter and therefore does not depend like
SSF on a continuous supply of nutrients. Hence, intermittent
operation is possible without a marked deterioration of the
filtrate, provided smooth restarting of filter operation is
observed. Due to the relatively small water volume stored in
the HRF, it is not reasonable to operate HRF at a declining
filtration rate just for the sake of maintaining the SSF at a
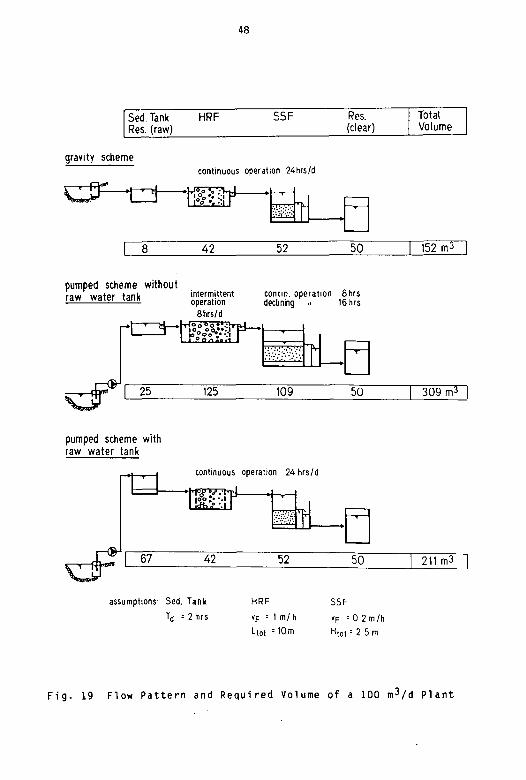
constant filtration rate. The most favourable option in a pumped
scheme is the introduction of a raw water balancing tank which
allows continuous filter operation. The different possibilities
as regards the design of the required volume of a 100 m^/d
plant are illustrated in Fig. 19.
It can be concluded that for operational and economic reasons,
it is recommended to continuously operate a HRF-SSF plant at
constant filtration rates for 24 hours/day. In case of a pumped
scheme, a raw water balancing tank is required. Removal of the
coarse solids is a positive side effect of such a tank.
Page 54
48
Sed. Tank HRF Res. (raw)
SSF
gravity scheme continuous operation 24hrs/d
I'o '• - '
Res. (clear)
42 52 50
Total Volume
152 IT>3
pumped scheme without raw water tank option'"'
8hrs/d
contin. operation 8 hrs declining •• 16 hrs
rtZZSH
- »
H^g 25 125 109 50 309 m^
pumped scheme with raw water tank
67
continuous operation 24 hrs/d
• h l ^ T T M
• 42 52 50
assumptions: Sed. Tank
Td = 2 hrs
HRF
vp = I m / h
L(ot = 10 m
SSF
vF = 0.2m/h
H(0 t : 2.5 m
211 m3 |
F i g - 19 Flow P a t t e r n and R e q u i r e d Volume of a 100 m V d P l a n t
Page 55
49
Flow Control
Unlike SSF, which requires gradual opening of the valve at the
effluent line to compensate for progressive headloss, HRF is
hydraulically controlled by a flow control device at the inlet
and by a fixed weir at the outlet as illustrated and recommended
in Fig. 5. In gravity schemes, constant feeding is maintained
by a more or less fixed position of the valve in the supply
pipe and a subsequent overflow in the distributor box. In pumped
schemes with a raw water tank, the flow to the HRF is regulated
by a mechanical flow rate device as shown in Fig. 7. These two
main possibilities are illustrated in Fig. 20.
The discharge is measured either by fixed installations such as
V-notch weirs or by transportable equipment as described in
Appendix 3. The flow rate through each HRF should be controlled
daily if V-notch weirs are provided, or at least twice a week
in the case of transportable equipment.
gravity scheme
valve inlet box I with overflow
distributor box
Sedimentation Tank
Raw Water Tank
li hh mechanical flow-rate
device
HRF
HOO o% V H T J
distributor box
pumped scheme
Fig. 20 Raw Water Flow Control and Distribution
Page 56
50
Water Quality Control
The degree of bacteriological contamination is the most impor
tant quality criteria for drinking water. However, improvement
of the bacteriological water quality greatly depends on the
turbidity of the water. Turbidity and bacteriological contami
nation of the water are therefore the main parameters for the
characterization of a rural surface water. As a consequence,
the first objective of any basic treatment method is the im
provement of these two parameters.
The treatment combination HRF-SSF meets this objective since
HRF is mainly used to separate the suspended solids or to re
duce raw water turbidity. The pretreated water is subsequently
treated by SSF which significantly improves the bacteriological
water quality. While turbidity measurements play a major role
1n HRF monitoring, the SSF efficiency is mainly established by
bacteriological tests.
Bacteriological water quality control requires special equip
ment and generally also the infrastructure of a laboratory.
Well-trained and experienced staff are essential for a reliable
analysis. Routine bacteriological water quality control of
rural water supply schemes is in many cases far beyond the
capacity of the responsible institution and therefore mostly
restricted to random tests. A well-operated SSF is a stable and
reliable water treatment unit not requiring frequent bacterio
logical tests. In practice, the frequency of these tests can be
reduced to a minimum once the bacteriological efficiency of the
SSF is established.
Turbidity measurements are simpler and can therefore be
handled by the local caretaker of the treatment plant. Weekly
records and, at periods of high turbidity, daily measurements
enable
- to characterize the raw water quality
Page 57
51
- to establish and monitor the HRF (and SSF)
performance
- to develop operational criteria for HRF (i.e.
schedule for filter regeneration/cleaning)
- to optimize the HRF lay-out (i.e. replacing of
f11ter material)
Turbidity measurements, although theoretically simple, might be
difficult to carry out in rural areas on a regular basis. Trans
port and communication problems, the fragility of delicate
instruments and the difficulties in commodities supply (i.e.
batteries, standards) are aspects leading to possible failures
1n the execution of even a simple turbidity monitoring pro
gramme.
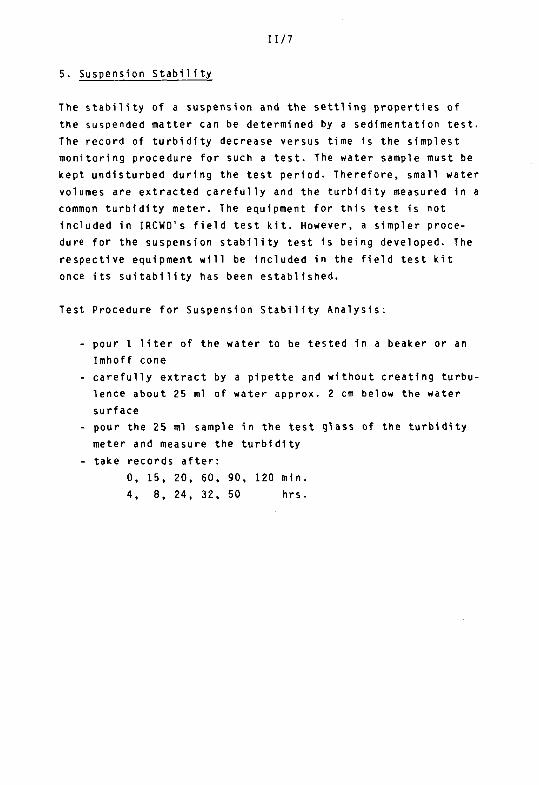
Sturdy, simple field test methods for the characterization of
mainly physical properties have therefore been developed to
meet the actual field conditions. The different methods de
scribed in Appendix 2 do not produce absolute but relative val
ues which are, however, a useful tool for water quality descrip
tion of any specific treatment plant.
A simple turbidity teet tube developed by DelAgua (10) replaces
the common turbidity meters which are usually dependent on
power supply. The visual method depends on the sensitivity of
the eye and hence, is not as accurate as electronic systems,
especially in the high turbidity range. The lower practical
limit of the tube amounts to 5 TU (Turbidity Units) and there
fore covers the turbidity range required by SSF.
The filtvability teet roughly indicates the amount of
suspended solids 1n the water and can therefore be used in
place of the standard method for the determination of the sus
pended solids concentration which requires a highly accurate
Page 58
S2
ba lance , a vacuum pump and a d r y i n g fu rnace i n an a i r - c o n d i
t i o n e d room. Fu r the rmore , m o d i f i e d Imhoff cones are used f o r
the d e t e r m i n a t i o n of the s e t t l e a b l e s o l i d s volume.
The et ibility test g ives some i n f o r m a t i o n on the s e t t l i n g
c h a r a c t e r i s t i c s of the c o l l o i d a l mat te r and on the s t a b i l i t y of
the suspens ion . The r e s u l t s of t h i s t e s t not only r e f l e c t the
s i ze and sur face p r o p e r t i e s of the s o l i d s but a lso the chemica l
and o rgan ic compos i t i on of the wa te r . Adso rp t i on of Ca^+
and Mg2+ ions on suspended s o l i d s sur faces may d e s t a b i l i z e
a suspens ion , w h i l e humic substances have been r e p o r t e d to
i n c r e a s e , in many i n s t a n c e s , the s t a b i l i t y of a suspens ion .
Water samples should be drawn from the raw water and f rom
the i n and o u t l e t s of the f i l t e r s as i n d i c a t e d i n F i g . 2 1 .
A d d i t i o n a l sampl ing p o i n t s are r e q u i r e d to o p t i m i z e by a p o s s i
b le exchange of g rave l s i ze the HRF l a y - o u t a l r eady i n ope ra
t i o n . Sampling tubes i n s t a l l e d a t the end of the d i f f e r e n t
f i l t e r l aye rs as i l l u s t r a t e d i n F i g . 22, enable to examine the
e f f i c i e n c y of the i n d i v i d u a l f i l t e r l a y e r s . Water sampl ing f rom
these tubes should be c a r r i e d out w i t h spec ia l care i n o rde r
not to resuspend the depos i t s around the sampl ing p o i n t which
would o the rw ise lead to i n a c c u r a t e r e s u l t s . Oropwlse sampl ing
i s recommended, however, the f i r s t tube of sampled water volume
must be d i sca rded be fo re s t a r t i n g the ac tua l samp l i ng .
River Sed. Tank HRF SSF
I I I I Sampling • • • • points
additional • j * = = sampling j j points J J
I _
Fig. 21 Location of Sampling Points
Page 59
53
Simple field test equipment should be allocated to each treat
ment plant. The caretaker must be properly trained 1n order to
carry out the different water quality tests and the monitoring
programme for his treatment plant. An example of such a moni
toring programme 1s summarized 1n Table 5. The local caretaker
should be assisted and guided by a supervisor attached to the
operation and maintenance section of the governmental institu
tion responsible for the water supply (i.e. district or region
al water administration). The supervisor will initially carry
out monthly and later biannual visits to the treatment plant in
order to support the caretaker's daily activities and create a
feedback useful for the design and operation of other treatment
pi ants.
permanent installation
provisional installation
HRF cross-section
1/4" pipe
stop cock
flexible tube
clamp
flexible tube,
resistant to
heat and sunlight
clamp
a approx 60 cm b approx 20 cm
Fig. 22 Water Sampling Installations
Filter Resistance Determination
Headloss in HRF 1s normally only within a few centimeters and
therefore of minor importance for filter operation. Its meas
urement, however, can give some valuable information about the
changes in the filter bed. The suspended solids accumulation in
the filter will decrease filter bed porosity and Increase flow
velocity and filter resistance. The degree of filter regenera
tion can be established by comparing the headloss before and
Page 60
S4
after hydraulic filter cleaning. A continuous headloss increase
in one part of the filter bed indicates premature clogging of
the respective fraction and consequently the need for manual
cleaning.
Total filter resistance can easily be determined by measuring
the free water surfaces in the in and outlet chamber of the
HRF. The effluent's weir crest level might be used as reference
(0-level). Gauging rods fixed to the walls o( these two cham
bers will facilitate the respective measurements. Attention
must be paid when calculating the real filter resistance, i.e.
the difference in level of the two gauging rods. The outlet
gauging rod also indicates the flow height over the V-notch
weir and can therefore be used as flow control. Fig. 23 illus
trates the different headlosses of a HRF.
Fig. 23 Headloss Recording System
inlet
v-notch weir
filter
0.0 (effluent weir level)
Outlet
J l ^ IF] ii [i rfc"" " t " k''
TH a§ ^
filter resistance AH = Hjn-Hout
flow rate (effluent weir discharge) Hout
total headloss in HRF &H10l=Hin * Hwl* Hw2
F i g . 24 P i e z o m e t e r s a approi 60 cm
b approi 1-2"
c approi 20 cm
Page 61
55
The installation of additional recording points at the end of
each filter fraction is recommended for additional control of
the HRF. As already mentioned, the headloss data recorded at
these additional points are used to determine the regeneration
efficiency and detect premature clogging. The piezometers
illustrated in Fig. 24 are utilized for this purpose. Careful
recording of the water table is important since the difference
in head between the subsequent filter layers is usually only
within a few millimeters or centimeters. Hence, firmly fixed
tubes should be chosen to avoid subsequent changes in level
which could lead to inaccurate measurements.
Filter resistance might become the decisive criteria for hy
draulic or manual cleaning if the water level reaches the top
of the filter material. A free water surface on top of the HRF
can never be tolerated since filter efficiency will dramatical
ly drop due to short-circuiting of the water.
Table 5 Field Monitoring Programme
record/parameter frequency
flow rate HRF + SSF
filter resistance HRF
filter resistance SSF
every 2 days
1 x / week
every 2 days
turbi di ty
filtrability
of raw water
and effluents
of HRF and SSF
(at high turbidity
filtrate of each
HRF gravel pack)
2 x / week
(daily at pe
riods of high
turbidity)
settleable solids raw water 1 x / week
Page 62
56
Filter Cleaning
Filter efficiency decreases with progressive accumulation of
solid matter in the filter. Hence, periodic removal of this
accumulated matter restores filter efficiency and keeps the
filter in good running condition. A HRF can be cleaned in two
ways, either hydraulically or manually.
Hydraulic cleaning assists the mechanisms of $elf-regeneration
already discussed and illustrated in Fig. 4. The natural drift
of accumulated matter towards the filter bottom can be enhanced
by filter drainage. The retained solids are washed down when
the water level in the filter is lowered. The upper part of the
filter bed is thereby cleaned and regenerated while an addi
tional accumulation of solid matter takes place at the filter
bottom. These solids can be flushed out of the filter by an
adequate drainage system (examples are given in Fig. 18) at
initial drainage velocities ranging preferably between 60 and
90 m/h.
It is very important to start the cleaning procedure at the
inlet side as most of the solids are retained in this part
of the filter. An initially vigorous drainage at the rear of
the filter would wash the bulk of solids towards this drainage
point and enhance the risk of clogging of the fine filter part.
Furthermore, full drainage of the HRF at one single point
is equally important as 1t flushes out the accumulated matter
1n the vicinity of the drainage point. The drained HRF is there
after refilled with water and redrained at the same drainage
point if the solids have not been completely washed out in this
filter part. This is visible by the high turbidity of the
drained water. At low washwater turbidities, the next point
should be drained using the same procedure.
When refilling the HRF, attention must also be paid not
to drag to the fine filter part the solids accumulated at the
filter bottom. Moderate flow rates must therefore be applied
Page 63
57
and may be increased during refilling. If an efficient drainage
system is available for complete wash-out of solids, the HRF
can be filled only partially with water as most of the solid
matter will be rinsed towards the filter bottom after 2 or 3
full drainages.
In case a special drainage system is not installed, partial
filter efficiency regeneration can still be achieved when the
ordinary drain, preferably at the inlet chamber, is used. If
only a single drain is provided at the HRF outlet, lower drain
age velocities in the range of 10 to 20 m/h should be observed
to prevent blockage of the fine filter material.
Filter cleaning frequency greatly depends on the raw water
characteristics, filter lay-out and operation. Most of the
solid matter (80-90%) of tropical surface water usually con
sists of stable inorganic material. Since this type of material
does not change the chemical properties of the water passing
through the filter, it can therefore be stored in the HRF with
out negative effects. However, high levels of organic matter
call for frequent and regular cleaning to avoid decomposition
of the organics in the filter and prevent water quality dete
rioration in terms of taste and odour. Nevertheless, regular
hydraulic cleaning is advisable since it enhances filter effi
ciency and reduces sludge compaction and frequency of manual
fi1ter cleani ng.
The annual hydraulic cleaning schedule has to be adapted to
the annual fluctuation of the raw water quality. High turbidity
loads are preferably treated by relatively clean filters to
prevent a breakthrough of the solid matter which would other
wise affect SSF operation. It is therefore recommended to
thoroughly clean the HRF before peak loads (e.g. before the
start of the rainy season). Hydraulic cleaning can be handled
by the caretaker and does not normally require external assis
tance (e.g. community participation). Therefore, the annual
working plan of the community does not influence the hydraulic
cleaning schedule.
Page 64
58
The time Interval between two hydraulic cleanings can also be estimated by a mass balance of the solid matter. The amount of retained solids is the difference in mass between in and outlet. "RF should be cleaned hydraulically at a filter load of 10 g per liter filter volume as filter efficiency decreases progressively thereafter. The suspended solids concentration strongly influences the turbidity, and these two figures i r e frequently of the same order of magnitude. Since the bulk of the suspended solids is retained by the first filter fraction, the load on this filter section becomes the decisive criteria for hydraulic cleaning. In order to determine the running time, the following equation was established on the basis of the above mentioned assumptions:
T r u n - 1 , 0 0 ° ' i C 0 - ' c * ) . v F l O ' O O O ' <V V-v
T „ (h) time interval between two cleanings run a (g/1) average filter load L, (m) filter length of the first filter fraction
C , C (mg/1) susp. solids cone. at the beginning and at the end of the
T o ' Te (TU) turbidity first filter fraction
(m/h) filtration rate
For example, a 10 m-long HRF operated for example at 0.5 m/h with a turbidity reduction of 300 TU in the 4 m of the first filter fraction needs to be hydraulically cleaned every 11 days during the rainy season. At dry periods of low turbidity, when turbidity reduction in the first filter part might amount to 50 TU, the first 4 m of the same filter have to be cleaned after 2 months operation.
Page 65
59
The general approach for hydraulic filter cleaning is illus
trated in Fig. 25. However, details regarding the procedure
greatly depend on the specific situation. Each caretaker will
therefore have to establish through practical experience the
optimal procedure and cleaning frequency required by his own
treatment plant. He will certainly be most interested 1n an
efficient hydraulic cleaning since manual cleaning is time-
consuming and labour intensive.
r e f i l l i n g rate
Q F =
I.5Q
1.0 0
0.5 QT V3H 1 ,i—
Of V3H
V3H
outlet
© : y vnocy jjjc-o. P I SO-J tyjmx-XJOiicmuc
0 - design rate for filter operation
©
(T) complete drainage water level
(5) complete refilling water level
1W
t t 1 st 2 nd
s e q u e n c e of
t 3rd
d r a i n a g e
t 4 th
p o i n t s
Fig. 25 Procedure for Hydraulic Cleaning
Manual cleaning must be applied when the solids accumulated
at the filter bottom or, at worst, all over the filter, can no
longer be removed hydraulically. This occurs if a drainage
system is absent under the filter bed, if proper hydraulic
cleaning has been neglected or if solid matter has cohered to
the filter material or at the bottom. A slimy layer might cover
the filter material if there is biological activity in the
Page 66
60
filter caused by high loads of dissolved organic matter 1n the
water. This biological layer will most probably increase the
filter's efficiency at the beginning, but will subsequently
hinder the drift of deposited matter towards the filter bottom.
Accumulated cohesive matter might also hinder self-regeneration
of the filter.
Finally, retained material in silted but drained filter beds
will also dry up and form a skin around the filter material.
Thus, HRF ehould never be kept dry unless the filters are
properly cleaned in advance.
The manual cleaning procedure mainly consists in excavation,
washing and re-installation of the filter material. The
filter material is excavated from a drained filter. The coars
est filter material is normally removed first, cleaned and
thereafter refilled into the filter section. The first part of
the filter material may be stored for awhile, whereas the re
maining material can be washed and directly re-1nstalled 1n
order to save storage space and reduce work. As regards HRF
storage washing storage washing washing storage
HRF with strong separation walls HRF with weak separation walls
Fig. 26 Manual Cleaning Procedure
Page 67
61
with strong separation walls, each filter fraction is generally
handled separately to avoid mixing of material. Simultaneous
excavation of the filter material is necessary 1f the HRF sepa
ration structures are weak, or where these walls are completely
missing. The different procedures are illustrated in Fig. 26.
Section
washwater supply
cleaning box
t 400
Plan
Cross-Section
?n 20 15"
n I51 box
••"
*&y PI
l
2 n d box
^ - S l r-|
i i i i 5̂ 60 15 60 15
drainage channel
storage place
Is1 box for primary cleaning
2"6 box lor final cleaning
approx dimensions not to scale
Fig. 27 Gravel Washing Installation
The washing of the filter material is best achieved by
mechanical stirring of the aggregates in a washwater basin as
mechanical friction rubs the impurities off the aggregates'
surface. Washwater can be saved and a good efficiency achieved
if small filter material loads are stirred with a shovel in a
first tank to remove gross impurities before they are transfer
red to a second tank for final washing. Such a washing instal
lation is sketched in Fig. 27. However, centralized cleaning
involves transportation of the filter material. Use of the open
drainage channel located along the HRF is an alternative to the
washing place since it requires less efforts as regards gravel
movement.
Page 68
62
R e e i e v i n g of the filter material is necessary if mixing of
the different fractions occurred or if the filter medium has
been broken up into smaller pieces due to excavation and me
chanical cleaning. A well specified, uniform size for each
filter fraction is essential to maintain high porosity of the
filter bed. In this context, it is obviously advantageous to
install a mechanically-resistant filter material right at the
begi nni ng.
R e - i n s t a l l a t i o n of the filter material should not create any
difficulties. However, the material should preferably be
brought into the filter right after having been washed in order
to avoid any contamination with dust or other impurities. Dis
integrated material must be replaced in order to refill the HRF
up to its original level. A stock of additional filter material
should therefore be kept at the treatment plant.
Manual filter cleaning involves a great deal of manual work
which is often beyond the caretaker's capacity. Additional
manpower must be mobilized either by contracting local casual
labourers or by involving the community. Careful planning and
organizing is necessary when manual filter cleaning is carried
out with village participation. The cleaning schedule should
for instance not coincide with a period of intensive agricul
tural work.
Adequate material and tools must be provided to enable effi
cient filter cleaning, otherwise maintenance work will become
too tedious and might never be done. Manual filter cleaning
requires shovels, sieves, preferably 2-3 sturdy wheel-barrows,
some wooden boards and buckets. The same material already used
for construction should therefore remain at the treatment plant
or in the care of the local operator at the end of construction.
Page 69
63
Filter Maintenance
Great events often come from little causes. This saying also
applies to HRF maintenance. HRF maintenance is not very demand
ing as the filter does not contain any mechanical parts. Never
theless, maintenance should aim at maintaining the plant in
good condition right from the beginning. External assistance
for maintenance work can usually be avoided if the following
work is carried out properly by the local caretaker:
- periodic upkeep of the treatment plant's premise
(grass cutting; removal of small bushes and trees
which could impair the structures by their roots;
removal of refuse)
- soil protection against erosion (especially surface
water intake structures, the washwater drainage
channels and surface runoff)
- repairing fissures in the walls of the different
structures and replacing the chipped plastering
- application of anti-corrosive agents to exposed
metal parts (V-notch weirs, gauging rods, pipes)
- checking the different valves and drainage systems
and occasionally lubricating their moving parts
- weeding out the filter material
- scumming off floating material from the free water
surface
- washing out coarse settled material (distribution
box, HRF inlet)
- controlling the ancillaries and replacing defective
parts (tools and test equipment)
The term "periodic" does not only apply to the first point
in this check list but to all of them. Proper maintenance of
the treatment plant guarantees long-term use of the installa
tions at low running costs.
Page 70
64
Hote:
etart filter operation only when construc
tion is entirely completed
check the drainage system before starting
operation and wash out any impurities remain
ing in the filter
operate the treatment plant whenever possi
ble for 24 h/d
control daily the flow rate through the
filters and adjust it if necessary
record the filter resistance development
check the quality of the raw water and
filter effluents
apply frequently hydraulic cleaning to
restore filter efficiency
start hydraulic cleaning at the inlet
side and drain the HRF completely
refill the HRF with water at low flow
rates
carry out manual cleaning when the re
tained solids can no longer be flushed
out from the HRF
back up maintenance efficiency by a sup
ply of adequate tools
Page 71
65
what are the costs of a HRF ?
6. ECONOMIC CONSIDERATIONS
That costs depend on locally prevailing conditions, and the
fact that generally valid information on economic aspects can
hardly be assessed, is a very pertinent remark. Filter design,
availability of construction material and type of constructor
(construction by private contractor, national institution or by
community participation in a self-help project) strongly influ
ence the construction costs. Generally applicable, absolute
values are therefore not possible. However, economic aspects of
HRF construction and operation can be compared with other ele
ments of a water supply system. In addition, the different
costs might be subdivided into local and foreign currency
demand.
HB^.^°Gs*!!ySii2D Cost_Structure and_Sp_eci f I c C o s t s
An evaluation of the construction cost structure for different
HRF projects with a design capacity ranging from 70 to 750 m^/dd
and located in Tanzania, Kenya, Indonesia and Australia reveale
rather similar results:
- earthwork and structure approx. 70% of total costs
- filter medium approx. 20% " " "
- piping and accessories approx. 10% " " "
Topography and soil conditions (required excavation work and
type of foundation) as well as type of structure (reinforced
concrete or brickwork) are cost decisive factors for earthwork
and structure. Local availability of filter material in the
required sizes strongly influences the purchase price, i.e. the
supply. These first two cost components have only a little
economy of scale, however, the relative costs for piping and
accessories will decrease with increasing plant size.
The specific HRF construction costs per m^ of installed filter
volume range between US $ 100 and 175 for the evaluated plants
in Tanzania, Kenya and Indonesia. These specific costs are
Page 72
66
exceeded by US $ 600 for the plant 1n Australia. It is, how
ever, not only the smallest in capacity and made of reinforced
concrete but also reflects the prices of a private contractor
in an industrialized country. In developing countries, specific
costs ranging from US $ 150 to 200 /m3 will most probably cover
the HRF construction costs. The construction costs might be
reduced up to 50% in self-help projects where only construction
material has to be paid for.
The specific HRF construction costs per daily m3 water output
depend on the filter length and the applied filtration rate.
For an assumed total filter length of 10 m and a filtration
rate of 1 m/h for 24 h/d, the specific costs per daily capacity
are the following:
total construction costs approx. US S 60-80 /m 3/d
material costs only approx. US $ 30-40 /m 3/d
(e.g. in self-help projects)
H R F a n d S S F S g e c i f l c C g s t C o m g a r i s o n
A SSF cost study made 1n India (11) and based on 1979 prices
revealed specific construction costs of approx. US $ 25-40 /m 3/d
for the considered design range of 70 to 750 m 3 daily capacity.
A material cost estimate 1n the SSF Manual (1) revealed higher
specific costs. For the less expensive SSF options with pro
tected sloping walls or a masonry structure, the material costs
were estimated between US $ 40-60 /m3/d and US $ 160-240 /m 3/d,
respectively. However, the cost estimate for these plants of a
design capacity between 70 and 350 m 3/d also includes the
material costs for small clear water tanks of 20 to 40 m3
volume.
Page 73
67
The two studies also reveal the difficulty in obtaining a gene
rally valid cost indication due to the variable construction
material and labour costs. Therefore, a HRF and SSF-specific
cost comparison might be more appropriate on a bill of quantity
basis. Even such a comparison is greatly affected by the filter
lay-out, i.e filter length and applied filtration rates.
As regards HRF and SSF average filter characteristics, the
volume of the filter medium is of the same order of magnitude.
A capacity of for instance 1 m 3/h requires about 10 m 3 HRF
filter material (if total filter length is 10 m and filtration
rate 1 m / h ) , and about 8.7 m 3 sand and gravel for the SSF (if
sand depth is 1 m, gravel depth 0.3 m and filtration rate 0.15
m / h ) . The filter boxes are also similar 1n size. Based on the
above assumptions, a HRF box of about 16.8 m 3 (if total height
of the structure is 1.5 m and length of in and outlet chamber is
0.6 m ea c h ) , and a SSF box of approx. 16.7 m 3 (if total height
of the structure is 2.5 m) is required.
On the basis of such considerations it can be concluded that
the HRF and SSF construction costs are of the same order of
magnitude. Hence, the addition of HRF will roughly double
the investment costs of a SSF plant.
Treatment P I a n t l n v e s t m e n t s V e r s u s P i g e l i n e Costs
The construction costs of a water treatment plant might repre
sent a high percentage of the total investment costs of a water
supply scheme. Economic criteria besides technical and opera
tional aspects therefore need to be carefully considered before
selecting a water source.
The installation of for example a transport pipeline for clean
water which does not require treatment, might be an economic
alternative to the construction of a treatment plant. On the
basis of equivalent costs, the economic pipeline length in
creases with Increasing design capacity. This means that due to
economic aspects, small water supply schemes ire limited to the
Page 74
68
use of local water sources, whereas larger schemes are more
likely in a position to transport water from a remote place for
the same investment costs as required for a treatment plant.
For correct economic evaluation, the annua] operation and main
tenance costs have to-be added to the annual capital recovery
costs. However, operation and maintenance costs are highly
variable and a general estimate is therefore difficult.
In general, the installation of a transport pipeline for the
supply of larger water quantities of untreated but safe water
might be an economic alternative to the construction of a
treatment plant, especially when gravity flow is available.
C o s t C o m p a r i s o n between H R F a n d Flocculat1on/Sedimentation
Destabi1ization of a suspension by chemical flocculation and
subsequent separation of the solids in a sedimentation tank is
an alternative pretreatment method which is usually inappro
priate for rural water supply schemes in developing countries.
Nevertheless, a cost comparison between this process and HRF
has been established for Tanzania ( 6 ) . The construction costs
of a pretreatment unit with a daily capacity of 440 m^/d, com
posed of a baffled tank (detention time 20 min.) used as floc-
culator, and a horizontal-f1ow sedimentation tank (overflow
rate 1 m/h, detention time 2 hrs) were estimated at approx.
US $ 20000. This results in relative costs of about US $ 46 / m 3 / d .
Construction costs of a chemical storage building are not in
cluded in these figures. The total investment costs for such a
chemical pretreatment process would be lower than the construc
tion costs of a HRF.
However, the annual operation costs for chemical flocculation
might well amount between 5 and 10% of the initial investment
necessary for construction work. The costs for the purchase of
chemicals which, in most cases, have to be imported, represent
the major part of the operation cost.
Page 75
69
When considering the annual equivalent costs, which comprise
capital recovery and operational costs, the construction of HRF
on a long-term basis is clearly more advantageous since this
type of pretreatment runs at low operational costs.
9Efr.?!:ion.?l Q o s t s o f _a_HRF
A HRF is operated without the use of chemicals. The costs for
filter cleaning are the only operational costs of a HRF. Hy
draulic cleaning of the filters can be carried out by the care
taker and therefore does not create additional expenditures,
possible costs for energy excluded. Manual cleaning, however,
usually requires additional labour.
Manual cleaning might be required every 3 to 5 years or may
even be avoided by the installation of an efficient drainage
system. Assuming a cleaning capacity of 1.5 m 3 gravel per man-
day, the required specific labour input per m 3/d filter capaci
ty of a 10 m-long HRF run at 1 m/h filtration rate will amount
to approx. 0.3 man-days/m 3/d. Hence, HRF units with the same
specifications and for Instance a 200 m 3/d capacity, will re
quire a total labour input of 56 man-days for manual cleaning.
Since only labour is involved in the use of a HRF, any communi
ty with a strong interest in treated water can afford the opera
tion of these filters. The running costs can be reduced to a
minimum if the community participates in filter cleaning. The
fully self-reliant treatment process therefore does not depend
on any external financial and technical support. Hence, large
operation and maintenance expenditures, often not sufficiently
available, can be reduced to an absolute minimum by the instal
lation of self-reliant treatment processes such as HRF and SSF.
This 1s one criteria for long-term operation of any water sup
ply scheme.
Page 76
70
Local_and Foreign Currency Cost Component
HRF is essentially a self-reliant technology largely reproduc
ible with local means. According to the construction cost
structure, 90% of the investment costs are expenditures for
construction material such as gravel, sand, cement, bricks and
stones, and for labour, both readily available in the country.
The remaining 10* are costs for the purchase of pipes, valves
and accessories (V-notch weirs, gauging rods) which may partly
have to be imported. Hence, none or a very small amount of the
construction costs require foreign currency.
HRF operation and maintenance basically require manpower but no
additional material. HRF is a system operated at village level,
and thereby run and maintained entirely by the local community.
Hence, the absolute self-reliant process demands local input
only.
Page 77
71
Hote:
- approx. 90% of the construction costs are
expenditures for locally available construc
tion material and labour. The remaining 10%
are required for the purchase of pipe fit-
tinge
- the construction costs of HRF and SSF are
of the same order of magnitude. The specific
costs per mr daily capacity might be in the
range of US $ 60-80 /ms/d
- economic, technical and operational consid
erations are necessary for the selection of
a water source
- conventional pretreatment (flocculation/
sedimentation) requires less investment
costs than HRF but it is less economical in
the long run due to high operational costs
- operational costs of HRF are essentially
labour costs ohich can be avoided by commu
nity participation
none or hardly any foreign currency is
required for the construction of a HRF, and
its operation is absolutely self-reliant
Page 78
72
hoo to dimension a HRF
7. DESIGN EXAMPLE
The Implementation of a HRF shall be illustrated by a small
design example. It is obvious that a treatment plant, and par
ticularly prefilters constitute only one part of a water supply
scheme. Proper operation of the system depends on the reliabil
ity of all its different elements. Therefore, the following
design example also includes some general remarks on the lay
out of the other components of a water supply system. Such a
system may be divided into 3 main parts, namely in a raw water
supply, in a treatment and 1n a distribution part as illustrated
1n Fig. 28. General aspects are only outlined for the raw water
and for the distribution part, since the design example will
mainly focus on the treatment part and, specifically, on the
HRF design.
Water Demand
Larger communities in rural areas of developing countries usually
number between 2000-5000 inhabitants. Let us therefore consider
a village of at present 2200 inhabitants. Since there is no
other water source (spring, ground nor rainwater) available,
people are forced to collect their water from a neighbouring
river which is polluted because people wash, defecate and water
their animals at the same place where they collect their water.
Only a small amount (approx. 5 to 10 1/c.d) of water is carried
to the village. This greatly affects personal and domestic
hygiene and increases the risk of infection from water-borne
and water-washed diseases. An increased water availability,
preferably combined with improved sanitation facilities, will
increase the health standard of the population.
Page 79
73
The water demand depends on the type of distribution system. A
water demand of 30 1/c.d is frequently used as design value for
a supply with public standposts. The actual consumption with
such a system 1s often lower and may range between 12 and 20
1/c.d. A design value of 30 1/c.d therefore provides a certain
spare capacity to cover wastage and losses.
1st assumption: daily water demand per capita 30 1/c-d.
Since the number of village inhabitants will most probably
increase, the scheme must be designed so as to meet the future
water demand. This is best achieved by a phased construction of
the Installations which is usually more economical and flexible.
A design period of 15 years for phase 1 is quite reasonable to
enable an adequate provision of water for 12-13 years after a
planning and construction period of 2-3 years. Annual popula
tion growth rates of 2-4% are common in rural areas of develop
ing countries. Let us therefore assume for our design example
an annual growth rate of 3%.
The quantification of the long-term water demand is difficult
since it depends on different factors such as population growth,
standard of living, type of infrastructure etc. Let us there
fore assume a general water demand increase of 50% to meet the
additional requirements of phase 2.
2nd assumption: daily water demand development
- present population 2200 people
- phase 1:
population in 15 years: 2200 x 1.5 = 3300 people
water demand: 3300 x 30 1/c-d = 99 m 3/d, say 100 m 3/d
- phase 2:
water demand: 100 m 3/d x 150% = 150 m 3/d
Page 80
74
A basic decision in the planning of a water supply scheme is
the selection of its hydraulic profile. First priority must
be given to gravity supply since 1t does not require any water
lifting. Schemes in which handpumps can be installed have second
priority. The last option of mechanically-driven pumps should
be chosen only in special cases where a reliable and affordable
energy supply is guaranteed and the infrastructure for pump
maintenance available. Hydraulic rams might be an appropriate
option but require surface water with sufficient fall and dis
charge .
Fig. 28 illustrates different hydraulic lay-out possibi11tes .
On the raw water side, the water flows by gravity directly to
the treatment plant or, if pumped, preferably first in a raw
water balancing tank. The water passes through the treatment
plant and 1s then stored. The treated water 1s brought to the
consumers either by a piped system next to their houses, or 1t
is pumped by hand from a system of cisterns located between
treatment plant and village. An additional pumping stage should
be avoided (see also Fig. 8) but might be necessary for a piped
system in a flat area.
B§y_y§5?r_?yBEly
The economic and physical lifetime of structures and pipelines
lies around 25 years or more. The one of mechanical and elec
tric components might reach, if carefully.maintained, a period
of 15 years. Hence, 1n our design example, the intake, the
pipelines and possibly a required pump house and a raw water
balancing tank should be designed for a capacity of 150 m^/d.
The pumps, however, would need a capacity of 100 m^/d to serve
the demand of phase 1.
Page 81
75
RAW WATER SUPPLY TREATMENT DISTRIBUTION
traditional water supply
-^Z- * Iflflf) gravity scheme x ^ -
semi-piped scheme
pumped scheme
X3F-
RIT(I lntikt md Pumping Stilion
TOl- HEI^ 5ed Tink HRF
n n n cilttrn with tindpump
UMM
Fig. 28 Water Supply Systems
The size of the pipeline depends on the required discharge and
the available hydraulic gradient. Generally, a flow velocity of
about 1 m/s is economical. To avoid operational problems and
high friction losses, it should not exceed 1.5-2 m/h.
In case of a pumped system operating 8 hours/day, 2 pumps with
a capacity of 3.5 1/s or 3 pumps with a 1.75 1/s discharge each
should be selected in order to provide one spare unit for phase
1. Finally, a raw water tank volume of 100 m^ is required to
allow continuous treatment plant operation in the considered
8 h/d pumped scheme. An additional 20 in̂ must be provided to
avoid complete drainage of the tank which would scour the set-
Page 82
76
tied coarse solids and flush them into the HRF. A low turbulence
inlet structure, similar to that of a sedimentation tank, is
equally important to improve the hydraulic flow conditions and
to avoid resuspension of the solids. The flow rate at the raw
water tank outlet is preferably controlled by a mechanical flow
rate device (see Fig. 7) which maintains continuous and constant
water supply to the filters independent of the water level in
the reservoir.
Wa ter _T reatme nt
The river catchment area upstream of the intake might be exten
sively used as farmland and be rather densely populated. Due to
land shortage and charcoal production, deforestation is in
progress. All these factors will be reflected in the river
water quality which might exhibit the following characteris
tics:
raw water quality dry season ra i ny season
t u r b i d i t y 30 - 50
f i l t r a b i l i t y 100 - 150
suspended s o l i d s cone. * ' 20 - 50
d i s s o l v e d organ ic carbon * ' 4 - 6
E . c o l i 500 - 10000
300 - 500 units
20 - 50 ml/3 min
200 - 500 mg/1
2 - 4 mg C/l
/100 ml
*' this information might not be available. However, the sus
pended solids concentration might possibly be of the same ma
gnitude as the turbidity.
Hence, the turbid river water carries a relatively high concen
tration of solid matter (soil erosion) and a moderate organic
load. The fairly hight bacteriological counts indicate a contam
ination of the river water by human excreta.
Page 83
77
Such river water needs to be physically and bacteriologically
improved to meet the drinking water standards. While HRF re
duces turbidity and suspended solids concentration, SSF will
decrease the chemical oxygen demand and the bacteriological
contamination of the water. A small sedimentation tank or pos
sibly a required raw water balancing reservoir placed in front
of the filter will separate the settleable coarse solids. The
treatment will therefore comprise the following processes:
sedimentation
by
sedimentation tank or
raw water reservoi r
pref11tratlon
by
HRF
main filration
by
SSF
Phase 2 design capacity of 150 m 3/d 1s used for the lay-out of
the treatment plant. Different single installations such as
sedimentation tank or distribution boxes are designed for this
final capacity. The filters, however, which are the main struc
tures, will be constructed in 2 phases with an Initial 100 m 3/d
capaci ty.
SedimentationTank
The river can carry a considerable amount of settleable solids,
especially at periods of high discharges during the rainy season.
Therefore, a sedimentation unit is preferably placed before the
filters for the separation of these solids as 1t is easier to
clean a tank than a filter. The single sedimentation unit will
be cleaned during periods of low raw water turbidity. A by-pass
enables continuous operation of the treatment plant during such
cleaning periods.
In order to separate a large part of the settleable matter, the
sedimentation tank is dimensioned to remove all mineral parti
cles larger than 20 urn (see also Fig. 1 2 ) . It will therefore
have the following design criteria and dimensions:
Page 84
78
design capacity
surface load
detention time
required surface
assumed length
width
depth
area
Q = 150 m 3/d = 6.25 m 3/h
s 0 = 0.6 m/h
T d = 2 i/2 h
A = 6.25 : 0.6 = 10.4 m 2
L = 8 m
W = 1.5 m
H = 1.5 m
6.25
designed surface load
designed detention time
8 x 1.5
0.5 m/h
Td
8 x 1.5 x 1.5
6.25
3 h
The raw water balancing reservoir required 1n a pumped raw
water system should preferably also be of rectangular shape. A
tank with a storage volume of 120 m 3 and an assumed depth of
2.5 m will efficiently remove the settleable solids.
H R F D e s I g n
Raw water which 1s presettled for 2-3 hours will probably exhibit
only half of its original turbidity. This turbidity reduction
depends on the stability of the suspension, on the solid par
ticles concentration and particle size distribution. The effi
ciency of a sedimentation tank can be determined by the suspen
sion stability test. The information gained from such a test
should, however, be interpreted with care since the test is run
with quiescent, standing water and not under flow conditions.
Page 85
79
HRF has to be designed for turbidity peaks. In our design example,
the turbidity and the suspended solids concentration can possi
bly be reduced by the sedimentation tank from 500 to 300 turbi
dity units, or from 500 to 300 mg/1 respectively.
According to Table 2 on page 17, the presettled raw water is of
medium turbidity and the applied filtration rates should range
between 0.75 and 1 m/h. For this relatively high turbidity, our
design example foresees a filtration rate of 0.75 m/h.
The HRF units are of the following dimensions:
final design capacity
design capacity phase 1
filtration rate
Q = 150 m 3/d = 6.25 m 3/h
Q = 100 m 3/d = 4.2 m 3/h
vF = 0.75 m/h
r e q u i r e d c r o s s - s e c t i o n
area f o r 6.25 m3/h = 6.25 : 0.75 = 8.33 m*
assumption 3 HRF units
filter depth H = 1.2 m
filter width W = 2.4 m
filter length/gravel size l\ = 4 m
L 2 = 2 m
L 3 = 1 m
total filter length L = 7 m
d„ =
= 15 mm
= 10 mm
5 mm
phase 1
phase 2
2 HRF units
3 HRF units in total
6.25
designed filtration rate vp- = = 0.72m/h
3 x 1.2 x 2.4
Economy in the filter design is mainly achieved by a reduction
of the filter length. The assumed filter length of the differ
ent gravel fractions is within the lower limit. This minimum
filter design can be compensated by the installation of an
Page 86
80
efficient hydraulic cleaning system. By periodically cleaning
the filter hydraulically, the amount of accumulated solids 1n
the HRF (filter load) will remain small (e.g. less than 10 g / 1 ) .
The HRF efficiency can be determined by the E-value presented
in Appendix 1. The suspended solids concentration In the HRF
effluent is determined graphically by the nomogram, or analyti
cally by multiplication of the E-values with the inlet concen
tration. The table in Appendix 1 gives the following E-values
for our design example:
filtration rate vp = 0.75 m/h E - v a l u e [%) gravel size 15 mm, filter length 4 m 15.2
" 10 mm, " " 2 m 25.7
5 mm, " " 1 m 28.3
Hence, for an assumed maximum suspended solids concentration of
300 mg/1 in the presettled raw water, the respective concentra
tion 1n the HRF amounts to:
C e = 300 x 0.152 x 0.257 x 0.283 = 3.3 mg/1.
The graphical solution illustrated in Fig. 29 gives a similar
value. According to this estimation, the chosen HRF design just
meets the standard required by SSF. However, it must be stres
sed that the above considerations are only valid for a rela
tively clean filter and for suspensions with a similar charac
teristic as the kaolin suspension described in Appendix 1.
The periodic intervals between two filter cleanings are deter
mined by the equation described on page 58. With an assumed
average suspended solids concentration of 200 mg/1 in the pre
settled water and a maximum allowable filter load of 10 g/1 in
the first gravel pack, the filter running time between two
hydraulic cleanings amounts to:
10 x 4 run
1000 x (200 - 30)x 0.75 = 310 hrs ~ 13 d a > s
Page 87
81
with C e = 200 • 0.152 = 30 mg/1 (susp. solids cone, after
the first gravel pack)
During the dry season and with an assumed suspended solids
concentration of 30 mg/1 in the presettled water, a cleaning
Interval of approx. 90 days should be observed.
SS|mg/l)
50-5000
40 60 5 10 20 30 50 80
[mg/l] 100 nig/I I
6040 80 50
Fig. 29 Nomogram for Filter Efficiency Estimation
The lay-out characteristics of our HRF design example were also
used in EAWAG's computer programme for dynamic HRF modelling.
Some results of this filter run simulation are graphed in F1gs.
30 and 31.
Page 88
82
rainy season conditions
. raw water
(C0--200mg/l;
for 6 ,h - 9 t h day
C0 =300mg/l)
Iter
Lo
ad
[g/l
]
U_
30-
25.
20-
15-
10-
5-
0-
/ /
y
\ -***f^—p
•
y
' r
y y
y y
y y
y
.——" '" ""
1 1 V
hydr. cleaning mtervall 11 days
coarse gravel g 15 mm
— medium gravel 0 10mm
fine gravel e 5mm
20 25 30
Time [days]
Fig. 30 Suspended Solids and Filter Load
during the Rainy Season
Fig. 30 illustrates the suspended solids concentration in the
effluent and the filter load during the rainy season. As shown
in the graph on the left, the assumed suspended solids concen
tration of the presettled water amounts to 200 tng/1 , with a
peak load of 300 mg/1 during the 6th and 9th day. The calculated
suspended solids concentration in the HRF effluent increases
from 3 to 5 mg/1 during the simulated period. It is hence
slightly higher than the estimation determined with the E-value.
The graph on the right clearly demonstrates that the bulk of
the solids is retained in the first gravel pack. Compared to
the medium and fine gravel fraction, the filter load in this
coarse gravel section Increases considerably. The coarse filter
medium has to be cleaned at intervals of approx. 11 days if the
permissible filter load of 10 mg/1 is to be met.
Fig. 31 illustrates the dry season conditions where a suspended
solids concentration in a presettled water was maintained con-
Page 89
83
stant at 30 mg/1. The respective HRF effluent concentration 1s
less than 1 mg/1. Most of the solids are retained 1n the first
filter pack, which should be cleaned hydraulleally approx.
every 85 days during the dry season period.
dry season conditions
4 0 -30
0.2
2mg/l standard for SSF (dry season)
30 60 90 120 150
Time [days]
raw water (C 0 =30mg/ l )
20-
15-— •
"to o 10
£ 2
5-
0^
— i 1 1 1
/ /
/ /
/ /
/ /
/ /
/ / / ..
1 * " T 1 —
, '
*-. , L 0 30 60 90
hydr. cleaning intervall 85days
coarse gravel 0 15 mm
medium gravel 0 10mm
fine gravel 0 5 m m
120 150
Time [days]
F1g. 31 Suspended Solids and Filter Load
during the Dry Season
As already indicated by the different calculations, the proposed
HRF design of minimum filter length requires an efficient hy
draulic cleaning system. This is best achieved by a false fil
ter bottom Installed in the first gravel pack of the HRF. Pre
fabricated culverts could be used as an alternative drainage
system. Such culverts simplify the construction of the filter
box but might be less efficient in hydraulic filter cleaning.
Flow control and 1n and outlet structures of the HRF do not
need to be discussed further. The drawings of the discussed HRF
design example are presented in Appendix 4.
Page 90
84
S S F D e s i g n
In our design example we used the described design values and
obtained the following dimensions:
final design capacity
design capacity phase 1
filtration rate
required filter bed area
for 6.5 m 3/h
Q = 150 m 3/d = 6.25 m3/h
Q = 100 m 3/d = 4.2 m 3/h
vp = 0.1 m/h
A = 6.25 0.1 62.5 m z
assumption 3 SSF units
length of filter bed L = 4.6 m
width " " " W = 4.6 m
phase 1
phase 2
2 SSF units
3 SSF units in total
filtration rate during
cleaning of 1 SSF unit
phase 1
phase 2
6.25
designed filtration rate vp = = 0.1 m/h
3 x 4.6 x 4.6
vp = 0.2 m/h
vF = 0.15 m/h
The flow through the SSF is controlled by the V-notch weir of
the distribution box. The filter which operates at a variable
water level of the supernatant therefore acts as a self-regulat-
ing system, i.e. the water level increases with progressive
filter resistance. Since the effluent weir crest is at the same
level as the top of the sand bed, it prevents negative pressure
in the filter. Finally, a cross-connection between the effluent
pipes of the different SSF units enables a refilling of the
sand bed with water from bottom to top. This important operation
drives the air out of the sand bed, reduces the initial filter
resistance and produces an equally distributed filter load. The
main features of the discussed SSF are illustrated in Appendix 5.
Page 91
85
Distributor Box
The total flow through the treatment plant is concentrated,
controlled and distributed to the different filter units by
distributor boxes. Two boxes are required for our design exam
ple, one before and one after the HRF. More structural details
of a distributor box are given in Appendix 3.
Treatment Plant_Lay_-out
The general treatment plant lay-out for our design example is
illustrated in Fig. 32. An area of approx. 25 x 25 m is required
for the plant. It should preferably have a slight slope of
1:5-1:10 since it would facilitate gravity flow Installation
and also reduce excavation work.
The water flows by gravity through the treatment plant. The
total headloss amounts to approx. 2.5 m. A maximum filter re
sistance of 30 cm for the HRF and 100 cm for the SSF is includ
ed in this value. The remaining 1.2 m are required for the
overfalls of the 4 weirs and for the friction losses in the
piping system.
A washing place for gravel and sand cleaning and a small build
ing for the storage of tools and test equipment are necessary
as subsidiary installations. Finally, a sufficient drainage
system must be provided for the discharge of the washwater.
91 ?trl!?y£i0.D .Scheme
Most of the treated water produced at a constant rate over the
full day is generally only used at some peak hours in the morning
and late afternoon. Storage capacity must therefore be provided
prior to distribution. The treated water is distributed to the
consumers either by a full or by a semi-piped system.
Page 92
86
Kej
1 inlet box with flow control
2 Sedimentation tank
3 distributor box
1 H R F
5 drainage channel
6 SSF
7 Reservoir
8 washing place
9 storehaus
— phase I
— phase 2
7 » a >
^ ^ distr ibution
Fig. 32 Treatment Plant Lay-out
Clear Water Reservoir
The required reservoir volume depends on the daily pattern of
water use. A 30-50% storage capacity of the daily water produc
tion is usually sufficient. Hence, a clear water reservoir of
about 50 m^ volume should meet the requirements of phases 1 and
2 of our design example.
Piped D1stributionScheme
Public standposts are generally used in rural areas of piped
water supplies. A standpost tap might serve about 150 persons.
2 taps are generally installed at each standpost. Hence, a
total of 11 public standposts are required to supply the 3300
people of phase 1 of our design example. A proper drainage of
the wastewater at the standposts is essential to keep the area
clean around the water points.
1 2
'aw water
HMZ3—
Page 93
87
Semi-giged Scheme
A semi-piped scheme can be operated without external energy
Input in pumped water supply systems. The treated water of a
semi-piped scheme flows by gravity to a number of cisterns
located between treatment plant and village. The cisterns act
as small reservoirs to balance treatment plant production with
daily water demand fluctuations. Hence, the construction of a
separate clear water tank can be omitted. Each cistern is
equipped with 2 handpumps. According to practical experience,
each handpump supplies about 250 people.
Plan View
S
to the SSF Outlet River Valves
Distribution Cisterns with System Handpumps
Washing to the Facilities Village
Cross-Sect ion
X ^tpmzmmwfi ^mxzmnmt&ww^- =§L*,
soakage or irrigation
Fig. 33 Concept of a Semi-piped Distribution System
Page 94
88
For our design example, 7 cisterns are required for the 3300
people. With a total required storage volume of 50 m^, each
cistern will need a 7 m^ storage capacity. Several washing
places with proper drainage structures should complement this
semi-piped system, because part of the pumped water will be
used for washing activities performed next to the cisterns. A
possible lay-out of such a semi-piped system is illustrated in
Fig. 33.
The presented design example is summarized in the design form
of Table 6. This form is also attached to the manual as Appen
dix 6. An additional nomogramm for individual use is enclosed
on page 90.
Page 95
89
Table 6 Design Form f o r Design Example
KSICH FORM Naae of M U r lupply: ^ ^ r,,
Olttrlct/Re^ton:
D*l1gn*d by: M. htcclln
(Late January 1986
1 . w i t t r S w i r e * dry r a i n y O i a t n -
d i v c n a r j * SO 100O 1 /1
t . r n i o u y JO • SO » 0 • WO i u
f i l t r a b l h t y 100 - ISO 70 - M a l / 1 H in
i ; i p i o H O t c o r * . 20 - SO ! 0 0 - 500 a f / 1
Or^aniCl Ww**8*>. CCO") 4 • * Z - 4 B Q / I
b * ; t . t » « IE c o l l * . * « < « t - S * - • * * ' > S00 • 10 -000 / 1 0 0 a l
; A l t t r n a t l . t Source
a i a i l * o ' « i c i ' . ' n * * n w
c o - - i t r . M t l i h i j h e r / i B * l l « r
3. I r i t t r Supply S y t t t a
( qr*wl t y t t h n M ' / p u a p M i c h e e c ; a e c h « n l < * l puap
IhandpuopJ
4 . D u l y O p e r a t i o n N g u n
f» r r * » * a t * r p u t p t n a i t a t t a n . . . . • . . h n / d « y
for ( r ( * t « t m p 1 * n t C O n t l - t n t « r » 1 t t t n t O X l l n l n ) nvOul ( . . . . r i r t / d ) r a t *
( h n / d )
M d l « n t a t 1 o n t M k ( 0 ) D D
0 • • w [ H D D
9. f j C f j u i u P r o f i 1 «
10- S l f j a t i e n
d « l * t * »t i«r» not conven ien t
4 . Mater Ueaend
p o p u l a t i o n
d a i l y p«r c a p i t a deBind
d a l l y denand by p o p u l a t i o n
a d d i t i o n a l deaand f o r 1_nc,reai*d
pop.. ' > t # n d * r d , . ( t p c e W y )
t o t * l d a l l y demand
4 . fta. water Supply
r w i r t d pt-op c a p a c i t y f
nuaocr of puspf
- - 9 0 t o 7 . 2
'* l f » t c * l l t
7 .1 S e d t a e n t e t i o n lank
u r f e c e load
r e q u i r e d i g r f e c * »re»
d e t e n t i o n n a e
r e q u i r e d . o l u a e
n u a M r 0 ' u n U l
a i a e n i i o r n of 1 u n i t
l . n ^ t h
v l d t r i
depth
7 .? nflF
f i l t r a t i o n r a t *
rvbtr Of u n l t i
d i a t n s ' o n i of 1 u n i t
• i d t »
depth
o r a . e i i n * aa
. .<> en
. .1.0. en
. . >. BB
7 . J SSf
f i l t r a t i o n r a t *
r e q u i r e d f 1 U « r a r t a
d l t w f i t l o n i of 1 u n i t
l e n g t h
• i d t n
B. D i s t r i b u t i o n
8 . 1 Piped * « t * r i u p p l y
r . i e r . o l r . 0 l u a «
nua6*r of u n l i t
8 . ? S e a t - p i p e d water l u p p l y
people p*r handpuap
r e h i r e d nuafcer of handpuapl
nuaoer of C i t t e r n *
p r . i e n t
2.ZOO
. . I S
..«
!"«'"
I ? ; * !
i ? , * l
«».91
I J .H
U.H
9--!>
2A XX
. . .?
P..'.
fwt
phet-e 1
J ' .WQ
. . M
AW
>.W
.J-i
.?..
!°°.
iw
.«. .1
.w.
.1.7.1.
r*
p h e i * 2
.1QQ
..SO,
-W
. * > *
. ? . .
!99.
(10.4)
i i* l .
8 . 4
ii-A A.
>P.
P M ? 1 *
l / c d
• 3 / a
• V d
BJ/<J
a V d
1 / t
.'«
• / «
n r i
-J
. a
a
a /n
a 2
•
•
•
B/h
B?
B3
people
rwart: Upreiflpni 1n (1 ai alternative option 1o deilon txaapl*
Page 96
90
Nomogramro f o r HRF des ign
40 60 5 10 20 30 50 80
6040 80 50
Page 97
91
are you convinced of HRF ?
8. CONCLUSIONS AND FINAL REMARKS
If you have reached this part of the manual, you are either an
experienced reader who first consults the executive summary and
conclusions of a publication, or a person with a real interest
in the HRF technology. After having given enough evidence in
favour of HRF, this manual will conclude with some strong for
mulations on water supplies in developing countries and will
point out some weak aspects concerning HRF.
1. So water will reach people by just reading publications.
Hence, this manual presents a technology to be applied in
the field. It is not just meant for mental pleasure nor to
be piling 1n a bookshelf. The reader 1s therefore kindly
requested to take action in his field of activity by
promoting and implementing appropriate technologies.
2. Appropriate means adapted to the local situation. There
fore, no technology is universally appropriate. This also holds true for SSF. Its often falling practical opera
tion in developing countries is mainly due to inappropriate
raw water quality.
3. A rural cart will hardly be pulled by a racing car, but
by a donkey, ox or horse. Equal level of technology 1s
a critical factor for the viability of a system. For In
stance, insufficient flocculated and settled water will
create operational problems for SSF. Raw water pretreated by
Mv e r b a n k infiltration, vertical prefilters or HRF will
usually meet SSF requirements.
4. You would never wash yourself with champagne. Real need and economic aspects are decisive factors for the selec
tion of a water supply system. HRF and SSF are a fascinating
treatment combination since it represents a reliable, self-
reliant and reproducible technology. However, the filters
Page 98
92
require a considerable input of construction work. They
should only be used if no other better water quality source
is available and if water treatment is a necessity.
This manual is a technical document. Water supplies are
like computers as both depend on hardware and software. The water supply users have to decide, contribute and operate
the facilities. Sociocultural aspects must be integrated in
a project. The degree of training, support and assistance to
local caretakers greatly influences the lifetime of a water
supply.
The presented HRF technology is still being perfected.
HRF has been used in Europe for over 25 years but only for a
few years in developing countries. Demonstration projects
are under way to introduce this technology in Latin America,
Africa and Asia. More practical experience is being gathered
on the economic lay-out, hydraulic cleaning, use of local
construction techniques and alternative filter material.
Therefore, the present HRF manual is a draft to assist
you in the design, construction and operation of HRF.
IRCWD in Duebendorf/Switzerland monitors the HRF demon
stration project. The practical experience gained on HRF
from different developing countries constitutes an information pool available at IRCWD. The Centre in Switzerland can
give you technical assistance on HRF and might possibly help
you secure some financial support from the Swiss Development
Cooperation for the construction of your HRF.
8. Information exchange should be reciprocal, your feedback is essen'tial. IRCWD therefore hopes to receive your
views on the present manual and especially your experience
with HRF, possiblyNin combination with SSF.
Provision of save water i s\a challenge. IRCWD wishes you
every success in your effortsvto achieve this goal.
Page 99
93
References
(1) Slow Sand Filtration for Community Water Supply in Deve
loping Countries, A design and construction manual,
Technical Paper 11, IRC, The Hague/NL
(2) Horizontal-flow Roughing Filtration: An Appropriate Pre-
treatment for Slow Sand Filters in Developing Countries,
M. Wegelin, IRCWD News So. 20
(3) Horizontal-flow Coarse-Material Prefiltration, N.C. Thanh
and E.A.R. Ouano, AIT, Research Report No 70, 1977
(4) Surface Water Filtration for Rural Areas, N.C. Thanh and
J. Hettiaratahi, Ensic, Bangkok/Thailand, 1982
(5) Slow Sand Filter Research Report No. 1, 2 and 3, M. Wege
lin and T.S.A- Mbwette, University of Dav ee Salaam, 1980
and 1981
(6) Horizontal-flow Roughing Filters for Rural Water Treat
ment in Tanzania, T.S.A. Mbwette, M. Thesis, University
of Dar es Salaam/Tanzania, 1983
(71 Particle Removal by Horizontal-flow Roughing Filtration,
M. Wegelin, M. Boiler and R. Schertenleib, AQUA, 3/1986
!8) Horizontaldurchflossene Kiesvorfilter zur Vorremigung von Oberfl'dchenwas8er, besonders in Bntwicklungslaendern,
E. Trueeb, 3R International, 1/2 1982 //
///,
(9) Process Aids for Slow Sand Filtration, M.fardon, D. Whee
ler and B. Lloyd, Waterlines, 2/1983
(10! Rural Water Treatment Package Plant/ D. Wheeler, C. Sy-
monds, B. Lloyd and M. Pardon, Progress Report II for
ODA, 1983 7
Page 100
94
111) Slow Sand Filter Design and Construction in Developing
Countries, R. Paramasivan, V. Mhaisalkar and P. Ber-
thouex, JAMA, 4/1981
(12) Guidelines for Operation and Maintenance of Slow Sand
Filtration Plants in Rural Areas of Developing Countries,
Occasional Paper Series, IRC, The Hague
Page 101
95
Abbreviations
HRF Horizontal-flow Roughing Filtration (Filter)
SSF Slow Sand Filtration (Filter)
NTU Nephelomatric Turbidity Unit
AIT Asian Institute of Technology
CEPIS Centro Panamericano de Ingenieria Sanitaria y
Ciencas del Ambiente
DANIDA Danish International Development Agency
EAWAG Swiss Federal Institute for Water Resources
and Water Pollution Control
ETH Swiss Federal Institutes of Technology
IRC International Reference Centre for Community
Water Supply and Sanitation
IRCWD International Reference Centre for Waste Disposal
NORAD Norwegian Agency for International Development
SATA Swiss Association for Technical Assistance
SDC Swiss Development Cooperation
SKAT Swiss Centre for Appropriate Technology
Page 102
96
Detailed Table of Contents
page
Part A 0. Executive Summary
Cartoons
Part B 1. Introduction and Problem Identification
Conventional pretreatment
HRF as alternative pretreatment
Historical Background of HRF
5
8
9
10
Main Features and Lay-out of a HRF
Design variables
Raw water characteristics
Design aspects
Design guidelines
Height and width
Flow and headloss control
12
14
15
16
17
19
20
Lay-out of Water Treatment Plants
General considerations
Infiltration gallery or trench
Removal of coarse material
Aeratlon
HRF as pretreatment
SSF as main treatment
Water disinfection
Water storage
Water distribution
24
24
26
28
30
31
32
33
33
34
HRF Construction
Filter box location
Filter box material
Filter materi al
Separation walls
In and outlet structure
Drainage system
37
37
38
39
41
42
43
Page 103
97
page
HRF Operation and Maintenance
Commissioning of filter
Flow pattern
Flow control
Water quality control
Filter resistance determination
Filter cleaning
Filter maintenance
46
46
47
49
50
53
56
63
Economic Considerations 65
HRF construction cost structure and
specific costs * 65
HRF and SSF specific cost comparison 66
Treatment plant investments versus
pipeline costs 67
Cost comparison between HRF and
f1occulation/sedimentation 68
Operational costs of a HRF 69
Local and foreign currency cost component 70
7. Design Example 72
Water demand 72
General lay-out of the water supply scheme 74
Raw water supply 74
Water treatment 76
Sedimentation tank 77
HRF design 78
SSF design 84
Distributor box 85
Treatment plant lay-out 85
Distribution scheme 85
Clear water reservoir 86
Piped distribution scheme 86
Semi-piped scheme 87
8. Conclusions and Final Remarks 91
Page 104
98
page
References
Abbrevlati ons
Detailed Table of Contents
93
95
96
Appendi ces 100
1 Nomogram for HRF design
2 Simple methods for water quality analysis
3 Simple methods for discharge measurement
4 Construction details of a HRF
5 Salient data and features of a SSF
6 Design form
7 Outline for caretaker training
8 HRF and SSF monitoring programme
9 Examples of HRF application
Page 106
100
Appendi ces
1 Nomogram for HRF design
2 Simple methods for water quality analysis
3 Simple methods for discharge measurement
4 Construction details of a HRF
5 Salient data and features of a SSF
6 Design form
7 Outline for caretaker training
8 HRF and SSF monitoring programme
9 Examples of HRF application
Page 107
1/1 Appendix 1:
Nomogram for HRF Design
1. Introducti on
Tables 2 and 4 in part B of the manual give general guidelines
for HRF design. Filtration rate and filter length are given for
a certain range. The designer, however, might be interested in
more detailed design information. For instance, he might want
to know the effect on the HRF effluent quality 1f he doubles
the length of the first gravel fraction. Therefore, an addi
tional design tool will be presented 1n form of an "E-value"
approach.
2. Theoretical Background
"E-value" stands for Efficiency value and describes the perform
ance of the filter with respect to suspended solids removal. On
the basis of the established filter theory, the filter effi
ciency can be expressed by the filter coefficient X [ /cm] and
use of Iwasaki's equation:
With C as solids concentration and x as filter depth. The fil
ter coefficient x 1s a function of the flow pattern, the filter
medium and the physical properties of the water and suspended
particles.
X = f<V V pg' V V vw*
Page 108
1/2
While the volume of retained solids increases with progressive
filtration time, the filter porosity decreases. The degree of
filter clogging can be expressed by the filter load a [ g / 1 ] ,
which is the mass of deposited material per unit of filter bed
volume. The filter load varies with position x 1n the filter as
well as with filtration time t. The filter coefficient X 1s
therefore also a function of:
X = f(x, a)
The correlation between the filter coefficient X and the dif
ferent parameters mentioned has been Investigated 1n laboratory
tests with the help of a kaolin suspension. More detailed re
sults are presented in ( 7 ) .
x will assume a constant value with a constant particle size
d. and density p . of the suspended solids, as well as with a
uniform filter load a over a considered filter length If.
These assumptions very much simplify the real filter conditions
but enable to integrate Iwasaki's equation as follows:
-x-1 'out •In'
f
3. Specific Conditions
The filter performance can herewith be determined for specific
but simplified filter conditions. For this purpose, the filter
efficiency which is defined as:
'out
'in
•x«l f
Page 109
1/3
has been calculated for the following conditions:
suspension kaolin diluted in groundwater as per
laboratory tests (7).
particle size d_ = 2 p.m
filter load a = 20 g/1
filtration rate vF = 0.5, 0.75, 1.0, 1.5, 2.0 m/h
filter grain size d = 5, 10, 15, 20 mm
initial porosity p 0 = 35%
The E-value for these specific conditions is presented in Table
7 for different filtration rates Vp, filter lengths 1^
and grain sizes d q. Hence, the suspended solids concen
tration in the effluent of a filter layer can easily be deter
mined by:
Cout Cin* E
4. Numerical Solution
The effluent quality of different sequential filter layers can
be calculated as follows:
coutl " c1n
cout2 " cinl * E2 = coutl * E2 " cin * El
cout3 = C1n2 ' E3 ' cout2 ' E3 " cin ' Ei ' E2 ' E3
Cout = Cin * Ei * E2 ' E3 ' E.. for a 4 9ravel HRF
Page 110
1/4
5. Graphical Solution
A nomogram has been developed to estimate graphically the sus
pended solids concentration in the filter effluent. The partic
ular shape of this nomogram emerged from the following consid
erations:
- since the peak value for suspended solids concentrations 1s
usually unknown, it will have to be estimated. This holds
true especially for concentrations above 300 mg/1. On the
other hand, high concentrations also result in high reduc
tion rates. Therefore, a log-scale has been applied 1n the
graph for concentrations above 300 mg/1.
- data might be available for moderate suspended solids con
centrations ranging from 50 to 300 mg/1. A normal scale
graph has therefore been chosen for this range.
- low concentrations must be achieved by the effluent of a
HRF. Therefore, a log-scale illustration for concentrations
between 0.1 and 50 mg/1 has been used to increase the sen
sitivity in this part of the graph.
The E-values for specific design assumptions are given 1n Table 7,
This enables to subsequently locate and connect the points with
each other 1n the nomogram.
6. Design Example
The following example is used to demonstrate the application of
the E-value concept.
max. suspended solids concentration
in the presettled raw water 500 mg/1
Page 111
1/5
1st assumption for HRF lay-out
4m
C 0 = 500 mg/1
20 mm
3m 2m lm
15 mm 10 mm 5mm
vF = 1 m/h
The respective E-values from Table 7 amount to:
37.2 for the 20 mm gravel
38.1 for the 10 mm gravel
37.4 for the 15 mm gravel
39.9 for the 5 mm gravel
The HRF effluent quality can therefore be calculated as
follows:
C e = 500 • .372 • .374 • .381 • .399 = 9.6 mg/1
This value does not comply with the standard required by SSF.
By reducing the filtration rate to 0.75 m/h, the HRF's effi
ciency will be increased. The new E-values from Table 7 amount
to:
23.5 for the 20 mm gravel
25.7 for the 10 mm gravel
24.3 for the 15 mm gravel
28.3 for the 5 mm gravel
and the respective suspended solids concentration in the HRF
effluent 1s calculated as follows:
Ce = 500 • .235 • .243 • .257 • .283 = 2.1 mg/1
Hence, a HRF with this lay-out and operating at a filtration
rate of 0.75 m/h seems to be appropriate in reducing the sus
pended solids concentration to a value permitting a sound SSF
application. The design example is also presented as graphical
solution on page 1/8.
Page 112
1/6
T a b l e 7 E - v a l u e s f o r HRF
E.Je ? , - * . l f [7.1
Gravel Size
d 9
5 mm
10 mm
15 mm
20 mm
Filtration Rate
u_ [m/h]
0.5 0.75 1 1.5 2
0.5 0.75 1 1.5 2
0.5 0.75 1 1.5 2
0.5 0.75 1 1.5 2
Filter length lf [m]
1 2 3 4 5
15.2 2.3 0.4 0.1 0.0 28.3 8.0 2.3 0.6 0.2 39.9 15.9 6.4 2.5 1.0 59.0 34.8 20.5 12.1 7.2 74.7 55.7 41.6 31.1 23.2
35.6 12.7 4.5 1.6 0.6 50.7 25.7 13.0 6.7 3.3 61.7 38.1 23.5 14.5 9.0 77.7 60.3 46.9 36.4 28.3 89.5 80.2 71.8 64.3 57.6
48.4 23.5 11.4 5.5 2.7 62.4 39.0 24.3 15.2 9.5 72.1 51.9 37.4 27.0 19.4 85.4 72.9 62.2 53.1 45.3 95.0 90.2 85.6 81.3 77.2
56.9 32.4 18.4 10.5 6.0 69.6 48.5 33.7 23.5 16.4 78.1 61.0 47.6 37.2 29.0 89.5 80.1 71.7 64.2 57.5 97.7 95.4 93.2 91.0 88.9
Page 113
1/7
7. Critical Review
It should be remarked that the presented "E-value" was intro
duced as Efficiency value. However, the same "E" may also stand
for Estimation. The real conditions 1n a filter are greatly
simplified and the suspended solids 1n a natural river need not
coincide with the investigated kaolin suspension. Hence, since
the presented concept is rather a refinement of the general
design guidelines (see also pages 17 and 40) it will not pro-
vi de exact values.
More specifically, the results obtained for the first filter
fraction tend to be conservative. A natural suspension does not
have a uniform solid size of 2 u.m as assumed in our calcula
tion, but might vary between 20 and less than 1 urn in a preset-
tied water. Hence, the first filter section will remove the
coarsest solids and a small fraction of the finer material. The
separated mass from such a natural suspension might therefore
be greater than that of a uniform suspension.
The conditions might be totally different for the finest gravel
fractions. Since all coarse solids have been removed, the re
maining mean particle size will be smaller than 2 urn. As a
consequence, the calculated removal rates might be too optimis
tic for this filter section.
However, the estimated overall removal rate for the entire
filter will probably be of the same magnitude as that observed
in reality. Therefore, the presented "E-value" concept can well
be applied as a preliminary step in the HRF design. More de
tailed information can be obtained with the HRF computer pro
gramme (see also page 1 8 ) , in which the particle size distribu
tion of a natural suspension is adopted and a dynamic model
applied to consider filter load increase with finite filter
elements.
Page 114
1/8
Graphica l S o l u t i o n of Design Example
(d i scussed on pages 1/4 and 1/5)
40 60 5 10 20 30 50 80
— vF =1m/h — vF=0.75m/h
Page 115
I I / l
Appendix 2:
Simple Methods for Water Quality Analysis
1. Introduction
The following difficulties often hinder implementation of a
water quality monitoring programme:
- availability of only a few water quality laboratories in
the country and possible transport and communication dif
ficulties between the laboratory and the field,
- analysis of water samples only possible 1n the laboratory
for lack of appropriate field test equipment. Delay and
mishandling of the samples might lead to errors,
- unavailability of basic Infrastructure (e.g. power supply)
and qualified personnel at the treatment plant.
As a consequence, water quality monitoring on a regular basis
is frequently neglected. Water treatment processes, however,
have to be controlled since neglection of water quality moni
toring 1s usually combined with desinterest in the treatment as
a whole.
In order to overcome the mentioned difficulties, some simple,
sturdy field test methods have been developed to monitor the
efficiency of HRF. Turbidity and the suspended solids concen
tration are the main parameters which determine HRF performance.
In addition, the volume of settleable matter might be of inte
rest if no pretreatment system (e.g. sedimentation tank, raw
water reservoir) is available prior to HRF. Finally, the sus
pension stability has an influence on the settling character
istics of the suspended matter.
Page 116
II/2
Simple methods and sturdy equipment are now available for the
determination of the different parameters. IRCWD has developed
a field test kit, as shown in F1g. 35, containing all the ne
cessary equipment for turbidity, filtrability and settleable
solids determination. Neither chemicals nor energy is necessary
to carry out the tests. Only filter paper necessary for the
filtrability test will have to be supplied from outside.
Fig. 35 Field Test Kit
(developed by IRCWD)
adapted
Imhoff cones test tube
filtrabili ty
apparatus
(settleable (turbidity) (suspended
sol ids) sol ids cone.)
Page 117
II/3
2. Turbidity
Turbidity is measured by a test tube that has been developed by
DelAgua and which is included in a field test kit for bacterio
logical (faecal collforms) and physical/chemical analysis (pH,
conductivity, chlorine). More information on this field test
kit can be obtained from DelAgua, P.O.Box 92, Guildford GU2 5TQ,
England.
Test Procedure for Turbidity Analysis:
- assemble the two turbidity
tubes by placing the lower in
the stand and by inserting the
upper in the lower tube through
the hole of the stand
- check the valve for closed
position
- slowly pour the water to be
analysed in the test tube
avoiding splashing and the
formation of bubbles. Fill the
tube up to mark 5
- observe the test tube from a
vertical position and open the
val ve
- close the valve as soon as you can see the black circle at
the bottom of the test tube
- record the water level and enter the result in the record sheet
- remove all water from the test tube and clean it
A direction of observation
^
- 7 5
-10
-20
- 3 0 - 5 0 -100
m hi
Turbidity Units (TU)
tap black circle
Turbidi ty Test Tube
Page 118
11/4
3. Filtrability
The suspended solids concentration analysis which requires very accurate equipment is replaced by the filtrability test. The
test will produce relative values sufficient to monitor the
efficiency of HRF in solid matter removal.
Test Procedure for Filtrability Analysis:
- remove the vessel from the
filter support by lifting the
cl amp
place the filter support on
the stand
close the tap (horizontal
position)
fill the filter support
with water
place a filter paper No. 595
(Schleicher and Schull) on
the filter support and press
it slightly to the grit to
avoid air pockets below the
filter paper
place the funnel on the support and fix it with the
cl amp
place a measuring cylinder
under the filtrability appa
ratus
vessel
filter paper
filter support
tap
measuring cylinder
Filtrability Test Installation
Page 119
11/5
- pour 500 ml of the water to be tested in the funnel
- open the tap (vertical position), turn the sand clock and
record the filtered water volume in ml after 3 min. (after 1,
2 and 3 min. if watch is available)
- remove the filter paper and place a new paper according to
the described procedure
- analyse a second water sample in the same way
- enter the results in the record sheet if they are of the same
order of magnitude (deviation + 2 0 % ) , otherwise repeat the
test for a third time
- remove all water from the filtrability apparatus and clean it
Page 120
11/6
4. Settleable Solids
An adapted Imhoff cone, commonly utilized for the analysis of
wastewater containing large volumes of settleable solids, is
used here to measure also small quantities of settleable mat
ter. With this test, filter porosity reduction due to solids
accumulation in the filter can be determined by calculation.
Test Procedure for the Determination of Settleable Solids:
- check the tightness of
the screw
- place the Imhoff cone
on the stand
- pour 1 1 iter of water
to be analysed 1n the
Imhoff cone
- record the volume of
settled material after 15
min, 30 min, 1, 2, 4, 8
and 24 hours and enter
the results in the record
sheet
- empty the water from
the test tube by removing
the screw and clean the
Imhoff cone
- tighten the screw
Imhoff cone
measuring cylinder
screw
+ 5 ml
Settleable Solids Test Cone
Page 121
11/7
5. Suspension Stability
The stability of a suspension and the settling properties of
the suspended matter can be determined by a sedimentation test.
The record of turbidity decrease versus time is the simplest
monitoring procedure for such a test. The water sample must be
kept undisturbed during the test period. Therefore, small water
volumes are extracted carefully and the turbidity measured in a
common turbidity meter. The equipment for this test is not
included in IRCWD's field test kit. However, a simpler proce
dure for the suspension stability test is being developed. The
respective equipment will be included in the field test kit
once its suitability has been established.
Test Procedure for Suspension Stability Analysis:
- pour 1 liter of the water to be tested in a beaker or an
Imhoff cone
- carefully extract by a pipette and without creating turbu
lence about 25 ml of water approx. 2 cm below the water
surface
- pour the 25 ml sample in the test glass of the turbidity
meter and measure the turbidity
- take records after:
0, 15, 20, 60, 90, 120 min.
4, 8, 24, 32, 50 hrs.
Page 122
III/l
Appendix 3:
Simple Methods for Discharge Measurements
1. Introduction
Discharge measurements are necessary to control the flow through
the treatment plant. The total flow has to be distributed evenly
to the different filter units running 1n parallel. Unequal flow
distribution will usually reduce the overall performance of the
filters. Flow adjustments are required to cope with the weekly
and seasonal demand fluctuations. Furthermore, flow adjustments
are also necessary before and after cleaning and maintenance
work.
Fixed installations or mobile equipment are used for discharge
measurements. Since flow control plays an important part 1n
treatment plant operation, the use of fixed installations 1s
recommended.
2. Fixed Installations
Flow meters are relatively sophisticated and mechanically sen
sitive. Especially solid matter (sand, silt), carried by the
water, can easily damage the device. It 1s therefore strongly
recommended not to use such equipment 1n water treatment plants.
Flow measurements at the outlet of a clear water tank might be
the exception.
V-notch weirs are simple, strong and cheap installations, and
therefore most suitable for flow control in water treatment
plants. Weirs can be made from wooden boards or preferably
steel plates. The weir's discharge is measured by recording the
water height above the deepest point of the weir's crest.
Page 123
I I I / 2
A gauging r o d , f i x e d at a d i s t a n c e of minimum 30 cm f rom the
i n l e t w e i r , w i l l ease measurements. Compared to a 90° angle
w e i r , V-notch w e i r s w i t h a 60° ang le w i l l i nc rease the accuracy
of the r e a d i n g s . S lo t - shaped ho les i n the w e i r ' s p l a t e and i n
the gauging rod enable easy and accu ra te ad jus tment of the
h o r i z o n t a l p o s i t i o n . F i g . 36 g i ves more d e t a i l s on the p o s s i b l e
dimensions of a w e i r ' s p l a t e . The r e l a t i o n s h i p between water
h e i g h t and w e i r ' s d i scharge i s l i s t e d i n Table 9 and graphed in
F i g . 37.
Table 8 D i s c h a r g e over a 60° V-notch w e i r
Height o f hw (cm)
above weir
1 2 3 4 5 6 7 8 9
10
water
c res t 1/s
0.01 0.05 0.13 0.27 0.46 0.73 1.08 1.50 2.02 2.63
f low rate 1/Hin
0.6 3.0 7.8
16 28 44 65 90
121 158
m3/h
0.036 0.180 0.470 0.970 1.7 2.6 3.9 5.4 7.3 9.5
t 5 2 i — m — r ^ T 1 I v-notil ' '
5Qft 7* | 66 [ 8 6 | 69 |5Q
F1g. 36 D e t a i l s of
a 60° V-notch
2 nun rubber stal 3 mm thick stetl plate
I Omm bolt
Page 124
I I I / 3
8
6
4
2
0 0.5
30 60 90 120
2.5 t/s
150 l/min
1.8 3.6 5.4 7.2
Discharge
9.0 rn^/h
Fig. 37 Calibration Curve
3. Mobile Devices
Auxiliary equipment is required for the calibration of measuring
weirs or for direct flow control if V-notch weirs are not pro
vided. The simplest method to measure water flow is to record
the filling time of a determined bucket volume. With this method,
however, a watch is necessary but might not always be readily
available. Furthermore, this procedure is inaccurate for high
flow rates as the filling time becomes very short and easy
handling is hampered by the weight of the filled bucket.
Therefore, IRCWD has developed a more suitable flow control
device which is illustrated in Fig. 38. The overfalling water
flows into a bucket whose lower end is equipped with a calibrated
nipple through which the water is discharged. An equilibrium
between in and outflow will soon be established. The water
height from the centre of the nipple is recorded and the dis
charge read from the graph presented in F1g. 39. This method
does not require a watch nor special material. A commonly used
bucket or a small drum can be used as vessel. The nipple is
assembled with standard pipe fittings and does not require great
Page 125
III/4
accuracy with respect to its length as shown by the graph. A
separation wall with an opening of approx. 2 cm above the ves
sel's bottom creates a turbulence-free water level in the ef
fluent's compartment. Finally, the distance from the centre of
the nipple is marked on a half cm scale in the Inner wall of
the bucket. Flow rates between 6 and 30 1/min can be measured
accurately with this simple device equipped with a 1/2" nipple.
Larger nipple sizes can be used for higher flow rates and to
reduce the water level difference required by the measurement.
The presented device can easily be handled by a caretaker and
should therefore be available at every treatment plant.
Principle of flow measurement
Section of the bucket
© icpirjtion will
@ hmdlf
®
2cm ]
25
20-
15
10'
* ft V
Section of the nipple
1 thrud V n i p p U [iflitdt d u m m t tt.Omm)
2 Htm nut
3 » i l * will of the containtr
Fig. 38 Simple Flow Control Device
Page 126
I I I / 5
— h - f — f —
o nipple length 45mm
^
J i
t
/' i
T / / "•
5 6 7 8 9 10 20 30 40 50
Discharge [ l / M i n ]
F G
•
J r «> X
30
25
20 IH 16 14 12
10 q 8 7
K
5
4
3
Fig. 39 Calibration Curve for 1/2" nipple
4. Flow Control and Distributor Box
V-notch weirs are usually installed in special structures used
for flow distribution and possibly also for maximum flow limi
tation. An example of such a structure is Illustrated in Fig. 40.
This illustration shows a flow control box used in the raw
water supply line and placed In front of the treatment plant.
The flow which runs through the outlet pipe to the treatment
plant is measured by the V-notch weir and gauging rod. A rec
tangular overflow weir 1n the inlet chamber limits the maximum
flow through the treatment plant. The surplus water 1s dis
charged through the overflow pipe.
The controlled total flow through the treatment plant must be
evenly distributed to the parallel running treatment units.
This is achieved by a distributor box equipped with several
V-notch weirs. Since such a box concentrates the flow control
in one installation, it simplifies the hydraulic lay-out of a
treatment plant. In such a set up, the inlet weirs of the HRFs
can for instance be omitted as illustrated in Fig. 32 and
Appendix 4.
Page 127
III/6
Fig. 40 Details of a Flow Control Box
Plan
"weir level" overflow
g
gauging
O
V-notch weir
60
40
i;
Section A-A
Page 128
IV/1
Appendix 4:
Construction Details of a HRF
Plan
drain channel
filter (2 units)
drainage slide gate
1 I inlet I
drain channel
r. r '
ir>
r-
8 C«J
IT) cy
O
o
100
. O""
m s^
•
,
i
'
, :
^ ^ v . -^ -
" ^ " '-•-•
S\ SS SS
mmuiiiHi
%s wifgrr:
3 : £ S
extension phase 2
prefabricated concrete slabs
effluent : J ; I walls with ppen weir T ^ r vertical joints
outlet J, 75 [J. 240 |.| 240 11100 |
I- approx 850
^
X
2
8
1
Page 129
I V / 2
Section A - A
O 150
Section B - B
Page 130
V/l Appendix 5:
Salient data and features of a SSF
(for more detailed Information see Ref. [1])
Design criteria
Vf
A
"w
hf
filtration velocity
area per filter bed
number of filter beds
height of supernatant water
depth of filter bed
depth of underdrains system
and filter support
specification of filter sand
effective size
uniformity coefficient
specifications of filter support
si ze/depth
0.1 m/h (0.1 - 0.2 m/h)
10 - 100 m 2
minimum of 2
1 m (1 - 1.5 m)
1 m (1 - 1.4 m)
0.4 m (0.3 - 0.5 m)
0.15-0.35 mm d10% = deff UC = 2 - 5
15 - 25 mm / 15 cm
4 - 6 mm / 10 cm
1 -1.5 mm / 10 cm
flow control
fil'.Slilli^
©*©—"-common design faults
Fig. 41 Main Features of a SSF and Common Design Faults
Page 131
V/2
Common design faults and their consequences (see also Fig. 41)
1. Inappropriate or missing flow rate control installations +
filter often overloaded or operated at frequent flow rate
changes.
2. Water pressure in effluent line lower than the top level of
the sand bed • generation of negative pressure (vacuum) in
the sand bed resulting in air release and additional filter
resi stance.
3. Missing installations for watering the sand bed from bottom
to top •>• air binding in the sand bed resulting in a initial
ly high filter resistance.
4. Inappropriate sand size and depth of filter bed •» poor ef
fluent quality (coarse sand, small depth) or short filter
runs requiring frequent cleaning (sand too fine).
Common operational problems
1. Turbidity and suspended solids concentration in the raw
water too high for SSF application. Turbidity should prefer
ably be less than 10 turbidity units and the suspended
solids concentration lower than 2 - 5 mg/1 to achieve rea
sonable filter operation.
2. Missing auxiliary equipment such as tools and sand washing
installations. Failing to clean and replace the sand will
lead to exhaustion of the sand bed.
3. Untrained caretakers who do not understand the SSF process
are generally not motivated to operate the treatment plant
properly.
Page 132
VI
Appendix 6:
Design Form
CESlGN rORW Mac of ««Ur Mfrnly:
OIUrUt/llcglo«:
I. Hater Source Qty ' l iny Dla
<1icN'9» 1/
tu'bli lty tl
f . l l r jo l l l t y • ) / ]
i u » . w l K J cone. • , /
org»niti (0^04*. COD*) • ) /
bit; , t r i t IE-toll* , fet.1 st'ept*) /IOC
J. HlKfMllTt Stu^te
«»t1lit)1( yet /*0 PCB*:
bette' quality ye* /no type of lourct:
COiil'. coitt hlghtr / w l l t r
J mter Supply Sy«ea
9/»»ity icMa* /ou>oM icnea*: •ccninictl pm;
«. 0«)1y Qp«ftUon *mrt
for f t - •«!*•* pueclifl itatlon Uri/djy
'or ( r e i t s f t pl*n( conM- l n n r » m * f l declining nuOui l . . . . r r i / d l * r i te
I hri/d)
•«'-«« l" t'nt D D D >w • D D » D n D
Deilqnrt by:
D«tt:
S. Watqr Qttt»nd
population
dally p«r ciplt l deoand
JiMon«1 de*w»4 fw .
present pHitt 1 pM<> 2
1 4*1 ly dnaM
6. »«• Hater Supply
or»*lty
requlre*
nuaMr a
*elua* o
7. Trettaeri
uoply -a»go to 7.1
pu*p <ap«1ty
puap*
rw utter tank -»po to 7.J
7.1 Sedlaentttlon Tint
I W f K I
rtoulrM
£«t*fltt(>
required
dieeniio
7.; Mtr
o<d
inrfttt are*
tla»
• ° , J -l of 1 vnlt
itngtn
•K in
depth
f i l i a t i o n rate
required f i l ter ire*
dtntfiilbn) of 1 unit
7.3 SSF
rtqulrto ( l i t e ftt
nwb*r of imm
d1»iiloni of 1 unH
length
•tdth
J, I Piped water tupply
B.t Seat-piped nater upoly
people per nendpuap
reeulred nwaber of hindpvaet
TOIUM of 1 cittern
r of t i l ler
Page 133
VII/1
Appendix 7:
Outline for Caretaker Training
1. Introduction
Proper caretaker training in the operation an<i maintenance of
water supply installations is, in many cases, often seriously
neglected. Incorrect use, damage and finally abandonment of the
installations are generally the consequences of such a neglec-
tion. However, a sound and economic operation of a water supply
system requires, among other prerequisites, well-trained and
skilled manpower. Comprehensive training of local staff is
therefore essential.
Transfer of knowledge is the main goal of a training programme,
but motivation and guidance of the caretakers are other impor
tant components of such a programme and should therefore not be
limited to a short-term course.
Caretakers are preferably trained in their local language by
supervisors attached to the operation and maintenance section
of the responsible Institution. These supervisors will also
visit the water supply schemes on a regular basis, check their
proper operation, support the local staff in their activities
and maintain an exchange of information between field and of
fice.
A training programme is briefly outlined below. The topics of
the programme cover the treatment part only. More comprehensive
training guidelines for the operation and maintenance of rural
water supply schemes have been published by IRC (12).
Page 134
VII/2
2. Schedule
An ideal training programme might be divided into 3 parts.
Timing, aim, location and duration of the 3 parts are summa
rized in Table 9.
3. Outline of the Syllabus
The topics to be covered by the different parts of the training
programme are suggested hereafter. The list might be incomplete
and possibly needs to be adapted to local conditions.
Part 1: - visit of an existing treatment plant comprising HRF
and SSF
- explanation of the treatment process and operation of
the plant
- discussion of the water quality problems faced by new
schemes
- assessment of the Interest in water treatment of
future users
Part 2: - the main objectives of water treatment
- the main features and processes of HRF and SSF
- the filter operation, especially
- discharge measurements and adjustments
- determination of the filter resistance
- procedure for filter (re)start and
cleaning
- hydraulic and manual filter cleaning
- gravel and sand cleaning
- water sampling
- the carrying out of simple water quality tests
(turbidity, fi1trabi1ity, settleable solids)
- the monitoring of the treatment plant (logbook
keepi ng)
- the maintenance work
- the annual working plan
Page 135
V 11/3
Part 3: - refreshment and consolidation of the basic training
course (Part 2)
- on-site training 1n operation and maintenance of the
pi ant
- review and discussion of experienced operational
problems
- inspection of the installation and organisation of
major maintenance work
- review of the logbook and the monitoring results
Table 9 Training Programme
Part
1
2
3
T1m1ng
pre-project phase
or
before/during con
struction of new
treatment plant
during or at the
end of the con
struction phase
during the opera
tional phase
Aim
presentation of
treatment process
to future users
and motivation
basic training of
future caretakers
in the operation
and maintenance of
HRF and SSF
supervision, guid
ance, support of the
operation and mainte
nance of HRF and SSF
(information exchange)
Location/Duration
existing HRF and
SSF plant
1 day
existing or new
HRF and SSF plant
3-5 days
on the site
by regular
f iel d vi s11
Page 136
VIII/1
Appendix 8:
HRF and SSF Monitoring Programme
1. Aim and Procedure
The aim of a monitoring programme is:
- to assess the treatment plant performance
- to establish guidelines for the operation of the treatment
pi ant - to improve treatment plant operation and efficiency
The caretaker carries out the field test and monitors, by logbook
keeping, the operation and performance of the treatment plant.
The supervisor attached to the operation and maintenance sec
tion of the responsible institution supervises by means of
regular visits the monitoring programme of the caretaker, takes
water samples to be analysed In the laboratory and summarizes
the monitoring results in annual reports.
2. Field Records
The monitoring programme has to cover the quantitative and the
qualitative aspects. Discharge measurements characterize the
operational conditions of the treatment plant and provide the
quantitative information. Water quality tests allow the quali
tative assessment of the treatment process. Treatment plant
operation requires flow control and adjustments on a daily
basis. The water quality tests should also be carried out reg
ularly, i.e. at weekly intervals. The equipment necessary for
the discharge measurements and for the water quality tests must
therefore be permanently available at every treatment plant.
A proposal for a field monitoring programme 1s summarized 1n
Table 10.
Page 137
V111/2
3. Bacteriological and Chemical Water Analyses
Bacteriological and chemical water analyses require more costly
equipment which can generally not be allocated to every treat
ment plant. The tests should also be performed by professional
staff. It is therefore recommended for the supervisor to per
form such tests either at the site, with field test equipment
brought from the laboratory, or to take samples which will be
analysed in the laboratory. Field testing excludes the risk of
delay and mishandling of the water samples, and should there
fore be taken into consideration provided the equipment is
properly maintained and checked prior to each field visit.
A proposal for a bacteriological and chemical monitoring pro
gramme is summarized in Table 11.
4 . F i e l d V i s i t s
The supervisor will conduct personally the on-site training of
the caretaker, and will therefore also be present during the
initial start of the treatment plant operation. Later, he will
assist the caretaker in his daily activities and supervise the
operation, maintenance and monitoring of the plant. The fre
quency of his visits depends, among other criteria, on the
ability of the caretaker to operate his water supply system.
Initially, however, the field visits will be carried out weekly,
then monthly and subsequently every 2-3 months.
Such a post-project assistance is essential to ensure proper
use of the Installations, to identify possible problems at an
early stage and to compile the practical experience gained for
future projects.
Page 138
5. Evaluation
V 111/3
The results of the monitoring programme are compiled in annual
reports by the supervisors. These reports include the data
sheet of the field records and possible analyses carried out 1n
the laboratory. They also contain a short description of the
operational experience (plant performance, encountered practical
problems, exceptional events) and the planned activities (opera
tional modifications of the plant, major maintenance work
etc.).
Table 10 Field Monitoring Programme
parameter
flow rate
filter resistance
filter resistance
turbidity
filtrability
settleable solids
record
HRF + SSF
HRF SSF
of raw water
and HRF + SSF
effluents
(at high turbidity,
filtrate of each
HRF gravel pack)
raw water
frequency
every 2 days
1 x / week
every 2 days
2 x / week
(dally at pe
riods of high
turbi d1ty)
1 x / week
Page 139
VIII/4
Table 11 Bacteriological and Chemical Monitoring Programme
analysis
E. coli or
total coliforms
or Fee. Strept.
PH conducti vity
total hardness
a 1 k a 11 n i ty
Ca 2 +
Mg 2 +
susp. soli ds cone.
sample
raw water and
HRF+SSF effluent
raw water
frequency
monthly for the
first half year,
later occa
sional ly
every 2 months
Page 140
IX/1
Appendix 9:
Examples of HRF Application
In order to illustrate HRF application, 3 design examples are
presented hereafter. A new water treatment plant comprising 2
HRF and 2 SSF units was set up in Kasote, Tanzania. The water
treatment plant in Cocharcas, Peru, has been rehabilitated by
the installation of 2 HRFs placed in front of 2 existing SSF
units. The last design example presents an HRF application at
the refugee camp FAU 5 in the Sudan. With respect to HRF appli
cation, IRCWD acted as technical advisor in the 3 projects.
The salient figures of the HRFs installed at the 3 sites are
presented in Table 12.
1. Kasote/Tanzania
Kasote which is located near Tanganyika Lake covers the water
demand of Its present 3000 inhabitants by drawing water from
the river Kapondwe. A small weir feeding an open and 850 m long
canal has been installed at the river. The water of this canal
drives 2 hydraulic rams which pump the water to the storage
tank located 70 m higher. This 90 m3 volume reservoir feeds the
distribution system consisting of a 3350 m PVC and PEH pipeline
network and 14 double-tap public standposts. The construction
of the water supply scheme was carried out with village par
ticipation between 1982-84.
Since the river water is bacterlologically polluted and of high
turbidity, with peaks of approx. 200 NTU during the rainy sea
son, the village decided to install a treatment plant which was
completed in November 1985. It comprises 2 HRF and 2 SSF units
located in front of the existing storage tank. A sedimentation
tank was omitted as the coarse solids are retained by the open
canal feeding the hydraulic rams.
Page 141
IX/2
Table 12 HRF Design Examples
name/country
of the schemes
design capacity
present population
raw water source
max. turbidity
HRF:
number of units
filtration rate
filter length
• coarse gravel
• medium gravel
• fine gravel
- filter width
- water depth
construction period
specific constructior
costs of the HRF
(m 3/d)
(NTU)
(m/h)
(HI)
(m)
(m)
($/m 3/d)
Kasote,
Tanzania
196
3000
ri ver
200
2
1
6
4
2
3.7
1.1
May '84
Nov.'85
130
Cocharcas,
Peru
103
650
i rri gati on
canal
500
2
0.6
3
2
1
3.6
1.0
Dec.'85
April'86
41
FAU 5,
Sudan
240
20000*
i rri gation
canal
2000
4
0.75
4
4
2
2.0
1.2
Aug.'85
Sept'85
130
*) planned number of refugees
Page 142
IX/3
The design figures of the HRF are summarized in Table 12. The
foundation and the slab of the filters are composed of rein
forced concrete and the HRF walls of reinforced concrete blocks.
Drainage pipes (0 50 mm and perforated with slots) have been
provided in order to allow hydraulic cleaning of the HRFs.
3 drainage pipes are installed in the first filter compartment,
2 in the second and 1 in the last filter section.
The SSFs are of circular shape (0 5.1 m) with walls consist of
reinforced concrete blocks. The height of both the sand bed and
the supernatant water are approx. 1 m. The 2 SSFs are operated
at a constant filtration rate of 0.2 m/h.
Fig. 42 HRF under construction at Kasote, Tanzania
Page 143
IX/4
Operation of the treatment plant started in January 1986. The
first practical experience is promising. The filter resistance
of the SSF was recorded at 60 cm after a filter running period
of more than 4 months, which also included the rainy period
between February and April. None of the filters had to be
cleaned after this specific running period. In terms of bacte
riological water quality improvement, the raw water faecal strept.
level of 300/100 ml was reduced to 200/100 ml by the HRF, and
to less than 2/100 ml by the SSF (counts during the dry season
with a raw water turbidity of 5.5 NTlM .
The water treatment plant has been constructed under the super
vision of the Regional Water Engineer's office in Sumbawanga
and with NORAD's support. Fig. 42 shows the construction stage
of the HRF.
Cocharcas/Peru
Cocharcas is located in the Mantaro River Valley, Department of
Junin in the high Peruvian sierra. The village counts at pres
ent approx. 650 inhabitants. The existing water supply scheme,
which was constructed with community participation in 1977-78,
comprises an Intake located on a small irrigation canal, a
sedimentation tank, two SSFs, a reservoir and distribution
system with single-tap household connections.
The irrigation canal which draws its water from a river located
4-5 km upstream from the intake, 1s heavily exposed to human
and animal contamination. Turbidity Increases up to 500 NTU
during the rainy season which lasts from November to March.
This high turbidity together with a faulty design, insufficient
construction experience, inadequate operation and maintenance
gave rise to an unstable and irregular operation sequence and
constituted a constant threat to the health of the community.
Page 144
IX/5
The most important component in the rehabilitation of the water
supply scheme was the construction of 2 HRFs. Furthermore, the
intake was repaired and equipped with adequate flow control
devices. New sand beds and underdrainage systems as well as
adequate overflow and cleaning facilities were Installed in the
SSF units. The salient figures of the HRF lay-out are also
summarized in Table 12, whereas Fig. 43 shows the HRF construc
tion and Fig. 44 contains more structural details on the HRFs.
The water supply scheme was rehabilitated between December 1985
and April 1986 with extensive community participation and with
the assistance of DelAgua/ODA/CARE and direct involvement of
the Rural Sanitation Division of the Ministry of Health (DISAR)
in Huancayo.
Fig. 43 HRF under construction at Cocharcas, Peru
(picture by DelAgua)
Page 145
IX/6
F1g. 44 Lay -ou t of the HRF at Cocharcas, Peru
lx o o u -)
Page 146
IX/7
3. FAU 5 / Sudan
The Swiss Disaster Relief Unit set up the infrastructure for a
20000 people refugee camp near Wad Medanl in the Sudan in
August/September 1985. A water supply system, permanent build
ings required for a hospital, feeding centres and an adminis
trative edifice had to be constructed. Great emphasis was
placed on light-weight construction material, short construc
tion time and simple installation. Furthermore, the installa
tions had to be sturdy and easy to operate and maintain.
The raw water which is drawn from an irrigation canal situated
nearby is supplied by the river Blue Nile and undergoes minimum
treatment, I.e. turbidity reduction before disinfection. This
is why the water treatment plant comprises 2 sedimentation
tanks and 4 HRFs. The filtered water is thereafter disinfected
before it is stored in a clear water reservoir and distributed
to the camp by a number of public standpost. Disinfection is
used instead of SSF since no sand is available at the site and
because the medical personnel at the camp will be able to run
the disinfection plant.
The sedimentation tanks and HRFs are designed as earth basins
with inclined walls and earth dams consisting of bags filled
with the excavated soil. The basins were then coated with a
prefabricated plastic lining. Before the HRFs were filled with
gravel, perforated pipes were installed to enable hydraulic
filter cleaning which is carried out by means of a high dis
charge pump.
The HRF design values are presented 1n Table 12. Figs. 45, 46
and 47 Illustrate the construction procedure of these HRFs. The
appropriate and sound design of the treatment work made it
possible to construct the plant with simple tools, minimum
external material requirements and time. The treatment plant
Page 147
IX/8
was completed in 6 weeks time by approx. 100 casual labourers
under the supervision of a foreign overseer.
The raw water from the irrigation canal is heavily contaminated
as several other refugee camps are located upstream from the
intake. In addition, it exhibits high turbidity in the range of
1000 to 2000 NTU, and the chlorine demand amounts to 20 - 40
mg/1 . The first practical experience with the treatment plant
revealed that the raw water turbidity could be reduced by the
sedimentation tanks to roughly half of its initial value. The
HRF effluent turbidity was recorded at 5-20 NTU and the chlo
rine demand was reduced to 2 - 3 mg/1.
This last example illustrates an unconventional construction
technique. The use of simple tools, proper guidance, minimal
material requirements and time were the main characteristics
for the installation of this self-reliant and efficient treat
ment plant.
Fig. 45 Excavation of the HRF earth basin (picture by Swiss Disaster Relief Unit)
Page 148
IX/9
Fig. 46 Installation of
the drainage
pipes
Fig. 47 Filling the HRF with filter material
(pictures by the Swiss Disaster Relief Unit)