63
HOUSEKEEPING ABSENTEEISM ANALYSIS FINAL REPORT FEBRUARY 3, 1991 WENDY A. ASIK MOON CHUNG RAJ SETH
| Date post: | 07-Feb-2018 |
| Category: |
Documents |
| Upload: | dangnguyet |
| View: | 218 times |
| Download: | 2 times |

HOUSEKEEPING ABSENTEEISM ANALYSIS
FINAL REPORT
FEBRUARY 3, 1991
WENDY A. ASIK
MOON CHUNG
RAJ SETH
Executive Summary
The purpose of the housekeeping analysis was to collect, sort
and analyze data on housekeeping staff absenteeism in order to
determine its underlying reasons.
The goal of the project is to identify avoidable and unavoidable
causes of absenteeism in the housekeeping department.
Classification and shift structure of the housekeeping staff,
focusing on the absenteeism of its members, has never been
investigated. Housekeeping management desires information on the
total absenteeism and its breakdown into categories such as class and
shift. Additionally, summary absenteeism information is also
requested on the categories month, reasons and day of the week.
The approach used in our analysis of the project consisted of
collecting the Absentee forms from eight supervisors which consisted
of fifty eight employees, which is about twenty percent of the
approximately total 300 employees that work for the University
Hospitals. The Absentee forms indicated the number of hours that
an employee, has worked on each of their scheduled days and a
reason for why they were absent. We sorted this data by the day of
the week, class, shift, supervisor, month and the reasons for the
absence. In addition to the data received, we conducted an extensive
survey of the Housekeeping staff. The survey was designed to
determine the general satisfaction level of the Housekeeping
employees with their schedules and allow write-in comments
pertaining to employee scheduling problems.

Most of the absences occurred near or during the weekend day
of the shift. A possible schedule change would be conducive in
decreasing the number of absences that occur during these weekend
days. For example, having a rotating schedule, with the chance to
have one of the weekend days off during the month for the shifts
that have to work the weekend shift every week.
The monthly chart shows that the highest number of absences
occur during the summer months of July and August. Knowledge of
this information can allow management to make proper adjustments
in employee scheduling during these periods.
Personal Day Time revealed that most of the employees use
most of their three PDT’s by the end of the first month. An incentive
plan that would help alleviate this problem would be to offer an
extra PDT if they were to keep all their PDT after a certain date.
Another possibility would be to allocate only one PDT every four
months.
Many of our initial hypothesis proved to be true but at the
same time we revealed some startling conclusions. People tend to be
more absent during the weekend days was expected, but we found
out that higher pay and seniority does not necessarily bring about
the happiest workers. Our survey indicated many were disgruntled
with their working situation. Also many Monday-Friday workers
were less satisfied then their counterparts that worked on the
weekends. The study of the many charts and graphs are crucial to
the full understanding for the underlying reasons to the high
occurrence of absences.

Introduction and Background
Purpose
The purpose of the housekeeping analysis was to collect, sort,
and analyze data on housekeeping staff absenteeism in order to
determine its underlying reasons.
Goals and Objectives
Investigation can reveal the extent as well as identify
avoidable and unavoidable causes of absenteeism in the
housekeeping department. A possible change in housekeeping staff
structure may prove necessary.
Background/Environment Affecting Proj ect
Classification and shift structure of the housekeeping staff,
focusing on the absenteeism of its members, has never been
investigated. Housekeeping management desires information on the
total absenteeism and its breakdown into categories such as class and
shift. Additionally, summary absenteeism information is also
requested on the categories day of the week, month, and reason.
Present housekeeping staff structure:
Classifications:
1. Wall Washer (WW): Highest seniority and top level
custodian position
2. Custodian 2 (C2): Second level custodian position
3. Unit Custodian (UC): Level one custodian position
1

Shift Structure:
40 Hour Shifts: Monday-Friday team
Sunday-Thursday team
Tuesday-Saturday team
32 Hour Shift: Friday-Monday team
The necessary information to carry out the analysis will be provided
through absentee forms which are completed by individual
supervisors.
Key Issues/Alternatives
To locate available information in order to analyze causes and
magnitude of housekeeping staff absenteeism.
To determine utilization of sick time and Personal Day Time
(PDT), and vacation time as reasons of absenteeism.
To determine whether the present scheduling is satisfactory.
Approach and Methodology
The Absentee forms were collected from the Housekeeping
Department on October 27, 1990. The Absentee forms consists of a
yearly chart showing the number of hours that the employee has
worked on a particular day throughout the year. If an employee was
absent on a day that he was scheduled to work then a notation is
made on the Absentee form indicating the reason - i.e. the employee
was sick or using their Personal Day Time. On a separate sheet
attached to the yearly calendar is a detailed summary of the excuses
for the days in which they were absent or tardy. From these
2

Absentee forms our sample size consists of 58 employees which is
about twenty percent of the approximately 300 employees that are
currently working for the University of Michigan Hospitals. Our
sample period was from January 1,1990 to October 26, 1990.
All this information which consisted of 1421 absences were
then manually keyed in on MicroSoft Excel and sorted by the
different characteristics such as absences by the day of the week,
class, shift, supervisor, month and the reasons for the absences. This
data was then transported to a program made available by the
University of Michigan called Systat which enabled us to analyze the
data from a statistical viewpoint.
Initially the scope of our project was to also have a program
implemented in the Housekeeping Department. With this in mind we
started looking into a powerful data base system. We began an
analysis on database systems that would serve the needs of the
housekeeping department. After completing several interviews with
Winnie Han of Compuware and Maralynn Pendorff of University of
Michigan Medical Center Hospital Information Systems and a
literature analysis of several database systems, we decided that the
most optimal database would be a system called FoxPro. As the term
progressed we later found that a system with the same concept was
being implemented by a company called Kronos. Our group began to
work with Bud Lane, the sales manager for Kronos, on trying to use
their patented program for the purpose of our project. After visiting
the computer facility in Novi and working extensively with the Time
Accounting System, we found that the information provided, without
much additional work by the programmers at Kronos would not
3
provide the necessary information that Mr. Grady currently needed
for our analysis of Housekeeping absenteeism.
In addition to the data received, we conducted an extensive
survey of the Housekeeping staff. The survey was designed to
determine the general satisfaction level of Housekeeping employees
with their schedules and allow write-in comments pertaining to
employee scheduling problems. See Attached Analysis of Survey
Results.
Current Situation
Currently Kronos has began to implement their system in the
Housekeeping Department at five different locations around the
Hospital which will allow the employees to use their badge to clock in
and out. This information will then be transported to the main
computer system which will log the amount of hours that the
employee has worked. The advantage of this system is in helping
the Housekeeping department become a paper free department.
Hypotheses
Analysis was designed to test the following hypotheses.
1) Monday thru Friday employees are absent less frequently
than the other shifts on a percentage average basis of sampled
employees.
2) Wall Washers are absent less frequently than employees of
the two other classifications. This was hypothesized due to the
4

highest pay and lessor difficulty of work involved in the wall washer
classification.
3) 32 Hour workers are absent more frequently than the 40
hour workers. This is based upon the assumption that the shift of 32
hour worker (Friday-Monday) would lead to the higher frequency of
absences due to scheduling of work on both weekend days and
reasoning that it is more desirable/convenient to work on week day
versus weekend days.
4) Personal Day Time (A total of three allowed days) would be
used excessively in the beginning of each year. This would lead to a
greater frequency of absences in January and February.
5) Absences may be different according to supervisor because
of varying supervisory techniques.
Findings and Conclusions
Preliminary discussion will involve cumulative data involving
all sampled employees (a total of 58 employees and 1421 absences).
5

Absences by Day of the Week
10.00%
8.00%
6.00%
4.00%
2.00%
0.00%
AVERAGE DAYS ABSENT BY DAY OF THE WEEK
As can be observed from the above chart, the level of absenteeism is
fairly constant throughout the week with exception of Friday and
Sunday. On Fridays, the average days absent is 6.00 which is higher
than the general average of 4.54. On Sundays, the average days
absent is 3.65 which is lower than the average.
6
4.07
4.734.34
MONDAY TUESDAY WEDNESDAY THURSDAY FRIDAY SATURDAY
BASED ON A SAMPLE OF 58 EMPLOYEES FROM JAN 1- OCT 26 1990
6

Absences by Classification
40.00%
30.00%
20.00%
10.00%
0.00%
AVERAGE DAYS ABSENT PER PERSON BY CLASS
UNIT CUSTODIAN CUSTODIAN 2 WALL WASHER
BASED ON A SAMPLE OF 58 EMPLOYEES FROM JAN 1- OCT 26 1990.
Average days absent per employee are based on a sample of 33 unit
custodians, 22 custodian 2s and 3 wall washers totaling 1421 days
absent. The chart above represents Since only 3 wall washers are
represented in the sample, the chart above may not necessarily
reflect accurate average days absent per employee such that a larger
sample of wall washers would.
37.33
23.0924.86
7

Absences by Shift
30.00%
20.00%
10.00%
0.00% H
AVERAGE DAYS ABSENT PER PERSON BY SHIFT
As observed from the above graph, Sunday-Thursday employees
account for the least absences per person at an average of 20.1
absent days per employee. The highest ratio is seen in the Monday-
Friday employee at an average of 28.4 absent days per employee.
Ironically, this is opposite to the original hypothesis that employees
desire to work during the week days and thus, would be absent less
during these days. However, one must consider that certain
— I
MONDAY-FRIDAY SUNDAY-ThURSDAY TUESDAY-SATURDAY FRIDAY-MONDAYBASED ON A SAMPLE OF 58 EMPLOYEES FROM JAN 1- OCT 26 1990.
8
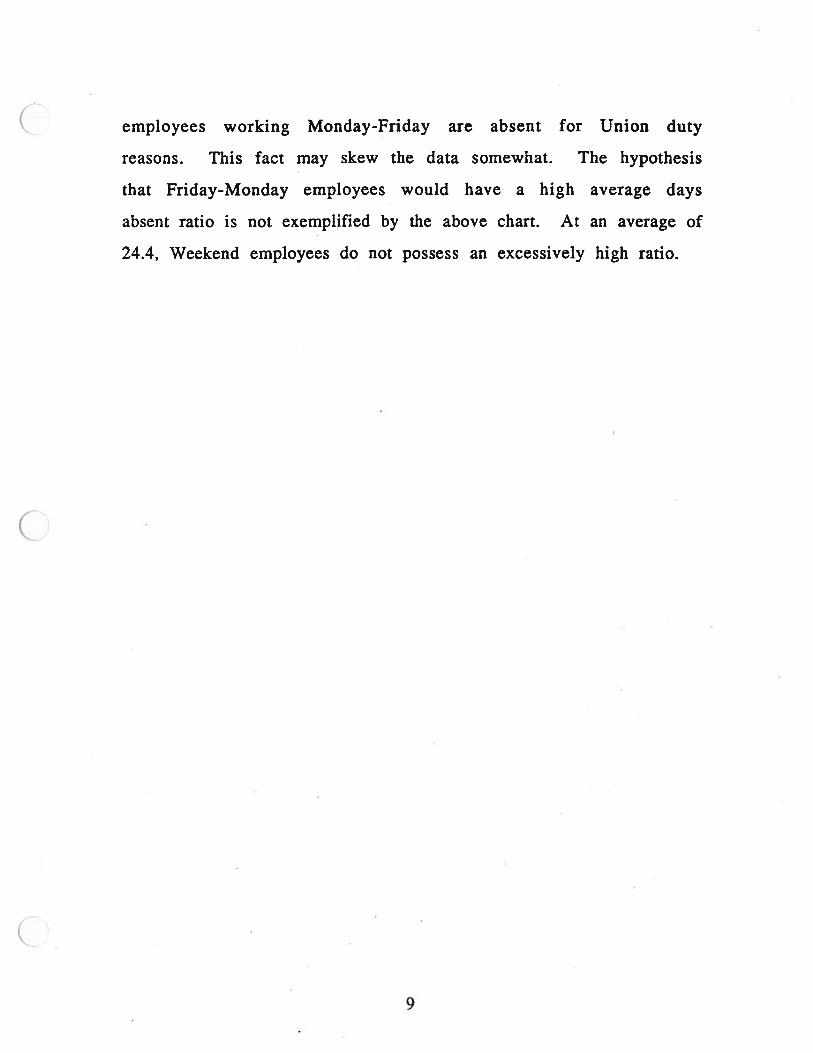
employees working Monday-Friday are absent for Union duty
reasons. This fact may skew the data somewhat. The hypothesis
that Friday-Monday employees would have a high average days
absent ratio is not exemplified by the above chart. At an average of
24.4, Weekend employees do not possess an excessively high ratio.
9

Absences by Month
20.00% T
15.00%
10.00%
5.00% -
0.00% -
ABSENCES BY MONTH
14.57% 14.29%
As can be observed from the Absences by Month chart, months of
July and August have the highest percentage of total absences. This
may be due to vacation scheduling during the late summer months.
These months are then followed by January, April and May. The
months with smallest absenteeism are February, March and
September. The month of October is not representative of employee
absences since our sample period ends October 26, 1990.
7.67% 7.74%
JAN FEB MAR APR MAY JUN JUL AUG SEP OCTBASED ON A SAMPLE OF 58 EMPLOYEES FROM JAN 1- OCT 26 1990.
10
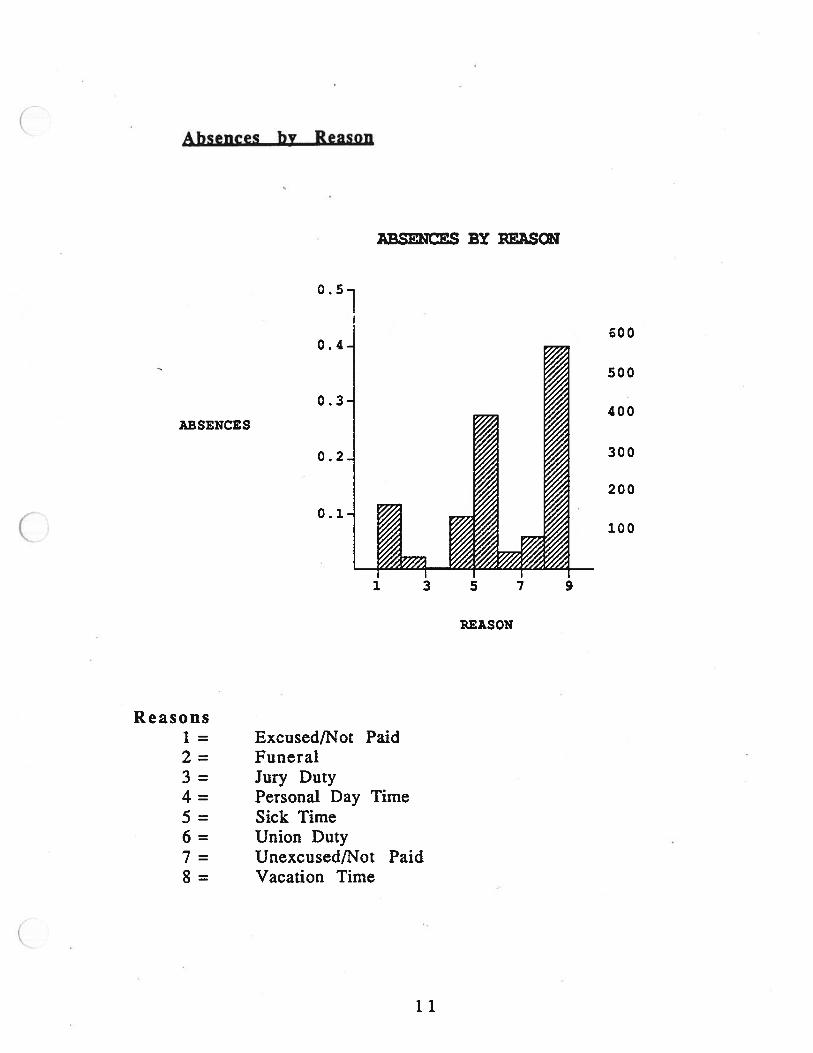
Absences by Reason
• BSS BY REAS
0.5
6000.4-
_
500
0.3-400
ABSENCES
0.2 300
200
0.1-100
1 3 5 7 9
REASON
Reasons1 = Excused/Not Paid2 = Funeral3 = Jury Duty4 = Personal Day Time5 = Sick Time6 = Union Duty7 = Unexcused/Not Paid8 = Vacation Time
11

Vacation and sick time account for the majority of absences. These
categories are then followed by excused/not paid category which
accounts for over 10% of total absences. Personal Day Time
approximately 10% of absences. Since each employee is given 3
Personal Day Time absences and the chart above represents 58
employees, it can be observed that most of au Personai Day Time
absences are used up within 10 months. Unexcused/not paid
absences account for about 5% of absences.
C’
C
12
35
30
25
20
15
10
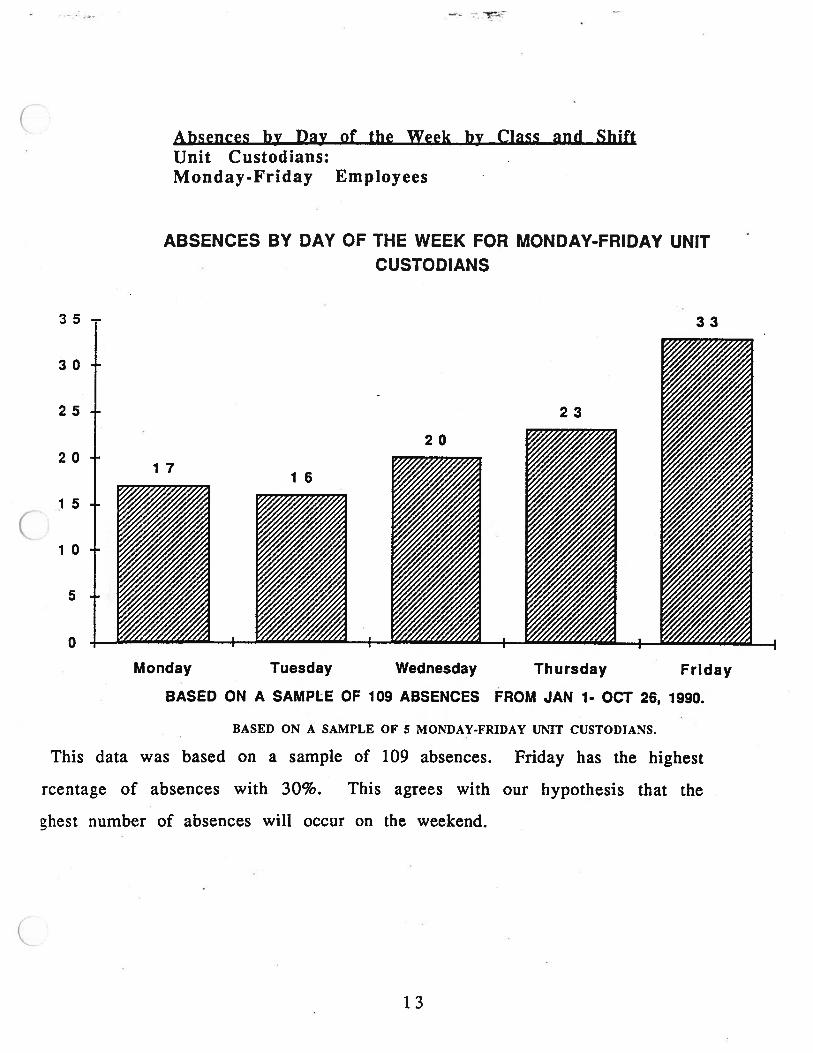
Absences by Day of the Week by Class and ShiftUnit Custodians:Monday-Friday Employees
ABSENCES BY DAY OF THE WEEK FOR MONDAY-FRIDAY UNITCUSTODIANS
Monday Tuesday Wednesday Thursday Friday
BASED ON A SAMPLE OF 109 ABSENCES FROM JAN 1- OCT 26, 1990.
BASED ON A SAMPLE OF S MONDAY-FRIDAY UNIT CUSTODIANS.
This data was based on a sample of 109 absences. Friday has the highest
rcentage of absences with 30%. This agrees with our hypothesis that the
ghest number of absences will occur on the weekend.
5
0
33
1716
20
23
13

Tuesday- Saturday Employees
70
60
50
40
30
20
10
0
ABSENCES BY DAY OF THE WEEK FOR TUESDAY-SATURDAY UNITCUSTODIANS
BASED ON A SAMPLE OF 12 TUESDAY-SATURDAY UNIT CUSTODIANS.
This data was based on a sample of 249 absences. Saturday has the
highest percentage, of absences with 27% of the absences occurring
on Saturday and 20% of the absences occurring on Friday.
Tuesday Wednesday Thursday Friday Saturday
BASED ON A SAMPLE OF 249 ABSENCES FROM JAN 1- OCT 26, 1990.
14

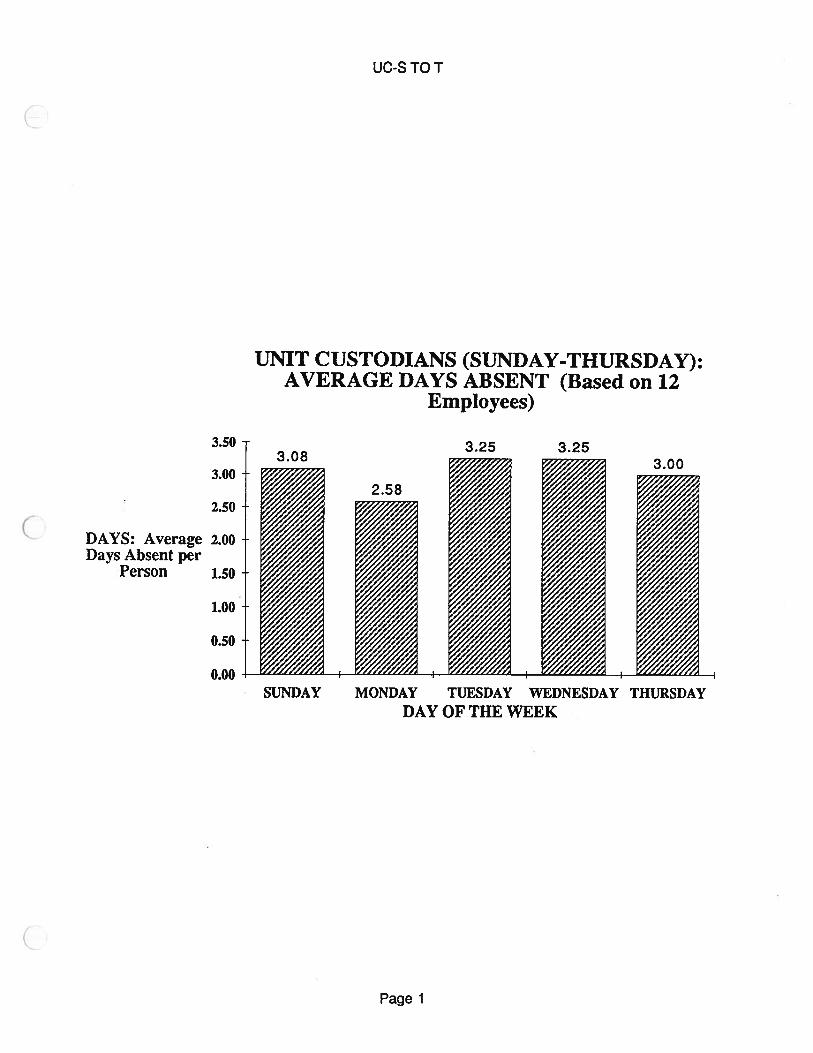
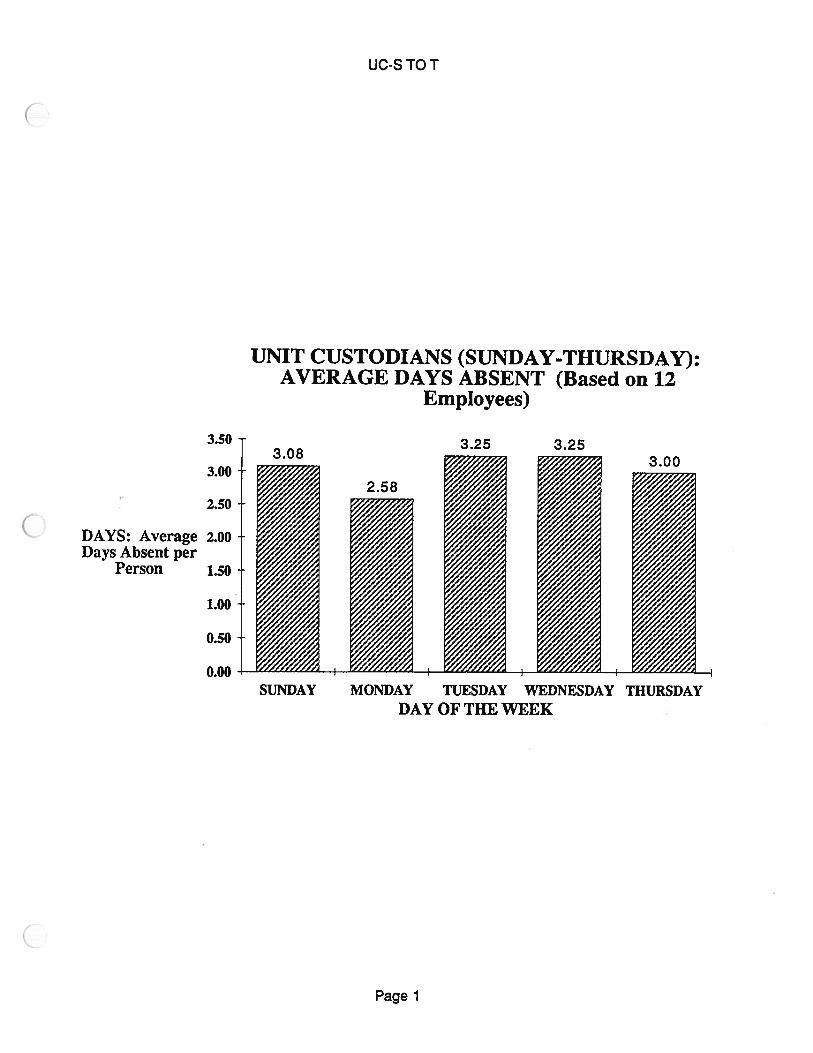
ABSENCES BY DAY OF THE WEEK FOR SUNDAY- THURSDAY UNITCUSTODIANS
59 58
50 46IiiiISunday Monday Tuesday Wednesday Thursday
BASED ON A SAMPLE OF 283 ABSENCES FROM JAN 1- OCT 26, 1990
BASED ON A SAMPLE OF 12 SUNDAY-THURSDAY UNIT CUSTODIANS.

35 -.
30
25
20
15
10
5
0
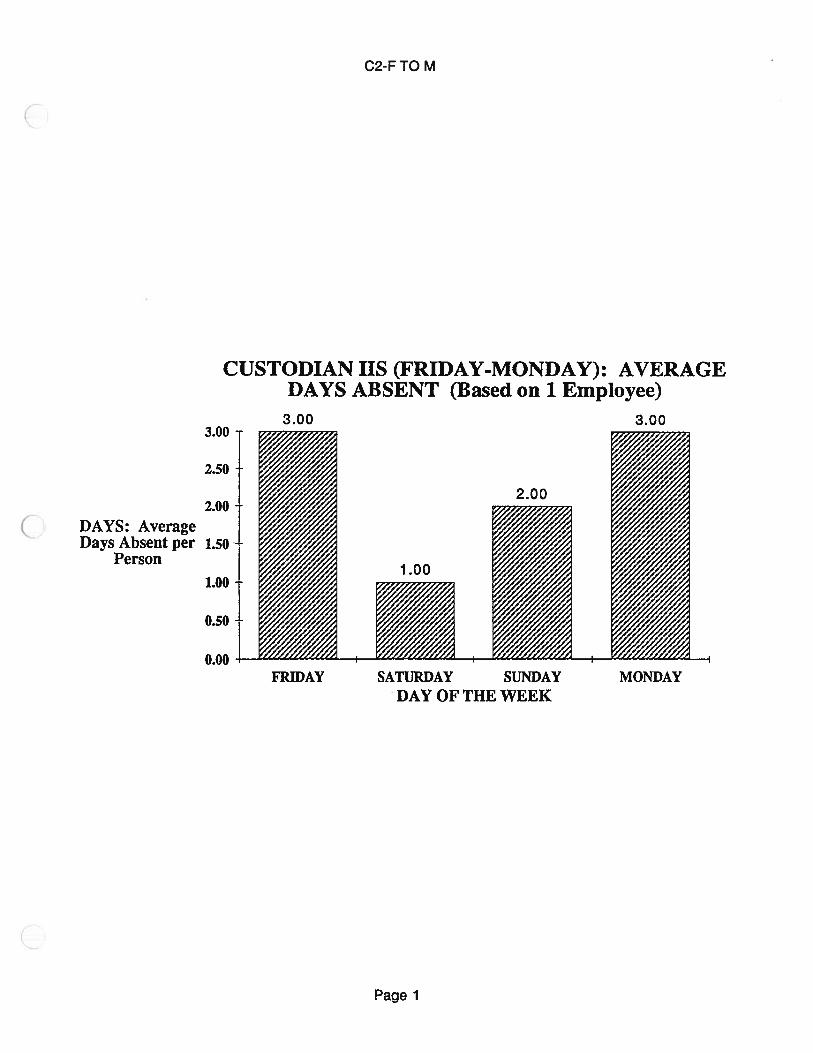
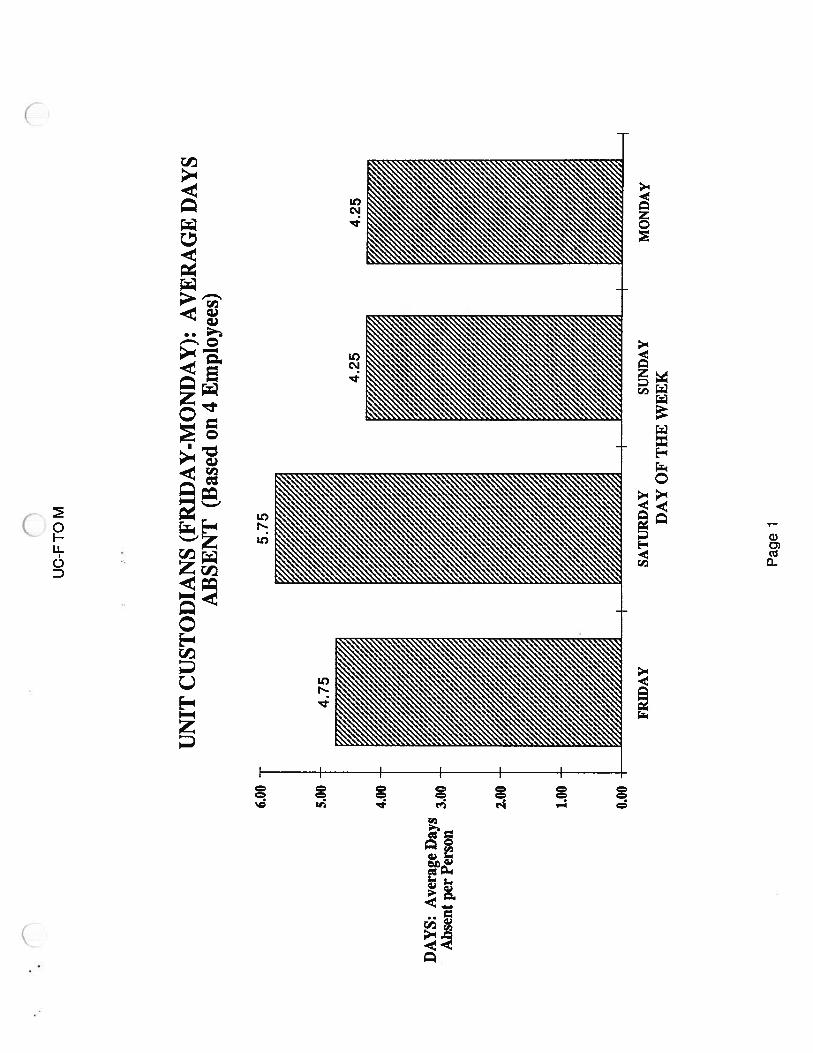
ABSENCES BY DAY OF THE WEEK FOR FRIDAY-MONDAY UNITCUSTODIANS
Monday Friday Saturday SundayBASED ON A SAMPLE OF 103 ABSENCES FROM JAN 1- OCT 26, 1990.
BASED ON A SAMPLE OF 4 FRIDAY-MONDAY UNIT CUSTODIANS.
This data was based on a sample of 103 absences. Saturday has the
highest percentage of absences with 30% of the absences occurring
on Saturday and 25% of the absences occurring on Sunday.
31
15

-I1
ct
‘-*
N0-
—.
NCD
cz.
C.
0
CD C.,
0 CD C,
CD p.. CD
C’,
crCD
C’, 0
C)
CDC
)C’
)CD
00
r1 I-.
CD.
C’,
I.-
.
CD
i1 ‘1 0 CD crQ I—.
p...
C)
0C
D
CD0
C’, C.
0 CD 0.
CD1%
)
0 p.. 0 Q-.
CD C)
0 C’, 0 C)
C)
0
C’) m 0 z
La‘_a.
.Q.<
oI m 0 1
Cl)
..
wa.
o
U)
o ?‘
..
C_.4
•X
cJ
.—
II
LaF
’Q
.“L
a.
0.<
-l ‘.3
)0)
-
Co
Co
—-I
zLa
—•<
U) m z C) m (1) a; -C 0 •T1 m m m ‘1 0 0 z -n -< C)
C Cl)
-I 0 0 z
I 0 CD CD C’,
.-‘
-1.
31)
C.)
C.)
.i
Ui
0U
i0
Ui
0U
i0
(31
0(3
10
-•-I
—-•
-I-—
•-•1
—--
H-—
•±--
-±-—
---.
i--
H
0 a. LaC
’,
II
(‘I
0

Tuesday-Saturday Employees
50
45
40
35
30
25
20
15
10
5
0
ABSENCES BY DAY OF THE WEEK FOR TUESDAY-SATURDAY CUSTODIAN2’S
Tuesday Wednesday Thursday Friday Saturday
BASED ON A SAMPLE OF 185 ABSENCES FROM JAN 1-OCT 26, 1990.
BASED ON A SAMPLE OF 6 TUESDAY-SATURDAY CUSTODIAN ils.
This - data was based on a sample of 185 absences. From the
graph it is evident that Saturday, the end of their shift has the
highest percent of absences with 26%. This agrees with our
hypothesis that the weekend will have the highest number of
absences.
17

Sunday-Thursday Employees
35 —
30 —
25 -
20 -
15-
10-
5
0
ABSENCES BY DAY OF ThE WEEK FOR SUNDAY-ThURSDAY CUSTODIAN 2’S
34
Sunday Monday Tuesday Wednesday ThursdayBASED ON A SAMPLE OF 114 ABSENCES FROM JAN 1- OCT 26, 1990.
BASED ON A SAMPLE OF 8 SUNDAY-THURSDAY CUSTODIAN us.
This data was based on a sample of 114 absences. From the
graph it is observed that 30% of the absences occur on Sunday and
that 24% of the absences occur on Thursday, the end of their shift.
The high percentage of absences on Sunday agrees with our
hypothesis.
23
28
13
16
18

Recommendations
1) Day of the Week
Most of the absences occurred near or during the weekend day
of the shift, for example, a Sunday-Thursday shift had the highest
percentage of absences on Sunday and the Friday-Monday shift had
the highest percentage of absences on Saturday and Sunday.
Therefore, we recommend an incentive plan for working weekend
days; Another possibility is a shift change:
•One Sunday off per month for Sunday-Thursday shift
•One Saturday off per month for Tuesday-Saturday shift
2) Monthly Scheduling Changes
As seen in the Absences by Month Chart and the Excuses
Summary, January and the Summer months of July and August are
the months with the highest occurrences of absence. Knowledge of
this information can allow management to make the proper
adjustments in employee scheduling during these periods.
3) Personal Day Time
As seen in the data/chart in the Excuses Summary, Personal
Day Time has been used (a total of 3 days) within the period of the
first month of the year. An incentive plan may help to alleviate the
excessive use of PDT time in January. An extra bonus PDT day could
be given if the employee saves all three of his PDT time beyond a
certain date (i.e. the 4th quarter of the year).
19
Another possible action would be to allocate one personal day
time every 4 months. This would prevent an excessive number of
PDT absences in the early months of the year.
Action Plan
The next phase will be to meet with Edward Grady and discuss
our recommendations. Next, we would like to meet with Mr. Grady
and the supervisors to discuss any possible changes with scheduling
on a daily and yearly basis.
20

APPENDIX A
Further Analysis: Paid Absenteeism
A sample of 34 housekeeping employees’ records of detailed
summary of excuses for absences was further analyzed for more
specific information on paid absences.
Reasons and days of absences, for the period from November,
1989, to October,1990, were categorized into following areas.
1) Sickness 4) Family Obligation
2) Tardiness 5) Work Related Injury
3) Personal Day Time 6) No Ride! Car Problems
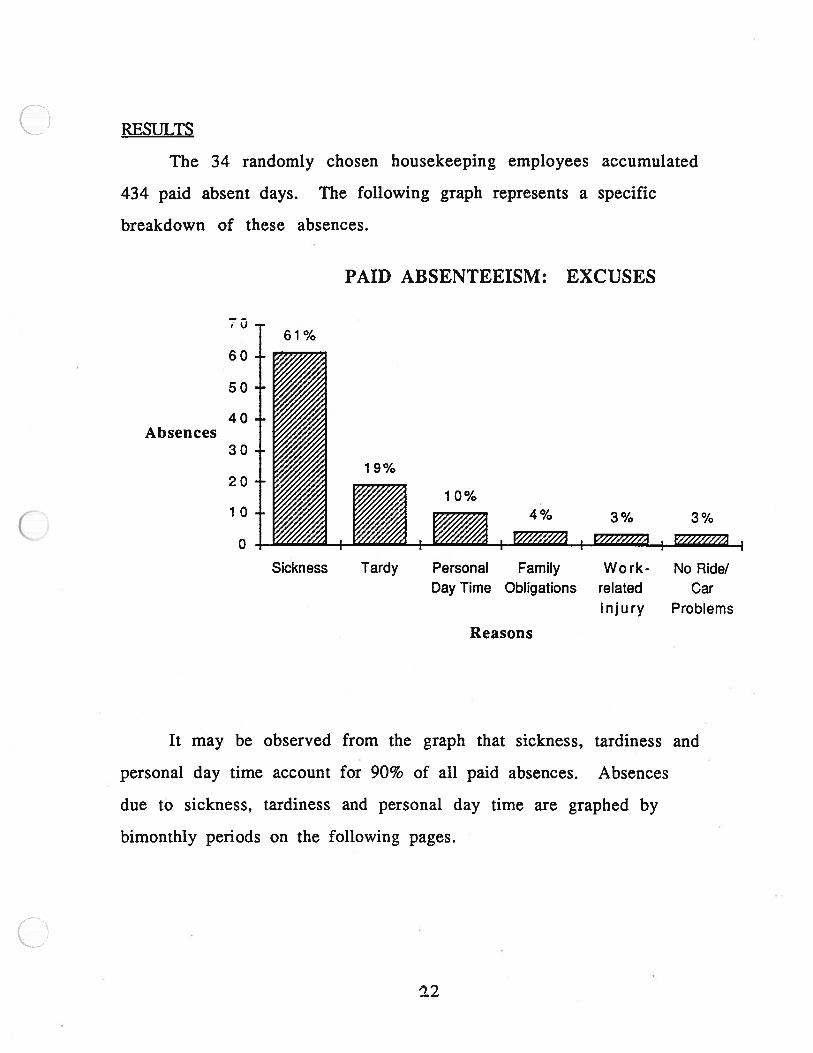
RESULTS
The 34 randomly chosen housekeeping employees accumulated
434 paid absent days. The following graph represents a specific
breakdown of these absences.
I. U
60
50
40
30
20
10
0
PAID ABSENTEEISM: EXCUSES
It may be observed from the graph that sickness, tardiness and
personal day time account for 90% of all paid absences. Absences
due to sickness, tardiness and personal day time are graphed by
bimonthly periods on the following pages.
61%
Absences
1 9%
10%4% 3% 3%
Sickness Tardy Personal FamilyDay Time Obligations
Reasons
Work- No Ride!related CarInjury Problems
‘22

Absences due to sickness seem constant at approximately 12
days for each biweekly period with exceptions of January, first half
of March and last half of August. The last half of January and the
last half of August have 20 or more days of absences. The first half
of March and last half of March have 5 or fewer days of absences
due to sickness.
Tardiness pattern seem to have a relatively constant pattern
where a low level of tardiness is followed by a higher level of
tardiness in proceeding biweekly periods. However, an unusual peak
of. tardiness is observed on the first week of September. In this
period, 12 absences versus an approximate average of 4 absences are
observed.
With the personal day time excuse, it may be observed from
the graph that significant percentages of absences take place at the
beginning of the year. This percentage gradually drops until the
month of March where the level absences remain constant through
the month of April. Following April, number of absences due to
personal day time decreases substantially and this level remains
until the end of the year.
(
13

‘•r
—ij
00
Ifl-
IP
‘7c
—C
)—
C’)
f)
r)C
—
Housekeeping
Em
ployeeA
bsenteeismD
ueto
Personal
Day
Tim
eB
yB
imonthly
Tim
eP
eriods
Em
ployees
864-
2-
0-
Tim
eP
eriod
Based
ona
Sample
of34
Em
ployees

U
I•
I•
I-4
In0
O-
——
.o
z
Housekeeping
Em
ployeeA
bsenteeismI)ue
toS
icknessB
yB
imonthly
Tim
eP
eriod
s
Em
plo
yees
3020100-
1•1
•1
•1•
I_4
If
00
In.4
C-
-4
‘4)-
%O
—
U..
-4U
.
I•I.I•I•I•I.I•I•I•I.I•I•I•
I
10
InIn
CIn
,.-In
.-In
CIn
)C
%C
—-4
—‘0
-
_I0
Z—
DO
U
—
c.—
—
Tim
eP
eriod
I.’
Based
onSaniple
of34
Em
ployeesPaid
Absenteeism
Only
U

B
C
mCl)
C,’ 0 (71
C
C.
Cl)
ClQCM
or
C
Cl)
0
Jan i-13
Jan 16-31 -
Feb l-15
Feb 16-28
Mar l-15
Mar 16-31
Apr l-15
Apr 1-30
t May l-15
May 16-31-
Jun 1-15
Jun 16-30
Jul 1-15-
Jul 16-31
Aug 1-15
Aug 16-31 -
Sep 1-15-
Sep 16-30
Oct 1-15
Oct 16-31 -
Nov 1-15 -
Nov 16-30
Dec 1-15 -
Dec 16-31

APPENDIX B
ANONYMOUS SURVEYS
HYPOTHESIS
Anonymous surveys were distributed to the housekeeping employees
to test following hypotheses.
1) Employees in the wall washer classification would be more satisfied
than employees in custodian II or unit custodian classifications. This was
hypothesized due to the highest pay and least difficulty of work involved in
.the wall washer classification.
2) Employees with 40 hour (full time) schedule would be more
satisfied than those with 32 hour (part time) schedules. This was primarily
based upon greater job stability and better scheduling associated with the 40
hour (full time) employees.
3) Satisfaction ratings of employees would be similar between all
buildings.
4) Employees with Monday through Friday schedules would be more
satisfied than other employees. This is based upon reasoning that it is more
desirable to work on week versus weekend days.
METHODOLOGY
An anonymous survey consisting of information on job classification,
work schedule, building location and satisfaction responses, composed of both
numerical ratings and written comments, was designed to test hypotheses
regarding employee satisfaction. In the satisfaction responses section,
employees were asked to rate their job satisfaction on the scale of I to 7 where
27
I denoted dissatisfaction, 4 denoted neutrality and 7 denoted high degree of
satisfaction. In addition, the employees were asked to identify difficulties and
recommend improvements to their jobs. Appendix C contains a sample
survey.
300 of these surveys were distributed to the supervisors of the
housekeeping department and drop boxes were set up throughout various
locations at the hospital to collect responses.
RESULTS
230 surveys, 76.7% of distributed surveys, were returned and their
responses were analyzed. An extensive analysis was performed using 195 of
these surveys. These 195 surveys consisted of responses from 100 unit
custodians, 84 custodian ITs and 11 wall washers. General results from these
responses are listed in the following.
A) Numerical Ratings
This section consists of numerical results from surveys. For analysis
purposes, all satisfaction ratings were categorized into two categories,
unsatisfied and satisfied.
Ratings: I through 3 (denote) Unsatisfied
4 through 7 (denote) Satisfied

1) The following chart represents overall satisfaction ratings of employees by
job classifications.
OVERALL SATISFACTION RATINGS BYCLASSIFICATION
In numerically rating their job satisfaction, 84% of the unit custodians,
76% of custodian ILs and 64% of wall washers responded that they were
satisfied. These numerical results contradict the hypothesis that employees in
90
70
60
Percentage 5 0
Satisfied 40
30
20
10
0
Classification
Unit Custodians Custodian 2s Wall Washers
Classification
Number of Employee Satisfaction PercentagesEmlovees % Satisfied % Unsatisfied
Unit Custodian 100 84% 16%
Custodian II 84 76% 24%
Wall Washer 11 64% 36%
-‘ci

the wall washer classification would be satisfied than employees in other
classifications.
2) Following charts represent satisfaction ratings of employees by part time
and full time schedules and job classifications.
SATISFACTION PERCENTAGES BYJOB CLASSIFICATIONS
100%
90%
86%
85%—84%
76%
7164%
I • I • I •
Jnit Cuodian Wall 4Custodians 2s Washers
Unit Custodian 21 86% 14%
Custodian II 21 90% 10%
Wall Washer 1 100% 0%
SatisfactionPercentages
110
100•
90
80
70
60
50
—El---— Part Time Employees
‘I Full Time Employees
—w-— Overall
0
60
Classification
a) Part Time Employees
Classification Number of Employee Satisfaction PercentagesEmulovees % Satisfied % Unsatisfied
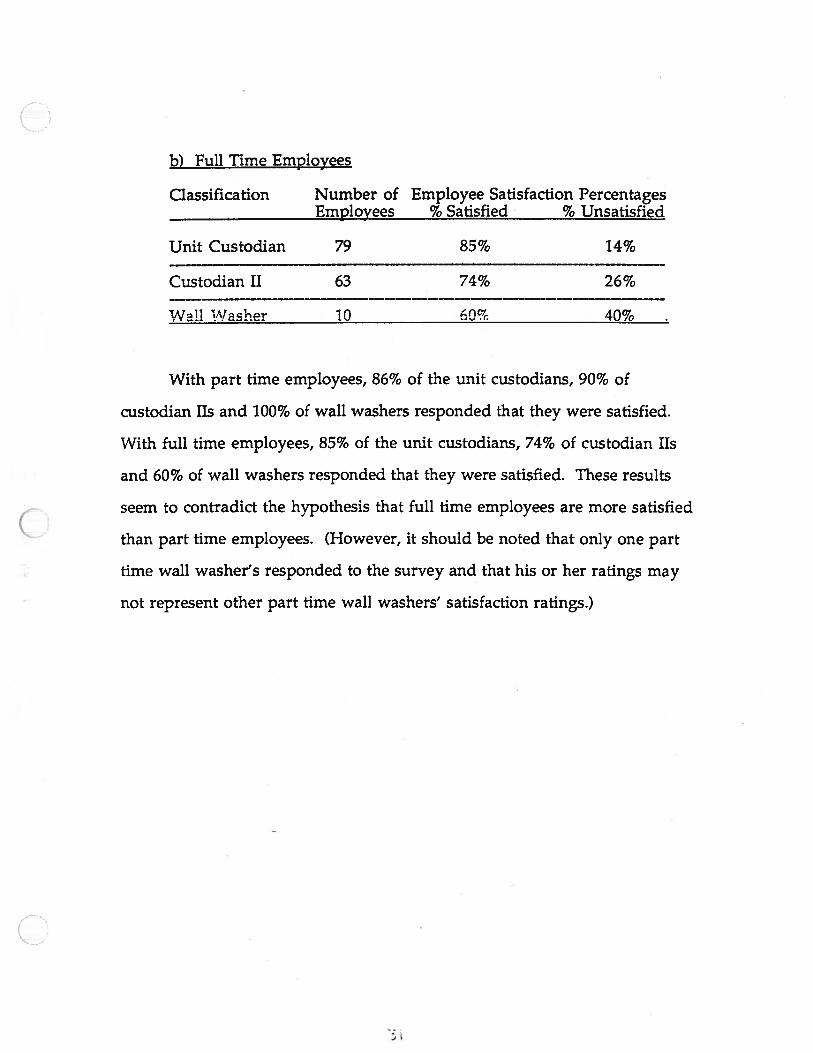
b) Full Time Employees
Classification Number of Employee Satisfaction PercentagesEmployees % Satisfied % Unsatisfied
Unit Custodian 79 85% 14%
Custodian II 63 74% 26%
Wail Washer 10 - 40%
With part time employees, 86% of the unit custodians, 90% of
custodian ils and 100% of wall washers responded that they were satisfied.
With full time employees, 85% of the unit custodians, 74% of custodian us
and 60% of wall washers responded that they were satisfied. These results
seem to contradict the hypothesis that full time employees are more satisfied
than part time employees. (However, it should be noted that only one part
time wall washer’s responded to the survey and that his or her ratings may
not represent other part time wall washers’ satisfaction ratings.)

3) The following chart represents satisfaction ratings of employees by
buildings covered by employees. This chart does not include results of
buildings where less than six employees responded. 187 responses are
represented below.
Buildings
Number of Employee Satisfaction PercentagesEmolovees % % Unsatisfied
SATISFACTION RATINGS BY BUILDING
88% 89%90
80
70
60
Satisfaction 5 0Percentages 4 0
30
20
10
0
Classification
MCI-C MED IN MOIT NIB TAUBMAN UNIV.HOSPITAL
-
—
— . a .. - —
MCHC 17 88% 12%
MED IN 6 83% 17%
MOTT 32 78% 22%
NIB 9 89% 11%
TAUBMAN 19 79% 21%
UNIV. HOSPITAL 94 78% 22%

Responses of employees categorized by buildings indicate percentage of
employees satisfied to be around or above 78%. When viewing responses
from buildings with large number of employees, the percentage of employees
satisfied and otherwise seem consistent. For example, percentages of satisfied
employees from Mott, Taubman and University Hospital are 78%, 79% and
78% respectively. These responses support the hypothesis that employee
satisfaction ratings would be similar between all buildings.
4) The following chart represents satisfaction ratings of University Hospital
housekeeping employees by schedule categories. University Hospital
employee responses were chosen for this analysis due to their representative
nature of all survey responses. Total of 96 responses are represented below.
SatisfactionPercentages
SATISFACTION RATINGS BY SCHEDULE
87%908070605040302010
040 hours 40 hours 32 hours
/Sun-Thur /Tues-Sat /Fri-Mon
Schedules
40 hours/Mon-Fri
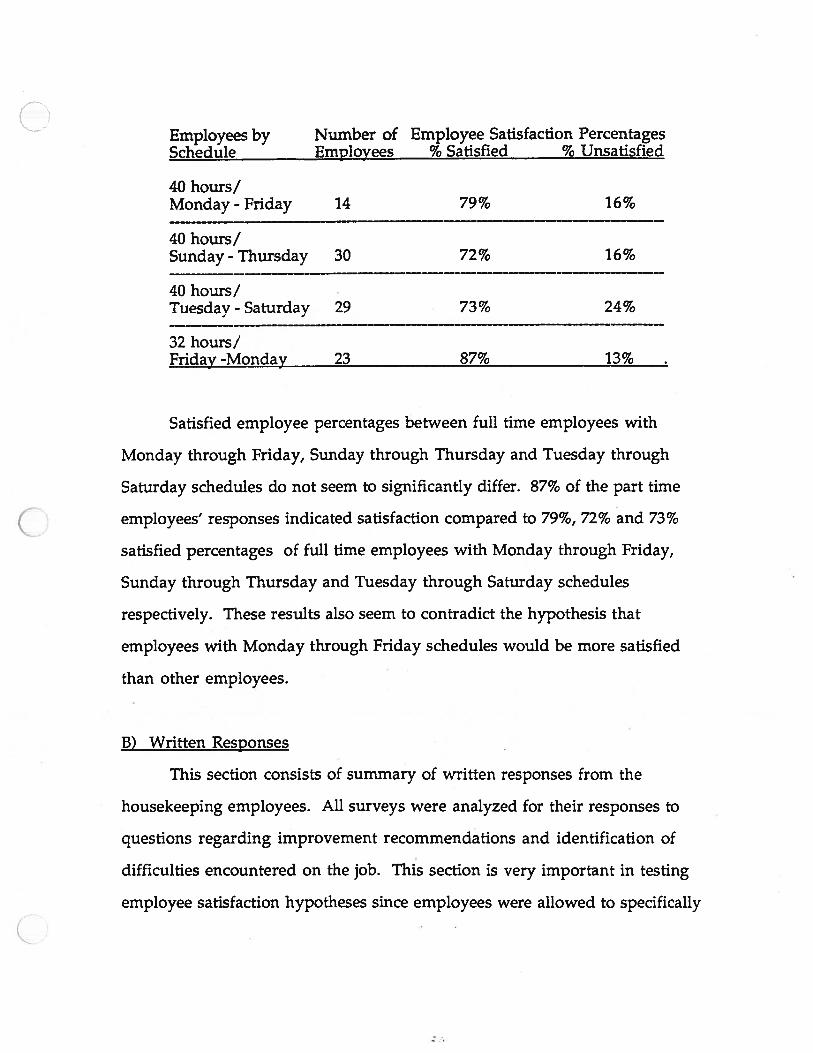
Employees by Number of Employee Satisfaction PercentagesSrhedu1 EmDlovees % ic4R % T Jntføti
40 hours!Monday - Friday 14 79% 16%
40 hours!Sunday-Thursday 30 72% 16%
40 hours!Tuesday - Saturday 29 73% 24%
32 hours/Friday -Monday 23 87% 13%
Satisfied employee percentages between full time employees with
Monday through Friday, Sunday through Thursday and Tuesday through
Saturday schedules do not seem to significantly differ. 87% of the part time
employees’ responses indicated satisfaction compared to 79%, 72% and 73%
satisfied percentages of full time employees with Monday through Friday,
Sunday through Thursday and Tuesday through Saturday schedules
respectively. These results also seem to contradict the hypothesis that
employees with Monday through Friday schedules would be more satisfied
than other employees.
B) Written Responses
This section consists of summary of written responses from the
housekeeping employees. All surveys were analyzed for their responses to
questions regarding improvement recommendations and identification of
difficulties encountered on the job. This section is very important in testing
employee satisfaction hypotheses since employees were allowed to specifically
express their views. In addition, this section introduces potential areas where
changes may be beneficial. See Appendix ID for a list of specific comments.
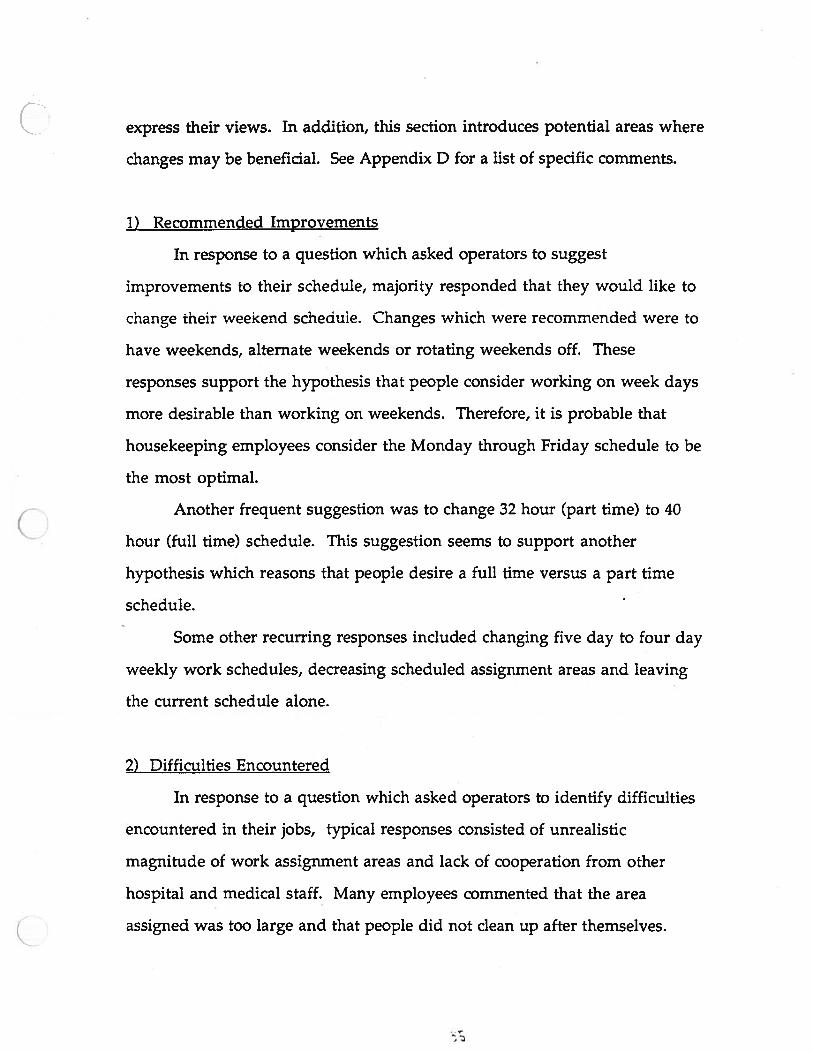
1) Recommended Improvements
In response to a question which asked operators to suggest
improvements to their schedule, majority responded that they would like to
change their weekend schedule. Changes which were recommended were to
have weekends, alternate weekends or rotating weekends off. These
responses support the hypothesis that people consider working on week days
more desirable than working on weekends. Therefore, it is probable that
housekeeping employees consider the Monday through Friday schedule to be
the most optimal.
Another frequent suggestion was to change 32 hour (part time) to 40
hour (full time) schedule. This suggestion seems to support another
hypothesis which reasons that people desire a full time versus a part time
schedule.
Some other recurring responses included changing five day to four day
weekly work schedules, decreasing scheduled assignment areas and leaving
the current schedule alone.
2) Difficulties Encountered
In response to a question which asked operators to identify difficulties
encountered in their jobs, typical responses consisted of unrealistic
magnitude of work assignment areas and lack of cooperation from other
hospital and medical staff. Many employees commented that the area
assigned was too large and that people did not clean up after themselves.

In addition, some employees responded that they encounter difficulties
with lack of cleaning equipment and supplies. They stated that closets were
not always stacked and linen bags and strings were not always available.
Another frequent difficulty stated by some of the surveys was that other shifts
did not fulfill their assignments.
Other problems included harassment from supervisor(s), inability to
finish assignments due to discharges, frequent blood spills and
overwhelming weight of disposals.
CONCLUSIONS
Results from surveys which consisted of numerical ratings and written
comments provided some unexpected and conflicting as well as some
( expected results. In addition, these results introduced potential areas of
improvement.
An unexpected result is from numerical ratings analysis which
represented wall washers being less satisfied than employees in other
classifications. This is contrary to one of the hypothesis which expected wall
washers to be more satisfied than employees in other categories. A possible
explanation may be that satisfaction decreases with passage of time despiteother factors such as pay and difficulty of work assignments Given the
repetitive nature of housekeeping assignments, incentive factors such as pay
may become less prominent with time passage. Since employees in the wall
washer classification holds the greatest seniority, it is possible that they
experience diminishing rate of satisfaction.
Conflicting results involve employee schedules. According to
numerical ratings by employees, full time employees did not seem more
satisfied than part time employees contrary to our hypotheses. In addition,

C
employees with Monday through Friday schedules did not seem more
satisfied than other employees from numerical ratings. However, in written
responses, employees seemed to desire to work on week versus weekend days
and many suggested converting 32 hour (part time) schedule to 40 hour (full
time) schedule. It may perhaps be more accurate to weigh written comments
more than numerical ratings since many employees who rated themselves as
satisfied wrote comments indicating that they prefer weekend days off and
favored full time to part time schedules.
An expected result from the survey is that satisfaction ratings of
employees seem to be similar between all buildings. This supports one of the
hypotheses which predicted a consistent satisfaction level among employees
working in different buildings.
Besides providing information on satisfaction of employees, survey
responses also provided some useful insights. Primary items of interest
consist of issues regarding lack cooperation between shifts, lack of cooperation
from other hospital staff and unavailability of cleaning equipment and
supplies. Improvements of these issues, cooperation and availability, should
provide a healthier and more satisfactory environment for everyone
concerned.
In general, this anonymous survey provided useful information and
insights regarding employee satisfaction in the housekeeping department.
However, due to a number of unexpected and conflicting survey results, no
definite conclusions regarding employee satisfaction may be drawn.
Therefore, results of these survey is used to supplement further analysis.

AP9ENDX C
SCHEDUUNG SURVEY
The Housekeeping Department is interested in its scheduling system and hours worked in each area in thedepartment. Please help us by filling out this short form and returning it to the designated drop box.Please do not include your name. Your responses will not be linked back to you. Thank you for yourcooperation.
1. What is your current employment classification?
___
d) Unit Custodian (UC)
_____
b) Custodian 2 (C2)
____
c) Wall Washer (WW)
2. Your present schedule is:
_____
a) 40 hours/week, Sunday-Thursday
_____
b) 40 hours/week, Tuesday-Saturday
_____
c) 32 hours/week, Friday-Monday
_____
d) Other: hours/week:_____ days:
3. When does your current Work Shift begin and end?
__________
to
__________
4. Where do you work? (Building and Floors):
____________________________________
5. All things considered, how satisfied are you with your current time schedule. Please rate yourself on
this seven point scale with “1” being “very unsatisfied” and “7” being “very satisfied”.
very neither satisfied veryiinsatisfied nor unsatisfied satisfied
1 2 3 4 5 6 7
6. On the average, how many days per month are you unable to work due to illness or other personal
reasons? (Do not include vacation hours).________________________________________________
7. What day of the week are you unable to work most often?______________
8. Would you like a change in your work schedule? If yes, what changes do you recommend?
9. What are some regular problems and difficulties yoti run into with your work schedule?

APPE.NDi)( D
Housekeeping Scheduling Survey: Results of Open Oucstions:
When asked, ‘Would you like a change in your work schedule? If, yes,what changes do you recommend?”, weekends off, or alternate weekendsoff, was the most common response. Respondents also suggestedchanging the part-time 32 hour people to full-time 40 hour workers.
Typical verbatim comments (by categoiy) for question 9 are as follows:
Change in Weekend Hours:
“I’d like alternating weekends off’! “rotating weekends”
‘Weekends off’
Change in Scheduled Work Hours/ Work Days:
“Yes! change 32 hour people to 40 hour”
‘Work Monday-Friday”
‘Work 4 days at 10 hours each”
Additional Comments/Suggestions:
“Please leave our work schedule alone. We have changed enough in thelast two years.- We are puppets.” -
“Going back to twelve rooms only”
5C/

When asked “what are some regular problems and difficulties you run intowith your work scheduleT’, the most common response was that the areawas too large and there was not enough time in the worker’s schedule tofinish the work assigned. Additionally, another common response was acomplaint about the lack of cooperation from other hospital staff? medicalstaff. The housekeeping employees feel that their job should be tomaintain and that other staff members do not help them.
Typical comments are as follows:
Amount of Work:
“Area is too large/ too much to do and not enough time/shortage ofemployees”
Cooperation from rest of hospital staff:
“The most common problem is the persons whom I clean after; they are - -
not helping; I was under the impression that the sanity of the building was :.
a joint effort and the housekeepers were here to maintain...I feel as if I amgetting nowhere.”
Doo/nursing:.stafr(rudeness/
no cooperation, prenting work, notcleaning up after themselves)
“Sometimes grossly overworked due to kitchen staff help being turnedover every 89 days (in NIB).”
Supply Problems:
“linen bags, strings, and equipment missing? closet not always stocked”
Problems with other shifts:
“Getting calls to do what the night shift was supposed to do”
“1 feel like I need more cooperation from the evening shifts in keeping theunit up to U of M standards’s
Additional Problems:
“being singled out and harassed constantly”
“not finishing my schedule because of discharges”
“heavy trash”
maiv.i hlncid riiIl”

“no overtime”
“parking; $225 too much for 5.50/hour and 4.50 hour workers”
Additional Comments
More team work: two people to work on each floor, one on each side ofthe haiiway to get better quality work
bonus for perfect attendance
(

UC
-MT
OF
DA
YS:
Ave
rage
Day
sA
bsen
tpe
rP
erso
n
2.50
2.00
1.50
1.00
0.50
0.00
UN
ITC
UST
OD
IAN
S(M
ON
DA
Y-F
RID
AY
):A
VE
RA
GE
DA
YS
AB
SEN
T(B
ased
on5
Em
ploy
ees)
MO
ND
AY
2.40
1.60
1.4
0
1.20
1.4
0
TU
ESD
AY
WE
DN
ESD
AY
TH
UR
SD
AY
FRID
AY
DA
YO
FT
HE
WE
EK
Pag
e1
UC-TTO S
3.50
3.00
2.50
DAYS: Average 2.00Days Absent per
Person 1.50
1.00
0.50
0.00
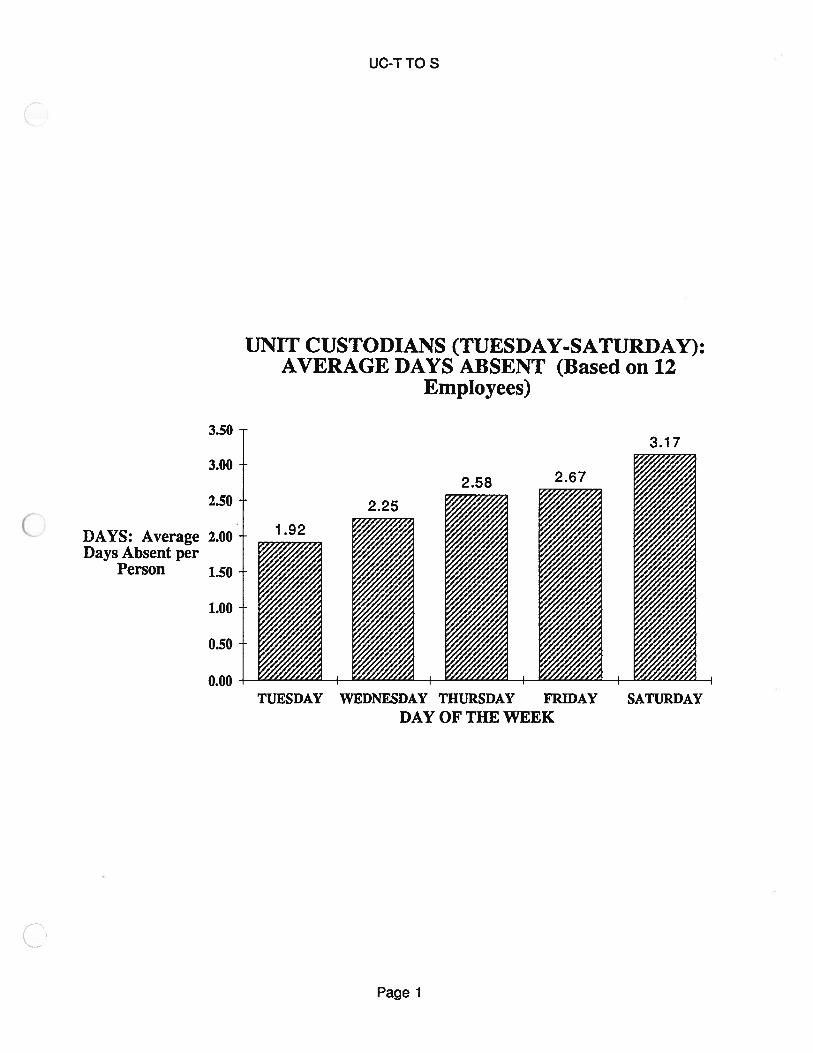
UNIT CUSTODIANS (TUESDAY-SATURDAY):AVERAGE DAYS ABSENT (Based on 12
Employees)
TUESDAY WEDNESDAY THURSDAY FRIDAY SATURDAYDAY OF THE WEEK
Page 1
UC-STOT
UNIT CUSTODIANS (SUNDAY-THURSDAY):AVERAGE DAYS ABSENT (Based on 12
Employees)
DAYS: AverageDays Absent per
Person
3.50
3.00
2.50
2.00
1.50
1.00
0.50
0.00SUNDAY MONDAY TUESDAY WEDNESDAY THURSDAY
DAY OF THE WEEK
Page 1

UC
-FT
OM
6.00
5.00
4.00
DA
YS:
Ave
rage
Day
s3.
00A
bsen
tpe
rP
erso
n
2.00
1.00
0.00
UN
ITC
US
TO
DIA
NS
(FR
IDA
Y-M
ON
DA
Y):
AV
ER
AG
ED
AY
SA
BS
EN
T(B
ased
on4
Em
ploy
ees)
FRID
AY
SATU
RD
AY
SUN
DA
YM
ON
DA
YD
AY
OF
TH
EW
EE
K
Pag
e1

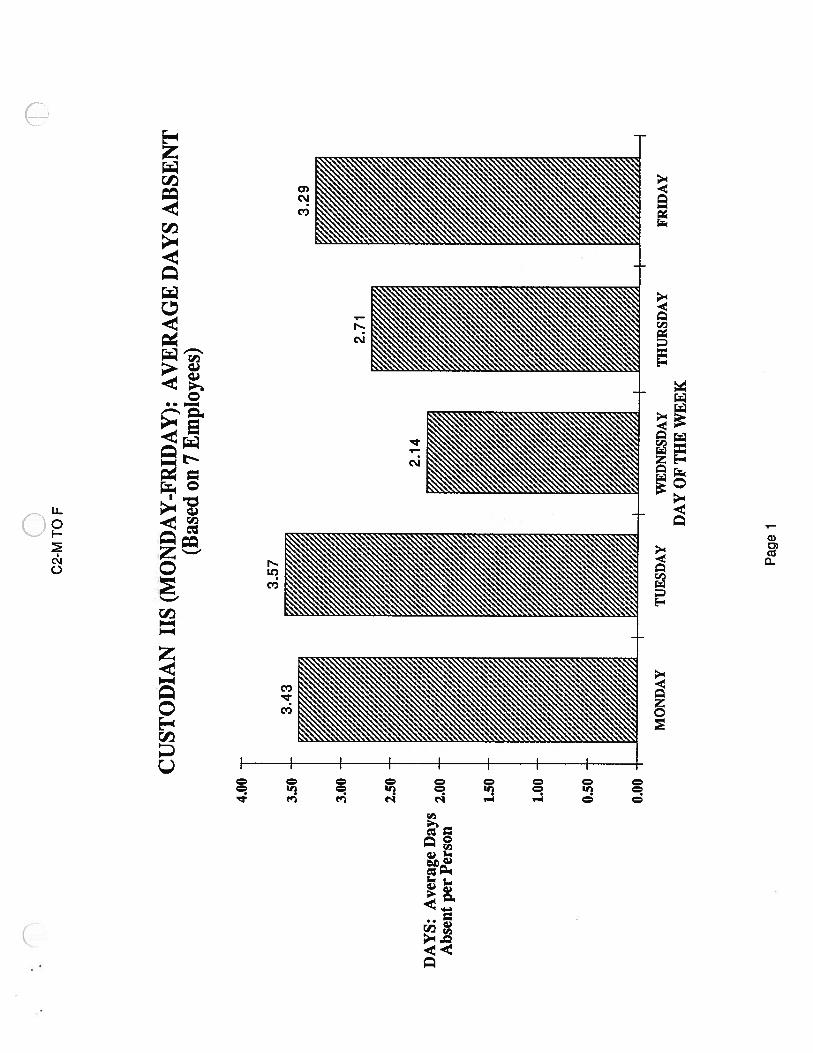
C2-
MT
OF
4.00
3.50
3.00
2.50
DA
YS
:A
vera
geD
ays
2.00
Abs
ent
per
Per
son
1.50
1.00
0.50
0.00
CU
ST
OD
IAN
uS
(MO
ND
AY
-FR
IDA
Y):
AV
ER
AG
ED
AY
SA
BS
EN
T(B
ased
on7
Em
ploy
ees)
3.43
3.5
7
3.2
9
2.71
2.1
4
MO
ND
AY
TU
ESD
AY
WE
DN
ESD
AY
TH
UR
SDA
YF
RID
AY
DA
YO
FT
HE
WE
EK
Pag
e1

C2-
TT
OS
5.00
4.50
4.00
3.50
3.00
DA
YS
:A
vera
geD
ays
2.50
Abs
ent
per
Per
son
2.00
1.50
1.00
0.50
0.00
CU
STO
DIA
N11
5(T
UE
SDA
Y-S
AT
UR
DA
Y):
AV
ER
AG
ED
AY
SA
BSE
NT
(Bas
edon
6E
mpl
oyee
s)
5.0
0
TU
ESD
AY
WE
DN
ESD
AY
TH
UR
SDA
YFR
IDA
YSA
TUR
DA
YD
AY
OF
TH
EW
EE
K
Pag
e1
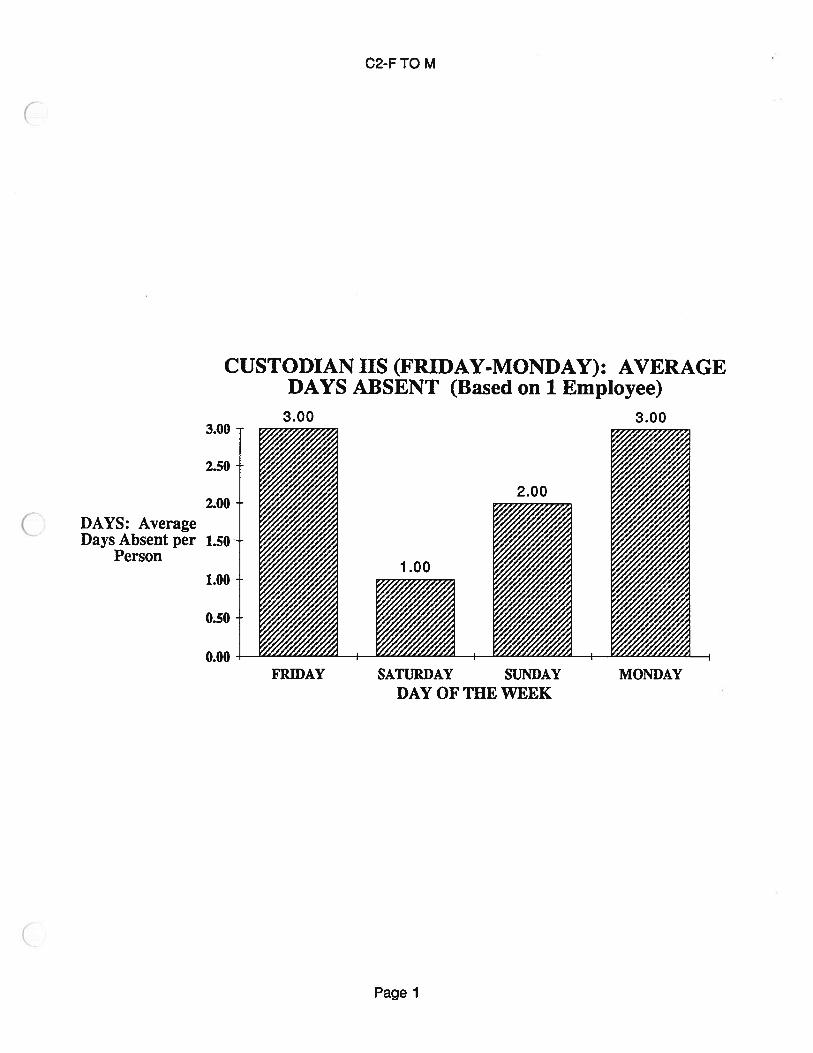
C2-FTO M
DAYS: AverageDays Absent per
Person
CUSTODIAN uS (FRIDAY-MONDAY): AVERAGEDAYS ABSENT (Based on 1 Employee)
3.00
2.50
2.00
1.50
1.00
0.50
0.00
3.00 3.00
FRIDAY SATURDAY SUNDAY MONDAYDAY OF THE WEEK
Page 1

6.00
5.00
4.00
DA
YS
:A
vera
geD
ays
3.00
Abs
ent
perP
erso
n
2.00
1.00
0.00
WA
LL
WA
SH
ER
S(M
ON
DA
Y-F
RID
AY
):A
VE
RA
GE
DA
YS
AB
SE
NT
(Bas
edon
3E
mpl
oyee
s)
MO
ND
AY
5.0
0
5.33
3.6
7
4.6
7
3.6
7
TU
ESD
AY
WE
DN
ESD
AY
THU
RSD
AY
FRID
AY
DA
YO
FT
HE
WE
EK

DA
YS
:A
vera
geD
ays
Abs
ent
per
Per
son
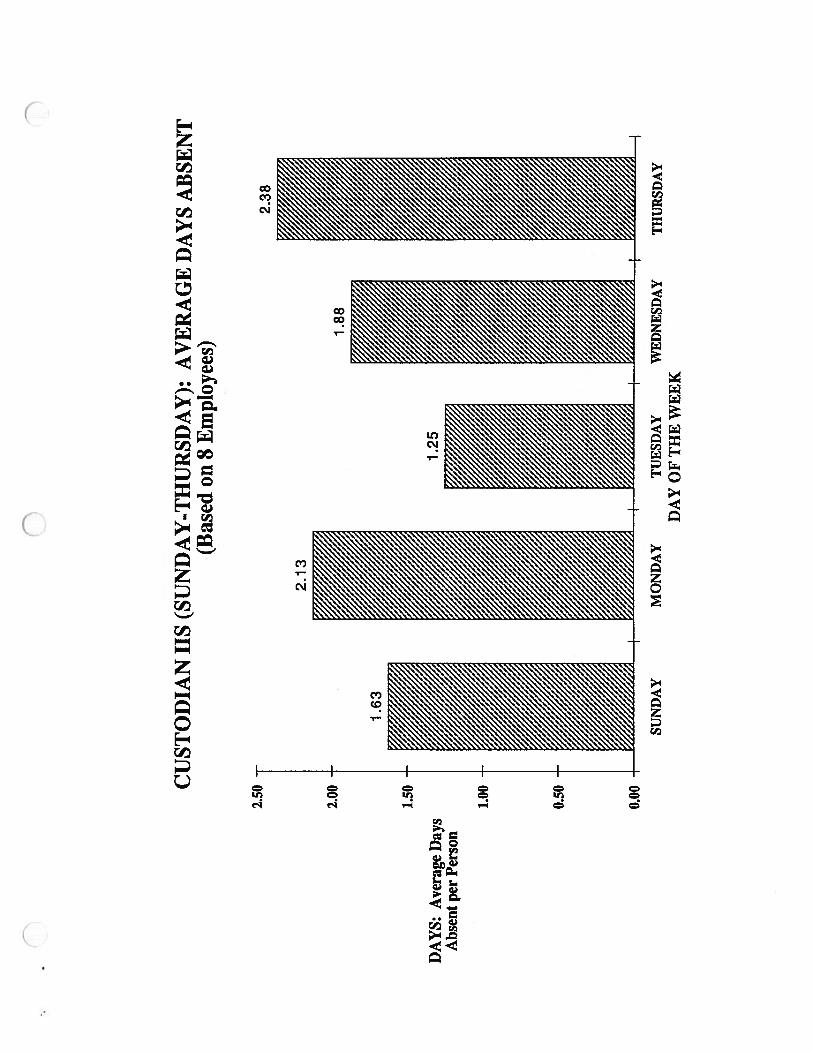
CU
ST
OD
IAN
uS
(SU
ND
AY
-TH
UR
SD
AY
):A
VE
RA
GE
DA
YS
AB
SEN
T(B
ased
on8
Em
ploy
ees)
2.50
2.00
1.50
1.00
0.50
0.00
2.1
3
1.6
3
2.38
1.88
1.25
SUN
DA
YM
ON
DA
YTU
ESD
AY
WED
NES
DA
YTH
UR
SDA
YD
AY
OF
TH
EW
EE
K

UC
-MT
OF
UN
ITC
UST
OD
IAN
S(M
ON
DA
Y-F
RID
AY
):A
VE
RA
GE
DA
YS
AB
SEN
T(B
ased
on5
Em
ploy
ees)
2.4
0
1.60
DA
YS:
Ave
rage
Day
sA
bsen
tpe
rP
erso
n
2.50
2.00
1.50
1.00
0.50
0.00
1.4
0
1.20
1.4
0
MO
ND
AY
TU
ESD
AY
WE
DN
ES
DA
YT
HU
RS
DA
Y
DA
YO
FT
HE
WE
EK
FRID
AY
Pag
e1

UC-TTO S
3.50
3.00
2.50
DAYS: Average 2.00Days Absent per
Person 1.50
1.00
0.50
0.00
UNIT CUSTODIANS (TUESDAY-SATURDAY):AVERAGE DAYS ABSENT (Based on 12
Employees)
TUESDAY WEDNESDAY THURSDAY FRIDAY SATURDAYDAY OF THE WEEK
Page 1
UC-S TOT
UNIT CUSTODIANS (SUNDAY-THURSDAY):AVERAGE DAYS ABSENT (Based on 12
Employees)
DAYS: AverageDays Absent per
Person
3.50
3.00
2.50
2.00
1.50
1.00
0.50
0.00SUNDAY MONDAY TUESDAY WEDNESDAY THURSDAY
DAY OF THE WEEK
Page 1
UC
-FT
OM
6.00
5.00
4.00
DA
YS
:A
vera
geD
ays
3.00
Abs
ent
per
Per
son
2.00
1.00
0.00
UN
ITC
US
TO
DIA
NS
(FR
IDA
Y-M
ON
DA
Y):
AV
ER
AG
ED
AY
SA
BS
EN
T(B
ased
on4
Em
ploy
ees)
FRID
AY
SAT
UR
DA
YSU
ND
AY
MO
ND
AY
DA
YO
FT
HE
WE
EK
Pag
e1
C2-
MT
OF
4.00
3.50
3.00
2.50
DA
YS
:A
ver
age
Day
s2.
00A
bse
nt
per
Per
son
1.50
1.00
0.50
0.00
CU
ST
OD
IAN
uS
(MO
ND
AY
-FR
IDA
Y):
AV
ER
AG
ED
AY
SA
BS
EN
T(B
ased
on7
Em
ploy
ees)
3.4
33.5
7
3.2
9
2.71
2.14
MO
ND
AY
TUES
DA
YW
EDN
ESD
AY
TH
UR
SDA
YFR
IDA
YD
AY
OF
TH
EW
EE
K
Pag
e1

C2-
TT
OS
5.00
4.50
4.00
3.50
3.00
CU
ST
OD
IAN
uS
(TU
ESD
AY
-SA
TU
RD
AY
):A
VE
RA
GE
DA
YS
AB
SEN
T(B
ased
on6
Em
ploy
ees)
5.0
0
DA
YS:
Ave
rage
Day
s2.
50A
bsen
tpe
rP
erso
n
2.00
1.50
1.00
0.50
0.00
TU
ESD
AY
WED
NES
DA
YTH
UR
SDA
YFR
IDA
YSA
TU
RD
AY
DA
YO
FT
HE
WE
EK
Pag
e1
C2-FTO M
3.00
2.50
2.00
DAYS: AverageDays Absent per 1.50
Person
1.00
0.50
0.00
CUSTODIAN IIS (FRIDAY-MONDAY): AVERAGEDAYS ABSENT (Based on 1 Employee)
3.00 3.00
FRIDAY SATURDAY SUNDAY MONDAYDAY OF THE WEEK
Page 1

6.00
5.00
4.00
DA
YS
:A
vera
geD
ays
3.00
Abs
ent
per
Per
son
2.00
1.00
0.00
WA
LL
WA
SH
ER
S(M
ON
DA
Y-F
RID
AY
):A
VE
RA
GE
DA
YS
AB
SE
NT
(Bas
edon
3E
mpl
oyee
s)
5.0
0
5.33
3.6
7
4.67
3.6
7
MO
ND
AY
TU
ESD
AY
WE
DN
ESD
AY
THU
RSD
AY
FRID
AY
DA
YO
FT
HE
WE
EK
DA
YS
:A
vera
geD
ays
Abs
ent
per
Per
son
CU
ST
OD
IAN
uS
(SU
ND
AY
-TH
UR
SD
AY
):A
VE
RA
GE
DA
YS
AB
SEN
T(B
ased
on8
Em
ploy
ees)
2.50
2.00
1.50
1.00
0.50
0.00
2.1
3
1.6
3
2.38
1.88
1.25
SUN
DA
YM
ON
DA
YT
UE
SDA
YW
EDN
ESD
AY
THU
RSD
AY
DA
YO
FT
HE
WE
EK


