MARKET SUMMARY HOUSTON, TX METRO AREA Cresa Houston 5599 San Felipe, Suite 500 Houston, Texas 77056 713.402.5800 cresa.com/houston Connect with us and get up-to-date information: Cresa : The Tenant’s Advantage Facebook.com/ cresa Follow us! @cresahouston Photo Credit: Stocksy.com
Transcript
MARKET SUMMARYHOUSTON, TX METRO AREA
Cresa Houston
5599 San Felipe, Suite 500
Houston, Texas 77056
713.402.5800
cresa.com/houston
Connect with us and
get up-to-date information:
Cresa : The Tenant’s Advantage
Facebook.com/cresa
Follow us!@cresahouston
Photo Credit: Stocksy.com
TABLE OF CONTENTS 01
02
03
04
05
MARKET AT-A-GLANCE
RENTAL RATES & VACANCY
LEASING ACTIVITY
CONSTRUCTION & DELIVERIES
NET ABSORPTION
Information contained herein is provided, in part, from third party sources including: CoStar
Group, Greater Houston Partnership, Bureau of Economic Analysis, Bauer College of
Business, University of Houston - Institute for Regional Forecasting, U.S. Census Bureau,
Perryman Group, Institute for Supply Management – Houston, Houston Association of
Realtors, National Association of Realtors, C2ER Cost of Living Index 1Q’2014, Baker
Hughes U.S. Rig Count Reports.
Even though obtained from sources deemed reliable, no warranty or representation,
expressed or implied, is made as to the accuracy of the information herein. 08
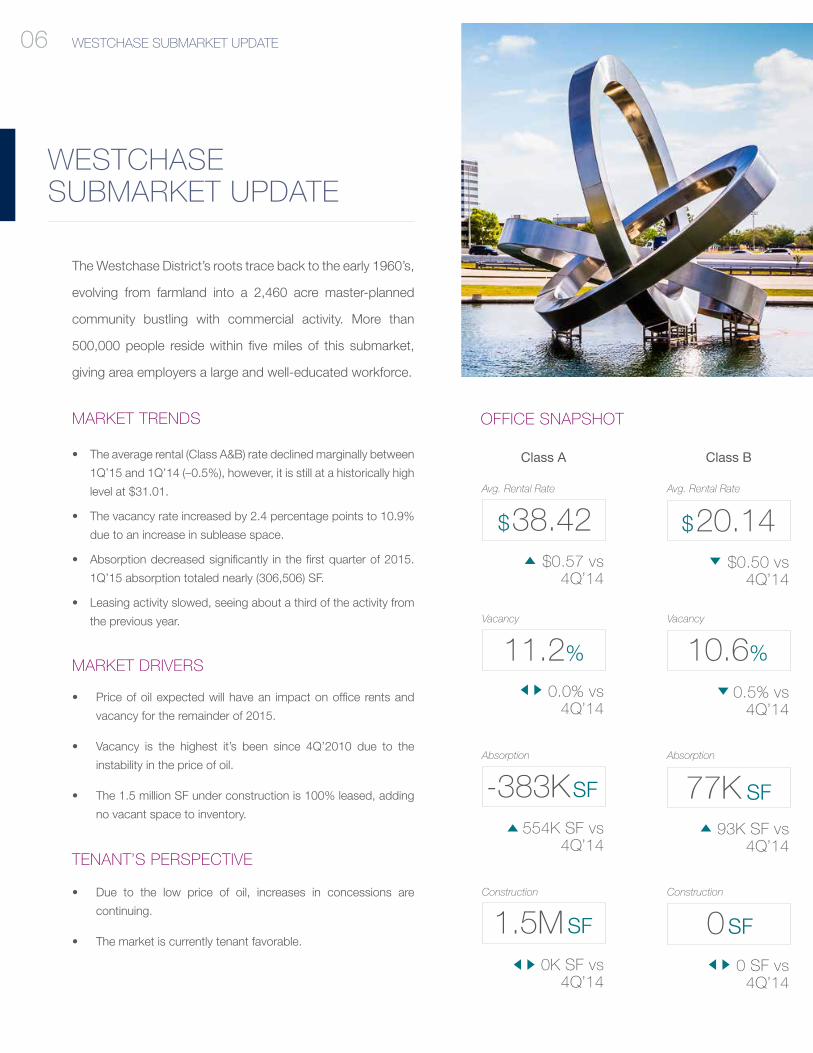
06
07
MARKET OUTLOOK
SUBMARKET SNAPSHOTS
HOUSTON ECONOMY
1.9%
0.1%
0.9%
$6.23 net Industrial 4.1%
$9.38 net Flex 6.7%
$6.59 net Industrial + Flex 4.3%
0.1%
0.2%
0.0%
$32.93 Suburban: Class A 10.5%
$21.04 Suburban: Class B 12.8%
$26.64 Suburban: Class A + B 11.8%
$42.31 CBD: Class A 9.2%
$28.23 CBD: Class B 7.6%
$39.21 CBD: Class A + B 8.7%
1.2%
0.2%
0.9%
1000 Main 837,000 SF CBD Sale Office
1301 Fannin 784,000 SF CBD Sale Office
Westgate II & III 411,000 SF Katy Fwy. West Sale Office
Niagara Bottling 207,000 SF Southwest Lease Ind.
Direct Energy 192,000 SF Greenway Plaza Extension Office
Dunavant 186,000 SF Southeast Expansion Ind.
Professional Packaging 172,000 SF Southwest Lease Ind.
Swift Energy 120,000 SF Greenspoint Relocation Office
Bristow Group 115,000 SF Westchase Lease Office
Nabors Industries 98,000 SF North Belt Expansion Office
Gardere 75,000 SF CBD Renewal Office
HOUSTON MARKETAT-A-GLANCE
The answer to the question of what will happen in the
Oil & Gas industry and how it will affect Houston remains
unanswered as worldwide job cuts and reduced capital
budgets continue, and M&A activity begins to take place.
Most experts agree that Houston will not experience a
major downturn, as the city has benefited from significant
economic growth in the recent past and economic
indicators continue to see positive numbers. However,
even though absorption remained strong in 1Q’15 due to
move-ins from leases executed at the top of the market in
2014, expect the numbers to turn in the second quarter.
The office and, to a lesser degree, industrial markets, will
see fundamentals decline in the months to follow and into
2016, with the market transitioning favorably for tenants.
TENANT’S PERSPECTIVE
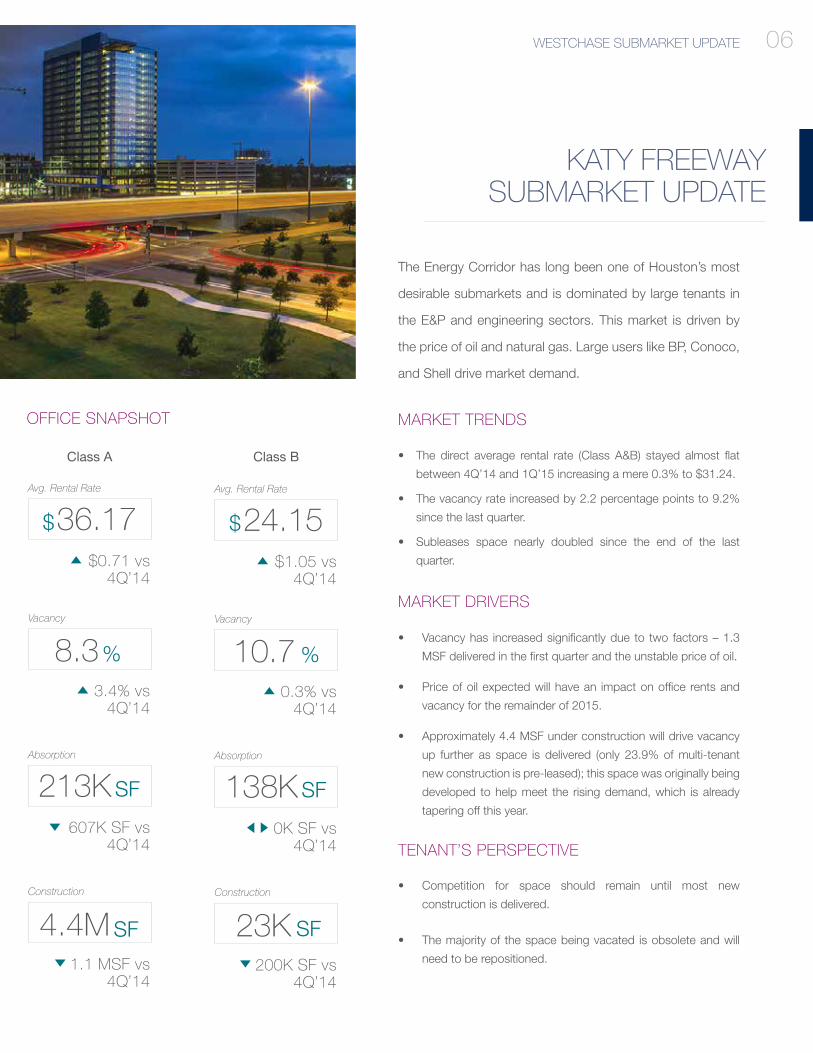
MARKET TRENDS
Increases in both vacancy and space available for sublease are expected to continue, while rates hold or experience small declines.
Tenants are holding off on large commitments on space or signing shorter-term leases in anticipa-tion of declining rental rates.
Landlord concessions continue to increase in order to remain competitive and retain tenants, especially in the west Houston submarkets.
Stricter construction financing, high labor costs, and a slowing energy economy have put a pause on proposed construction; however, Houston still leads the nation in development activity.
Half of the 15.2 MSF under construction is multi-tenant space, 23.5% of which is pre-leased at an average weighted gross asking rental rate of $42.50.
Large blocks of direct and sublease space are coming on the market daily due to M&A activity in Exploration & Production and the Oil & Gas Service sectors.
RECENT TRANSACTIONS RENTAL & VACANCY RATES
Tenant Size Submarket Type Sector Avg. Rate Vacancy Rate Margin from Q4
Superior Energy Services 64,000 FM 1960/Hwy 249 Lease
Regions Bank 62,000 Greenway Plaza Lease
LTD Financial Services 62,000 Southwest Renewal
Direct Energy 192,000 Greenway Plaza Extension
Swift Energy 120,000 Greenspoint Relocation
Bristow Group 115,000 Westchase Lease
Tenant SF Building Submarket
Millions
1 2 30
North Belt
The Woodlands
Westchase
Katy Freeway
Galleria
CBD
Greenway Plaza
Northwest
FM 1960
Sugar Land
Midtown
Medical Center
2014 Leasing Q1’15 Leasing
SUBMARKET COMPARISON
Leasing activity dwindled starting in 4Q’15. The Galleria. Greenway Plaza, Katy Freeway, and Westchase saw the most activity during the first quarter of 2015.
‘15
04
CONSTRUCTION &DELIVERIES
Nearly eight MSF was delivered across Houston during 2014
(buildings over 75,000 SF), and the momentum was even
stronger in 1Q’15 with more than 4.9 MSF – the highest
quarterly delivery rate in the past 15 years. Despite a huge
run up in construction costs, there is another 18.7 MSF un-
der construction across the Houston area.
DELIVERIES (BLDGS. OVER 100.000 SF)
• Nearly 3.8 MSF can be attributed to 9 buildings with more than
100,000 SF
• Of the 4.9 million SF delivered in 1Q’15, roughly 72.0% was
leased at the time of completion.
• The tenancy profile of approximately one third of the buildings
(3) delivered in 1Q’15 was single tenant, corporate users, taking
62.2% of the space delivered and equating to 2.3 MSF.
• 1Q’15 saw the most SF delivered over the past 15 years.
• The areas to the north and west saw the most building
completions, including Katy Freeway, Northwest Far, and The
Woodlands.
PROPOSED DEVELOPMENT
• There is an additional 23.7 MSF proposed, most of
which, given current economic conditions, will not come
out of the ground this year, particularly through at least
the next two quarters.
• The submarkets that have the most proposed
development include: Katy Freeway (5.1 MSF), the CBD
(5.1 MSF), and The Woodlands (4.2 MSF).
04CONSTRUCTION & DELIVERIES1Q’15 MAJOR DELIVERIES
11750 Katy Fwy
Katy Fwy429,157 SF
39.4% LeasedMulti-Tenant
5150 Westway Park Blvd
Northwest Far640,000 SF
100% LeasedCyrus One
15375 Memorial Dr
Katy Fwy429,157 SF
39.4% LeasedMulti-Tenant
1540 N Mason Rd
Katy Fwy200,000 SF
100% LeasedAcademy Sports
5060 Westway Park Blvd
Northwest Far131,960 SF
8.9% LeasedMulti-Tenant
23125 Interstate 45 N
The Woodlands1,500,000 SF100% LeasedExxonMobil
5775 N Sam Houston Pky
Northwest Far271,384 SF
0.0% LeasedMulti-Tenant
755 Town & Country Blvd
Katy Fwy254,489 SF
43.4% LeasedMulti-Tenant
DELIVERIES BY SUBMARKET 2014
Galleria/Uptown 0 0 0.0%
Katy Freeway 4 1,217,793 45.5%
Westchase 0 0 0.0%
Woodlands 1 1,500,000 100.0%
Northwest 3 1,043,344 62.5%
Other 0 0 0.0%
Total 8 3,761,137 71.9%
Submarket Bldgs SF % Leased
DELIVERIES BY SUBMARKET 1Q’15
Galleria/Uptown 2 50,000 0.0%
Katy Freeway 11 2,368,280 132.1%
Westchase 5 938,948 41.8%
Woodlands 15 3,799,956 102.1%
Northwest 1 127,794 61.1%
Other 4 631,384 41.9%
Total 38 7,916,362 1.0%
Submarket Bldgs SF % Leased
04
14.5 MSF
2Q’15 2017
CONSTRUCTION AT-A-GLANCE
SLATED OFFICE DELIVERY
PRE-LEASEDPERCENTAGE
Combined both multi-tenant and single tenant (for just multi-tenant projects, the pre-leased percent-age is 25%)
64%
SINGLE TENANTCONSTRUCTION
There is 7.6 MSF of single-tenant space under construction compared to 6.9 MSF of multi-tenant space
53%
• At the end of the 1Q’15, Houston had more than 15.4 MSF
of office space under construction in 84 buildings. Of these
buildings, 39 are 100,000 SF or greater and encompass over
14.5 MSF.
• The tenancy profile of 52.7% of the buildings currently
under construction is single tenant, corporate users totaling
approximately 7.6 MSFin 36 buildings.
• Multi-tenant buildings over 100,000 SF, which account for
47.3% of inventory under construction, are 24.6% pre-leased
with a weighted average rent of 41.75% gross PSF with
515,000 SF 500,000 SF 95,000 SF 40,000 SF 25,576 SF
TOP 5 SUBLEASE SPACES
Technology Forest Blvd. 4
10101 Woodloch Forest
Two Hughes Landing Town Center I 4055 Technology Forest Blvd.
50,580 SF 25,879 SF 25,576 SF 24,331 SF 23,894 SF
TOP 5 LARGEST BLOCKS OF SPACE
Sierra Pines II 2455 Tech. Forest 2001 Timberloch 128 Vision Park Blvd. 2700 Research Forest
93,557 SF 87,855 SF 50,000 SF 46,310 SF153,810 SF
THE WOODLANDS SUBMARKET UPDATE06
HOUSTON ECONOMYFACTS & FIGURES
In 2014, Houston’s economy was booming, translating to
the highest level of construction the area had seen since the
boom of the 1980s and the highest total on record for build-
ing permits. During this time, leasing activity was also robust
across all commercial real estate sectors.
Employment growth in the energy and education sectors
drove the demand for office space, but declining oil prices
have now caused a pause in the market. Regardless of the
slow-down, the market remains at historical healthy levels
and local economists believe Houston real estate will largely
be unscathed.
The following pages detail the state of the Houston economy
at the end of the first quarter of 2015.
07FORTUNE 500 COMPANIES
Houston ranks third among US metropolitanareas in Fortune 500 headquarters, with 26 companies based in the Houston MSA. More than 88% of these companies are in some way related to the energy industry.
Below is a list of all Fortune 500 companies headquartered in the Houston MSA as of the end of 2014:
Phillips 66#6
ConocoPhillips #47
Enterprise Products #56
Sysco#63
Plains GP Holdings #70
Halliburton #103
NOV#131
Baker Hughes #132
Apache #179
Marathon Petroleum #188
Anadarko #202
EOG Resources #203
Kinder Morgan #206
Waste Management#207
Cameron #286
Group 1 Automotive #307
CenterPoint Energy#333
KBR #360
FMC Technologies #368
Targa Resources#395
Quanta Services #396
Calpine #414
Spectra Energy#461
MRC #478
Buckeye Partners #485
Noble Energy #491
Job growth in the Washington MSA has been
challenged by the contraction of the federal government.
Any improvement in the job growth rate will have to be
fueled by the private sector.
Job growth in the Washington MSA has been
challenged by the contraction of the federal government.
Any improvement in the job growth rate will have to be
fueled by the private sector.
Houston has benefitted from four years of exceptional
growth. Due to this rapid economic expansion, the city
now ranks fourth in the nation in GDP producing more
than $533 billion annually.
If Houston were a country, its economy would be larger
than those of Argentina and Norway, according to the
World Bank, and would rank as the world’s 25th largest
economy. The city of Houston also has a GDP greater
than 42 states.
07 HOUSTON ECONOMY FACTS & FIGURES
New York CIty$1.4 Trillion
Los Angeles$792 Billion
Chicago$586 Billion
Houston$533 Billion
Venezuela$438 Billion
Norway$512 Billion
US GDP RANKING
WORLD GDP RANKING
Job growth in the Washington MSA has been
challenged by the contraction of the federal government.
Any improvement in the job growth rate will have to be
fueled by the private sector.
Houston’s economic growth is expected to increase in
2015, albeit at a much slower pace; and is projected to
double between 2015 and 2040. Houston’s GDP also
is projected to top $1.1 trillion by the end of 2027. The
adjacent graph shows the city’s economic makeup.
ECONOMIC GROWTH
Mining
Construction
Manufacturing
Trade
Transportation, Utilities, Warehousing
Information
Finance, Insurance, Real Estate
Services
Government
Agriculture
20.9%
19.3%
18.3%
4.6%
10.5%
1.5%
0.1%
11.9%
5.7%7.2%
Houston’s economy contracted for
the second consecutive month in
February, registering 49.3 at the end
of the month. The decline in PMI was
expected given the continued decline
in oil prices.
Any reading below 50 signifies an
overall contraction in production.
Houston’s PMI had held at or above
the 50 point mark for 64 consecutive
months.
PMI RATING
Houston ranks third in lowest overall
cost of living among the nation’s 20
most populous metropolitan areas,
with costs 17.4% below the average
for this group. Houston’s housing
costs are 32.9% below this group’s
average.
Houston’s overall after-taxes living
costs are 5.2% lower than the US
average, largely due to affordable
housing prices that are 6.0% below
the national average.
COST OF LIVING
07HOUSTON ECONOMY FACTS & FIGURES
2005 2007 2008 2009 2010 2011 2012 2013
30
40
50
60
70
2014 20152006
50-Point Baseline PMI Reading
PMI Reading
Mining
Construction
Manufacturing
Trade
Transportation, Utilities, Warehousing
Information
Finance, Insurance, Real Estate
Services
Government
Agriculture
07 HOUSTON ECONOMY FACTS & FIGURES
Houston is the “Energy Capital of the World” with almost half
of its economic activity driven by the energy industry. The
city is home to the largest concentration of human capital
and infrastructure for energy research, development, and
production in the nation.
Forty of the 145 publicly traded oil and gas exploration and
production firms based in the US are located in Houston.
In December 2014, the city held 31.7% of the nation’s
202,000 jobs in oil and gas extraction and 11.6% of the
453,400 total jobs in support activities for mining.
In 2015, The Greater Houston Partnership estimates that
9,300 jobs could be cut, but may increase more as layoffs
and budget cuts are announced.
WHAT EXACTLY CAUSED THE DROP IN OIL PRICES?
The drop in oil prices is due to many factors but generally because supply is much higher than demand.
Since 2010, prices hovered in the $100 per barrel range – because of increasing oil consumption in countries like China, and because of conflicts in key oil nations like Iraq – with production not being able to keep up with the increased demand.
These high oil prices led to an increase in drilling, but then demand began to taper off across Europe, Asia, and the U.S. Unused oil was just being stockpiled away, causing the dramatic decrease in prices, and with OPEC states not agreeing to cut production, the price of oil continues to fall.
There could also soon be a storage problem, and other countries could be releasing more supply into the market, potentially driving prices down further.
WTI reached a high of $108 in June 2014 before falling
30.6% to $75 in November 2014 (prices began falling in
September). The price continued to drop, registering $47.60
at the end of the first quarter of 2015.
The increase in domestic production has greatly reduced
U.S. dependence on foreign oil. EIA forecasts that WTI will
average $55.02 in 2015 and $71.00 in 2016. Other experts
expect the price to drop as low as $20.00 per barrel.