Page 1
Aid Effectiveness on Living Standards:
How Does Aid Affect Human
Development Index (HDI) in Sub-
Saharan Africa?
Bachelor thesis, 15hp
Authors: Love Hammarstrand, 891209
Staffan Sundsmyr, 900427
Supervisor: Ann Veiderpass
Department of Economics
2013-05-23
Page 2
List of acronyms
CPI Corruption Perceptions Index
CPIA Country Policy and Institutional Assessment
CRS Creditor Reporting System
DAC Development Assistance Committee
IDA International Development Association
GDP Gross Domestic Product
GNI Gross National Income
HDI Human Development Index
HDR Human Development Report
HDRO Human Development Report Office
IDA International Development Association
NGO Non-Governmental Organization
ODA Official Development Assistance
OECD Organization for Economic Cooperation and Development
USD United States dollar
Page 3
Abstract
This study looks at whether aid affects Human Development Index (HDI), focusing on the
geographical region of Sub-Saharan Africa. Aid effectiveness is often measured in
economic growth, why we choose to see how aid affects the standards of living instead.
Data on HDI have been collected from the HDRO, both from their database and their annual
reports, while data on aid come from the OECD database DAC2a. We experienced the HDI
definition changing over time as well as general data availability to be a problem. We
performed two different econometric analyses, the first ranging between the years 1993-
2007 and the second between the years 2005-2011. The study finds that the aggregate
term for aid, ODA excluding debt, has a significant positive effect on the HDI of the aid
recipient within the first year of receiving it. We also find evidence of effects of different aid
variables that are lagged 1-3 years. These are humanitarian aid and technical cooperation
as well as ODA excluding debt. The coefficients of these lagged variables vary between
positive and negative, showing differences in the effect of different types of aid as well as
differing effects over time. Our findings suggest that the overall effect of aid is positive. We
recommend further research on a country-specific level as well as adding corruption as a
further influence.
Page 4
Table of Contents I. Introduction .............................................................................................................................. 1
II. Theory and background discussion .................................................................................... 4
2.1 Aid Effectiveness ................................................................................................................. 4
2.2 Jeffrey Sachs ....................................................................................................................... 5
2.3 William Easterly ................................................................................................................... 6
2.4 Paul Collier .......................................................................................................................... 7
2.5 Dambisa Moyo .................................................................................................................... 8
2.6 Aid Dependency .................................................................................................................. 9
III. Definitions ........................................................................................................................... 11
IV. Methodology and Data ....................................................................................................... 14
4.1 Data ................................................................................................................................... 14
4.2 The Dependent Variable - HDI .......................................................................................... 15
4.3 Explanatory Variables and Their Justifications .................................................................. 16
4.4 Summary Statistics and Description of Variables .............................................................. 20
4.5 Models ............................................................................................................................... 23
V. Regressions and Results .................................................................................................... 25
5.1 The First Regression, 1993-2007 ...................................................................................... 25
5.2 The Second Regression, 2005-2011 ................................................................................. 29
VI. Analysis and Discussion .................................................................................................... 32
6.1 The First Regression, 1993-2007 ...................................................................................... 32
6.2 The Second Regression, 2005-2011 ................................................................................. 34
6.3 Differences Between the Regressions .............................................................................. 35
6.4 Continued Analysis ............................................................................................................ 36
VII. Summary and Conclusion ................................................................................................ 39
VIII. References ........................................................................................................................ 41
Page 5
1
I. Introduction
Our objective is to find out whether foreign aid affects the standard of living in developing
countries, namely Sub-Saharan Africa. To answer this question we will look at how the
Human Development Index (HDI) develops when aid is received. Furthermore, we want to
investigate what the discussion has been like regarding the rationale of developed countries
for giving aid.
HDI is a well-recognized country-specific measurement for the standard of living. This index
is in turn composed of three other indices; health index, education index and income index.
The Sub-Saharan African countries differ vastly in terms of ethnicity, culture, geography and
history. This leaves us with different stories of how these countries ended up where they are
today. Many tend to consider the whole African continent as having the same
characteristics, but there are many differences that we have tried to consider in order to
produce an applicable analysis. The answer to the question why these countries have fallen
into poverty is widely discussed by many economists.
There is an ongoing debate about the efficiency of aid where some of the most prominent
economists have been Easterly, Collier, Sachs and Moyo, we have focused on their
findings. In brief, Sachs argues for a moral responsibility in providing aid to the developing
world. Moyo argues against aid as a tool for development, especially in Sub-Saharan Africa.
Easterly has been voicing the view that aid is a poor instrument in relieving poverty. Collier
takes a more moderate position while still promoting aid. He also argues for the existence of
poverty traps, which Easterly is skeptical about.
We will look at countries within the Sub-Saharan African region. This geographical area is
the most affected region in the world when it comes to poverty and low levels of population
well-being, and it shows up in the HDI indices. Being the most exposed area in the world, it
also receives the most aid. In 2011 the continent of Africa received 37% of total aid given in
the world and Sub-Saharan Africa received 88% out of the total aid going to Africa (DAC2a,
to find these figures; ”all donors”; “aid type: ODA total excl. debt”; “constant prices”).
Page 6
2
There are different kinds of aid given to these countries, and we will address this later in this
study.
The aid debate has received increased attention since the beginning of the 21st century.
This is much due to the Millennium Development Goals set up at the Millennium Summit in
the year 2000. These goals include increased resource transfers as well as extending the
effectiveness of donor coordination. Further, specific debt relief institutions have been
introduced to cut the debt burden of developing countries (UN, 2013b).
The efficiency of aid is often estimated by its impact on GDP growth. It is our belief that the
utmost importance of aid should be to improve the standard of living of the citizens of
developing countries. Assuming this viewpoint, what we are interested in looking at is how
the lives of the population are changed, and possibly improved, when aid is introduced or
intensified. The information captured by HDI is valuable as it records indices that estimate
the life expectancy, level of education as well as income. These are all key factors in
determining the standard of living. We therefore think that it is more appropriate to look at
HDI rather than to just look at the economic growth, the approximate effect or essence of
which is captured in GDP/capita or GNI/capita and therefore in HDI.
There are potential problems using HDI as a measurement. As always when using
measures including GNI/capita or GDP/capita, there is the issue of the distribution of
income not being taken into account. When it comes to the other two indices, education and
health, this is not a problem to the same extent. Although the distribution of education and
health might not be perfect, it seems more reasonable to believe it is more accurate than
measuring economic wealth, as the spectrum from minimum to maximum is far greater
when talking about income than when we are looking at education and health. The largest
difference in years of education could only be about 20 years and the same principle would
hold true for health as well, as it measures life expectancy, whereas the difference in
income could easily be measured in millions. However, when it comes to education there
could be differences in quality that would then be unaccounted for in HDI, due to the ways
of measuring the education index.
Page 7
3
In countries that are recipients of aid we believe that there will be a positive correlation
between aid received and an increase in HDI. It seems obvious that the countries that
receive aid already have a low HDI, and in this sense there is a negative correlation
between a high HDI and receiving a lot of aid. In this sense, the causality between aid and
economic growth is the same. From our point of view, this is not a problem for our research.
We divide this essay into six different sections, excluding the first and last sections;
introduction and references. In the second section we present theories and discussions on
poverty and aid from some of the most well recognized economists and their theories. This
provides a necessary background and justification for our study. The third section includes
definitions of different categories of aid. In the fourth section we introduce our methodology
together with the variables and the econometric models. In the fifth section, we present the
regression results. In the sixth and penultimate section we analyze and discuss the results
to arrive at a conclusion on how aid affects HDI.
Page 8
4
II. Theory and background In this section we present the opinions of four economists on the aid debate. Further, we
look at aid dependency.
2.1 Aid Effectiveness
There is an ongoing discussion about the effectiveness of aid, which is seemingly
unresolved.
The main focus in this debate has been the effectiveness of aid concerning economic
growth, but there have also been discussions on the effect of aid on social development
indicators such as child and infant mortality. What we are interested in looking at is whether
aid helps to increase HDI for developing countries. We have not seen a lot of research
linking HDI with aid. The fact that this potential link seems to remain somewhat unexplored
sparked our interest in this field.
For the sake of our research, it is important to know what sort of aid might contribute to an
increase in the value of HDI. Previous research has concluded that not all aid given is
meant to increase the economic growth of developing countries. One example of this is
emergency relief and humanitarian aid (Veiderpass and Andersson, 2011). It is reasonable
to believe that these types of aid could affect HDI since two of the indices are not related to
income. One might argue that economic growth will indirectly increase the well-being of the
population and thus the HDI value, considering the income index in HDI. That is the reason
why aid given to directly support economic growth is interesting for our research as well.
Keep in mind, the three indices that compile HDI are directly or indirectly affected by the
countries’ economic growth.
We have chosen to look closer at the views of four of the main economists within this
debate: Jeffrey Sachs, William Easterly, Paul Collier and Dambisa Moyo. The reason we
choose to include these economists is because of their wide array of opinions. This creates
a spectrum of attitudes towards aid and its place in defeating poverty.
Page 9
5
2.2 Jeffrey Sachs
Sachs, Director of The Earth Institute at Columbia University, argues in his book The End of
Poverty, published in 2005, that extreme poverty, i.e. less than one dollar per day, could be
overcome by the year 2025. The concrete solutions he offers are increased use of malaria
bednets, debt forgiveness and a twofold increase of the total developmental aid provided
between the years 2002 and 2015. He stresses the importance of achieving the Millennium
Development Goals, especially the estimation that the countries in the developed world
need to commit 0.7% of their GNP to alleviating the ailments of the poor through the
channel of developmental aid. Several studies support his claims of the effectiveness of
aimed developmental aid in constraining the spread of diseases such as malaria.
Demombynes and Trommlerova (2012) found that the child mortality in Kenya had
decreased from 47 to 22 per 1000 live births between 2003 and 2008. The explanation they
give for this is the improved access to water and sanitation as well as an increase in the use
of malaria bednets. They claim that these insecticide-treated bednets account for 39% of
the drop in child mortality and 58% of the drop in infant mortality.
Furthermore, Murray et. al. (2012) found that the global malaria related mortality decline can
be largely attributed to the increase in humanitarian aid to afflicted regions.
In his book Sachs also argues for the existence of “poverty traps”. These would be cyclical
chains of events that keep countries in poverty. He argues that it is essential for these
chains of perpetual poverty to be broken so that the countries can rid themselves of poverty.
Sachs suggests that this can be done only by intensifying aid. To break these poverty traps,
he prescribes what he calls the big push where the cyclicity of the trap is discontinued by
one generation lifted out of poverty. Hence, the next generation will not grow up in extreme
poverty.
Sachs says in an interview about his book Common Wealth, published in 2008, on CBC
(2009) that there is an ideological opposition to aid where the skeptics of aid think that the
free market should take care of all problems. The problem with this view, he says, is that it
Page 10
6
is not rooted in empirical findings. Sachs writes in a response to Moyo’s book Dead Aid
(2009), that the opponents of aid, especially Moyo and Easterly are hypocritical in their
stance as they both received scholarships to pay for their studies (The Huffington Post,
2009).
To put things into perspective he claims in his CBC (2009) interview that at the time his
book was released the spending on the Pentagon in one year exceeds the amount that has
ever been given in aid to Africa by the whole world. He goes on to point out that the funding
needed to provide sufficient anti-malaria bed nets to last five years in Sub-Saharan Africa is
exceeded by the daily spending on the Pentagon. What Sachs is arguing for is an ethical
responsibility of the developed world to shift their priorities to reach the, in Sachs opinion
very tangible, Millennium Development Goals. The way to follow through on this is to focus
on results-based aid. He is a strong proponent of developmental aid and claims that
measles was brought down by 91% since the year 2000 across Sub-Saharan Africa and
that this is attributable to aid activities. Sachs thinks that the focus of aid should lie on
agriculture, education and infrastructure and not on handouts.
Sachs argues that there obviously exists a place for aid. In an article for Project Syndicate
(2012) he sums up with: “A decade of significant progress in health outcomes has proved
the skeptics wrong. Aid for health care works – and works magnificently – to save and
improve lives. Let us continue to support these life-saving programs, which uphold the
dignity and well-being of all people on the planet.”
2.3 William Easterly
Easterly wrote his book, The White Man’s Burden (2006), as a critical response to Sach’s
book The End of Poverty and to the growing paternalistic mentality in the west. The New
York University professor criticizes the modern look on aid to Africa. He argues that the
western world sees itself as the mighty savior for the poorest of the poor. The “it is up to
us”-mentality of the west is a paternalistic view that is patronizing and insulting to Africans.
One view is that rather than causing Africa to westernize, the west should help them to
modernize. The general issue being, that the west are forcing the developing countries to
Page 11
7
change into something that the west believes to be the best way to go. This is a destructive
way of development to any country, according to Easterly.
Another big problem that Easterly proclaims is about how the west have donated 2,6 billion
dollars over the last fifty years, without being able to relieve even the most basic needs of
the poor, for example malaria nets and medicine. Basicly, the effectiveness and fallout of
aid has not succeeded. Easterly’s vision is not to withdraw aid to the poorest in the world,
but rather make sure it reaches their hands (Al Jazeera, 2007).
Easterly (2006) argues that all parts involved need a lot less bureaucracy and more
entrepreneurs to beat extreme poverty. He is accusatory of world leaders trying to solve
poverty behind desks or at large summits. He refers to two different types of advocates to
explain why the aid industry has failed, and what is needed for it to be successful;
“planners” stand for the traditional approach and “searchers” for the alternative approach.
When it comes to development aid, the planners have good intentions but do not motivate
anyone to complete them. They raise expectations and set goals, but take no responsibility
to fulfill them. They decide what is needed from a distance instead of asking it locally.
Searchers, on the other hand, take responsibility for their actions. They find solutions that
work, but also give something in return for them. They work locally and make sure the
recipients get what they need and are pleased.
2.4 Paul Collier
Paul Collier is a professor at Oxford University as well as a former professor at Harvard
University and is working at the World Bank’s research department directing focus on the
poorest countries in the world. In his book The Bottom Billion from 2007, he explains that
the poorest bottom billion people live in countries which have stagnated in growth and are
now stuck at that level. Compared to the majority of the world who is moving forward, these
countries mostly have declining numbers when it comes to growth. The developed world,
the development agencies and governments around the world must re-think and build a
new unity of purpose for helping these countries that are stuck. If we do not act, Collier
argues that the whole issue will become a security nightmare for future generations and
thus affect the whole world at a much larger scale. Collier describes his research as a
Page 12
8
quest; having a tough question to investigate and answer. Collier describes the condition
among the bottom billion countries to be as living in the fourteenth-century; civil war, fatal
diseases, ruling ignorance and more. The biggest problem, thus, being that they are
developing in an opposite direction from the rest of the world.
Furthermore, he introduces four different traps which conclude most of the developing
countries’ problems. These are: the conflict trap, the natural resource trap, landlocked with
bad neighbors and bad governance. When discussing how aid could be an instrument to
increase development and help countries out of these traps, he concludes that there is a big
political debate going on but, all in all, aid for development should be motivated as follows:
“We used to be that poor once. It took us two hundred years to get to where we are. Let’s
try to speed things up for these countries.”
He identifies the four traps and suggests solutions. To summarize his views on how aid can
be an instrument to help these countries, one can state that Paul Collier is positive towards
it. However, when it comes to giving aid; one size does not fit all. The results from aid can
both be negative or positive depending on when and how it is given. In some cases, aid
might finance military budgets, capital flight or a corrupt leader. In the end, Collier believes
aid is part of the solution, not the problem. However, there are limitations which require
further reforms if a country should start its development.
2.5 Dambisa Moyo
The Zambian economist Dambisa Moyo studied at both Harvard and Oxford and is a former
employee of the World Bank and of Goldman Sachs. Dambisa Moyo places herself on the
opposite side of the spectrum compared to Sachs when it comes to aid efficiency. Moyo
argues against aid to Africa in her book “Dead Aid”, from 2009, where she points out that
there are certain things that aid cannot achieve and that the idea that aid could provide a
sustainable long-run growth is a myth. Moyo sees aid as more of a “band-aid solution”. To
back up this argument Moyo claims that over 1 trillion USD has been given in aid to Africa
over the past 50 years and that this has had a negative impact on African growth and claims
that Africa is poorer now than it was two decades ago.
Page 13
9
Moyo (2009) describes an “aid industry” which she thinks wants Africa to be dependent on
aid because they have vested interests and through this dependency would justify their
existence. Included in this industry are aid agencies, policy makers, politicians as well as
academics, Moyo claims. Contrary to Jeffrey Sachs, Moyo argues that the west has no
moral obligation to send aid to Africa. She argues that it is the responsibility of the African
governments to provide public goods and services, not the developed world through aid and
that the African governments should be held accountable to the African voters and not to
the aid agencies. Moyo instead argues that the free market policies implemented by other
countries around the world to achieve economic growth should also be implemented in the
African economies and that it is hypocritical to argue otherwise. The more specific solutions
she offers lie in the African stock and bonds markets. According to Moyo, in three of the five
years prior to her book being published the African stock markets were among the best
places in the world to invest in averaging a return of 40%.
A working paper by Juselius et. al. (2013) found positive effects of foreign aid and found
almost no harmful effects of aid. Their data range from mid-1960s to 2007. They found ODA
to have a long-run positive impact on the macroeconomy. In 33 out of 36 of the Sub-
Saharan African countries that received aid, the authors found positive evidence of an
increase in investment and no evidence of any negative effects of aid.
2.6 Aid Dependency
Some of the critics of aid argue that giving aid creates dependency on future aid. This
could, for example, mean that certain developmental goals would not have been possible to
reach without aid, and this will create obstacles for a country to manage on their own in the
future. It might also mean that the country does not have enough requirements imposed on
them in return to receive funding, that the receiving country’s innovation, productivity or
efficiency might stagnate and in turn might perhaps not facilitate long-term growth.
Bräutigam (2000) writes about aid dependency being a direct consequence depending on
institutional power. She states that depending on the aid recipients institutional stability, the
country may become aid dependent. With weak institutions, a low-income country might
Page 14
10
develop a laid-back adaption towards aid. Weak governance often comes with low or almost
no budgeting and accountability.
Economics editor at The Guardian, Larry Elliott argues in a blog post for The Guardian,
published in 2013, that "smart aid" can work, without creating dependency. In countries that
were not dependent on extractive industries, qualified for debt relief and not involved in civil
conflict, the aid flow tripled on average between 2000 and 2010, without a crowding-out
effect. The "smart aid" that Elliott endorses includes the provision of know-how and best
practice.
Loxley and Sackey (2008) examine the effectiveness of aid estimating fixed-effects growth
models. With the research covering 40 member states of the African Union, they find a
positive and statistically significant effect from aid on economic growth. In an extended
analysis they find aid, workers’ remittances, domestic savings and debt-services to boost
several important sectors which are important for development finance. Later, they conclude
on aid dependency: “However, given the apparent donor aid fatigue and the debt servicing
implications of concessional loans, the paper supports the need to strategize to reduce
future dependence on aid.”
Page 15
11
III. Definitions
To better understand what types of aid there are, we will now introduce some different
distinctions of aid.
ODA and DAC
Development Assistance Committee (DAC) is a forum where certain OECD member states
discuss aid and poverty reduction. ODA is an abbreviation of “Official Development
Assistance”. The DAC defines this as aid going to countries and organizations eligible to
receive aid from OECD. This is an aggregate measurement of aid and consists of multiple
types of aid including, among others, humanitarian aid and technical cooperation. There are
however further restrictions on these countries and organizations:
I) ODA must be provided by official agencies, including state and local governments or, in
the case of an organization, by their executing agencies.
II) The main goal of aid received must be to promote economic development and welfare.
Furthermore, the work must be concessional with a grant element of at least 25% (OECD,
2013d).
The following are distinctions of aid compiled by the OECD and found in the CRS database,
however, we are limited by data as the data only exists for 2010 and 2011. Therefore, we
have to use another database from OECD called DAC2a which has a better availability
although it is less specific.
The types of aid that are distinguished in the OECD database CRS are the following:
Budget Support (General and Sector)
Monetary aid injected into the recipient budget or to a specific sector budget of the recipient.
Here the donor loses the exclusive control of what happens with the donated funds as the
responsibility is now shared with the recipient (OECD, 2009).
Page 16
12
Core Contributions and Pooled Programmes and Funds
As in budget support, donors lose the exclusive control of their contribution as they share
the responsibility of the funds with other stakeholders. These stakeholders could be NGO:s,
multilateral institutions, private donors and various other organizations. The contributions
are often divided into different categories whether the funds are paid to NGO:s or
multilateral institutions. Further classification can be made depending on how the funds are
to be used, on specific-purpose programmes or a pooled funding with a clear goal on how
to use their resources on certain aid activities (OECD, 2009).
Project-type Intervention
The projects that fall under this category are well-defined and specified in terms of
objective, budget, duration and geographical context. The conditions of the project must be
agreed upon by both the donor and the receiving parties prior to initiation. Examples on
different projects could be interventions to reduce AIDS/HIV, building schools, hospitals,
health clinics or similar societal welfare institutions. In the events of equity investment,
humanitarian aid or any aid channelled through NGO’s, projects are classified as project
type interventions even if there was no agreement between the donor and the recipient
party.
The definition of this category is quite broad as it also includes studies, evaluations of
projects as well as the costs of running NGO’s (OECD, 2009).
Approximately two thirds of all aid distributed in 2011 falls under this category according to
OECD data (OECD, 2013a; ”popular queries”; ”aid activities”; “C: project-type interventions”
divided by “all types of aid”).
Technical Assistance
Experts or skilled personnel are provided to developing countries in order to give advice and
to monitor reforms or other transitions in the economy. This category covers provisions
outside the context of projects covered in project-typed interventions above (OECD, 2009).
Page 17
13
Administrative Costs Not Included Elsewhere
This category includes various costs of delivering aid to developing countries which are not
included in other categories. The salaries for in-house agency staff and contractors are
included here; external costs associated with donor experts and consultants are not
included (OECD, 2009).
Debt Relief
This is also referred to as debt forgiveness. For example, the IDA of the World Bank Group
provides concessional loans to many developing countries with relatively low interests and
long maturities. These loans are sometimes dropped and the debtor does not have to pay it
back (OECD, 2009).
Scholarships
This category includes financial aid towards individual students and trainees (OECD, 2009).
Millennium Development Goals
In september 2000, the leaders of the world came together for a summit at United Nations
Headquarters in New York to put together the United Nations Millennium Declaration,
committing their nations to a new global cooperation to cut extreme poverty in half and to
set up a series of goals, including the most troublesome issues regarding poverty and
development, with a deadline of 2015. These goals are known as the Millennium
Development Goals. The goals include reducing child mortality by two thirds, combat
HIV/AIDS, malaria and other diseases, ensuring a primary schooling for all boys and girls
around the world, developing a global partnership for development and more (UN, 2013a).
Page 18
14
IV. Methodology and Data
When constructing our econometric model we use panel data since we are examining
several countries and variables over time. We are using a fixed effects model to account for
the unobserved constant effects that may be present and vary across countries. As these
effects are unobserved we do not know exactly what they entail for our different countries
but they would consist of innate characteristics such as culture or regime. When the fixed
effects model is used we eliminate these constants and this allows us to more accurately
represent the effects of our explanatory variables without these innate country-specific
constants disturbing the results of our regressions. We performed the regressions in the
statistical software program Stata.
4.1 Data
As mentioned earlier, we use data from the databases of OECD, UN and the World Bank,
as well as the UNDP report on HDI - HDR.
When selecting the time frame for our research the main restriction has been the lack of
available data. The latest data that is available on HDI is from 2011 and that is what sets
the upper limit of our second regression. The dataset consists of the countries in Sub-
Saharan Africa and ranges from 1993 to 2011.
We have excluded Somalia from both of our regressions due to the severe lack of data in all
our areas of interest. This is most likely due to the fact that there is an ongoing civil war in
Somalia that began in 1991. We have also excluded Liberia from our first regression for the
same reason; there is almost no data from the 1990’s. This is probably due to the fact that
there was a civil war in Liberia from 1980 to the peace agreement in 2003. This leaves us
with 43 countries in the first regression and 44 countries in the second regressions.
HDRO states the following concerning the data collecting process: “To be of relevance, the
data in the Report requires the highest standards of data quality, consistency, transparency
and accountability. Several steps are taken each year to ensure that the Report maintains
Page 19
15
high quality and reliability. These steps include partnering with many national and
international statistical agencies...Several mechanisms have also been adopted by the
Human Development Report Office (HDRO) to ensure that the data we publish is of high
quality and relevance. In addition to the small in-house team of qualified statisticians, a
Senior Statistical Advisor reviews all of HDRO's statistical work.” (HDRO, 2013b).
The data used to calculate the HDI comes from several major data agencies (HDRO,
2013c).
4.2 The Dependent Variable - HDI
During our research we noticed a problem with how the HDI was calculated. In the 2010
HDR, the definition of HDI had changed from the previous report in the years before that.
Later, we noticed another change in the definition of HDI used in the report of 1995.
The following changes in the 2010 definition were made: The education index from the 2010
report is determined by the mean years of schooling combined with the expected years of
schooling, whereas it was previously determined by the adult literacy rate and the gross
enrolment ratio. The income index also changed at the same time, from previously using
GDP/capita it went to GNI/capita. Before 1995, there was a third definition in place.
However, we consider the use of the even older definition redundant as it does not add new
valuable dimensions to our analysis (HDRO, 2009) (HDRO, 2010).
These changes in definitions are problematic since we cannot mix the various definitions in
the same regression as we would be measuring different things and the results would
therefore not be reliable. What we have decided to do is to perform two separate
regressions; we exclude the years after 2007 from our first regression because we use the
old definition of HDI here. In order to perform the regression with the old definition we look
at the HDR and manually acquire all the values from the HDI tables. We do this for the
reports from 1995 to, and including, 2009. There is a data lag of two years in the reports, i.e
2007 report has 2005 values. Therefore the data ranges from 1993 to 2007 in the first
regression.
The UN database, from which we draw our data on HDI for the second regression (HDRO,
2013a), has retrospectively corrected for the data each year back to 2005. This facilitates a
Page 20
16
second regression with the new definition, however, the number of years included in the
regression is effectively cut by 8 years, since the years 1993-2004 is dropped and 2008-
2011 are added. In the second regression the data then ranges from 2005 to 2011, where
the latest released data is included.
As we expect the effects of aid to be slow (Clemens et al. 2012) we need to include time
lags to account for the effects. This is the main reason for including the older definition and
running two regressions; 8 additional years of data to allow for the possible effects of lags to
be noticed.
The reports state that the data from different years is not strictly comparable: ”As a result of
revisions to data and methodology, Human Development Index values are not strictly
comparable with those in earlier Human Development Reports”. These sorts of warnings
can be read on every HDR in our research. This calls for caution when interpreting the
results of the first regression and the interpretation we make cannot in any sense be
conclusive (HDRO, 2007) (HDRO, 2008).
E.g.: ”Data refer to national literacy estimates from censuses or surveys conducted between
1995 and 2005, unless otherwise specified. Due to differences in methodology and
timeliness of underlying data, comparisons across countries and over time should be made
with caution” (HDRO, 2007) (HDRO, 2008).
We think this might be a reason as to why many choose to use economic growth as a
measurement of aid effectiveness instead of HDI. Because of the retrospective correction of
data back to 2005, this is not a problem in our second regression.
4.3 Explanatory Variables and Their Justifications
When considering variables in our regressions we have deliberately omitted the three
indices that make up HDI as explanatory variables. If we would not have considered this,
both sides of the equation would have been exactly the same and the R2 would have been
very close to 1. To avoid this we look for other variables that fulfill either one or both of the
following criteria; they seem likely to affect at least one of the three indices that construct
Page 21
17
HDI or in some way allude to the standard of living. An example of the latter would be
sanitation or diseases.
We also had to consider the accessibility of data. There are a few large organizations in the
world who compile these sorts of massive international data collections and many countries
have missing data on various years because of conflicts or some other national crises.
Additionally, we had to make sure that we had data for all the variables for the years we
wanted to include. For some of the years we might have data on aid but not on HDI or vice
versa. When we noticed the change in the definition of HDI, as mentioned above, this was
one of the main issues.
The following is a list of our explanatory variables:
Mortality Rate Between the Ages 0 to 5, per 100 000 Live Births
This will most likely affect the health index of HDI, which measures life expectancy at birth.
It is reasonable to believe that the higher the mortality rate of children is, the lower the life
expectancy will be. This issue is closely related to human development and the fight to
eradicate poverty. The reduction of child mortality is one of the Millennium Development
Goals stated by the UN in 2000. We believe we might see a shift in this variable for the
better after the year 2000 and possibly affecting HDI in our regressions (World Bank,
2013e).
Prevalence of HIV, In Percentage of Population Between Ages 15 to 49
The rationale for including this variable is similar to that of the mortality rate above; the
health index is likely affected along the same lines. Being one of the most destructive
diseases in Sub-Saharan Africa the prevention of HIV/AIDS is also a big part of the
Millennium Development Goals set up by the UN (World Bank, 2013f).
Incidence of TBC per 100 000 People
The TBC disease is typical for developing countries and poverty stricken parts of the world
and therefore an indication of the country’s health standard. In Swaziland, for example, it is
Page 22
18
the most common cause of death (UN, 2012). The data is taken the World Bank database
(World Bank, 2013d).
Access to Sanitation Facilities, In Percentage of Total Population
This variable measures the percentage of the population that has adequate access to
excreta disposal facilities. These facilities are defined as flushing toilets with a sewerage
connection and must be correctly constructed and maintained. Access to this sort of
facilities improves sanitation and prevents the spread of diseases (World Bank, 2013c).
Inflation, Measured Annually In Percentage of Average Consumer Prices
This variable is only included in the first regression as the HDI of the second regression is
adjusted for inflation through the income index.
We included this variable because we believe it has an impact on the income index of HDI.
There might not exist a direct causal relationship with well-being although the people’s
private economy will be negatively affected when inflation becomes too high (IMF, 2013).
Aid: ODA Disbursements Excluding Debt
There are many different types of aid and they could affect HDI through various channels.
The ODA data are the aggregate numbers of aid given to the different countries in Sub-
Saharan Africa. In order to get the most accurate figures it is a good idea to exclude debt,
since loans have to be repaid, and use figures on disbursement instead of commitment
because they signify actual transfers and not only what has been promised (OECD, 2013b).
The data on this variable comes from the OECD database DAC2a. The data we used
includes data from all donors and not only the aid given by the DAC member countries. We
use constant prices, the figures are in millions of 2011 USD. The same settings apply for
other aid variables from DAC2a (OECD, 2013c).
Aid: Technical Cooperation
This is also sometimes referred to as technical assistance, as it is in CRS (OECD, 2009).
Either way, in our research this includes two occasions: the first one is grants to citizens
from an aid recipient country receiving education or any sort of training at home or abroad.
The second one is payments to consultants, advisers, teachers, administrators or any other
Page 23
19
personnel serving in an aid recipient country, including any equipment costs. In case of
certain projects or programmes these costs are not recognized as technical cooperation but
instead considered included in the project or programme expenditures (OECD, 2013c).
Aid: Humanitarian aid
The OECD defines humanitarian aid as being: “assistance designed to save lives, alleviate
suffering and maintain and protect human dignity during and in the aftermath of
emergencies. To be classified as humanitarian, aid should be consistent with the
humanitarian principles of humanity, impartiality, neutrality and independence.” Their
definition covers aid in the forms of: “disaster prevention and preparedness; the provision of
shelter, food, water and sanitation, health services and other items of assistance for the
benefit of affected people and to facilitate the return to normal lives and livelihoods;
measures to promote and protect the safety, welfare and dignity of civilians and those no
longer taking part in hostilities and rehabilitation, reconstruction and transition assistance
while the emergency situation persists. Activities to protect the security of persons or
property through the use or display of force are excluded. Includes aid to refugees in
developing countries, but not to those in donor countries” (OECD, 2013c).
IDA Resource Allocation
This variable is an index ranging between 1-6 depending on the amount of resources the
IDA of the World Bank has allocated to each specific country, where 6 is high and 1 is low.
This variable is only used in the second regression with the years ranging from 2005-2011,
the reason being lack of data for earlier years. IDA is an organization branch from the World
Bank focusing on grants and loans towards the poorest countries in the world (World Bank,
2013b).
Lagged Variables of Aid and IDA
The effects of aid are likely to take time and we think that it would be unreasonable to
expect immediate visible effects in any of the indices other than the income index. We
added three years of lag because when we first added the fourth year of lag, there was an
issue with too few observations. We want to refer to Clemens et al. (2012) and their article
about the timing and lag of aid when measuring its effectivity in terms of economic growth.
Page 24
20
Although we are examining the effect on HDI, we believe there are great similarities in the
lagged effect of aid: “Funding for a new road might affect economic activity in short order,
funding for a vaccination campaign might only affect growth decades later and humanitarian
assistance may never affect growth.”
4.4 Summary Statistics and Description of Variables
The following tables are variable descriptions and summary statistics on our datasets. Table
1 and 3 presents the detailed description for the variables in the first and second regression
respectively. Table 2 and 4 presents number of observations, the mean value, standard
deviation, and the minimum and maximum value of the variables in the first and second
regression respectively.
Page 25
21
Table 1: Description of the variables of the first regression:
Table 2: Summary statistics for the first regression:
Page 26
22
Table 3: Description of the variables of the second regression:
Table 4: Summary statistics for the second regression:
Page 27
23
In the first regression, we notice that the minimum value is negative, -29.57. After further
investigation we find that this number comes from the country Gabon in the year 2001. We
also find that Gabon has a negative value of ODA, of -24.04, for the year 2003. The
Republic of Congo also shows a negative value, -20.7, for the year 2006. This shows up in
both regression and is the minimum observed value in the second one. We do not know
why this is but we believe it could only be the case if this was net values. However, this
variable is listed as the total amount of ODA excluding debt received.
The fact that the averages are not consistent over the time lagged variables might seem
peculiar at a first glance, however, this is not strange when thinking about the mechanism in
place. For every one year lag added to variable, the data entries of that variable are shifted
one year forward in time and one missing data entry is generated for the first year of that
variable. For the data entries not to overlap onto the next country in the dataset, one data
entry is dropped. This means that there are fewer observations resulting in a different mean
value. As observations are dropped and missing data entries are generated in this manner it
is possible for the maximum and minimum observed values to change as well.
4.5 Models
The functional form of our model uses HDI as the dependent variable and aid-variables
among others as independent variables. The models we use are based on the standard
fixed effects model assumptions that can be found in Wooldridge (2009), “Introductory
Econometrics”.
For our first regression the functional form is:
HDIit = β0 + β1ODAit + λ1ODAlag1it+1 + λ2ODAlag2it+2 + λ3ODAlag3it+3 + β2HumanitarianAidit +
λ4HAlag1it+1 + λ5HAlag2it+2 + λ6HAlag3it+3 + β3TechnicalCooperationit + λ7TClag1it+1 +
λ8TClag2it+2 + λ9TClag3it+3 + β4TBCit + β5HIVit + β6ChildMortalityit + β7Sanitationit + β8Inflationit +
αi + uit
(Equation 1)
Page 28
24
For our second regression the functional form is:
HDIsit = β0 + β1ODAit + λ1ODAlag1it+1 + λ2ODAlag2it+2 + λ3ODAlag3it+3 + β2HumanitarianAidit +
λ4HAlag1it+1 + λ5HAlag2it+2 + λ6HAlag3it+3 + β3TechicalCooperationit + λ7TClag1it+1 + λ8TClag2it+2
+ λ9TClag3it+3 + β4IDAit + λ10IDAlag1it+1 + λ11IDAlag2it+2 + λ12IDAlag3it+3 + β5TBCit + β6HIVit +
β7ChildMortalityit + β8Sanitationit + αi + uit
(Equation 2)
Where, β0 is the constant and β1, β2,...,βk are the coefficients of the explanatory variables.
Lambda (λ) represents the coefficients of the lagged variables and α is the unobserved
constant specific for the fixed effect model. The residual is denoted by u.
The following is our question formulation expressed in hypotheses:
Null hypothesis (H0): the coefficients of the aid variables = 0
Alternative hypothesis (H1): the coefficients of the aid variables ≠ 0
Page 29
25
V. Regressions and Results In this section we present the results from the regressions, which will be analyzed and
discussed in the next section. We examine what variables are significant at the 1%-, 5%-
and 10%-level looking at the t-value and the p-value.
5.1 The First Regression, 1993-2007
The first regression covers the years 1993-2007 and is not using adjusted HDI:
HDIit = β0 + β1ODAit + λ1ODAlag1it+1 + λ2ODAlag2it+2 + λ3ODAlag3it+3 + β2HumanitarianAidit +
λ4HAlag1it+1 + λ5HAlag2it+2 + λ6HAlag3it+3 + β3TechnicalCooperationit + λ7TClag1it+1 +
λ8TClag2it+2 + λ9TClag3it+3 + β4TBCit + β5HIVit + β6ChildMortalityit + β7Sanitationit + β8Inflationit +
αi + uit
(Equation 1)
Page 30
26
Table 5: The first regression:
The R2 of this regression is 0.4207.
The degrees of freedom and significance level are as follows:
1st regression: (n-k-1) = (462-17-1) = 444 → ∞
This gives us significance levels:
1%: t-value ≥ |2.326|
5%: t-value ≥ |1.960|
10%: t-value ≥ |1.564|
Page 31
27
The only two variables that are significant at the 1%-level are inflation and child mortality.
- Inflation is significant at the 1%-level as |3.41|>|2.326| and the p-value is 0.001|. The
variable has a positive effect on HDI, which means they are positively correlated. For every
increase in the inflation index by one unit, HDI increases by 0.0001246.
- Child mortality is significant as |9.75|>|2.326| and the p-value is 0.000. The coefficient is
negative which means that there is a negative correlation between this variable and the
dependent variable. As the rate of child mortality between the ages 0-5 goes down 1 death
per 1000 live births, the HDI goes up 0.0013376.
We find two variables that are significant at the 5%-level. These are HAlag3 (Humanitarian
aid lagged three years) and TClag2 (Technical cooperation lagged two years).
- We find HAlag3 is significant at the 5%-level as |2.06|>|1.960| and the p-value is 0.040.
Humanitarian aid has a positive effect on HDI three years after the aid is received, and
these are therefore positively correlated. For each million in 2011 US dollars in
humanitarian aid, HDI increases, three years after aid was received, by 0.0000807.
- TClag2 is found to be significant as |2.07|>|1.960| and the p-value is 0.039. The coefficient
of TClag2 is 0.0002052 meaning that there is a positive correlation between this variable
and the dependent variable, HDI. As technical cooperation lagged two years increases by
one unit of measurement, millions of 2011 USD, the HDI increases by 0.0002052.
There are three variables significant at the 10%-level: Humanitarian aid, TClag3 and
ODAlag3.
- We find Humanitarian aid significant at the 10%-level due to its t-value being
|1.85|>|1.564| and the p-value is 0.064. The variable is positively correlated with HDI; For
every million in 2011 US dollars in humanitarian aid the country receives, HDI increases
within the first year by 0.0000556.
- The lagged variable ODAlag3 is significant at the 10%-level as |1.69|>|1.564| and the p-
value is 0.092. The coefficient is positive which implies a positive correlation. Ergo, as the
aid received in terms of ODA excluding debt shows an effect on HDI three years after the
year aid was received. As ODAlag3 increases by 1 unit; 1 million 2011 USD, the HDI
increases by 0.0000158.
Page 32
28
- The variable TClag3 is significant at the 10%-level as |1.85|>|1.564| and the p-value is
0.065. The variable is negatively correlated with the dependent variable, HDI. This means
that for every additional million of 2011 US dollars received in Technical cooperation aid,
deteriorates HDI by 0.0000158 units three years after aid was received.
At the significance levels presented above, the following variables were not found
significant: ODA, ODAlag1, ODAlag2, HAlag1, HAlag2, Technical Cooperation, TClag1,
TBC, HIV and Sanitation.
Page 33
29
5.2 The Second Regression, 2005-2011
The second regression covers the years 2005-2011 and is using adjusted HDI:
HDIsit = β0 + β1ODAit + λ1ODAlag1it+1 + λ2ODAlag2it+2 + λ3ODAlag3it+3 + β2HumanitarianAidit +
λ4HAlag1it+1 + λ5HAlag2it+2 + λ6HAlag3it+3 + β3TechicalCooperationit + λ7TClag1it+1 + λ8TClag2it+2
+ λ9TClag3it+3 + β4IDAit + λ10IDAlag1it+1 + λ11IDAlag2it+2 + λ12IDAlag3it+3 + β5TBCit + β6HIVit +
β7ChildMortalityit + β8Sanitationit + αi + uit
(Equation 2)
Table 6: The second regression:
Page 34
30
The R2 of this regression is 0.1769.
The degrees of freedom and significance level are as follows:
2nd regression: (n-k-1)=(103-20-1)=82
This gives us significance levels:
1%: t-value ≥ |2.373|
5%: t-value ≥ |1.989|
10%: t-value ≥ |1.664|
We find three variables significant at the 1%-level: ODA, Sanitation and Child Mortality.
- The variable ODA is found to be significant at the 1%-level as |2.95|>|2.373| and the p-
value is 0.005. The effect of ODA on HDI is positive, i.e. there is a positive correlation
between the two. When ODA is increased by 1 unit, again 1 million 2011 USD, HDI is
increased by 0.000017.
- Sanitation is significant at the 1%-level as |2.74|>|2.373| and the p-value is 0.009. The
correlation between Sanitation and HDI is positive. The coefficient can be interpreted as the
following: for each one percentage increase of the population having access to a sanitation
facility, HDI increases by 0.004011.
- The variable for child mortality is significant at the 1%-level as |3.31|>|2.373| and the p-
value is 0.002. The correlation between child mortality and HDI is negative. This implies that
as the rate of child mortality between the ages 0-5 goes down 1 death per 1000 live births,
the HDI goes up by 0.0008719.
The only variable that we find significant at the 5%-level is HAlag1, which is significant since
|2.15|>|1.989| and the p-value is 0.037. The coefficient is negative and thus implies a
negative correlation with HDI. For every additional unit of humanitarian aid, which is 1
million 2011 USD, HDI decreases by 0.0000366 one year after the aid is received.
We find one variable being significant at the 10%-level; IDAlag2.
This variable has a t-value of |1.98| which puts it just outside the 5% significant level, but in
the 10% level as |1.98|>|1.664| and the p-value is 0.053. This variable has a negative
correlation with HDI. For each more million 2011 US dollars the country lends from IDA, the
HDI decreases by 0.0000626 after two years.
Page 35
31
At the significance levels presented above, the following variables were not found
significant: ODAlag1, ODAlag2, ODAlag3, Humanitarian aid, HAlag2, HAlag3, Technical
cooperation, TClag1, TClag2, TClag3, IDA, IDAlag1, IDAlag3, TBC, HIV.
For both our regressions, we find significant coefficients of aid variables and so we can
safely reject the null-hypothesis that the coefficients of the aid variables are equal to zero.
Page 36
32
VI. Analysis & Discussion In this section we will analyze and discuss the results from the regressions.
6.1 The First Regression, 1993-2007
The R2 of this regression is 0.4207 as we stated briefly above in the result section. What this
means is that the variables of our model accounts for 42.07% of the outcome. This is a
reasonable outcome as there are many variables that are not included in the regression that
could have explanatory power regarding HDI, and therefore a much higher R2 would have
been indicative of something being wrong with the model.
Since the HDI values in this regression are not adjusted retrospectively for inflation, as the
second regression is, we believe that the significance of this variable should not be
interpreted as a pure effect on HDI, but rather shows the unaccounted inflation in the
income index. This is the case as we are using current prices instead of constant prices,
and the fact that inflation is significant here suggests that what we should have relied on is
constant prices. However, as mentioned earlier, the constant prices were not available to us
since we took the data from the annual reports rather than from the database where the
data is adjusted for inflation. This clearly calls for caution when attempting to establish
anything conclusive from this regression as HDI is not adjusted for inflation.
The fact that child mortality is significant in explaining HDI is not surprising. A high child
mortality number per live births is a symbol of poverty. In the most developed countries in
the world, systematic child mortality is close to none while in developing countries it is a
large problem. The fact that the coefficient is negatively correlated with HDI proves that the
less children that die before the age of five, the higher HDI will be. We find the fight against
child mortality important to increase the standards of living, we also find it among the top
prioritized topics in the Millennium Development Goals.
Significant at the 5%-level we have the lagged variables HAlag3 and TClag2. These
findings are in line with what Clemens et al. (2012) find in their study; the effects of aid are
not immediate, it takes time for efforts to aggregate and to have an impact. The lagged
effect of both humanitarian aid and technical cooperation are positive and increase HDI.
Page 37
33
Humanitarian aid is not really meant to increase the economic growth but rather to act as
emergency relief when disaster strikes. It may therefore be less unexpected to find a
positive effect when looking at HDI rather than economic growth, as HDI takes the health
index and the education index into account. The more lives that are saved from a premature
death the higher the life expectancy would be. This, of course, would be in the long run
which might be why it only shows up three years after the actual aid was given. The finding
that technical cooperation has a positive effect two years after initiation seems perfectly
reasonable as it involves education and training which of course takes some time to
apprehend and to implement into functioning policy.
At the 10% significance level we find Humanitarian aid, TClag3 and ODAlag3.
TClag3 is an interesting variable since we find it negatively correlated with HDI, contrary to
TClag2. We think this could have a connection to aid dependency. As many economists,
including Collier, say, after receiving foreign technical cooperation for some time, the
recipient country must contribute by themselves. Three years might be the breakpoint of this
state where foreign consultants and teachers cannot achieve more success without the
locals contributing. Another reason for the shift from a positive to a negative effect might be
that the consultants the recipient relied upon leave the country and the recipient then falls
back into old routines and habits, and does not manage to incorporate the advice received
into effective policies.
Humanitarian aid is not as big in numbers as ODA or technical cooperation. However, it is
interesting to see it is somewhat significant immediately after the effort. Humanitarian aid
can help to prevent deaths in emergencies, and it is easy to imagine that the impact of
these emergencies could have been much worse without aid. This suggests that the effects
of humanitarian aid can be immediate as well as show up in the future as we mentioned
above.
The fact that ODAlag3 is significant shows once again that it takes a few years for aid to
have an impact on the recipient country, as Clemens et al. (2012) suggest. However, we
find both HAlag3 and TClag2 more significant than the lagged effect of ODA. This does not
necessarily in itself imply that humanitarian aid and technical cooperation contributes to the
Page 38
34
increase of HDI more than ODA does, but as the coefficients of HAlag3 and TClag2 are
greater than that of ODAlag3, we can say that the lagged effect of both humanitarian aid
and technical cooperation is greater than the lagged effect of ODA. This is an interesting
conclusion when looking at which type of aid is the most effective in terms of increasing HDI
and living standards.
It is important to remember that ODA is an aggregate measurement of aid, which includes
both humanitarian aid and technical cooperation as well as other types of aid. The effects
we observe for the other types of aid included in this regression suggest the possibility that
there are other types of aid that are less effective than humanitarian aid and technical
cooperation that bring the overall effect of lagged ODA down.
6.2 The Second Regression, 2005-2011
The R2 of this regression is 0.1769 which means that the variables in this regression
accounts for 17.69% of the outcome. This is a reasonable result and we are content with
this value as the variables of e.g. life expectancy could be countless. Although the years we
observe are fewer, we believe this regression to be more accurate than the first one since
its HDI values have been adjusted retrospectively for inflation and use the same definition of
HDI.
The most significant variables in the second regression are ODA, sanitation and child
mortality. We find child mortality just as significant as in the first regression and this
confirms the importance of this issue. ODA is far more significant in this regression. We
think the explanation lies in what was mentioned above; this regression is more accurate
and therefore more reliant. The immediate effect of aid is both more significant and more
contributing towards a higher value of HDI. None of the lagged variables of ODA were
significant in this regression.
Sanitation was not significant at all in the first regression, but it is significant at the 1%-level
in the second. As we see it, there might be two explanations for this; the first one being that
this regression is more accurate and having more reliant results. This would imply that
these results, where the sanitation variable is positive and significant, are more reasonable.
Page 39
35
The second one being that sanitation as such has improved, so that it has in later years
made a larger difference in living standards for people living in Sub-Saharan Africa.
On a 5% significance level we find HAlag1. The coefficient is negative, which may seem
surprising although other research has reasoned along the same lines concerning
humanitarian aid and economic growth (Veiderpass and Andersson, 2011).
Another explanation for humanitarian aid having a negative impact on HDI is the timing of
emergency relief. Humanitarian aid is always given after natural disasters, conflicts or other
similar catastrophic events. In these times the indices that make up the compound index of
HDI are likely negatively affected by the events themselves. The effect of humanitarian aid
might therefore be coupled with the negative effect of these disasters, mistakenly attributing
these negative effects on HDI to humanitarian aid. The decrease in HDI might then not be a
direct effect of the humanitarian aid, but rather the disaster itself.
IDAlag2 has a negative effect on HDI. The coefficient is relatively high in this regression.
Our variable ODA excludes debt whereas the variable IDA does not, so the difference
between the variables ODA and IDA in this regression are, at least to some extent, due to
debt. We believe that the loans become difficult for countries to repay, and therefore worsen
the economic state of the country. The funds that are spent on repaying loans might instead
be more effectively used to further the social development.
6.3 Differences Between the Regressions
The problem with comparing these two regressions, as we have mentioned before, is that
the definitions of HDI are different and that the first regression does not take inflation into
account. However, there are some differences in the variables that are not affected by this
problem. These include all the aid variables, TBC, HIV/AIDS, child mortality and sanitation.
When looking at the summary statistics (see tables 2 and 4, page 21-22 for respective
regression) we can see that the observed minimum and maximum values as well as the
mean values have changed between the two regressions and so over time.
What we see is that the mean ODA excluding debt received per country has gone up from
519.0107 to 749.5233 and that the maximum observed value has increased from 2685.22
Page 40
36
to 4070.93. The minimum value has increased from -29.57 to -20.7 which is percentual
increase of 30%. The only difference in recipient countries is that in the second regression
Liberia is included. Even though there is one more country included, the mean value of
ODA excluding debt has gone up by 51.61%.
When it comes to TBC, HIV/AIDS, child mortality and sanitation we are less interested in
looking at the minimum observed values as these cases are the least exposed to these
issues.
-The maximum observed value of the incidence of TBC per 100 000 has decreased by
23.71% and the mean value has decreased by 4.73%.
-The maximum observed value of prevalence of people with HIV/AIDS has decreased by
4.76% and the mean value has decreased by 1.3%.
-The maximum observed value of child mortality has decreased by 28.29% and the mean
value has decreased by 19.41%.
-The maximum observed value of the sanitation variable has remained unchanged, but the
mean value has increased by 6.56%.
This is an overall improvement in all the health indicator variables between the two periods,
1993-2007 and 2005-2011.
6.4 Continued Analysis
We surprisingly find humanitarian aid to have a negative impact on HDI in the second
regression. We analysed it above, but want to further investigate its effect on health
indicators. We choose child mortality as the dependant variable because of its clearly
significant impact on HDI in both of our regressions. When running this new regression, we
notice some interesting results on some of the other variables as well:
Page 41
37
Table 7: Child mortality regression:
First of all, we find humanitarian aid to be significant. Its coefficient value indicate that for
every additional million 2011 US dollars received, child mortality between the ages 0-5
decreases by 0.0184518. This indicates that humanitarian aid does have a large impact on
child mortality which, shown by our earlier regressions, has a large impact on HDI.
Other interesting variables we find significant are HIV, sanitation, TClag2 and TClag3.
HIV has a very large impact on child mortality. For every additional one percent of the
population between the ages 15-49 that is inflicted with HIV, child mortality increases by
9.209094 deaths. Sanitation was not at all significant in the first regression, while very
Page 42
38
significant in the second regression. Here, we can see that it plays a big role in reducing
child mortality. Technical cooperation has a positive correlation with child mortality, which
seems odd. We believe, however, that one must separate correlation from causation. Just
as in the humanitarian aid variable in the second regression, we believe there is a
correlation between these two variables since a high child mortality indicates an area in
great need.
One of the problems facing us in the analysis of this data is corrupt leadership. Our fear is
that the aid given does not reach its desired destination and instead ends up in the hands of
dictators and the like. A way of estimating the level of corruption is by use of the indicator
CPI (Corruption Perceptions Index). This is an index that is based solely on the perception
of corruption and the accuracy is therefore questionable. We have found two versions of
this index; CPI from Transparency International (Transparency International, 2012) and
CPIA (Country Policy and Institutional Assessment) on transparency, accountability, and
corruption in the public sector from the World Bank (World bank, 2013a). What could
perhaps be done with these indicators is to add the risk of corruption skewing the results of
our regression by including these indices as weights in the regression. Another way of
analyzing corruption could be to look at the coefficients of the different types of aid to the
indices of corruption over time and compare them looking for correlations. This could be an
interesting topic to look at in a future study.
Page 43
39
VII. Summary and conclusion
Due to the various changes in the definitions of HDI over the years it was difficult to
compare HDI values over a greater period of time. This problem of definitions was solved by
running two different regressions with different data on HDI, separating the two definitions
we chose to use. However, the time period, and therefore the number of observations, was
severely decreased when using the later definition, which is why we chose to keep the first
regression as well.
We can safely reject the null-hypothesis claiming that the coefficients of aid are equal to
zero. Our results indicate that the aggregate term of aid, ODA excluding debt, has a positive
impact on HDI. As can be seen in the results of our second regression, the variable ODA is
found to be significant at the 1%-level and has a positive effect within the first year of
receiving it. When getting specific on different types of aid and what works and has the
largest significant coefficient it is much harder to determine. The main problem we face with
the issue of distinguishing types of aid is the lack of accessible data we see from the OECD
databases. The World Bank database has not been helpful in this regard either. However,
we do find in both regressions that many lagged aid variables are significant but vary in the
sign of the coefficient. In our first regression we found that both ODA and Humanitarian aid
had a significant positive effect three years after it was received. On the other hand we
found that Technical cooperation had a significant negative effect three years after it was
received. In our second regression we found that Humanitarian aid had a significant
negative effect on HDI one year after the aid was received. This surprised us, and so we
conducted a regression with child mortality as the dependent variable, a variable
significantly influencing HDI. In this regression we found that Humanitarian aid significantly
reduced child mortality which we do not think is surprising.
It is important to note here that we cannot claim the first regression we conducted to be
conclusive as it, contrary to our second regression, relies on current prices - it is not
adjusted for inflation. This affects one of the three indices composing HDI, namely the
income index, measuring GDP/capita in our first regression and GNI/capita in our second
regression. It was also difficult to know what variables to use as explanatory variables, other
Page 44
40
than aid, prior to seeing the results and finding out which the important variables were. We
did not choose variables that affected HDI directly, such as the health index itself, but rather
variables affecting HDI indirectly. For example, we did not want to include life expectancy as
a variable since it is a part of the HDI Health Index. We instead choose to include the child
mortality rate since it affects life expectancy, which in turn, affects the health index of HDI.
This prevents an unreasonably high R2-value.
Our results align with various previous studies which can be found in the background
discussion section of this paper. We find a positive correlation between aid and HDI,
whereas, Loxley and Sackey (2008), Juselius et al. (2013), found a positive connection
between aid and economic growth. Our results are more in line with the theories and
arguments of Sachs, Collier and to some extent Easterly. The reason being our findings
concerning the positive correlation between aid and HDI. Further, Sachs argues for the
effectiveness of aid when it comes to preventing the spread of diseases, which is in line with
what we find about the negative effect of humanitarian aid on child mortality. However, our
results are quite contrary to the arguments of Moyo who argues that aid is not a part of the
solution and should be decreased over the coming decades.
As mentioned in the beginning, it is difficult to find the causal relationship between aid and
HDI.
It would have been easier to compare our findings to the previously presented theories if we
would have conducted one regression per country. As it is now, it is more of an aggregated
result for the whole Sub-Saharan Africa. We have not conducted all these regressions as
we consider this to be too much for our time frame. Another interesting approach would be
to incorporate corruption into the model and to look for patterns pertaining to the
effectiveness of aid on increasing HDI. We believe these to be interesting approaches for
further research.
Page 45
41
VIII. References
Al Jazeera (2007), Riz Khan - William Easterly.
Available at: http://www.youtube.com/watch?v=WoV-wtxyQKY
Last accessed on: 2013-05-20
Bräutigam, D. (2000), Aid Dependence and Governance, (Vol. 1). Expert Group on
Development Issues.
Available at: http://www.sti.ch/fileadmin/user_upload/Pdfs/swap/swap404.pdf
CBC (2009), Jeffrey Sachs on CBC News: Our World.
Available at: http://vimeo.com/2898820
Last accessed on: 2013-05-20
Clemens, M. A., Radelet, S., Bhavnani, R. R. and Bazzi, S. (2012), Counting Chickens
when they Hatch: Timing and the Effects of Aid on Growth. The Economic Journal, 122:
590-617.
doi: 10.1111/j.1468-0297.2011.02482.x
Available at: http://onlinelibrary.wiley.com/doi/10.1111/j.1468-0297.2011.02482.x/abstract
Collier, P. (2007), The Bottom Billion. Blackwell Publishing Ltd, Hoboken, New Jersey,
United States.
Demombynes, G. and Trommlerova, S., (2012), What Has Driven the Decline of Infant
Mortality in Kenya? World Bank Policy Research Working Paper No. 6057.
Available at SSRN: http://ssrn.com/abstract=2050847
Easterly, W. (2006), The White Man's Burden: Why the West's Efforts to Aid the Rest Have
Done So Much Ill And So Little Good. Penguin, City of Westminster, London, Great Britain.
Page 46
42
Guardian, The (2013), Money may be tight, but 'smart aid' to developing countries can really
work.
Available at: http://www.guardian.co.uk/business/economics-blog/2013/jan/13/money-smart-
aid-developing-countries
Last accessed on: 2013-05-20
HDRO (2007), Human Development Report 2007/2008, Fighting Climate Change: Solidarity
in a Divided World.
Available at: http://hdr.undp.org/en/media/HDR_20072008_EN_Complete.pdf
Last accessed on: 2013-05-20
HDRO (2009), Human Development Report 2009, Overcoming Barriers: Human Mobility
and Development.
Available at: http://hdr.undp.org/en/media/HDR_2009_EN_Complete.pdf, technical notes p
208
Last accessed on: 2013-05-20
HDRO (2010), Human Development Report 2010, The Real Wealth of Nations, pathways to
Human Development.
http://hdr.undp.org/en/media/HDR_2010_EN_Complete_reprint.pdf, technical notes p 215
Last accessed on: 2013-05-20
HDRO (2013a), Human Development Index (HDI) value.
Available at: http://hdrstats.undp.org/en/indicators/103106.html
Last accessed on: 2013-05-22
HDRO (2013b), Major sources of data used in the Human Development Reports.
Available at: http://hdr.undp.org/en/statistics/understanding/sources/
Last accessed on: 2013-05-20
Page 47
43
HDRO (2013c), Understanding the data.
Available at: http://hdr.undp.org/en/statistics/understanding/
Last accessed on: 2013-05-20
Huffington Post, The (2009), Aid Ironies.
Available at: http://www.huffingtonpost.com/jeffrey-sachs/aid-ironies_b_207181.html
Last accessed on: 2013-05-20
IMF(2013), World Economic Outlook Database.
Available at: http://www.imf.org/external/pubs/ft/weo/2013/01/weodata/index.aspx
Last accessed on: 2013-05-20
Juselius, K., Framroze Møller, N. and Tarp, F (2013), The Long-Run Impact of Foreign Aid
in 36 African Countries: Insights from Multivariate Time Series Analysis, oxford bulletin of
economics and statistics, 03059049 doi:10.1111/obes.12012
Available at: http://onlinelibrary.wiley.com/doi/10.1111/obes.12012/pdf
Loxley, J. and Sackey, H. A. (2008), Aid Effectiveness in Africa. African Development
Review. 20: 163–199. doi: 10.1111/j.1467-8268.2008.00181.x
Available at: http://onlinelibrary.wiley.com/doi/10.1111/j.1467-8268.2008.00181.x/fu
Moyo, D. (2009), Dead aid: Why aid is not working and how there is a better way for Africa.
Farrar, Straus and Giroux, New York, New York, United States.
Page 48
44
Murray, C., Rosenfeld, L., Lim, S., Andrews, K., Foreman, K., Haring, D., Fullman, N.,
Naghavi, M., Lozano, R. and Lopez, A., (2012), Global malaria mortality between 1980 and
2010: a systematic analysis. The Lancet, Volume 379, Issue 9814, Pages 413 - 431, 4
February 2012. doi:10.1016/S0140-6736(12)60034-8
Available at:
http://www.thelancet.com/journals/lancet/article/PIIS01406736%2812%2960034-8/abstract
OECD (2009), Reporting Directives for the Creditor Reporting System.
Available at: http://www.oecd.org/dac/stats/44479737.pdf
Last accessed on: 2013-05-20
OECD (2011), Glossary.
Available at: http://www.oecd.org/site/dacsmpd11/glossary.htm
Last accessed on: 2013-05-20
OECD (2013a), CRS.
Available at: http://stats.oecd.org/Index.aspx (;”popular queries”; ”aid activities”; “C: project-
type interventions” divided by “all types of aid”)
Last accessed on: 2013-05-20
OECD (2013b), DAC Glossary of Key Terms and Concepts.
Available at: http://www.oecd.org/dac/dacglossaryofkeytermsandconcepts.htm
Last accessed on: 2013-05-20
OECD (2013c), DAC2a.
Available at: http://stats.oecd.org/Index.aspx?datasetcode=TABLE2A
Last accessed on: 2013-05-20
Page 49
45
OECD (2013d), Definition of ODA.
Available at:
http://www.oecd.org/dac/stats/officialdevelopmentassistancedefinitionandcoverage.htm#Def
inition
Last accessed on: 2013-05-20
Project Syndicate (2012), Aid Works.
Available at: http://www.project-syndicate.org/commentary/aid-works
Last accessed on: 2013-05-20
Sachs, J. (2006), The End of Poverty: Economic Possibilities for Our Time. Penguin, City of
Westminster, London, Great Britain.
Transparency International (2012), Corruption Perceptions Index.
Available at: http://www.transparency.org/research/cpi/overview
Last accessed on: 2013-05-20
UN (2012), Tuberculosis Care for Rural Swaziland.
Available at: http://www.unmultimedia.org/tv/unia/2012/03/tuberculosis-care-for-rural-
swaziland.html
Last accessed on: 2013-05-20
UN (2013a), Goal 4: Reduce Child Mortality.
Available at: http://www.un.org/millenniumgoals/childhealth.shtml
Last accessed on: 2013-05-20:
UN (2013b), Millennium Development Goals.
Available at: http://www.un.org/millenniumgoals/
Last accessed on: 2013-05-20
Page 50
46
Veiderpass, A., & Andersson, P. Å. (2011), Is Aid the Capital Component Making Countries
Efficient. Journal of Global Analysis Journal of Global Analysis, Vol. 2, No. 1, 2011.
Available at: http://www.economics.handels.gu.se/digitalAssets/1378/1378604_artikel-
dea.pdf
Wooldridge, J. M. (2009), Introductory econometrics: a modern approach. South-Western
Publishing, Connecticut, United States.
World Bank (2013a), CPIA on transparency, accountability, and corruption in the public
sector rating (1=low to 6=high).
Available at: http://data.worldbank.org/indicator/IQ.CPA.TRAN.XQ
Last accessed on: 2013-05-20
World Bank (2013b), IDA resource allocation index (1=low to 6=high).
Available at: http://data.worldbank.org/indicator/IQ.CPA.IRAI.XQ/countries?display=default
Last accessed on: 2013-05-20
World Bank (2013c), Improved sanitation facilities (%of population with access).
Available at: http://data.worldbank.org/indicator/SH.STA.ACSN
Last accessed on: 2013-05-20
World Bank (2013d), Incidence of tuberculosis (per 100,000 people).
Available at: http://data.worldbank.org/indicator/SH.TBS.INCD
Last accessed on: 2013-05-20
World Bank (2013e), Mortality rate, under-5 (per 1000 live births).
Available at: http://data.worldbank.org/indicator/SH.DYN.MORT
Last accessed on: 2013-05-20
World Bank (2013f), Prevalence of HIV, total (% of population ages 15-49).
Available at: http://data.worldbank.org/indicator/SH.DYN.AIDS.ZS
Last accessed on: 2013-05-20


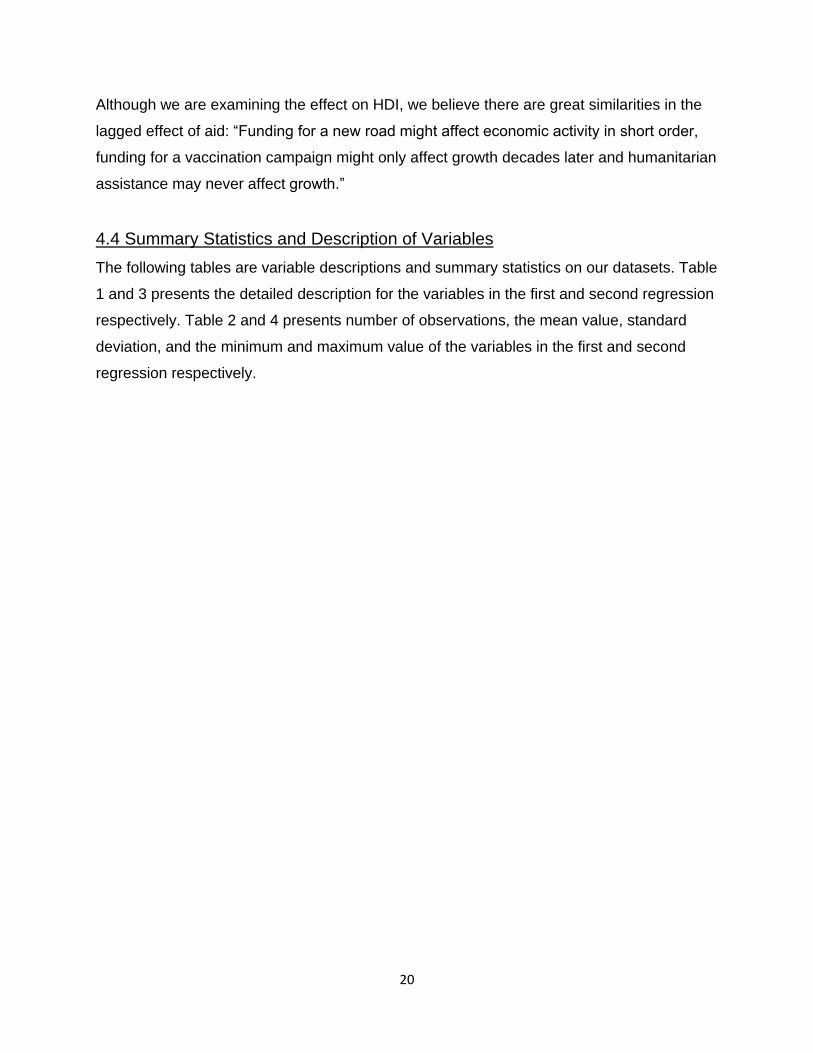
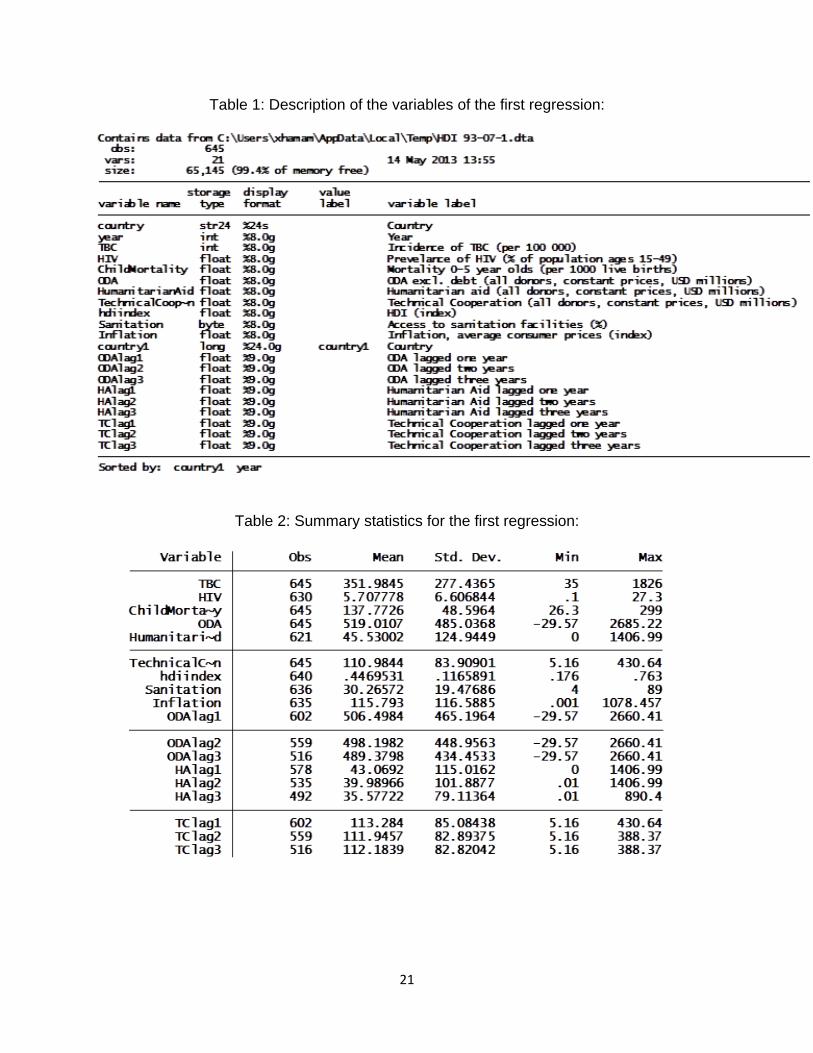

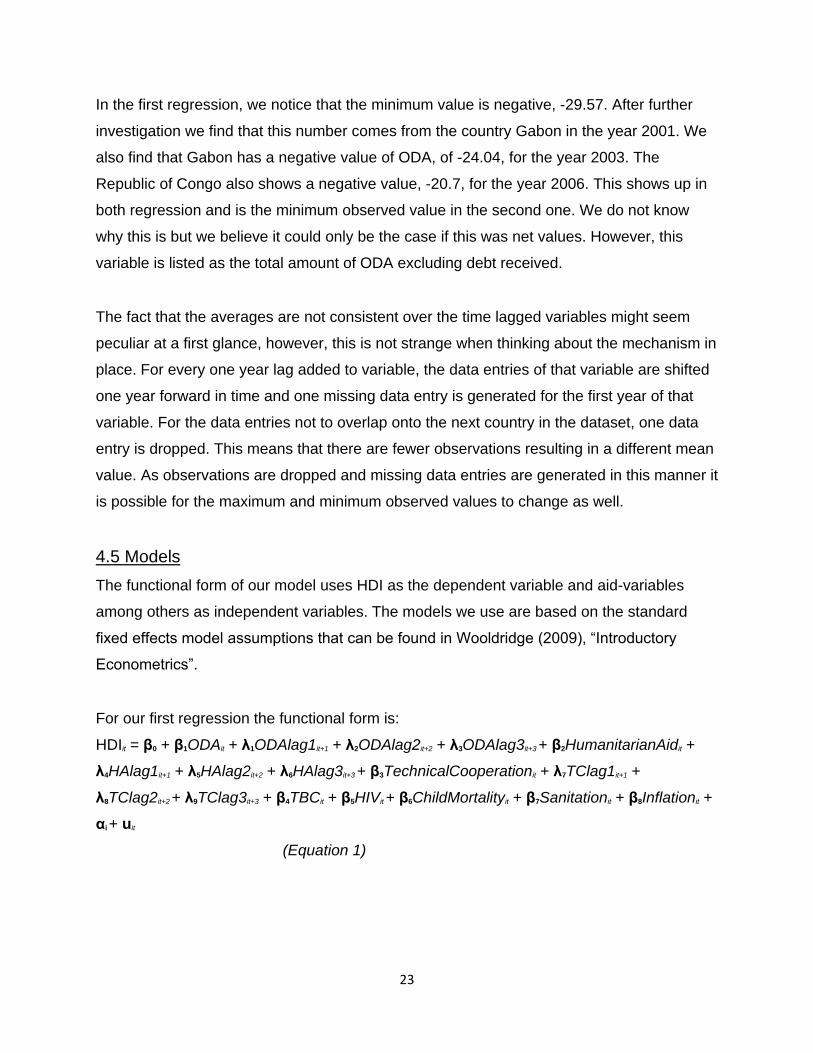


![INHALT - CONTENTS - MATIÈRE · RHZ(DW10ATED); (66kW-120kW) 1.6 HDi; 1.6 HDi 110; 1.6 HDi 110 FAP; 1.6 HDi 110 FAP [04]; 1.6 HDi 110FAP; 1.6 HDi 90; 1.6 HDi 90 [04]; 2.0 HDi; 2.0](https://static.documents.pub/doc/80x56/605cc6e9948bf00b8613e09d/inhalt-contents-matire-rhzdw10ated-66kw-120kw-16-hdi-16-hdi-110-16.jpg)


