How does decentralized minimum wage setting affect employment and informality? The case of Indonesia * Margherita Comola † Paris School of Economics Luiz de Mello ‡ OECD Economics Department October 2010 Abstract The Indonesian labour market is characterized by widespread and growing informality (defined as non-salaried work). To what extent can the growth in informality be attributed to a sharp increase in the real value of the minimum wage since 2001, when minimum- wage setting was decentralized to the provincial governments? To answer this and related questions we use survey data on the labour market, on household income and expenditure and on the industrial sector to construct a district-level dataset spanning the period 1996 to 2004. The effects of changes in the minimum wage on unemployment, formal-sector employment and the incidence of informality in urban areas are estimated by fixed effects with a Seemingly Unrelated Regression estimator. We find that an increase in the ratio of the minimum to the mean wage is associated with a net increase in employment: a rise in informal-sector employment more than compensates for job losses in the formal sector. Keywords: Indonesia, minimum wage, informality, employment, unemployment JEL codes: J23, J31, J64 * We are indebted to Esther Duflo and Wenefrida Wydianti for sharing their data and two anonymous referees for their comments and suggestions. † Paris School of Economics. Email: comola@pse.ens.fr ‡ OECD Economics Department. Email: luiz.demello@oecd.org 1
Transcript
How does decentralized minimum wage setting affect
employment and informality? The case of Indonesia∗
Margherita Comola†
Paris School of Economics
Luiz de Mello‡
OECD Economics Department
October 2010
Abstract
The Indonesian labour market is characterized by widespread and growing informality(defined as non-salaried work). To what extent can the growth in informality be attributedto a sharp increase in the real value of the minimum wage since 2001, when minimum-wage setting was decentralized to the provincial governments? To answer this and relatedquestions we use survey data on the labour market, on household income and expenditureand on the industrial sector to construct a district-level dataset spanning the period 1996to 2004. The effects of changes in the minimum wage on unemployment, formal-sectoremployment and the incidence of informality in urban areas are estimated by fixed effectswith a Seemingly Unrelated Regression estimator. We find that an increase in the ratioof the minimum to the mean wage is associated with a net increase in employment: a risein informal-sector employment more than compensates for job losses in the formal sector.
Keywords: Indonesia, minimum wage, informality, employment, unemployment
JEL codes: J23, J31, J64∗We are indebted to Esther Duflo and Wenefrida Wydianti for sharing their data and two anonymous
referees for their comments and suggestions.†Paris School of Economics. Email: [email protected]‡OECD Economics Department. Email: [email protected]
1
1 Introduction
Indonesia is a very interesting case for empirically testing the impact of minimum-wage leg-islation on employment and informality. The country went through a process of fiscal decen-tralization in 2001 that, among other things, devolved minimum-wage setting responsibilitiesto the provinces and local governments. Devolution was followed by a sharp increase in thereal value of the minimum wage to about 65% of the median wage in 2004, far exceedinglabour productivity gains. Previous empirical literature suggests that this minimum-wagehike is among the main culprits for persistent unemployment since the 1997-98 financial cri-sis (SMERU, 2001; Suryahadi et al., 2003).
It is not easy to gauge empirically the effects of changes in the minimum wage on labour-market outcomes. Job losses tend to be stronger the higher the minimum wage in relationto average earnings and the sharper its increase over time. But other labour market charac-teristics, such as the prevalence of informality, defined in this paper in terms of non-salariedwork, which accounted for close to 70% of urban employment in 2004, are likely to also playa part. To shed light on this issue, we constructed a dataset using survey data on the labourmarket (Sakernas), household earnings and expenditure (Susenas) and the industrial sector(SI, Survei Industri) for 1996-2004, thereby spanning the pre- and post-decentralization peri-ods. In particular, we investigate whether or not - and, if so, the extent to which - an increasein the minimum-to-mean wage ratio drives urban workers out of the formal sector and intoinformality. This displacement effect would be consistent with the predictions of standarddual economy models of labour market segmentation (Welch, 1976; Gramlich, 1976; Mincer,1976; Brown, Gilroy and Kohen, 1982).
This study contributes to the existing literature in two main ways: first, we build a panelusing the local governments, rather than the provinces, as the units of observation, while allprevious literature focuses on provincial data (Islam and Nazara, 2000; Rama, 2001; Surya-hadi et al., 2003). Second, to our knowledge, this is the first paper to estimate jointly theeffects of the minimum wage on formal-sector employment, informality and unemploymentusing seemingly unrelated (SUR) techniques. Previous empirical work for Indonesia andother developing countries have estimated the effect of the minimum wage on labour marketoutcomes separately. In doing so, they ignore the interdependencies that exist among theseoutcomes in response to changes in the minimum wage. Our estimating strategy thereforeaccounts for the presence of such interdependencies.
Our main finding is that an increase in the relative value of the minimum wage is as-sociated with higher informality and lower formal sector employment, which is in line with
2
previous empirical evidence for Indonesia. Also, an increase in the minimum-to-mean wageis associated with a decrease in “queuing unemployment”, a phenomenon that takes placewhen individuals faced with a job loss prefer to remain unemployed while “queuing” for aformal-sector job, instead of working informally. A more interesting finding is perhaps that aminimum-wage hike is associated with a net increase in total (formal and informal) employ-ment: the increase in informal-sector employment more than offsets the corresponding lossof jobs in the formal sector. This finding is consistent with the “lighthouse effect”, describedby Neri, Gonzaga and Camargo (2001) in the case of Brazil, which we also find for Indonesia,whereby informal-sector earnings rise in tandem with the minimum wage, thus attractinginactive workers into the labour market.
The paper is organized as follows. Section 2 reviews the literature on the impact ofthe minimum wage on employment in both developed and developing countries. Section 3describes the data used in the empirical analysis, discusses labour-market trends and summa-rizes the main institutional features of minimum wage setting in Indonesia. Section 4 elabo-rates on the estimating strategy and reports the empirical findings for the entire working-agepopulation and, separately, for males and females. Section 5 concludes.
2 Literature Review
Minimum-wage legislation is meant to protect vulnerable workers by ensuring that low payis consistent with the satisfaction of basic living standards. Nevertheless, it can be arguedthat, to the extent that the minimum wage destroys jobs, it harms, rather than protects,workers whose attachment to the labour force is weak. If the minimum wage is set above itsmarket clearing level, job losses are likely, because it induces a shift in labour demand awayfrom unskilled to skilled labour, and, where possible, from the formal to the informal sector.
2.1 Developed countries
Neoclassical theory suggests that, in a perfectly competitive labour market with homogeneouslabour and full compliance with minimum wage legislation, setting the minimum wage aboveits market clearing level would be equivalent to a negative labour demand shock, which wouldlead to job losses (Stigler, 1946). The magnitude of the corresponding disemployment effectdepends on the wage elasticity of labour demand and the elasticity of substitution betweenskilled and unskilled labour. However, in a non-competitive environment, the minimum wagemay have a positive, rather than negative, effect on employment. This is especially the case
3
where firms have discretion in wage setting (“monopsonistic employer”) or if employers setwages above their equilibrium level to induce workers to be more productive (Rebitzer andTaylor, 1995).
Empirical studies have not reached a consensus on the predictions of the neoclassicalmodel. The empirical literature has focused on developed countries, in particular the UnitedStates and Europe (see Dolado et al., 1996, and Brown, 1999, for surveys). The first gen-eration of studies (surveyed by Brown Gilroy and Cohen, 1982) used time-series techniquesand found the expected negative relationship between the minimum wage and employment,in particular for teenagers, whose attachment to the labour force is particularly tenuous.However, the time-series approach was criticized subsequently on the grounds that it doesnot allow for appropriately disentangling the effects of the minimum wage on employmentfrom those of unobserved changes in macroeconomic conditions.
To overcome these difficulties, a second generation of empirical studies relied predomi-nantly on survey-based data. This literature finds much weaker evidence of a disemploymenteffect associated with the minimum wage. A few longitudinal studies show that vulnerableindividuals, such as youths, are more likely to be unemployed after a rise in the statutory min-imum wage (Neuman and Wascher, 1995; Currie and Fallick, 1996; Bazen and Marimoutou,1997). But in many cross-sectional studies the estimated employment elasticity of the mini-mum wage is statistically insignificant or even positive (Card, 1992; Card and Kruger, 1995;Neuman and Wascher, 1992; Bell, 1997; Bazen and Skourias, 1997; Burkhauser, Couch andWittenburg, 2000; Neuman and Wascher, 2004). A positive employment elasticity would beconsistent with the prediction of non competitive models.
2.2 Developing countries
The literature on how the minimum wage affects employment in developing country is ratherlimited. The conventional theoretical framework is that of a dual economy, where the formalsector behaves as in the neoclassical model (i.e. employment falls in response to a minimum-wage hike), and minimum-wage provisions do not apply in the informal sector (Welch, 1976;Gramlich, 1976; Mincer, 1976; Brown, Gilroy and Kohen, 1982). In this setting, an increasein the minimum wage reduces employment in the formal sector and increases informality,because the displaced workers from the formal sector are absorbed into the informal sector.The net employment effect depends on the elasticity of labour supply (because workers maydrop out of the labour force, instead of seeking an informal-sector job) and demand and thesize of the informal sector.
4
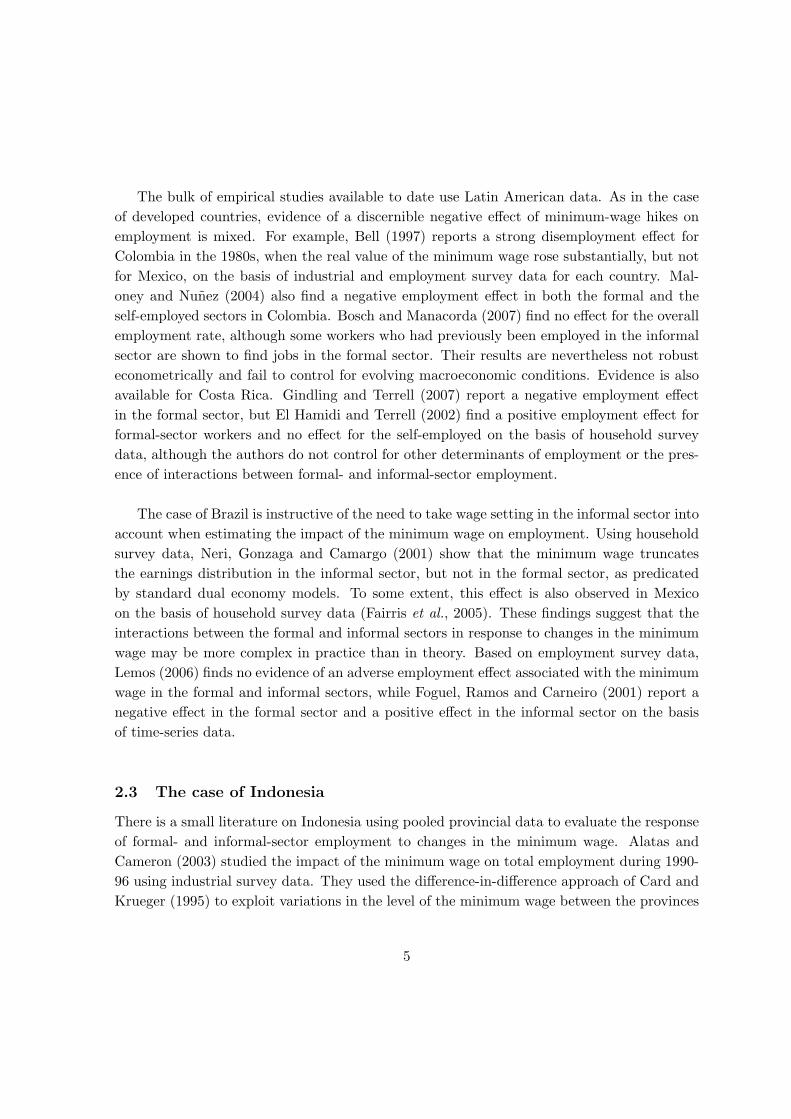
The bulk of empirical studies available to date use Latin American data. As in the caseof developed countries, evidence of a discernible negative effect of minimum-wage hikes onemployment is mixed. For example, Bell (1997) reports a strong disemployment effect forColombia in the 1980s, when the real value of the minimum wage rose substantially, but notfor Mexico, on the basis of industrial and employment survey data for each country. Mal-oney and Nunez (2004) also find a negative employment effect in both the formal and theself-employed sectors in Colombia. Bosch and Manacorda (2007) find no effect for the overallemployment rate, although some workers who had previously been employed in the informalsector are shown to find jobs in the formal sector. Their results are nevertheless not robusteconometrically and fail to control for evolving macroeconomic conditions. Evidence is alsoavailable for Costa Rica. Gindling and Terrell (2007) report a negative employment effectin the formal sector, but El Hamidi and Terrell (2002) find a positive employment effect forformal-sector workers and no effect for the self-employed on the basis of household surveydata, although the authors do not control for other determinants of employment or the pres-ence of interactions between formal- and informal-sector employment.
The case of Brazil is instructive of the need to take wage setting in the informal sector intoaccount when estimating the impact of the minimum wage on employment. Using householdsurvey data, Neri, Gonzaga and Camargo (2001) show that the minimum wage truncatesthe earnings distribution in the informal sector, but not in the formal sector, as predicatedby standard dual economy models. To some extent, this effect is also observed in Mexicoon the basis of household survey data (Fairris et al., 2005). These findings suggest that theinteractions between the formal and informal sectors in response to changes in the minimumwage may be more complex in practice than in theory. Based on employment survey data,Lemos (2006) finds no evidence of an adverse employment effect associated with the minimumwage in the formal and informal sectors, while Foguel, Ramos and Carneiro (2001) report anegative effect in the formal sector and a positive effect in the informal sector on the basisof time-series data.
2.3 The case of Indonesia
There is a small literature on Indonesia using pooled provincial data to evaluate the responseof formal- and informal-sector employment to changes in the minimum wage. Alatas andCameron (2003) studied the impact of the minimum wage on total employment during 1990-96 using industrial survey data. They used the difference-in-difference approach of Card andKrueger (1995) to exploit variations in the level of the minimum wage between the provinces
5
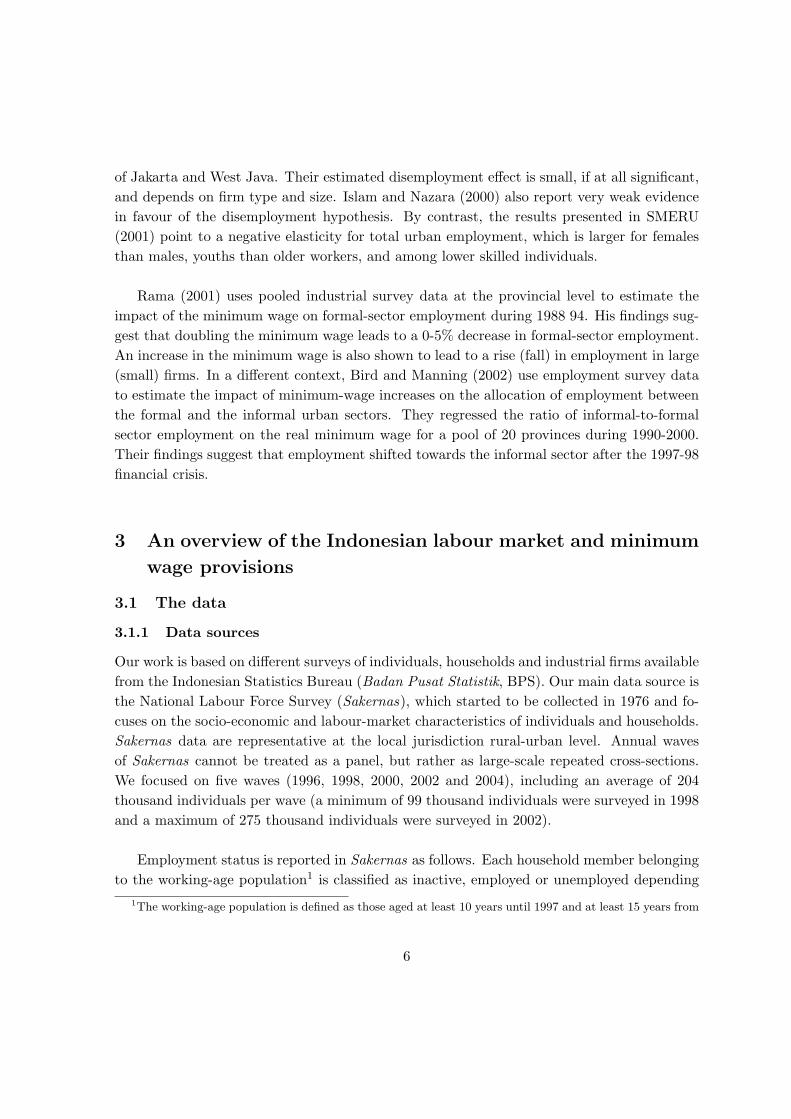
of Jakarta and West Java. Their estimated disemployment effect is small, if at all significant,and depends on firm type and size. Islam and Nazara (2000) also report very weak evidencein favour of the disemployment hypothesis. By contrast, the results presented in SMERU(2001) point to a negative elasticity for total urban employment, which is larger for femalesthan males, youths than older workers, and among lower skilled individuals.
Rama (2001) uses pooled industrial survey data at the provincial level to estimate theimpact of the minimum wage on formal-sector employment during 1988 94. His findings sug-gest that doubling the minimum wage leads to a 0-5% decrease in formal-sector employment.An increase in the minimum wage is also shown to lead to a rise (fall) in employment in large(small) firms. In a different context, Bird and Manning (2002) use employment survey datato estimate the impact of minimum-wage increases on the allocation of employment betweenthe formal and the informal urban sectors. They regressed the ratio of informal-to-formalsector employment on the real minimum wage for a pool of 20 provinces during 1990-2000.Their findings suggest that employment shifted towards the informal sector after the 1997-98financial crisis.
3 An overview of the Indonesian labour market and minimum
wage provisions
3.1 The data
3.1.1 Data sources
Our work is based on different surveys of individuals, households and industrial firms availablefrom the Indonesian Statistics Bureau (Badan Pusat Statistik, BPS). Our main data source isthe National Labour Force Survey (Sakernas), which started to be collected in 1976 and fo-cuses on the socio-economic and labour-market characteristics of individuals and households.Sakernas data are representative at the local jurisdiction rural-urban level. Annual wavesof Sakernas cannot be treated as a panel, but rather as large-scale repeated cross-sections.We focused on five waves (1996, 1998, 2000, 2002 and 2004), including an average of 204thousand individuals per wave (a minimum of 99 thousand individuals were surveyed in 1998and a maximum of 275 thousand individuals were surveyed in 2002).
Employment status is reported in Sakernas as follows. Each household member belongingto the working-age population1 is classified as inactive, employed or unemployed depending
1The working-age population is defined as those aged at least 10 years until 1997 and at least 15 years from
6
on his/her status during the week prior to data collection.2 Employed individuals are clas-sified as salaried workers (employees), employers, self-employed or family/unpaid workers.Information on earnings is available only for salaried workers.
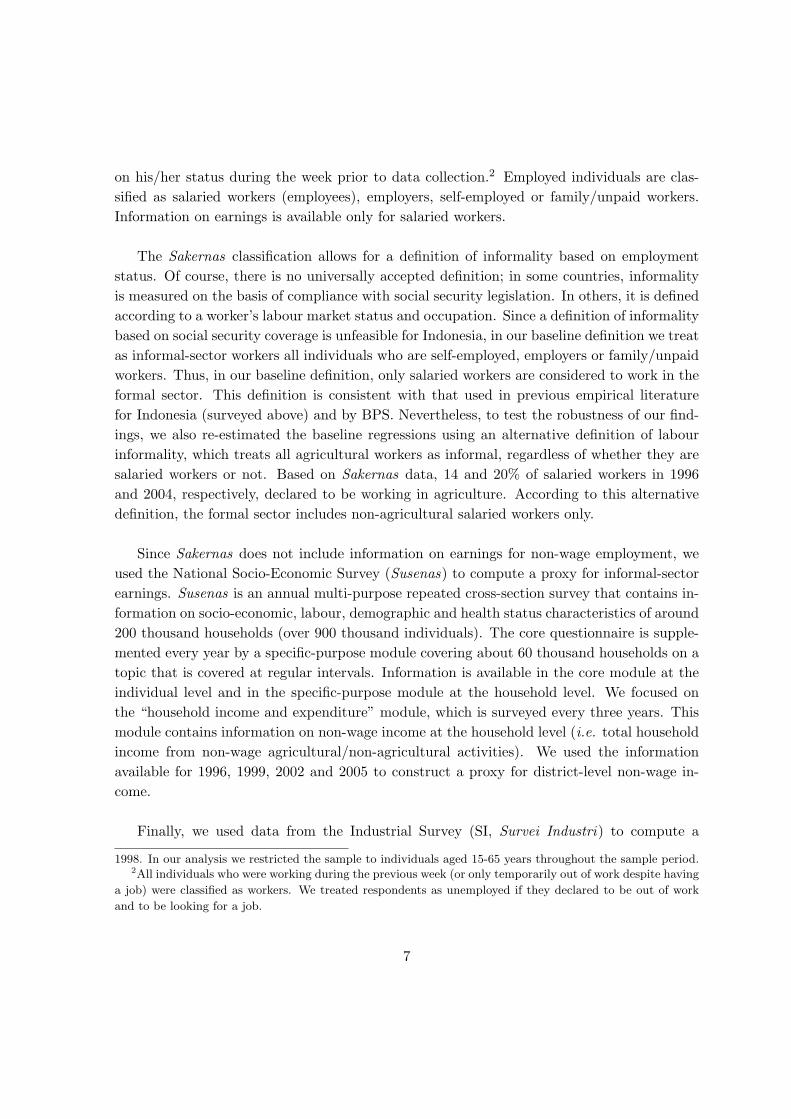
The Sakernas classification allows for a definition of informality based on employmentstatus. Of course, there is no universally accepted definition; in some countries, informalityis measured on the basis of compliance with social security legislation. In others, it is definedaccording to a worker’s labour market status and occupation. Since a definition of informalitybased on social security coverage is unfeasible for Indonesia, in our baseline definition we treatas informal-sector workers all individuals who are self-employed, employers or family/unpaidworkers. Thus, in our baseline definition, only salaried workers are considered to work in theformal sector. This definition is consistent with that used in previous empirical literaturefor Indonesia (surveyed above) and by BPS. Nevertheless, to test the robustness of our find-ings, we also re-estimated the baseline regressions using an alternative definition of labourinformality, which treats all agricultural workers as informal, regardless of whether they aresalaried workers or not. Based on Sakernas data, 14 and 20% of salaried workers in 1996and 2004, respectively, declared to be working in agriculture. According to this alternativedefinition, the formal sector includes non-agricultural salaried workers only.
Since Sakernas does not include information on earnings for non-wage employment, weused the National Socio-Economic Survey (Susenas) to compute a proxy for informal-sectorearnings. Susenas is an annual multi-purpose repeated cross-section survey that contains in-formation on socio-economic, labour, demographic and health status characteristics of around200 thousand households (over 900 thousand individuals). The core questionnaire is supple-mented every year by a specific-purpose module covering about 60 thousand households on atopic that is covered at regular intervals. Information is available in the core module at theindividual level and in the specific-purpose module at the household level. We focused onthe “household income and expenditure” module, which is surveyed every three years. Thismodule contains information on non-wage income at the household level (i.e. total householdincome from non-wage agricultural/non-agricultural activities). We used the informationavailable for 1996, 1999, 2002 and 2005 to construct a proxy for district-level non-wage in-come.
Finally, we used data from the Industrial Survey (SI, Survei Industri) to compute a
1998. In our analysis we restricted the sample to individuals aged 15-65 years throughout the sample period.2All individuals who were working during the previous week (or only temporarily out of work despite having
a job) were classified as workers. We treated respondents as unemployed if they declared to be out of work
and to be looking for a job.
7
measure of district-level labour productivity. SI is an annual panel survey of all manufacturingestablishments with twenty or more employees, or about 22 thousands establishments per yearduring our period of analysis. We used information available for 1996, 1998, 2000, 2002 and2004.
3.1.2 Construction of district-level indicators
Our empirical analysis puts emphasis on local governments, rather than provinces, individualsor households, as the units of observation. Local governments can be regencies (kabupaten)or cities (kota). The main differences between these jurisdictions are related to demographicand economic structure, rather than administrative hierarchy: regencies tend to be larger inarea than cities, and non-agricultural activities are typically more prevalent in cities. How-ever, there are rural and urban areas in both regencies and cities. In what follows, we use theterm “district” more generally to refer to both regencies and cities. The districts have theirown administrative and legislative bodies, and decentralization since 2001 has put them atthe helm of service delivery, especially in health care and education.
Changes in Indonesia’s administrative structure over the years poses considerable chal-lenges for the computation and comparability of district-level data. In 2004 Indonesia wasdivided into 33 provinces, 349 regencies and 91 cities. Between 1996 and 2004, the provinceof East Timor became independent and 7 new provinces and 146 new districts were createdby splitting the existing ones. In order to construct our district-level panel, we matched thedistricts surveyed in Sakernas during 1996-2004 using the official district codes published byBPS.3 Whenever a district was split into two or more new regencies/cities during 1996 and2004, and only one of these new jurisdictions kept its original name, we considered the newregencies/cities all together as a unique observation and computed the relevant indicators forthe years after the split by population-averaging the data across the new districts. Based onthis matching procedure, and focusing on the districts with non-zero urban population, weobtained an unbalanced panel of 293 districts for five years, or about 1151-1114 observationsacross specifications.
3.2 Labour-market trends
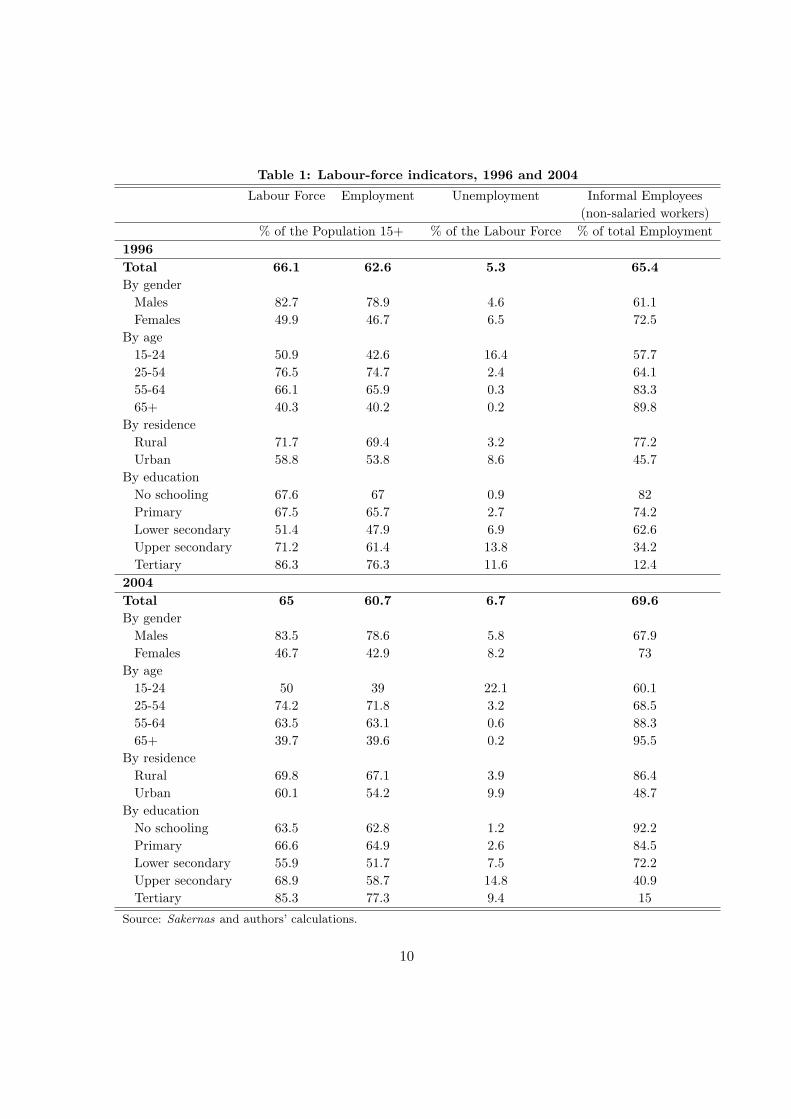
Before turning to the estimations, basic labour-market indicators are reported in Table 1.The labour-force participation, employment, unemployment and informality rates were com-puted on the basis of individual-level Sakernas data for 1996 and 2004 (the indicators are
3Available from http://www.bps.go.id/mstkab/index.html.
8
available for the intermediate years upon request).
The indicators show that labour-force participation has been fairly stable over time atabout two-thirds of individuals aged at least 15 years. Participation is higher in rural thanurban areas, reflecting the tendency for all household members to work in family plots. Inaddition, labour supply is higher for males than females and tends to rise with educationalattainment.
Labour demand patterns are comparable to those of labour supply. Employment tendsto be higher for males than females, for residents of rural areas than urban dwellers andamong prime-age individuals than youths and elderly workers. As for unemployment, it isparticularly high for youths, workers with secondary education and women. It increasedsubstantially during 1996 2004, albeit from a small base, for older workers and for the leasteducated individuals (i.e. those with no schooling). To a certain extent, high unemploymentamong the workers who would otherwise be best equipped to find a job in the formal sector(i.e. those with tertiary education) suggests that these individuals may not be willing to workin the informal sector. When faced with a job loss, they may prefer to wait for a formal-sectorjob, instead of working informally, so long as they can support themselves and their familiesin the meantime, a phenomenon that is often referred to as “queuing unemployment”.4
Finally, labour informality is widespread, at about 70% of the employed population in2004. Informality is less widespread among men than women, workers living in urban thanrural areas, and among prime-age and younger individuals. Unlike participation and employ-ment in the formal sector, informality declines with educational attainment.
4The unemployment rates reported in Table 1 are comparable over time, because the same methodology
is used for both 1996 and 2004. This is not the case of the statistics reported by BPS, which are affected by
a methodological change in 2001. The new definition includes individuals who are preparing to launch a new
business and those who are not in the labour force but willing to work. Inclusion of these discouraged job
seekers is thought to account for a large share of the increase in unemployment after 2001 (Sugiyarto et al.,
2006).
Table 1: Labour-force indicators, 1996 and 2004
Labour Force Employment Unemployment Informal Employees(non-salaried workers)
% of the Population 15+ % of the Labour Force % of total Employment1996Total 66.1 62.6 5.3 65.4By gender
Minimum-wage provisions are applicable to regular, full-time work. The minimum wage isset on an annual basis at the sub-national level of government on the basis of an estimatedcost of living indicator (KHL), which is used as an initial benchmark. This indicator wasintroduced in the late 1990s and is defined in terms of caloric intake. Since decentralization in2001, the level of the minimum wage has been calculated by the local governments and thenproposed to the provincial government by a tripartite wage council, including representativesfrom labour, government and the private sector. Typically, the lowest minimum wage pro-posed by the local governments in a given province is chosen by the provincial government.By contrast, prior to decentralization, the minimum wage used to be set nationally by thecentral government on the basis of an estimated needs indicator (KHM)5, which correspondsto a lower caloric intake benchmark than that implied by KHL (2600 as opposed to 3000calories per day in the case of KHL).6
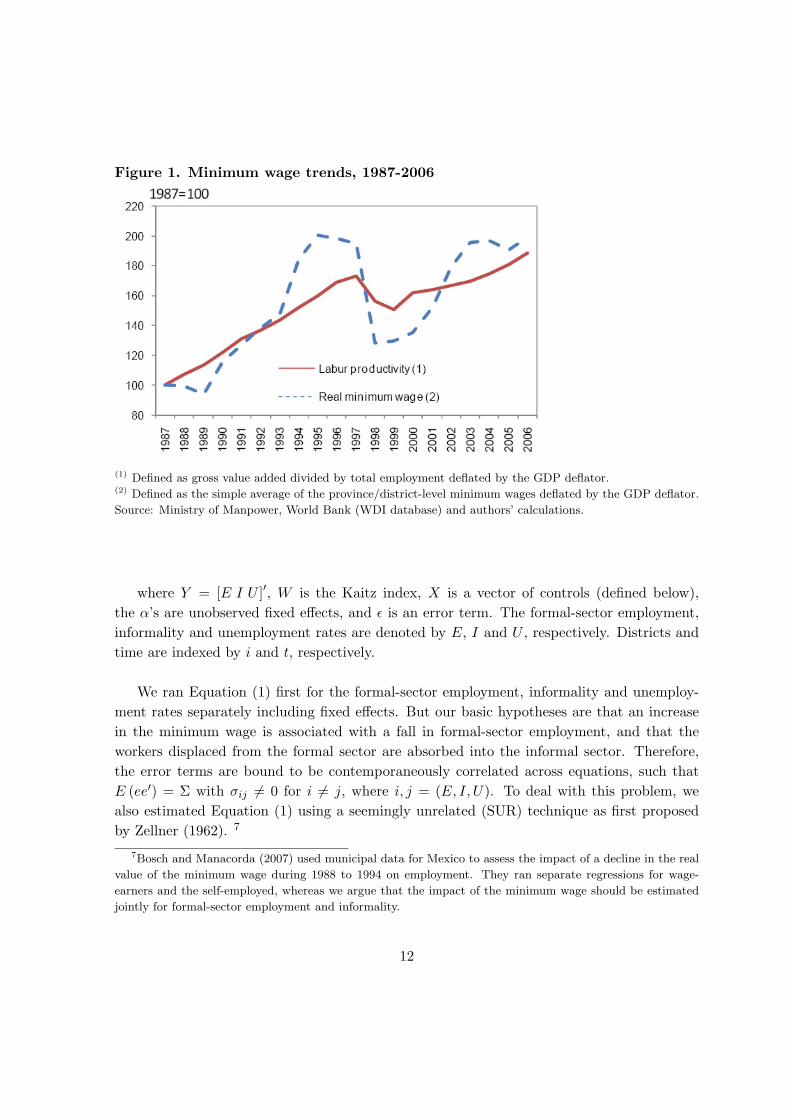
Of particular importance for the empirical analysis reported below is the increase in thereal value of the minimum wage over time, especially during 2000-03. The minimum wagerose faster in real terms than value added per employee, especially during the 1990s and 2000-03 (Figure 1), and, as a result, it is very high in relative terms, at about 65% of the medianwage in 2004. To put this relative value in perspective, the ratio of minimum-to-median wagewas about 45% on average in the OECD area in 2004 (OECD, 2008).
4 The effect of the minimum wage on formal-sector employ-
ment, informality and unemployment
4.1 Estimation strategy
Our empirical strategy is to estimate the impact of the minimum wage on the labour marketby regressing the formal-sector employment (i.e., salaried work), informality (i.e., non-salariedwork) and unemployment rates on the minimum-to-mean wage ratio (the so-called Kaitz in-dex). Our estimating equation is as follows:
Yit = β0 + βWit + γXit + αi + εit (1)5Until end-2000, there were different minimum wages within a few provinces (Riau, South Sumatra, West
Java, East Java and Bali) and for selected sectors of activity.6For more information on minimum-wage setting, see SMERU (2001) and Widarti (2006).
11
Figure 1. Minimum wage trends, 1987-2006
(1) Defined as gross value added divided by total employment deflated by the GDP deflator.(2) Defined as the simple average of the province/district-level minimum wages deflated by the GDP deflator.
Source: Ministry of Manpower, World Bank (WDI database) and authors’ calculations.
where Y = [E I U ]′, W is the Kaitz index, X is a vector of controls (defined below),the α’s are unobserved fixed effects, and ε is an error term. The formal-sector employment,informality and unemployment rates are denoted by E, I and U , respectively. Districts andtime are indexed by i and t, respectively.
We ran Equation (1) first for the formal-sector employment, informality and unemploy-ment rates separately including fixed effects. But our basic hypotheses are that an increasein the minimum wage is associated with a fall in formal-sector employment, and that theworkers displaced from the formal sector are absorbed into the informal sector. Therefore,the error terms are bound to be contemporaneously correlated across equations, such thatE (ee′) = Σ with σij 6= 0 for i 6= j, where i, j = (E, I, U). To deal with this problem, wealso estimated Equation (1) using a seemingly unrelated (SUR) technique as first proposedby Zellner (1962). 7
7Bosch and Manacorda (2007) used municipal data for Mexico to assess the impact of a decline in the real
value of the minimum wage during 1988 to 1994 on employment. They ran separate regressions for wage-
earners and the self-employed, whereas we argue that the impact of the minimum wage should be estimated
jointly for formal-sector employment and informality.
12
4.2 Definition of the variables and identification
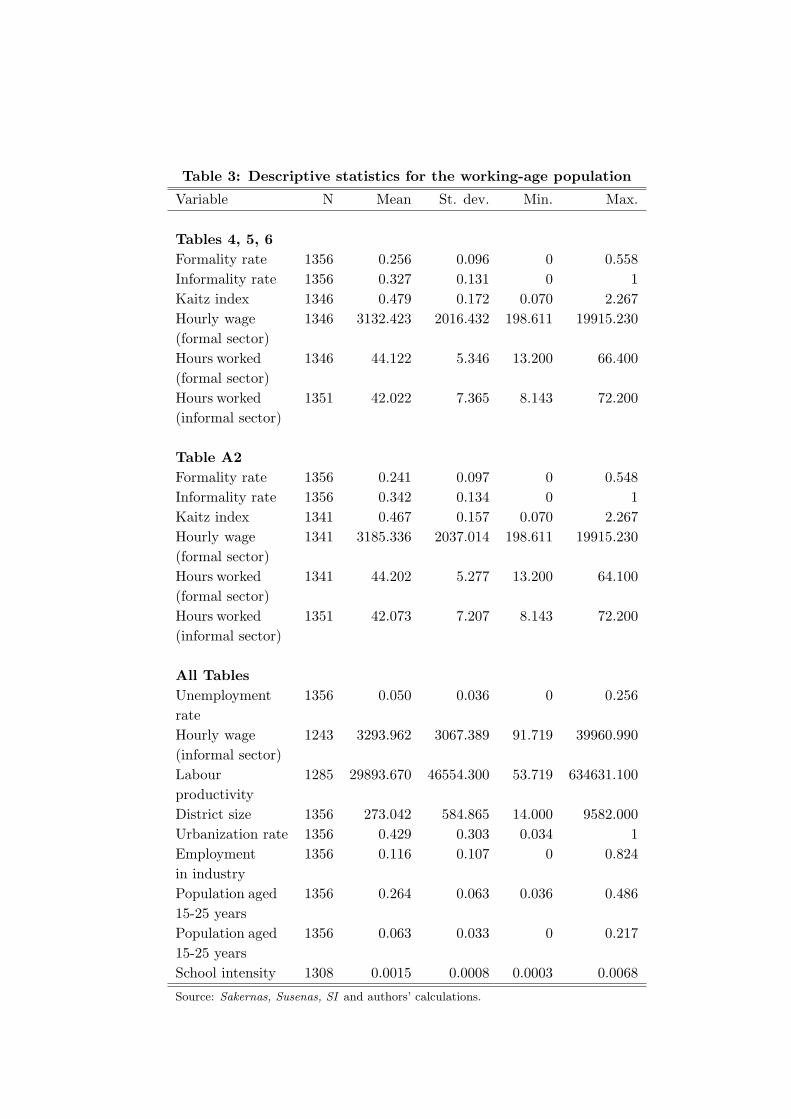
Because our units of observation are the districts, all variables were computed using thereference district’s adult population (aged 15-65 years) living in urban areas. We restrictedthe sample to the urban population, because the formality rate is very low in rural areas(Table 1). As noted above, our baseline definition of formal-sector employment includes onlysalaried workers. The definition of the variables to be included in the regressions is reportedin Table 2. Basic descriptive statistics for the entire working-age population are reported inTable 3.
The main variable of interest is the Kaitz index. It is computed for salaried workers only,because minimum-wage legislation does not apply in the informal sector. The set of controlsis in line with the literature based on longitudinal data (Bell, 1995; Maloney, 1995; Neumarkand Wascher, 2004) and includes indicators of labour-market conditions (hourly wages andhours worked for formal- and informal-sector workers), labour productivity, demographic ef-fects (shares of population aged 15-25 and 56-65 years), economic structure (the referencedistrict’s size, urbanization rate and share of employment in the industrial sector) and timeeffects.
The 2001 decentralization reform provides an unique opportunity to evaluate the effectsof minimum-wage setting in Indonesia. There has been a considerable post-reform increasein the minimum wage variation among the Indonesian provinces, which lends credence to ouridentification strategy: in particular, the variance of the minimum wage rose from 0.14 in2000 to 0.57 in 2002 in the sample of 24 provinces whose boundaries remained unaffected bythe administrative reorganizations.
Identification is of particular importance in our analysis. Of course, it is extremely diffi-cult to propose a definitive identification procedure for estimating the labour market effectsof minimum-wage setting. Notwithstanding this difficulty, our strategy consists essentially ofusing district-level data to run the labour market status equations. The minimum wage (thenumerator of the Kaitz index) is set at the provincial level in Indonesia, therefore variationsin the minimum wage are likely to be endogenous at the provincial level, but reasonablyexogenous at the district level (since districts within the same province are highly heteroge-neous for what concerns labour market conditions). For instance, while employment is likelyto correlate with the minimum wage at the provincial level, there is no reason to believethat a correlation would exist at the level of each district.8 Since mean formal-sector wages
8Both employment and the minimum wage may grow faster in rapidly growing provinces, but this is not
necessarily the case at the district level, unless all districts in the same province grew at the same pace.
13
(the denominator of the Kaitz index) may correlate with unobserved determinants of thelabour market outcomes of interest (formality, informality, unemployment), we include meanformal-sector wages among the regressors, along with other district-level controls proxyingfor labour demand and economic growth.9
We also control for human capital and deal with the likely endogeneity of educationalattainment by following Duflo (2001) in using information on the number of schools built ineach district during implementation of a large school construction program (Sekolah DasarINPRES ) between 1973-74 and 1978-79. We multiplied the number of schools built in eachdistrict by the share of adult population born after 1963 to focus on the cohort that wasexposed to the program. Duflo (2001) shows that the cohort of individuals born in districtsthat benefited from the program was more likely to stay longer at school and to earn moreonce joining the labour force.
9It may also be argued that a fall in the share of formal-sector workers lead to an increase in the Kaitz index
(through a decrease in the denominator). This would be the case if the decrease in formal-sector employment
were associated with a decrease in mean wages in the formal sector, but in our data we do not find evidence
that before 2001 district-level formal-sector wages were affected by informality and unemployment.
14
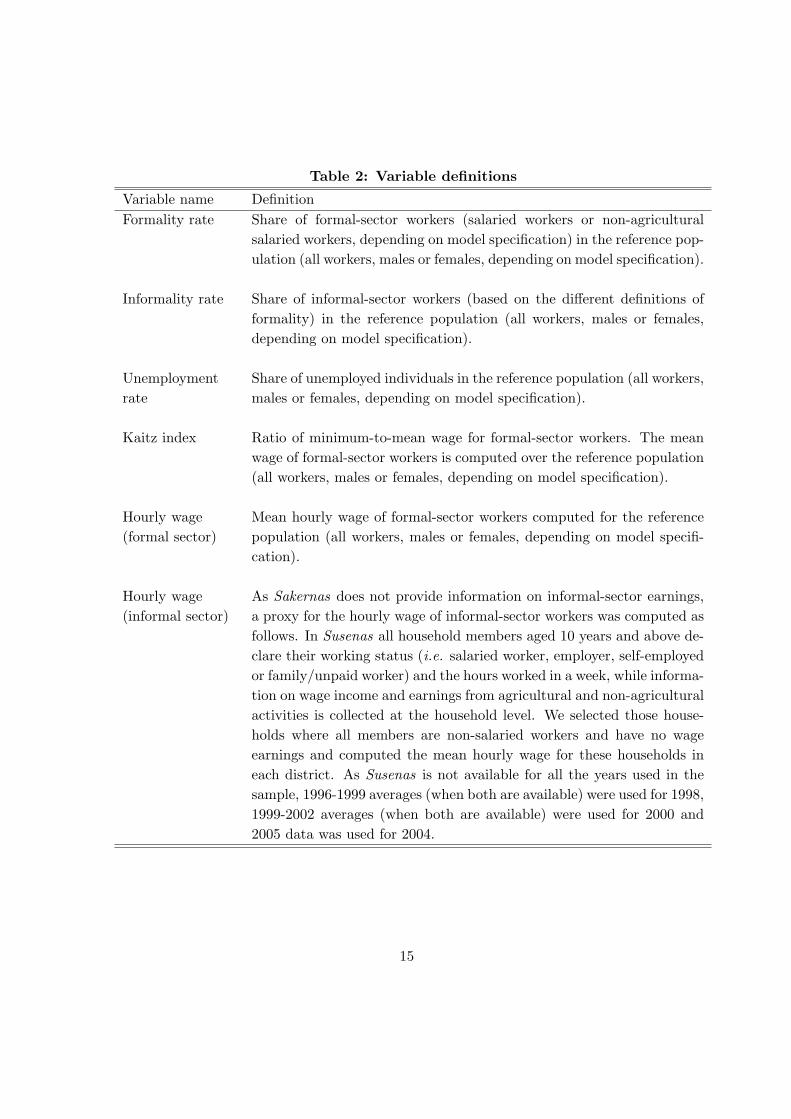
Table 2: Variable definitions
Variable name DefinitionFormality rate Share of formal-sector workers (salaried workers or non-agricultural
salaried workers, depending on model specification) in the reference pop-ulation (all workers, males or females, depending on model specification).
Informality rate Share of informal-sector workers (based on the different definitions offormality) in the reference population (all workers, males or females,depending on model specification).
Unemploymentrate
Share of unemployed individuals in the reference population (all workers,males or females, depending on model specification).
Kaitz index Ratio of minimum-to-mean wage for formal-sector workers. The meanwage of formal-sector workers is computed over the reference population(all workers, males or females, depending on model specification).
Hourly wage(formal sector)
Mean hourly wage of formal-sector workers computed for the referencepopulation (all workers, males or females, depending on model specifi-cation).
Hourly wage(informal sector)
As Sakernas does not provide information on informal-sector earnings,a proxy for the hourly wage of informal-sector workers was computed asfollows. In Susenas all household members aged 10 years and above de-clare their working status (i.e. salaried worker, employer, self-employedor family/unpaid worker) and the hours worked in a week, while informa-tion on wage income and earnings from agricultural and non-agriculturalactivities is collected at the household level. We selected those house-holds where all members are non-salaried workers and have no wageearnings and computed the mean hourly wage for these households ineach district. As Susenas is not available for all the years used in thesample, 1996-1999 averages (when both are available) were used for 1998,1999-2002 averages (when both are available) were used for 2000 and2005 data was used for 2004.
15
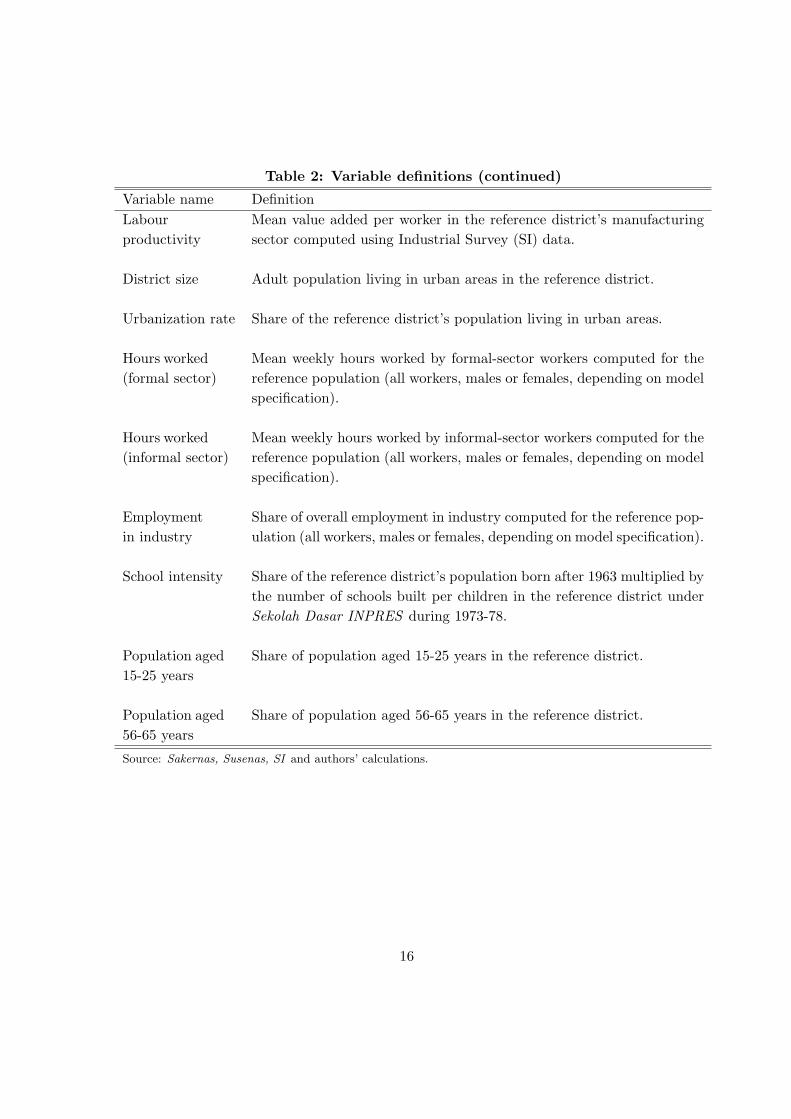
Table 2: Variable definitions (continued)
Variable name DefinitionLabourproductivity
Mean value added per worker in the reference district’s manufacturingsector computed using Industrial Survey (SI) data.
District size Adult population living in urban areas in the reference district.
Urbanization rate Share of the reference district’s population living in urban areas.
Hours worked(formal sector)
Mean weekly hours worked by formal-sector workers computed for thereference population (all workers, males or females, depending on modelspecification).
Hours worked(informal sector)
Mean weekly hours worked by informal-sector workers computed for thereference population (all workers, males or females, depending on modelspecification).
Employmentin industry
Share of overall employment in industry computed for the reference pop-ulation (all workers, males or females, depending on model specification).
School intensity Share of the reference district’s population born after 1963 multiplied bythe number of schools built per children in the reference district underSekolah Dasar INPRES during 1973-78.
Population aged15-25 years
Share of population aged 15-25 years in the reference district.
Population aged56-65 years
Share of population aged 56-65 years in the reference district.
Source: Sakernas, Susenas, SI and authors’ calculations.
16
Table 3: Descriptive statistics for the working-age population
District size 1356 273.042 584.865 14.000 9582.000Urbanization rate 1356 0.429 0.303 0.034 1Employmentin industry
1356 0.116 0.107 0 0.824
Population aged15-25 years
1356 0.264 0.063 0.036 0.486
Population aged15-25 years
1356 0.063 0.033 0 0.217
School intensity 1308 0.0015 0.0008 0.0003 0.0068
Source: Sakernas, Susenas, SI and authors’ calculations.
4.3 Regression results
4.3.1 Working-age population
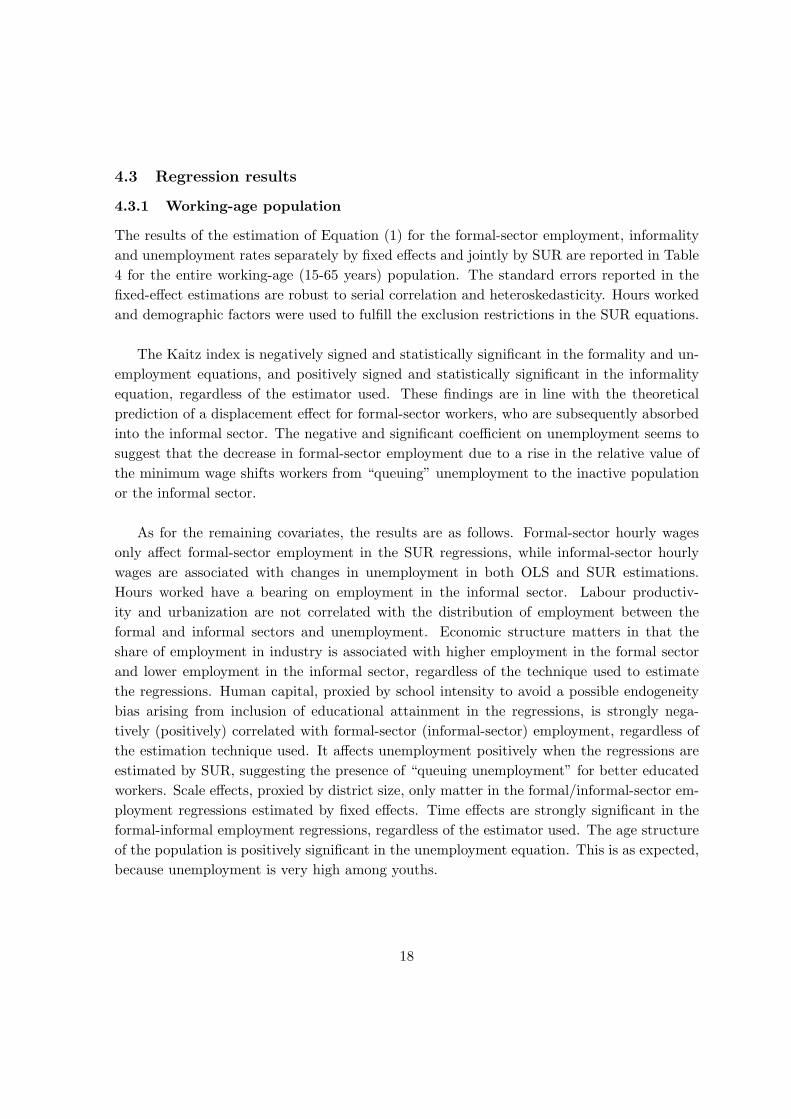
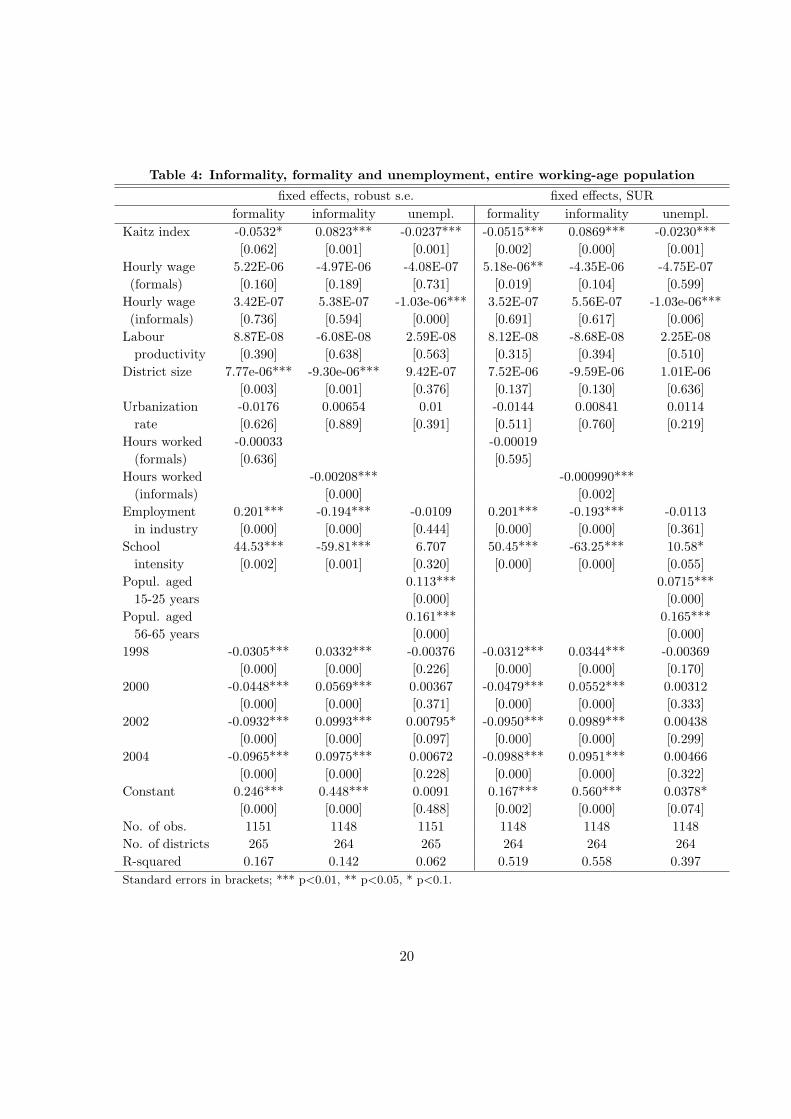
The results of the estimation of Equation (1) for the formal-sector employment, informalityand unemployment rates separately by fixed effects and jointly by SUR are reported in Table4 for the entire working-age (15-65 years) population. The standard errors reported in thefixed-effect estimations are robust to serial correlation and heteroskedasticity. Hours workedand demographic factors were used to fulfill the exclusion restrictions in the SUR equations.
The Kaitz index is negatively signed and statistically significant in the formality and un-employment equations, and positively signed and statistically significant in the informalityequation, regardless of the estimator used. These findings are in line with the theoreticalprediction of a displacement effect for formal-sector workers, who are subsequently absorbedinto the informal sector. The negative and significant coefficient on unemployment seems tosuggest that the decrease in formal-sector employment due to a rise in the relative value ofthe minimum wage shifts workers from “queuing” unemployment to the inactive populationor the informal sector.
As for the remaining covariates, the results are as follows. Formal-sector hourly wagesonly affect formal-sector employment in the SUR regressions, while informal-sector hourlywages are associated with changes in unemployment in both OLS and SUR estimations.Hours worked have a bearing on employment in the informal sector. Labour productiv-ity and urbanization are not correlated with the distribution of employment between theformal and informal sectors and unemployment. Economic structure matters in that theshare of employment in industry is associated with higher employment in the formal sectorand lower employment in the informal sector, regardless of the technique used to estimatethe regressions. Human capital, proxied by school intensity to avoid a possible endogeneitybias arising from inclusion of educational attainment in the regressions, is strongly nega-tively (positively) correlated with formal-sector (informal-sector) employment, regardless ofthe estimation technique used. It affects unemployment positively when the regressions areestimated by SUR, suggesting the presence of “queuing unemployment” for better educatedworkers. Scale effects, proxied by district size, only matter in the formal/informal-sector em-ployment regressions estimated by fixed effects. Time effects are strongly significant in theformal-informal employment regressions, regardless of the estimator used. The age structureof the population is positively significant in the unemployment equation. This is as expected,because unemployment is very high among youths.
18
4.3.2 Robustness checks
The baseline results rely on the identification hypothesis that the minimum wage is rea-sonably exogenous to district-level formal-sector employment and labour-market conditions.This identification hypothesis is important because, by construction, all the variation in theKaitz index arises from the within-province variation in district-level mean formal-sectorwages. The hypothesis is valid because, as noted above, the minimum wage is set througha political process at the provincial, rather than district, level on the basis of caloric intakeindicators. But this may not be true for some of the districts, because the provincial govern-ments typically set the minimum wage at the level of the lowest minimum wage put forwardwithin each province. It may therefore be the case that the Kaitz index is endogenous forlow-income districts. To make sure that this is not driving our results, we re-estimated theregressions by excluding from the sample those districts whose average wages are below theirrespective provinces’ median wage. Our main findings (not reported but available upon re-quest) are nevertheless robust to this re-estimation, which lends credence to our identificationhypothesis.
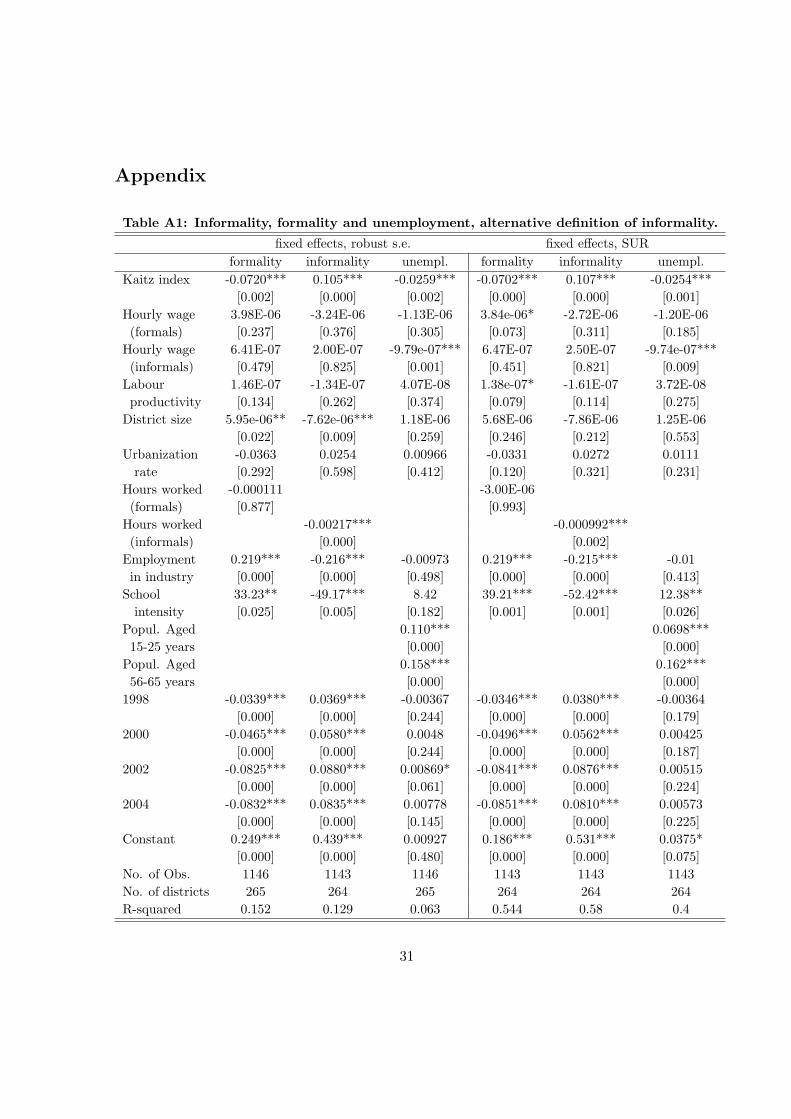
The baseline findings are also robust to a change in the definition of informality. To testthis hypothesis, we re-estimated the baseline regressions while treating only non-agriculturalsalaried workers as formal. The results, reported in Table A1, are comparable to the baselinefindings in the sign and magnitude of the estimated coefficients. We also run the baselineregression for the three types of informal-sector workers (i.e. self-employed, employers andfamily workers) separately. The results of these regressions (not reported but available uponrequest) show that the increase in informality arising from a hike in the Kaitz index is dueentirely to higher self-employment, the group of workers that accounts for the bulk of theinformal sector.
19
Table 4: Informality, formality and unemployment, entire working-age population
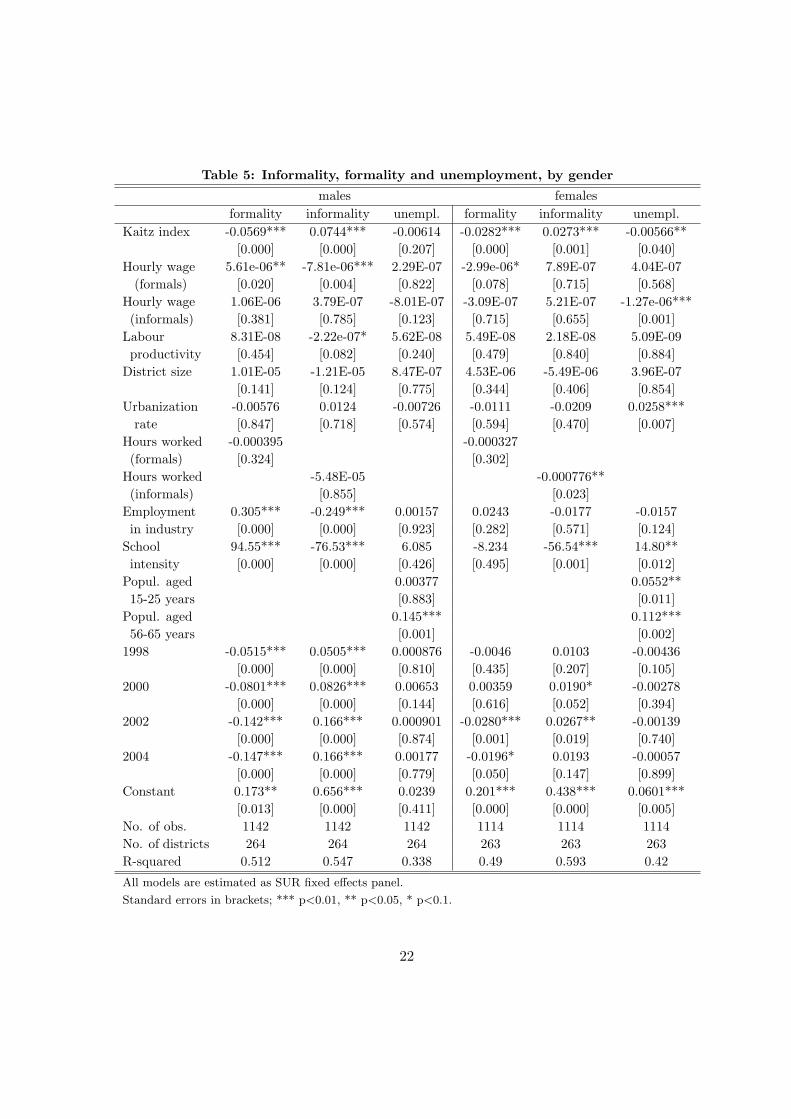
Another consideration is that the effect of the minimum wage on labour-market outcomes maydiffer between males and females. To shed further light on possible gender differentials, thebaseline regressions were re estimated by SUR for males and females. The results reported inTable 5 for formal- and informal-sector employment are comparable to those reported abovefor the entire working-age population: an increase in the relative value of the minimum wageis associated with higher informality and lower employment in the formal sector. As forunemployment, the minimum wage appears to have a negative effect for female but not formales. Hourly wages in the formal sector affect formal-sector employment positively (neg-atively) for males (females) and informal-sector employment negatively for males (no effectfor females). The finding suggests that rising wages in the formal sector attract male workerswho might otherwise work informally to the formal sector, leaving unemployment unchanged.For females, by contrast, rising formal-sector wages depress employment in the formal sector.Nevertheless, informal-sector wages affect unemployment negatively, suggesting that womenmay be attracted to the informal sector when wages rise in that sector, rather than registeringas unemployed.
As regards human capital, we experimented with replacing school intensity, which cannotbe computed for males and females separately, by the shares of population having attain-ment primary and lower-secondary education. The results (not reported but available uponrequest) are comparable to those reported in Table 5, although the effect of formal-sectorhourly wages on informal-sector employment loses significance in the regression for maleworkers.
21
Table 5: Informality, formality and unemployment, by gender
All models are estimated as SUR fixed effects panel.
Standard errors in brackets; *** p<0.01, ** p<0.05, * p<0.1.
22
4.3.4 Net effect on employment
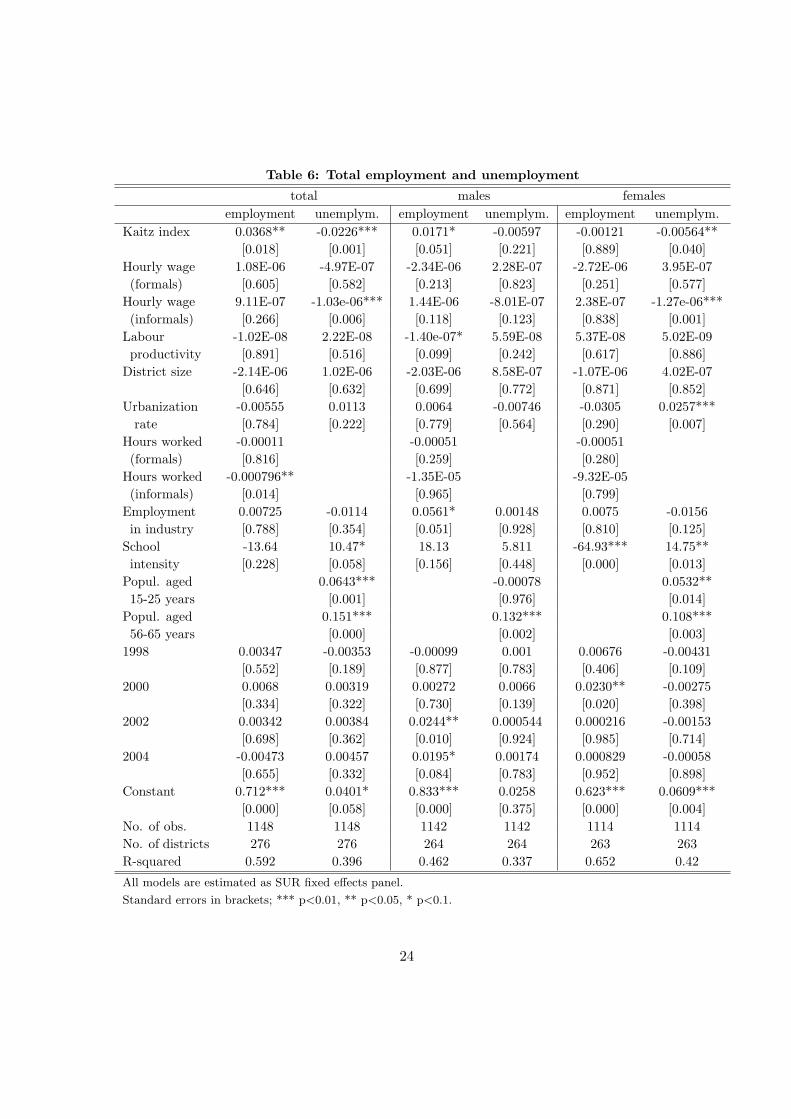
The fact that an increase in the minimum-to-mean wage ratio increases informality and de-presses formal-sector employment does not predict the overall employment effect of minimum-wage hikes. To be sure, we re-estimated Equation (1) as a two-equation model for total(formal- and informal-sector) employment and unemployment as the dependent variables.The results are reported in Table 6.
The parameter estimates for the entire working-age population show that an increase inthe Kaitz index is associated with an increase in total employment and a decrease in unem-ployment. An increase in informality associated with minimum-wage hikes therefore morethan compensates for concomitant job losses in the formal sector and the exit of some un-employed individuals from the labour force. In the case of male workers, the net effect onemployment is positive, and minimum-wage hikes do not affect unemployment. This findingis consistent with the results reported in Table 5, where the (positive) effect of changes in theKaitz index on informality is greater in magnitude than the (negative) effect on formal-sectoremployment. In the case of females, however, the net employment effect is null, because anincrease in informality offsets a concomitant decrease in formal-sector employment.
The finding that an increase in the relative value of the minimum wage has a positivenet effect on employment, at least as far as male workers are concerned, is consistent withthe so called “lighthouse effect”, according to which inactive workers are attracted to thelabour market, because rising wages in the formal-sector are associated with higher pay inthe informal sector. This seems to be the case in Indonesia: the coefficient of the Kaitz indexin a regression of informal-sector earnings on the Kaitz index is consistently positive andsignificant (results obtained by fixed effects available upon request).
23
Table 6: Total employment and unemployment
total males femalesemployment unemplym. employment unemplym. employment unemplym.
All models are estimated as SUR fixed effects panel.
Standard errors in brackets; *** p<0.01, ** p<0.05, * p<0.1.
24
5 Conclusions
There is considerable controversy over the impact of minimum-wage legislation on employ-ment in both developed and developing countries. Empirical evidence available to date fora variety of countries points towards a relatively mild, if at all significant, disemploymenteffect. The case of Indonesia is interesting, because the decentralization of minimum-wagesetting to the provinces in 2001 offers the opportunity to revisit this topic. Also, the Indone-sian minimum wage is very high, even in comparison with OECD countries, at about 65% ofthe median wage in 2004, which suggests that its disemployment effect might be potentiallystrong.
The panel methodology used in this paper improves upon the empirical literature byrecognizing the complexities of labour-market dynamics in a dual economy, such as Indone-sia, where the impact of the minimum wage on employment is affected by the pervasivenessof informality. According to the definition used in this paper, over 70% of employment isconsidered informal. We address this issue by correcting for contemporaneous correlationsamong the residuals of the labour-market outcome equations. Another contribution of thepaper is its focus on local, rather than provincial, governments as the units of observation.This is useful not only for exploiting a much richer source of variations in the data, but alsoto adress the endogeneity of the minimum wage at the provincial level.
The main findings reported in the paper - that minimum-wage hikes destroy formal-sectorjobs, but that these job losses are more than compensated for by the expansion of the informalsector - suggests that minimum-wage legislation is hurting, instead of protecting, vulnerableworkers. Its use as social protection and income redistribution instruments can thereforebe called into question. A policy recommendation that arises from the empirical analysisis that further increases in the minimum wage could be capped so as not to exceed labourproductivity gains. This, or, if it were possible, a gradual reduction over time would help toalleviate the adverse employment impact of such a high minimum wage (in relation to themedian) and to facilitate formalization in the labour market.
25
References
Alatas, V. and L. Cameron (2003), “The Impact of Minimum Wages on Employment ina Low Income Country: an Evaluation using the Difference-in-Differences Approach”, PolicyResearch Working Paper Series No. 2985, The World Bank.
Addison, J. and M. Blackburn (1999), “Minimum wages and poverty”, Industrial andLabour Relations Review, Vol. 52, No. 3. pp. 393-409.
Bazen, S. and V. Marimoutou (2002), “Looking for a Needle in a Haystack? A Re exam-ination of the Time Series Relationship between Teenage Employment and Minimum Wagesin the United States”, Oxford Bulletin of Economics and Statistics, Vol. 64 Issue supplement,pp. 699-725.
Bazen, S. and N. Skourias (1997), “Is There a Negative Effect of Minimum Wages inFrance?”, European Economic Review, No. 41, pp. 723-732.
Bell, L.A. (1997), “The Impact of Minimum Wage in Mexico and Colombia”, Journal ofLabour Economics, Vol. 15, No. 3, pt. 2.
Bird, K. and C. Manning (2002), “Impact of Minimum Wage Policy on Employment andEarnings in the Informal Sector: the case of Indonesia”, mimeo.
Bosch, M. and M. Manacorda (2007), “Inequality and Minimum Wages in Mexico”, Lon-don School of Economics, mimeo.
Brown, C., C. Gilroy and A. Kohen (1982), “The Effect of the Minimum Wage on Em-ployment and Unemployment”, Journal of Economic Literature, Vol. 2, pp. 487-528.
Brown, C. (1999), “Minimum Wages, Employment, and the Distribution of Income”, inO. Ashenfelter and D. Card (eds.), Handbook of Labour Economics, Vol. 3, pp. 2101-63.
Burkhauser, R., K. Couch and D. Wittenburg (2000), “A Reassessment of the New Eco-nomics of the Minimum Wage Literature with Monthly Data from the Current PopulationSurvey”, Journal of Labour Economics, Vol. 18, No. 4, pp. 653-680.
Card, D. (1992), “Using Regional Variation in Wages to Measure the Effects of the Fed-eral Minimum Wage”, Industrial and Labour Relations Review, Vol. 1, pp. 38-54.
26
Card, D. and A. Krueger (1995), “Myth and Measurement: The New Economics of theMinimum Wage”, Princeton University Press, Princeton, N.J.
Kenneth, A. and D. Wittenburg (2001), “The Response of Hours of Work to Increases inthe Minimum Wage”, Southern Economic Journal, Vol. 68, No. 1, pp. 171-177.
Currie, J. and B. Fallick (1996), “The Minimum Wage and the Employment of Youth:Evidence from the NLSY”, Journal of Human Resources, pp. 404-428.
Dickens, R., S. Machin and A. Manning (1999), “The Effects of Minimum Wages on Em-ployment: Theory and Evidence from Britain”, Journal of Labour Economics, University ofChicago Press, Vol. 17(1), pp. 1-22.
Dolado, J., F. Kramarz, S. Machin, A. Manning, D. Margolis and C. Teulings (1996),“The Economic Impact of Minimum Wages in Europe”, Economic Policy, Vol. 11, pp. 317-72.
Duflo, E. (2001), “Schooling and Labour Market Consequences of School Construction inIndonesia: Evidence from an Unusual Policy Experiment”, American Economic Review, Vol.91, pp. 795-813.
El Hamidi, F. and K. Terrell (2002), “The Impact of Minimum Wages on Wage Inequalityand Employment in the Formal and Informal Sector in Costa Rica”, in Inequality around theWorld, by R. Freeman (ed.), New York, Palgrave McMillan, pp. 188-203.
Fairris, D., G. Popli and E. Zepeda (2005), “Minimum Wages and the Wage Structure inMexico”, University of California, Riverside, mimeo.
Foguel, M., L. Ramos and F. Carneiro (2001), “The Impacts of the Minimum Wage onthe Labour Market, Poverty and Fiscal Budget in Brazil”, IPEA Working Paper No. 739.
Gindling, T. and K. Terrell (1995), “The Nature of Minimum Wages and their Effective-ness as a Wage Floor in Costa Rica, 1976 1991”, World Development, Elsevier, Vol. 23(8),pp. 1439 1458.
Gindling, T. and K. Terrell (2005), “The Effect of Minimum Wages on Actual Wages inFormal and Informal Sectors in Costa Rica”, World Development, Elsevier, Vol. 33(11), pp.
27
1905-1921.
Gindling, T. and K. Terrell (2007), “The Effects of Multiple Minimum Wages throughoutthe Labour Market: The case of Costa Rica”, Labour Economics, Elsevier, Vol. 14(3), pp.485-511.
Gramlich, E.M. (1976), “Impact of Minimum Wages on Other Wages, Employment, andFamily Incomes”, Brookings Papers on Economic Activity, Vol. 2, pp. 409-451.
Grossberg, A. and P. Sicilian (2004), “Legal Minimum Wages and Employment Dura-tion”, Southern Economic Journal, Vol. 70, No. 3, pp. 631-645.
Islam, I. and S. Nazara (2000), “Minimum Wage and the Welfare of Indonesian Workers”,Occasional Discussion Papers, ILO Jakarta Office.
Kristensen, N. and W. Cunningham (2006), “Do Minimum Wages in Latin America andthe Caribbean Matter? Evidence from 19 Countries”, World Bank Policy Research WorkingPaper No. 3870.
Lemos, S. (2006), “A Survey of the Effects of the Minimum Wage on Prices”, DiscussionPapers in Economics 06/9, Department of Economics, University of Leicester.
Maloney, W. and J. Nunez (2004), “Minimum Wages in Latin America”, in Law andEmployment: Lessons from Latin America and the Caribbean, by J. Heckman and C. PagEs(eds.), Cambridge, MA.
Mincer, J. (1976), “Unemployment Effects of Minimum Wages”, Journal of Political Econ-omy, Vol. 84, S87-S104.
Neumark, D. and W. Wascher (1992), “Employment Effects of Minimum and Sub min-imum Wages: Panel Data in State Minimum Wage Laws”, Industrial and Labour RelationsReview, October, pp. 55-81.
Neumark, D. and W. Wascher (2001), “Minimum Wages and Training Revisited”, Journalof Labour Economics, Vol. 19, No. 3, pp. 563-595.
Neumark, D. and W. Wascher (2004), “Minimum Wages, Labour Market Institutions,and Youth Employment: A Cross National Analysis”, Industrial and Labour Relations Re-
28
view, Vol. 57(2), pp. 223-248.
Neumark, D. and W. Wascher (2004), “Minimum Wages, Labour Market Institutions,and Youth Employment: A Cross National Analysis”, Industrial and Labour Relations Re-view, Vol. 57, No. 2, pp. 223-248.
Maloney, T. (1995), “Does the Adult Minimum Wage Affect Employment and Unemploy-ment in New Zealand”, NZ Economic Papers, Vol. 29(1), pp. 1-19.
Simon, K. and R. Kaestner (2004), “Do Minimum Wages Affect Non Wage Job Attributes?Evidence on Fringe Benefits”, Industrial and Labour Relations Review, Vol. 58, No. 1. pp.52-70.
Neri, M., G. Gonzaga and J.M. Camargo (2001), “Salario Mınimo, Efeito Farol e Po-breza”, Revista de Economia Polıtica, Vol. 21(2).
OECD (2008), Economic Assessment of Indonesia, OECD, Paris.
Rama, M. (2001), “The Consequences of Doubling the Minimum Wage”, Industrial andLabour Relations Review, Vol. 54, No. 4.
Rebitzer, J. and L.Taylor (1995), “The Consequences of Minimum Wage Laws: SomeNew Theoretical Ideas”, Journal of Public Economics, Vol. 56, pp. 245-55.
SMERU Report (2001), “Wage and Employment Effects of Minimum Wage Policy in theIndonesian Urban Labour Market”.
Stigler, G. (1946), “The Economics of Minimum Wage Legislation”, American EconomicReview, Vol. 36, pp. 358-365.
Suryahadi, A., W. Widyanti, D. Perwira and S. Sumarto (2003), “Minimum Wage Policyand its Impact on Employment in the Urban Formal Sector”, Bulletin of Indonesian Eco-nomic Studies, Vol. 39, pp. 29-50.
Zellner, A. (1962), “An Efficient Method of Estimating Seemingly Unrelated Regressionsand Tests for Aggregation Bias”, Journal of the American Statistical Association, Vol. 57,pp. 348-368.
29
Welch, F. (1976), “Minimum Wage Legislation in the United States”, in Evaluating theLabour Market Effects of Social Programmes, by O. Ashenfelter and J. Blum (eds.), PrincetonUniversity Press.
Widartu, D. (2006), “The Role of minimum Wage in Informal wage Determination inIndonesia”, ILO paper.
30
Appendix
Table A1: Informality, formality and unemployment, alternative definition of informality.