40
How integrated is modern Britain?

How integrated is modern Britain?

2
Ho
w in
tegrated
is mo
dern
Britain

1
Welcome from the Chair
Executive Summary
The context for the Commission: why does social integration matter?
How integrated is modern Britain?
Overall level of social integration in Britain
- How integrated are we by social grade?
- How integrated are we by ethnicity?
- How integrated are we by Age?
- How does London compare with the rest of Britain – is it a ‘melting pot’?
What next?
How can you get involved?
Appendix 1
Appendix 2
Our partners
References
Contents
3
4
10
12
14
14
17
24
25
30
30
31
33
34
36

2
Ho
w in
tegrated
is mo
dern
Britain

3
I am delighted and excited to be Chair of the Social Integration Commission.
As a sociologist I am fascinated to find out more about how and why we do and don’t mix with people different to ourselves. The UK is becoming increasingly diverse in terms of social grade, ethnicity and age. However, there is little understanding about the extent to which members of such a diverse society interact with each other. Previous research has shown us where different groups of people live, but not examined the degree to which they socially interact with others who are different in terms of social grade, ethnicity and age.
As a progressive I believe we should see integration as a social good which we should take active steps to promote both as individuals and as a society. Although this reflects my values it turns out that there is good objective evidence for the benefits of integration.
As a policy analyst I know how challenging it is to get policy right in an area which feels largely to be the domain of people’s voluntary, even ‘natural’, choices. Do too little and we could drift into segregation, be too heavy handed and we could cause a backlash against social engineering.
Over the course of its work the Commission will look at three key questions about social integration in Britain:
1. How integrated is modern Britain? The Commission will investigate the extent to which people in Britain interact with others who are different from themselves in relation to age, ethnicity and social grade.
2. Does integration matter? The Commission will assess the financial and social benefits or costs associated with different levels of social integration. It will seek to understand whether a lack of social interaction across lines of social grade, ethnicity or age has a significant effect on our society or our economy.
3. Can levels of integration be altered? Finally, the Commission will explore whether levels of social integration can be changed, and will look to provide recommendations for policy-makers, employers and individuals who wish to increase levels of social integration.
This report is the first that we will publish. It answers our first question: ‘How integrated is modern Britain?’ We hope that it will be the start of an important debate about the nature of the country we live in today.
We welcome your thoughts, so please sign up for updates on the Commission’s work, and keep in touch with us via Twitter and Facebook.
I would like to thank the Secretariat at The Challenge for their work, and in particular, Afua Kudom, Jon Yates, Mark Rusling and Rosie Evans.
Matthew Taylor,Chair, Social Integration Commission
Welcome from the Chair

4
5
“Sharing our common experiences and talking togetherwill dispel stereotypes and suspicions”
Stephen Burke, Co-founder, United for All Ages

6
Ho
w in
tegrated
is mo
dern
Britain
Executive Summary
In this report, we explore the extent of social integration within modern Britain. A recent study discovered that British people are 24 per cent more likely to go out of their way to help a stranger than citizens of other industrial nations, that volunteering is on the increase, and that we have emerged from the recession with some of the strongest social bonds in the developed world.1 All of this is very positive news. Yet is modern Britain as socially integrated as it could be?
As the UK becomes increasingly diverse in terms of social grade, ethnicity and age, we believe that more research needs to be done on the extent of social integration in Britain. Researchers have suggested that increasing the number of meaningful social interactions between people who are different could lead to many positive outcomes for society, including increased levels of trust between people, better health outcomes, less social isolation and better outcomes for job seekers.2,3,4,5 We will explore these outcomes in detail in our second report.
In this report we have chosen to examine social integration particularly in relation to social grade, ethnicity and age. We accept that there are other important ways in which we are diverse which we have not been able to include in this report. We chose to look at social grade,ethnicity and age in particular because we are all defined by these groupings, and these groupings are large and distinct, and the diversity within them is increasing.
Why does social integration matter?
Gaining an understanding of social integration is increasingly important for four reasons:
1. First, we lack a clear understanding of current levels of social integrationin Britain. Most of the existing research on integration has focused on where different groups of people live, rather than on how they interact within those areas.6 Previous research and policy has also predominantly focused on ethnic minority groups and especially immigrants.7 What is missing is a clear picture of the level of social interaction between all groups of people by social grade, ethnicity and age.
2. Secondly, Britain is becoming increasingly diverse by social grade, ethnicityand age. For example, the proportion of British residents who are members of an ethnic minority group is projected to rise to 38 per cent by 2050 (an increase from 16 per cent in mid-2012).8 This development means that any existing lack of integration across these lines will impact increasingly large numbers of people.
3. Thirdly, structural and institutional segregation shows signs of increasing.Residential segregation between British white and other ethnic groups appears to be increasing, and the OECD rated our school system as the fourth most socially segregated for recent migrants.9,10
4. Fourthly, a lack of social integration is likely to make it harder to address thevarious challenges that modern Britain faces. These challenges include long-term unemployment, blocked opportunities/access to talent, social isolation and a lack of community wellbeing.11,12,13,14
7
Key report findings and insights
Our research has found that the average Briton has fewer social interactions with people who are different to them than if there was no social segregation by social grade, ethnicity and age. The average Briton is 14 per cent less integrated by social grade, 48 per cent less integrated by ethnicity and 42 per cent by less integrated by age than would be expected if there was no social segregation.15
Based on our findings:
1. Highly diverse areas are not necessarily integrated. For example, despitesocialising more with people of different ethnic groups, Londoners are proportionally less integrated by social grade, ethnicity and age than the rest of Britain. We should be active in promoting better integration across all of these measures.
2. Integration issues apply to everyone, not just to ethnic minorities. Apartfrom those from mixed ethnic backgrounds, all ethnic groups have around 40 to 50 percent fewer social interactions than would occur if there was no social segregation.
3. Levels of integration are structured around institutions that we use and value.Age group 18-34, where there are high levels of mobility or involvement in institutions of further and higher education, is the most ethnically integrated age group. However, levels of segregation rise from 35 per cent to 56 per cent for those aged 35 to 54 years.
4. Young people are segregated by ethnicity. Young people under 17 years old have 53 per cent fewer interactions with other ethnicities than would be expected if there was no social segregation. This raises questions around what more could be done in the education system to promote social integration.5. There is a disconnect between employers and those looking for work or
seeking to progress in their careers. Those in social grade A have 66 per cent fewer social interactions with those who are unemployed than would be expected if there was no social segregation. This gap is greater than that between any ethnic group and the rest of the population. This raises significant questions about how social integration may affect access to work when around 40 per cent of jobs are found through personal contacts.16
In our next report, we will explore the extent to which this lack of integration matters. We will assess the financial and social benefits or costs of different levels of social integration.
KEY TERMS
The extent to which people in Britain interact with others who are different to themselves in relation to age, social grade, ethnicity and age.
Ways that people are different from each other. Although there are many ways that people are diverse in the UK, in this report we specifically refer to diversity along lines of social grade, ethnicity and age.
Social Integration
Diversity

8

9
“The media coverage of integration ricochetsfrom scaremongering to complete assent butrarely do we have a planned, considered andinformed debate on integration”
June O’Sullivan, CEO, London Early Years Foundation

10
Ho
w in
tegrated
is mo
dern
Britain
The context for the Commission:why does social integration matter?
Gaining an understanding of the level of social integration in Britain is increasingly important for a number of reasons.
First, we lack a comprehensive understanding of the present situation. Work by academics and think tanks has given us a strong understanding of the extent of residential segregation in the UK. Recent work by Dr Gemma Catney (University of Liverpool) and the Centre on the Dynamics of Ethnicity has demonstrated that - across England and Wales - residential segregation between all ethnic groups has decreased apart from for the white British population, “for which many districts have seen a slight increase.” 17 Further research has indicated that the UK may be becoming more residentially segregated by age and social grade.18 This existing research has really helped us understand where different groups of people live. However, we also need to understand whether different groups of people within those areas really interact with each other in a meaningful way.
As well as a focus on geographic mixing, research to date has largely focused on whether we are integrated by ethnicity, and in particular how well recent immigrants are integrating, rather than looking at the overall picture of social integration in any given area.19 So what is missing is a clear picture of the level of social interaction between people when age and social grade are taken into account as well as ethnicity. Social psychologists have previously demonstrated that ‘meaningful’ social interactions across lines of difference have a significant impact on breaking down stereotypes, reducing prejudice and increasing trust.20 In this context, ‘meaningful’ interactions are those which go beyond a short transactional interaction (for example, sitting on the same bus) to those that engage participants in a shared positive activity where participants feel they have equal status (for example regular conversations at the school gates, playing football together etc.).21
Secondly, Britain is becoming increasingly diverse by social grade, ethnicity and age. Using data for the UK, we know that:
• In the next 10 to 15 years, the proportion of the UK’s population under 18 or over 60 years old is projected to rise from 42 to 47 per cent.22
• The proportion of British residents who are members of a minority ethnic group is projected to rise to around 38 per cent by 2050 (16 per cent in mid-2012).23
• The income gap between the richest and poorest members of society will widen if trends follow the pattern of the last 40 years. 24

11
Please note that the Commission is stating the existence of certain trends according to established research, and not on the potential interpretations of these results.
These changes mean that any existing lack of integration across lines of social grade, ethnicity or age will divide increasingly large numbers of people.
Thirdly, structural and institutional segregation shows signs of increasing. In addition to increasing residential segregation by ethnicity, our local neighbourhoods are becoming increasingly age segregated.25 The British educational system shows signs of social segregation by social grade and ethnicity. Half of all children on free school meals are educated in 20 per cent of schools, while the OECD rated our school system as the fourth most segregated for recent migrants.26,27
Fourthly, a lack of social integration is likely to make it harder to address the various social and economic challenges that modern Britain faces. These are challenges that affect all of us. In particular, there are four areas where existing research suggests that a lack of connection between people from different backgrounds has made some of our key national challenges harder to solve:
• Long-term unemployment: Lack of contacts with those in work makes unemployment and insecure employment last longer.28
• Blocked opportunities: Lack of broader networks makes it harder for employers to recruit the right talent, and for people with specific skills to find the right jobs. This in turn reduces labour productivity.29
• Social isolation: Lack of friendships across age and social grades increases isolation, particularly amongst both elderly and vulnerable adults.30
• Community wellbeing: Social segregation in communities increases anxiety and ill- health. More effective social integration leads to increased life expectancy, better recovery times from health issues and fewer mental health issues.31
We will be exploring these four areas in detail in the second phase of the Commission.
These four factors demonstrate the importance of answering three key questions about modern Britain:
Question 1: How integrated is modern Britain? Question 2: Does integration matter? Question 3: Can levels of integration be altered?

12
Ho
w in
tegrated
is mo
dern
Britain
How integrated is modern Britain?
This section of the report details our findings on the extent of social integration within modern Britain.
How the information was gathered and calculated
Our findings are based on a nationwide survey conducted by Ipsos MORI of 4,269 people aged 13-80 years old.
Our measure shows how far people’s interactions reflect the social demographics of their local region. In order to do this, we measured two things: the make-up of people’s social interactions by social grade, ethnicity and age, and the make up by social grade, ethnicity and age of each region in Britain.
From the survey data, we identified the proportion of social interactions which cut across lines of age, social grade and ethnicity (‘actual interactions’). We then compared this with the proportion of interactions you would expect to cut across this line if age, ethnicity and social grade were irrelevant to the interactions (‘potential interactions’). We then divided the actual interactions by the potential interactions, and subtracted this number from 100 per cent to give the percentage value for the levels of integration compared to no segregation (‘Integration index’)
For example, a white respondent lives in an area where 40 per cent of people are from non-white ethnic groups. If there was no social segregation, you would expect 40 per cent of their interactions would be with people who are non-white. If we found that 30 per cent of this respondent’s interactions were with people from non-white ethnic groups, we would then state that they had 25 per cent fewer interactions (a score of -25 per cent) with people of a different ethnicity than you would expect if ethnicity was irrelevant.32
Using this scale, the more negative the score, the less integrated the group is; -50 per cent would mean you have 50 per cent fewer interactions than would be expected if there was no social segregation. Conversely, a highly positive score would indicate a greater than expected proportion of interactions with a specific group, i.e. representing a bias towards a certain group. A score of zero would indicate perfect integration. For technical detail on how the Integration index was calculated, please see Appendix 1.33

13Figure 1: The scale for measuring social Integration
100% 0%Fully segregated
Fully integrated
Integration index = 100% - (Percentage of current interactions with those from different backgrounds)
(Percetage of expected interactions with those from different backgrounds)

14
Ho
w in
tegrated
is mo
dern
Britain
The average Briton is 14 per cent less integrated by social grade, 48 per cent less integrated by ethnicity and 42 per cent by less integrated by age than would be expected if there was no social segregation.34
How integrated are we by social grade?
The average person living in Britain has 14 per cent fewer interactions with people of different social grades than would be expected if there was no social segregation. Some social grades are more segregated than others.
Overall, social grades A and B are the least integrated, with 19 per cent fewer social interactions with those of other social grades than if there was no social segregation, closely followed by social grade D, with 17 per cent fewer.
However, the gap between employers (disproportionately found in social grade A) and the unemployed is greater than that of any ethnic group with the rest of the population.
The graph (Figure 3, below), shows the social grades of the people that those from social grade A interact with. Those from a higher socio-economic background are disproportionately interacting with those who are from the same social grade (or the one immediately below them). They are less socially integrated with those from lower socio-economic backgrounds – especially with those who are unemployed. Those in social grade A (managerial profession) have 66 per cent fewer social interactions with those who are unemployed than would be expected if there was no social segregation.
This limited level of social integration of social group A suggests that there may be significant gaps within their networks. This may hinder the ability of employers to access a wide talent pool and may also limit access to jobs for people from lower social grades. This also raises significant questions about how social integration may affect access to work in a nation where around 40 per cent of jobs are found through personal contacts, and whether the solidarity required to support the welfare state can be maintained.35,36
Overall level of social integration in Britain
KEY FINDING
Those in social grade A have 66 per cent fewer social interactions with those who are unemployed than would be expected if there was no social segregation. This raises significant questions about how social integration may affect access to work when around 40 per cent of jobs are found through personal contacts.

15
0
Intermediate (C1C2)
Managerial Profession (AB)
Enemployed (E)
Routine Manual (D)
All
Figure 2: Level of social grade integration by different social grades
Per cent indicates level of reduced interactions between people compared to nosocial segregation.
-10%
Figure 3: Social Grade of individuals that social grade A interact with
Per cent indicates A’s interactions with different social grades compared to no social segregation.
0
-12% -17% -19% -14%
-66%
-49%
38%
32%
Unemployed
Routine Manual
Intermediate
Managerial Profession

16
Ho
w in
tegrated
is mo
dern
Britain
How does integration by social grade vary between ethnicities?
The level of social integration between social grades remains broadly the same across all ethnic groups. The largest difference in integration scores are between those of Asian and white backgrounds in social grade C1C2. This is because those from a white ethnic background in social grade C1C2 tend to be more integrated than for other social grades.
Figure 4: Level of social grade integration by different ethnicities
Per cent indicates level of reduced interactions between people compared to nosocial segregation.
Note: Includes family connections.
Asian
White
-16%
-16%
-20%
-9%
-18%
-20%
-18%
-14%
DE
C1C2
AB
ALL

17
-11%-40% -43% -50% -48%
How integrated are we by ethnicity?
When excluding family interactions, the average Briton has 48 per cent fewer interactions with people of different ethnicities than would be expected if ethnicity was irrelevant. Apart from the mixed ethnic group, all ethnic groups have around 40 to 50 per cent fewer social interactions with others than would occur if there was no segregation.
KEY FINDING
Integration issues apply to everyone, not just to ethnic minorities. Apart from those from mixed ethnic backgrounds, all ethnic groups have around 40 to 50 per cent fewer social interactions with others than would occur if there was no segregation.
White
Total
Asian
Mixed
Black
Figure 5: Level of ethnic integration by different ethnicities
Per cent indicates level of reduced interactions between people compared to nosocial segregation.
Note: Figures exclude family interactions

18
“Transforming our communities into places of hope,cooperation and mutual care, where people of differentbackgrounds come together and work together for theircommunities, must be a priority”
Liz Carnelley, Near Neighbours

19

20
Ho
w in
tegrated
is mo
dern
Britain
How does integration by ethnicity vary between age groups?
The level of ethnic integration varies by age group. In general, people in older age groups are less integrated by ethnicity than if there was no social segregation.
However, young people under 17 years old have fewer interactions with other ethnic groups than people aged 18-34 do. In fact the under 17’s have half of the interactions with other ethnic groups than would be expected if there was no social segregation by ethnicity. Even when excluding family interactions, young people under 17 years old still have fewer interactions than expected compared to people aged 18-34.
This raises questions around our school system as who young people associate with at school is likely to influence the development of social networks, and any restriction could eventually decrease future employment opportunities. Also, although many schools in diverse areas may have an ethnically mixed student population, this does not necessarily equate to higher levels of ethnic integration.37
However, those aged 18-34 are the most ethnically integrated age group, with between 30 and 35 per cent fewer interactions with those of different ethnicities than would be expected. This age group are more likely to attend further and higher educational institutions, and are highly mobile.38
The inclusion of family interactions decreases the levels of integration for under 17s and those aged 35-54 years, showing that family relationships are important in determining how integrated these age groups are by ethnicity. Those who are older are also progressively less integrated. As the data was collected at one specific point in time, it is unclear whether these findings reflect specific age cohorts and will therefore change over time, or whether they show a pattern associated with the process of ageing. If the first of these options is true, levels of integration would change in society as previously generally held perceptions were challenged. If the second of these options were true, one possible reason for the levels of integration for under 17s and those aged 35-54 years could be that people become increasingly selective about where they settle within the areas that they live.39
KEY FINDING
Young people are segregated by ethnicity. Young people under 17 years old have 53 per cent fewer interactions with other ethnicities than would be expected if there was no social segregation. This raises questions around what more could be done in the education system to promote social integration.

21
65+
55-64
35-54
18-34
Excluding Family
Including Family
Figure 6: Level of ethnic integration by different ages
Per cent indicates level of reduced interactions between people compared to nosocial segregation.
-81%
-73%
-64%
-63%
-31%
-35%
-53%
KEY FINDING
Levels of integration are structured around institutions that we use and value. Age group 18-34, where there are high levels of mobility or involvement in further and higher education, is the most ethnically integrated age group. However, levels of segregation rise from 35 per cent to 56 per cent for those aged 35 to 54 years.
How does integration by ethnicity vary between social grades?
Those from social grade C1C2 are the least integrated by ethnicity. The level of integration by ethnicity does not vary dramatically between social grades A and B, and social grades D and E.
C1C2
AB
DE
Figure 7: Level of Ethnic Integration between social grades
Per cent indicates level of reduced interactions between people compared to nosocial segregation.
-43%-57%-40%
-45%
-56%
-36%<17

22
23
“For the last ten years, I have been involved in projectsdesigned to build stronger communities… The mostmeaningful projects have been those that have broughttogether a diverse group of people of different ages anddifferent experiences”
Becky Booth, programmes director, Spice
24
Ho
w in
tegrated
is mo
dern
Britain
How integrated are we by age?
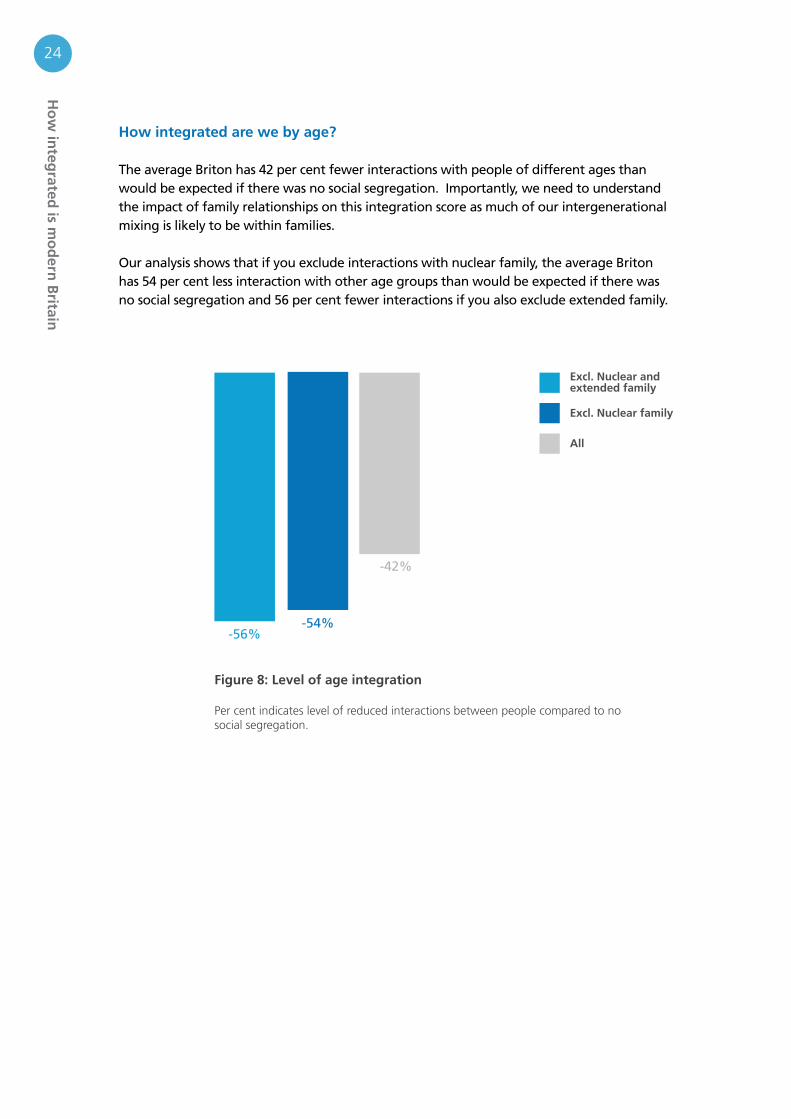
The average Briton has 42 per cent fewer interactions with people of different ages than would be expected if there was no social segregation. Importantly, we need to understand the impact of family relationships on this integration score as much of our intergenerational mixing is likely to be within families.
Our analysis shows that if you exclude interactions with nuclear family, the average Briton has 54 per cent less interaction with other age groups than would be expected if there was no social segregation and 56 per cent fewer interactions if you also exclude extended family.
Excl. Nuclear and extended family
Excl. Nuclear family
All
Figure 8: Level of age integration
Per cent indicates level of reduced interactions between people compared to nosocial segregation.
-56%-54%
-42%
25
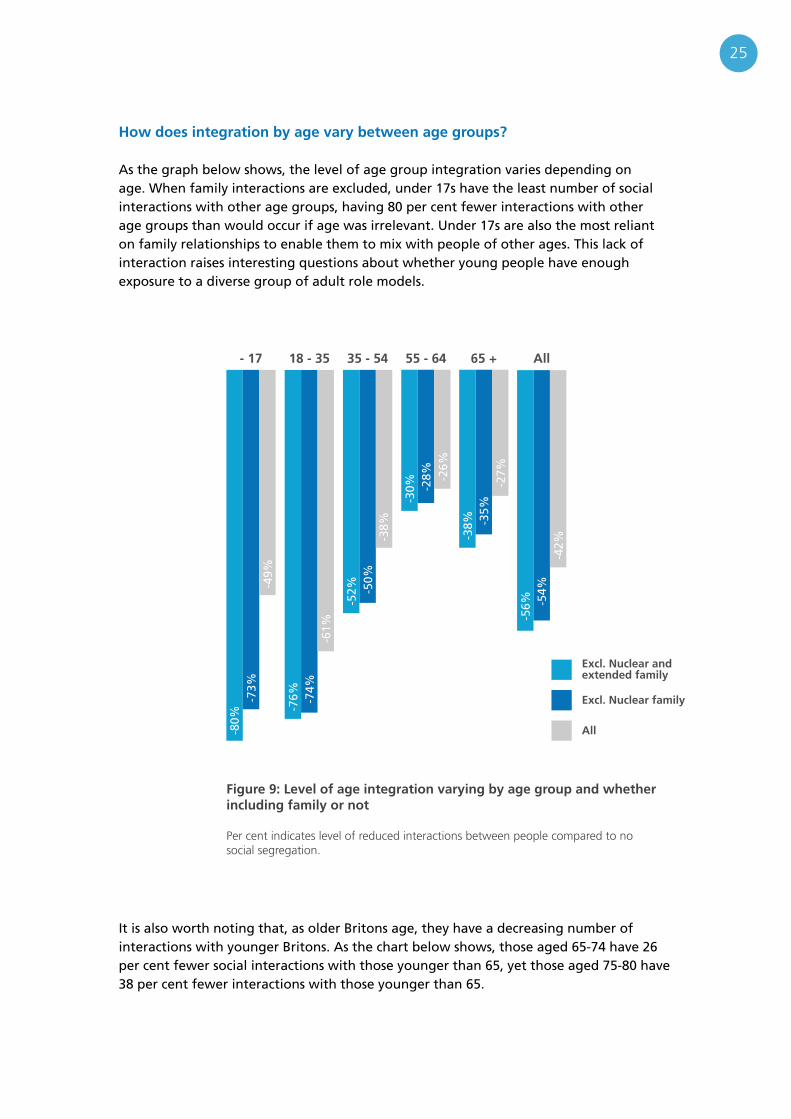
How does integration by age vary between age groups?
As the graph below shows, the level of age group integration varies depending on age. When family interactions are excluded, under 17s have the least number of social interactions with other age groups, having 80 per cent fewer interactions with other age groups than would occur if age was irrelevant. Under 17s are also the most reliant on family relationships to enable them to mix with people of other ages. This lack of interaction raises interesting questions about whether young people have enough exposure to a diverse group of adult role models.
It is also worth noting that, as older Britons age, they have a decreasing number of interactions with younger Britons. As the chart below shows, those aged 65-74 have 26 per cent fewer social interactions with those younger than 65, yet those aged 75-80 have 38 per cent fewer interactions with those younger than 65.
All65 +55 - 6435 - 5418 - 35- 17
Excl. Nuclear and extended family
Excl. Nuclear family
All
Figure 9: Level of age integration varying by age group and whether including family or not
Per cent indicates level of reduced interactions between people compared to nosocial segregation.
-80%
-73%
-49%
-76% -7
4%-6
1%
-52% -5
0%-3
8%
-30% -2
8% -26%
-38% -3
5%-2
7%
-56% -5
4%-4
2%

26
Ho
w in
tegrated
is mo
dern
Britain
Figure 10: Level of age Integration with under 65s by 65-74 year olds and 75-80 year olds
Per cent indicates level of reduced interactions between people compared to no social segregation
65 -74
75 - 80
-38% -26%

27
How does London compare with the rest of Britain – is it a ‘melting pot’?
London is a highly diverse city, often referred to as a ‘melting pot’ of different people. However, our research found that Londoners are less integrated by social grade, ethnicity and age than the rest of the Britain, when taking into account the amount of potential interactions.
Our research shows that those living in London have a greater total number of interactions with people who are ethnically different from them. Yet those interactions are proportionally less representative of the diversity of the area Londoners live in compared to the interactions of those outside London. So, for whatever reason, potential interactions with those from different ethnic backgrounds are not being fully taken up.
The experiences of those in London can help us to understand the relationship between diversity and integration as London is more diverse by ethnicity and income.40 Our research indicates that we cannot assume Britain will automatically become integrated as it becomes more diverse, and so active policy to promote better integration will continue to be required.
How integrated is London by age?
By age, London is 1.3 per cent less integrated overall than the rest of Britain. People aged 18-34 in London have a lack of interaction with other age groups. This may be linked to the greater mobility of this age group. In 2012 there was a net migration to London of nearly 40,000 people aged 20 to 29.41
All
65+
55-64
35-54
18-34
-17
Figure 11: Level of age integration across age groups for London and rest of Britain
Per cent indicates level of reduced interactions between people compared to nosocial segregation.
Note: Dotted bar designates values which are indicative due to relatively low sample sizes.
-42%
-43%
-27%
-29%
-27%
-22%
-38%
-36%
-49%
-29%
-60%
-66%
Rest of Britain
London

28
Ho
w in
tegrated
is mo
dern
Britain
Figure 12: Level of ethnic integration across ethnicities for London and rest of Britain
Per cent indicates level of reduced interactions between people compared to nosocial segregation.
Note: Figures exclude family interactions; Dotted bar designates values which are indicative due to relatively low sample sizes.
Yet in contrast to this finding, our research may indicate that under 17s in London are better connected with people of different ages than under 17s are in the rest of Britain. This finding could point to conditions which have ensured that young people are more integrated in areas of high diversity.42
How integrated is London by ethnicity?
London is less ethnically integrated than the rest of Britain. Our research shows that although people in London have a higher total number of interactions with other ethnic groups, those interactions are proportionally less representative of the diversity of the area Londoners live in compared to the interactions of those outside London. This lack of interaction with different ethnic groups is especially true for white Londoners.
It is notable that only Asians interact with other ethnicities more in London compared to outside London.
-47%
-55%
-32%
-49%
-46%
-38%-10%
-17%
-48%
-63%
Rest of Britain
London

29
How integrated is London by social grade?
Overall, London is 3.8 per cent less integrated by social grade than the rest of Britain. The difference between London and the rest of Britain is greatest for those is social grades C1 and C2. Those in social grade E are more integrated in London than the rest of Britain.
KEY FINDING
Highly diverse areas are not necessarily integrated. For example, despite socialising more with people of different ethnic groups, Londoners are less integrated by social grade, ethnicity and age than the rest of Britain. We should be active in promoting better integration across all of these measures.
Figure 13: Level of social grade integration for London and rest of Britain
Per cent indicates level of reduced interactions between people compared to nosocial segregation.
Note: Social grade E defined as unemployed only
-14%
-18%
-14%
-5%
-17%
-23%
-8%
-20%-19%
-17%
Rest of Britain
London
E C1C2 ABALL D

30
Ho
w in
tegrated
is mo
dern
Britain
What next?
In our next report, we will explore whether this lack of integration matters. We will bring together a range of academic research in order to assess the financial and social benefits and costs associated with different levels of social integration.
Over the next few months, we will also conduct further research to explore the extent of integration in the workplace and how this compares with integration outside of the work environment. We will look at this issue from both a nationwide perspective through an online survey, and on a company specific level using network analysis. This will help us to highlight the differences between diversity and integration, and how diversity affects cohesion.
The Commission will then explore whether levels of social integration can be changed, and will look to provide recommendations for policy-makers, employers and individuals who wish to increase levels of social integration.
The Social Integration Commission welcomes your thoughts, so please sign up for updates on our work, and keep in touch with us via Twitter and Facebook.
Why not take our quick online quiz to see how typically integrated people with the same characteristics as you are?
Do you work for an organisation which has experienced the impact of social integration on long term unemployment, blocked opportunities, social isolation or community wellbeing? We will be calling for submissions for our final report in January 2015.
Please contact [email protected] for further information.
How can you get involved?

31
Appendix 1
Detail on the survey
The survey asked respondents to think about the most recent social gathering they had attended. Respondents were then asked for the number of people who attended the gathering and the nature of their relationship with the five attendees (or fewer, if fewer than five attendees) they mixed with most. Respondents were asked to give the age, ethnicity and social background of these five (or fewer) attendees. The age, ethnicity and social grade of respondents was also collected.
The survey was conducted online between 17 and 28 January 2014. In total, 4,269 respondents took part in the survey: a nationally representative sample of people living in Britain aged 16-65 (3,004), and boost samples of people living in Britain aged 13-15 (225), 66-80 (540) and of Black and Minority Ethnic backgrounds (500)
Detail on Integration index calculation
Please note that our research does not compare Britain with other countries, nor does it compare the current level of social integration in Britain with historic trends. We would seek to carry out this research again in the future. Our research does not cover the impact of technology on social integration, as current research on this area is inconclusive and further work is required. The Integration index does not provide an explanation for why there may be fewer interactions than expected.
Many thanks to Professor Miles Hewstone, Dr Simon Lolliot, Dr Ralf Wölfer and Benjamin Fell from the Oxford Centre for the Study of Intergroup Conflict, Oxford University for their support in designing and analysing this research.
Our methodology was also shaped through consultation with leading experts in this field including: Dr Richard Harris from the School of Geographical Sciences, Bristol University; Kully Kaur-Ballagan, Research Director at Ipsos MORI Social Research Institute; Daniel Range from the Institute of Community Cohesion, Coventry University; and Dr Mark Tranmer, Senior Lecturer at the School of Social Sciences, Manchester University.

32
Ho
w in
tegrated
is mo
dern
Britain
Methodology for calculation
How the Integration index was calculated for social grade, ethnicity and age
Part One
1. From the data on the five people that the participants reported having had contact with at the social event, we:
a. Created a variable for the total number of ingroup interactions. To do this, we calculated the sum of reported contacts, recoding…
i. …each ingroup contact as 1.ii. …each outgroup contact as 0.iii. …missing values as 0.
b. Created another variable for the total number of outgroup interactions. To do this, we calculated the sum of reported contacts, recoding…
i. …each ingroup contact as 0ii. …each outgroup contact as 1iii. …missing values as 0.
c. Created a third variable representing the total number of connects the respondent reported at the event. We did this by adding the total number of ingroup connections (Step 1a) and total number of outgroup connections(Step 1b)
i. Range: 0 to 5d. Finally, we calculated the percentage of outgroup interactions. We did this by dividing the total number of outgroup connections (Step 1b) by the total number of connections (Step 1c) and multiplying this number by 100.
i. (Outgroup connections / total connections)*100
Part Two
2. We had data on which geographic region the respondent was located in. The regions were divided up as follows:
a. Londonb. Midlandsc. North & Yorkshired. North Weste. Scotlandf. South East & Anglia g. South West & Wales
3. From the Office for National Statistics (ONS) data and using the respondents’ geographic location (above), we:
a. …matched the number of people, by category of interest (i.e., ethnicity / age / social grade), who resided in the various geographic regions (from the ONS data), with the respondents’ data. For example,
i. Ethnicity: White, Mixed, Asian, Black, Otherii. Age: < 17 years old; 18-34 years old; 35-54 years old; 55-64 years old; 65+ years old. iii. Social Grade (SG): AB, C1/C2, DE

33
b. …calculated the percentage of people from the various sub-groups in the respondents’ geographic region.
i. (Sub-group of interest / Total number of people of that category in respondent’s region)*100ii. E.g., for social grade AB: (SGAB / Total number of people in respondent’s region)*100.
c. …calculated the total number of outgroupers of a certain sub-group (in percentage points) in the respondents’ geographic region given the respondents’ affiliation with a sub-group.
i. E.g., For Asian respondents, Step 3c would be: percentage of Whites in respondent’s geographic region + percentage of Blacks in respondent’s geographic region + percentage of Mixed race in respondent’s geographic region + percentage of Other in respondent’s geographic region.
Part Three
1. In the last step, we calculated the Integration index by…a. …taking the percentage of total outgroup connections the respondent reported at the social event (Step 1d) and dividing it by the percentage of outgroupers in the respondents’ geographic region (Step 3c).b. We multiplied this by 100 to get a percentage scorec. We subtracted 100 from this percentage score to get the final segregation index.
Appendix 2
Classification of social grade
NRS classification Occupations included in this specific analysis by
classification
Example
A Higher professional and managerial workers Work in a managerial or
professional job, such as an accountant or teacherB Lower managerial and
professional workers
C1 and C2 Intermediate occupations; Small employers and non professional self-employed; Lower supervisory and technical
Work in an intermediate job, such as a supervisor
D Semi-routine or routine occupations
Work in a routine or manual job, such as a shop assistant or builder
E Unemployed and actively seeking work
Unemployed

34
Ho
w in
tegrated
is mo
dern
Britain
The Commission would like to thank the following people for their continued involvement, ideasand guidance.
Chair and Commissioners:Our Commissioners have ultimate responsibility for directing the affairs of the Commission and ensuring the aims are achieved.
Matthew TaylorSir Anthony SeldonChristine McGourtyDan GuthrieDeborah Cadman OBEMary Macleod MPProfessor Miles HewstoneTrevor Phillips OBE
Working Groups:The Working Groups bring together a broad range of experienced organisations and highly talented individuals to challenge and to provide advice to the Commission.
Employers:Allianz (Kirsty Wardlaw, Marketing Development & CSR Executive)Bouygues UK (Martin Schulz, Director of Group Human Resources)British Gas (Bryan Halliday, Director of Corporate Responsibility)CIPD (Katerina Rudgiger, Head of Skills and Policy Campaigns)EY (Arun Batra, Director at EY and CEO of National Equality Standard)Federation of Small Businesses (Sue Terpilowski, London Policy Chair)Local Government Association (Sarah Messenger, Head of Workforce)National Express (Jack Kelly, Head of External Communications)NHS Employers (Mohamed Jogi, Equality and Diversity Consultant)Sky (Janine La Rosa, Diversity Manager)Starbucks (Simon Redfern, Director of UK Corporate Affairs)Thomson Reuters (Carl Clarke, Vice President of Human Resources)Weber Shandwick (Lisa Pantelli, Head of Employee Engagement & Change Management)Unison (Matthew Danaher, Community Organising Co-ordinator)
Delivery:City Year (Sophie Livingstone, CEO)Generating Genius (Tony Sewell, Founder and CEO)London Early Years Foundation (June O’Sullivan, CEO) Magic Me (Susan Langford, Director)Mosaic (Jonathan Freeman, National Director)Near Neighbours (Liz Carnelley, Programme Director)Shared Lives (Alex Fox, CEO)Spice (Becky Booth, CEO)Streetbank (Sam Stephens, CEO)
Our partners

35
Trussell Trust (Chris Mould, Executive Chairman)The Eden Project (Peter Stewart, Executive Director)The Good Gym (Ivo Gormley, Founder)The Met BPA (Janet Hills, Chair)
Policy:Beth Johnson Foundation (Steve Robinson, CEO)British Future (Matthew Rhodes, Director)Centre for Social Justice (Alex Burghart, Director)Centrepoint (Balbir Chatrik, Director of Policy and Participation)Civitas (Anastasia de Waal, Deputy Director)Demos (David Goodhart, Director)IPPR (Alice Sachrajda, Researcher)James Allen’s Girls School (Marion Gibbs CBE, Headmistress)Resolution Foundation (Matthew Whittaker, Senior Economist)Runnymede Trust (Omar Khan, Head of Policy Research)United for All Ages (Stephen Burke, Director)
Research partners:Ipsos MORI (Kully Kaur-Ballagan, Tom Frere-Smith)University of Oxford (Professor Miles Hewstone, Dr Simon Lolliot, Dr Ralf Wölfer, Benjamin Fell)
Sponsors:British GasThe Challenge
Special thanksAlan Hatton Yeo MBEHarriet BradleyMorgan BestwickWilliam Stuart-Lee

36
Ho
w in
tegrated
is mo
dern
Britain
References
1OECD, Better Life Index, 2014; Though this trend is contested. For example, see T. Clark and A. Heath, Hard Times: The Divisive Toll of the Economic Slump, Padtsow, 2014.2For example, see E. M. Uslaner, Segregation and Mistrust: Diversity, Isolation and Social Cohesion, Cambridge, 2012.3For example, see T. E. Seeman, ‘Social Ties and Health- The Benefits of Social Integration’, AEP, 6(5): 442-451, 1996.4For example, see A. Steptoe, A. Shankar, P. Demakakos, J. Wardle. Social isolation, loneliness, and all-cause mortality in older men and women”, Proc Natl Acad Sci U S A. 2013 Apr 9;110(15):5797-801.5For example, see L. Caparelli and K. Tatsiramos, ‘‘Friends’ Networks and Job Finding Rates’, ISER Working Paper Series 2011-21, 2011.6For example, see Dr Gemma Catney, ‘Has Neighbourhood ethnic social segregation decreased?’, Dynamics of Diversity: Evidence from the 2011 Census, February 2013.7Policy Exchange, ‘A Portrait of Modern Britain’, 2014.8Note that estimates vary: Migration Observatory; D. A. Coleman, ‘Projections of the ethnic minority populations of the United Kingdom 2006 – 2056.’ Population and Development Review 36 no. 3 (2010): 441- 486; Figure 7, p. 30, estimate 38 per cent by 2050; Policy Exchange, ‘A Portrait of Modern Britain’, 2014 estimate between 20 and 30 per cent by 2051.9Department for Education10OECD, ‘Education at a Glance’, 201211Over 830,000 people in the UK have been unemployed for longer than a year, and over 440,000 for 2 years or more: Office for National Statistics, ‘Labour Market Statistics’, Sept-Nov 2013, released Jan 2014, and people in the UK who are long term unemployed mostly have friends who are unemployed or in insecure jobs: L. Caparelli and K. Tatsiramos, ‘‘Friends’ Networks and Job Finding Rates’, ISER Working Paper Series 2011-21, 2011.12Labour productivity in the UK is currently 9 per cent less productive per hour than the OECD Euro-area and 12 per cent less productive than the G7: OECD, ‘Labour productivity levels in the total economy’, 2012; Recruiting through homogenous networks can lead to talent mismatches and cycles of segregated occupations: E. Bjarnegard, Gender, Informal Institutions and Political Recruitment, Palgrave Macmillan, 2013; S. Bentolila, C. Michelacci, J. Suarez, ‘Social Contacts and Occupational Choice’, Economica, Vol 77 (2010), Issue 305 (01), pp 20-45; S. Hanson, G. Pratt, ‘Job Search and the Occupational Segregation of Women’, Annals of the Association of American Geographers, Volume 81, Issue 2, 1991, pp. 229–253.131 in 5 older people in the UK are in contact with family, friends and neighbours less than once a week, and 1 in 10 less than once a month: Campaign to End Loneliness, 2011; Isolation (lack of integration) leads to higher rates of illness and mortality: J.C. Barefoot, et al., ‘Trust, health, and longevity’, Journal of Behavioral Medicine 21(6): 517–26, 1998.14The UK has significantly lower levels of trust compared to 50 years ago: J. F. Helliwell and S. Wang, ‘Trust and wellbeing.’, International Journal of Wellbeing, 1(1), 42-78, 2011.; However, social integration can lead to improved trust and well-being: E. M. Uslaner, Segregation and Mistrust: Diversity, Isolation and Social Cohesion, Cambridge, 2012. 15Social Grade E includes only those who are unemployed but looking for work.16Right Management Survey 2010, Manpower Group, reported in Forbes online: http://www.forbes.com/sites/susanadams/2011/06/07/networking-is-still-the-best-way-to-find-a-job-survey-says/; See also Y. M. Ioannides and L. D. Loury, ‘Job Information Networks, Neighbourhood Effects and Inequality’, Journal of Economic Literature, 1056-1093, 615, 2004, for an overview of various studies. Figures range 30 to 60 per cent depending on variables. 17 Quote taken from http://www.ethnicity.ac.uk/medialibrary/briefingsupdated/has-neighbourhood-ethnic-segregation-decreased.pdf. For more information on methodology and context see Dr Gemma Catney, ‘Has Neighbourhood ethnic social segregation decreased?’, Dynamics of Diversity: Evidence from the 2011 Census,February 201318Dorling, Vickers, Thomas, Pritchard and Ballas, ‘Changing UK: The way we live now’, December 2008.19For example see Policy Exchange, ‘A Portrait of Modern Britain’, 2014.20For example, see T. F. Pettigrew and L. R. Tropp (2000), ‘Does intergroup contact reduce prejudice? Recent meta-analytic findings’. In S.Oskamp (ed.) Reducing prejudice and discrimination. ‘The Claremont Symposium on Applied Social Psychology’ (pp. 93-114) Mahwah, NJ: Lawrence Erlbaum. 21G. W. Allport, ‘The Nature of Prejudice’, Cambridge, 1954.22Principal Projection of Population projections by the Office for National Statistics, 2012; 42 per cent in mid-2012, 47 per cent in mid-2037. 23Note that estimates vary: Migration Observatory; D. A. Coleman, ‘Projections of the ethnic minority populations of the United Kingdom 2006 – 2056.’, Population and Development Review 36 no. 3 (2010): 441- 486; Figure 7, p. 30, estimate 38 per cent by 2050; Policy Exchange, ‘A Portrait of Modern Britain’, 2014 estimate between 20 and 30 per cent by 2051.24IFS report figure 3.7 http://www.ifs.org.uk/comms/comm124.pdf25‘Dorling, Vickers, Thomas, Pritchard and Ballas, ‘Changing UK: The way we live now’, December 2008.26Department for Education27OECD, ‘Education at a Glance’, 201228For example, see L. Caparelli and K. Tatsiramos, ‘‘Friends’ Networks and Job Finding Rates’, ISER Working Paper Series 2011-21, 2011.29For example, see E. Bjarnegard, Gender, Informal Institutions and Political Recruitment, Palgrave Macmillan, 2013; S. Bentolila, C. Michelacci, J. Suarez, ‘Social Contacts and Occupational Choice’, Economica, Vol 77 (2010), Issue 305 (01), pp 20-45; S. Hanson, G. Pratt, ‘Job Search and the Occupational Segregation of Women’, Annals of the Association of American Geographers, Volume 81, Issue 2, 1991, pp. 229–253.30For example, see Campaign to End Loneliness, 201131For example, see J. C. Barefoot, et al., ‘Trust, health, and longevity’, Journal of Behavioral Medicine 21(6): 517–26, 1998; L. C Hawkley, R. A Thisted,C. M. Masi, and J. T. Cacioppo, ‘Loneliness predicts increased blood pressure: Five-year cross-lagged analysis in middle-aged and older adults’, Psychology and Aging, 25, 132-141, 2010; J. Holt-Lunstad, T. B. Smith, J. B. Layton, ‘Social Relationships and Mortality Risk: A Meta-analytic Review’, PLoS Med 7(7): 1-20, 2010; L. F. Berkman,T. Glass, I. Brissette, and T. E. Seeman, ‘From social integration to health- Durkheim in the new millennium’, Social Science & Medicine, 51(6): 843-857, 2000.32-25 per cent = (30 per cent/40 per cent) - 100 per cent33Please note that throughout the report, for ethnicity measures, we excluded people who reported having had family interactions during the social event they were asked about. These people were, however, included for social grade and age measures. This is in order to better reflect the interactions which are likely to challenge currently held perceptions of those who are different.34Social Grade E includes only those who are unemployed but looking for work.35Right Management Survey 2010, Manpower Group, reported in Forbes online: http://www.forbes.com/sites/susanadams/2011/06/07/networking-is-still-the-best-way-to-find-a-job-survey-says/; See also Y. M. Ioannides and L. D. Loury, ‘Job Information Networks, Neighbourhood Effects and Inequality’, 2004, for an overview of various studies. Figures range 30 to 60 per cent depending on variables 36For example, see D. Goodhart, The British Dream: Successes and Failures of Post-War Immigration, Atlantic, 2013.37A. Al Ramiah, K. Schmid,M Hewstone, and C. Floe, (in press), ‘Why are all the White (Asian) kids sitting together in the cafeteria? Resegregation and the role of intergroup attributions and norms’, British Journal of Social Psychology.doi: 10.1111/bjso.1206438Higher Education Statistics Agency, 2012; 86% of UK domiciled first year degree students in 2010/11 were under 30 years39E. Kaufman, ‘White Flight in Engalnd? White attraction rather than repulsion seems to be the story’, 2013: http://blogs.lse.ac.uk/politicsandpolicy/archives/3824240See Trust for London and New Policy Institute, London’s Poverty Profile, http://www.londonspovertyprofile.org.uk/indicators/topics/inequality/income-inequality-in-london-compared-with-other-english-regions/; http://www.poverty.org.uk/09/index.shtml; Office for National Statistics, Ethnicity and National Identity in England and Wales, 2011.41Data source Office for National Statistics, viewed through Financial Times online.42C. Hamnett, ‘Concentration or Diffusion? The changing geography of ethnic minority pupils in English Secondary Schools,1999-2009’, Urban Studies, 49, 1741-66, 2011

37

38
Ho
w in
tegrated
is mo
dern
Britain


