26
How to Measure and Grow Return on Marketing Investment across Markets and Marketing Actions Professor dr. Koen Pauwels Tuck School of Business at Dartmouth

How to Measure and GrowReturn on Marketing Investment
across Marketsand Marketing Actions
Professor dr. Koen PauwelsTuck School of Business at Dartmouth

Why measure Return on Marketing Investment ?
• In services and manufacturing industries, marketing should create profitable growth
• Operations and finance are accountable for return on investments, why not marketing?
• Return on Marketing Investment badly needed:
– 80 % of new products fail
– 50 % of advertising spending has no effect
– 85 % of sales promotions result in net losses

How to Measure ROMI ?
• Structured Executive Opinion
• Market Experimentation
• Examining long-term data patterns

Limitations of Experimentation
• Experiments assess short-run impact, but are costly and don’t capture competitive reaction
• Short-term and long-term effects over time?
• Impact on stages customer buying process (awareness, intention, satisfaction) and firm value process (sales, income, valuation)?
• Media and marketing budget allocation?
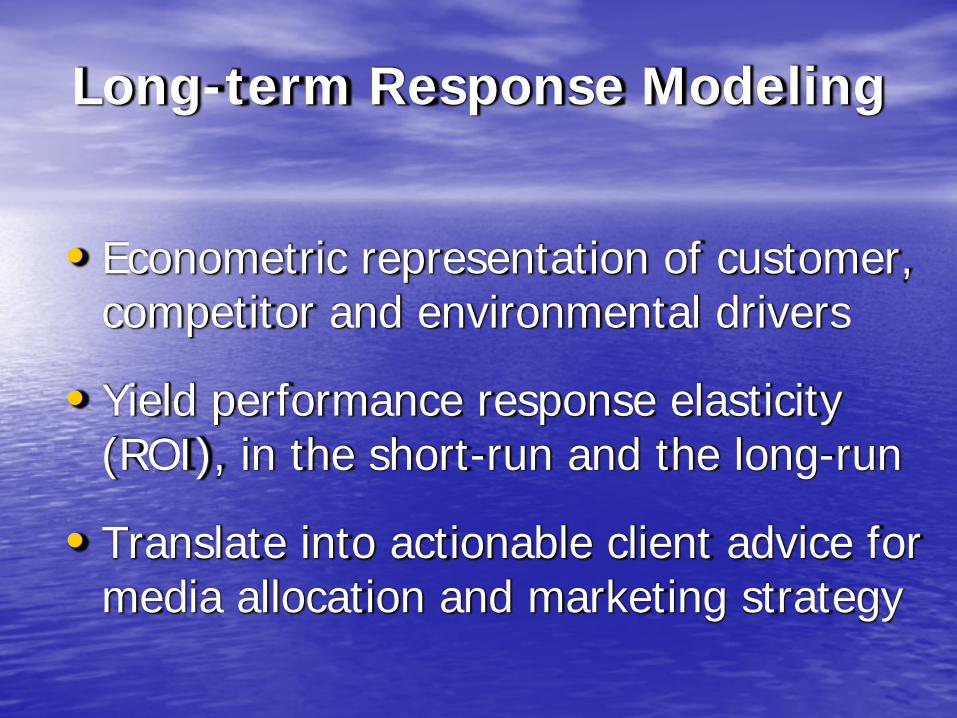
Long-term Response Modeling
• Econometric representation of customer, competitor and environmental drivers
• Yield performance response elasticity (ROI), in the short-run and the long-run
• Translate into actionable client advice for media allocation and marketing strategy

Long-term modeling challenges
• How long is long-term ?
• How to model wear-in and wear-out ?
• How to incorporate long-term reactions of retailers, competitors, company action (future decision making) ?

Vector-Autoregressive Models
• Flexible model of complex dynamic interactions between a set of endogenous variables
• Unique perspective on marketing-performance :1) consumer response to marketing is dynamic 2) competitive response to marketing actions3) company response: performance feedback

Long-term sales response model
• Conventional sales-price response model:
S1 = a1 + ρ1S1,t-1 + b11p1 + b12 p2 + ε1
S2 = a2 + ρ2S2,t-1 + b21p1 + b22 p2 + ε2
• But consumers forward buy and stockpile :
S1 = a1+ρ1S1,t-1+b11p1+φ11p1,t-1+φ12 p1,t-2+..

Long-term Marketing Model
• And competitors react with price change:
P2 = a4+ρ4 p1,t-1+φ41p1,t-1+φ42 p2,t-2 + … +ε4
• And firms decide based on sales feedback:
P1 = a3+ρ3 p1,t-1+b31S1,t-1+b32 S2,t-1 + … +ε3

Vector Auto-Regression (VAR)
• “long-term” can be few weeks, months or forever:decided by data: forecast precision vs. complexity
• Compute long-term ROMI as the net impact of consumer, competitor and company response
1 11 12 13 14
2 21 22 24
3 31 32 33 34
4 41 42 43 44
1, 13 14 1, 1,
2, 23 24 2, 2,23
1, 1,
2, 2,
0 00 00 0 0 00 0 0 0
i i i it t t i
i i i it t
i i i it t
i i i it t
S b b S SS b b S Sp pp p
α φ φ φ φα φ φ φ φα φ φ φ φα φ φ φ φ
−⎡ ⎤⎡ ⎤ ⎡ ⎤ ⎡ ⎤⎡ ⎤⎢ ⎥⎢ ⎥ ⎢ ⎥ ⎢ ⎥⎢ ⎥⎢ ⎥⎢ ⎥ ⎢ ⎥ ⎢ ⎥⎢ ⎥= + +⎢ ⎥⎢ ⎥ ⎢ ⎥ ⎢ ⎥⎢ ⎥⎢ ⎥⎢ ⎥ ⎢ ⎥ ⎢ ⎥⎢ ⎥
⎣ ⎦ ⎣ ⎦ ⎣ ⎦⎣ ⎦ ⎣ ⎦
1,
2,
1, 3,1
2, 4,
t
k t i t
t i ti
t i t
pp
εεεε
−
−=
−
⎡ ⎤ ⎡ ⎤⎢ ⎥ ⎢ ⎥⎢ ⎥ ⎢ ⎥+⎢ ⎥ ⎢ ⎥⎢ ⎥ ⎢ ⎥⎣ ⎦ ⎣ ⎦
∑

Price deal yields positive consumer response, but lowers future sales, especially if competitors react
-4
-3
-2
-1
0
1
2
3
4
5
1 2 3 4 5 6 7 8 9 10 11 12 13
Weeks
Sale
s El
astic
ity
ConsumerCompetitive

Discount ‘works’, so firm repeats
-4
-3
-2
-1
0
1
2
3
4
5
1 2 3 4 5 6 7 8 9 10 11 12 13
Weeks
Sal
es E
last
icity
ConsumerCompetitiveCompany

Worst case: each time you promote it hurts your bottom
line
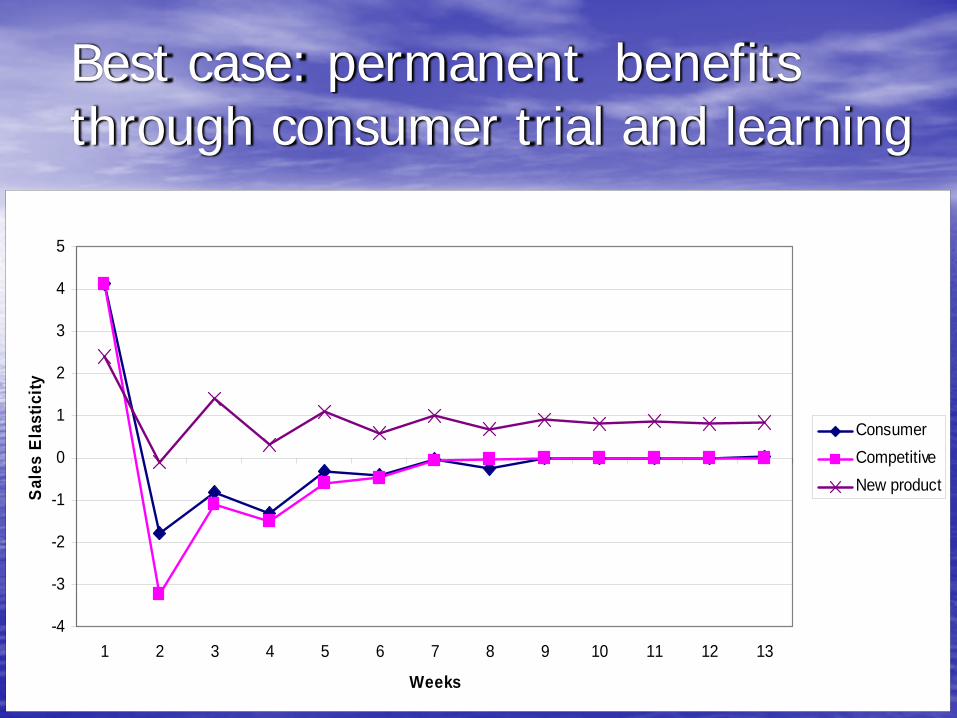
Best case: permanent benefits through consumer trial and learning
-4
-3
-2
-1
0
1
2
3
4
5
1 2 3 4 5 6 7 8 9 10 11 12 13
Weeks
Sale
s El
astic
ity
ConsumerCompetitiveNew product

Profitable Growth Conditions
Mature Markets Changing Markets
CampaignMarketing
Business-as-UsualFMCG promotions
Pharma advertising
Permanent BenefitAutomobiles
Product innovationChangingMarketing
EscalationAutomobiles Price Rebates
Evolving BusinessMedical Services
Detailing

Journal Advertising Works Right Away, then dies out

Direct-to-Consumer ads show Wear-in and Wear-out

What is the Best that could Happen?
500
1000
1500
2000
2500
3000
3500
4000
4500
5000
Oct-97 Feb-98 Jun-98 Oct-98 Feb-99 Jun-99 Oct-99 Feb-00 Jun-00 Oct-00 Feb-01 Jun-01 Oct-01 Feb-02
Months
Gro
ss M
argi
n $
Honda launches 1999 Odyssey

One-shot innovation increases Honda’s Firm Value Forever

Long-Term ROI Varies by Segment and Firm
0
50
100
150
200
250
Cars Trucks Minivans & SUVs
RO
I in
$ M
illio
ns
Toyota Daimler-Chrysler General Motors Ford

And by Innovation Level

In Contrast, Rebates Decrease Firm Value in the long run

As They lead to Competitive Escalation

Finally, are some Actions Needed to Maintain Sales ?
0.00
1000.00
2000.00
3000.00
4000.00
5000.00
6000.00
7000.00
8000.00
9000.00
Jan-93
Jul-93
Jan-94
Jul-94
Jan-95
Jul-95
Jan-96
Jul-96
Jan-97
Jul-97
Jan-98
Jul-98
Jan-99
Jul-99
Month
Det
ailin
g a
nd S
ales

How to Grow ROMI ?
Mature Markets
Changing Markets
MarketingCampaigns
Continue to create better campaigns
Focus and be ready to handle
growth
Changing marketing
Allocate $ to other marketing
actions
Ensure marketing spending keeps up
with sales

Help Managers Drive Growth
• Managerial Goal remains the same : Build and Defend Profitable Growth
• 21th C Reality : Need to demonstrate ROMI faced with rising costs and channel power
• Approach: long-term response models yield measurable long-term benefits
• Translate into actionable managerial insights and need for future monitoring


