1 Risk over Reward Thinking about Investing How to Read Financial Statements – Deciphering the Earnings Statement and Balance Sheet in the Annual Report or 10-K (Part 2) by Alpha and Vega, an Investor and a Trader April 8th, 2010 In this issue: 1) Before Diving In, Know What You Are Looking For 2) A Quick Check of Selected Financial Data 3) A Qualitative Understanding of the Business 4) The Earnings Statement 5) The Balance Sheet 6) The Three Mile Island Nuclear Accident and Earnings Releases The first letter in the “How to Read Financial Statements” series went over basics on finding them and how to approach them. This second letter gets into the guts of a 10-K, into the first level of analysis. There are a few difficult skills to learn: how to combine a qualitative business/industry analysis with a quantitative ratio or “by the numbers” analysis; looking at risk factors thoughtfully; drawing your circle of competence on what you do and don’ t know; trying to develop the skill of finding the few drivers behind any business. One final note: We publish information on the website and over Twitter that we do not include in the newsletter. If you want to follow those, visit the website, set up an RSS feed, and follow us on Twitter. Risk over Reward: A conversation about intelligent investing – we discuss the nature of risk and uncertainty, macroeconomics, security valuation, and how to think about markets and invest profitably - http://www.riskoverreward.com/ Read our online posts at: http://www.riskoverreward.com/ Follow our tweets at: http://twitter.com/riskoverreward Subscribe to the newsletter at: http://blogspot.us1.list- manage.com/subscribe?u=8568d749127b61697bffe2b17&id=40b55d58d8 See Alpha’s reading recommendations here: Investment Classics
Transcript
1
Risk over Reward Thinking about Investing
How to Read Financial Statements – Deciphering the Earnings Statement and Balance Sheet in the Annual Report or 10-K (Part 2) by Alpha and Vega, an Investor and a Trader
April 8th, 2010 In this issue: 1) Before Diving In, Know What You Are Looking For 2) A Quick Check of Selected Financial Data 3) A Qualitative Understanding of the Business 4) The Earnings Statement 5) The Balance Sheet 6) The Three Mile Island Nuclear Accident and Earnings Releases The first letter in the “How to Read Financial Statements” series went over basics on finding them and how to approach them. This second letter gets into the guts of a 10-K, into the first level of analysis. There are a few difficult skills to learn: how to combine a qualitative business/industry analysis with a quantitative ratio or “by the numbers” analysis; looking at risk factors thoughtfully; drawing your circle of competence on what you do and don’t know; trying to develop the skill of finding the few drivers behind any business. One final note: We publish information on the website and over Twitter that we do not include in the newsletter. If you want to follow those, visit the website, set up an RSS feed, and follow us on Twitter.
Risk over Reward: A conversation about intelligent investing – we discuss the nature of risk and uncertainty, macroeconomics, security valuation, and how to think about markets and invest profitably - http://www.riskoverreward.com/ Read our online posts at: http://www.riskoverreward.com/ Follow our tweets at: http://twitter.com/riskoverreward Subscribe to the newsletter at: http://blogspot.us1.list-manage.com/subscribe?u=8568d749127b61697bffe2b17&id=40b55d58d8 See Alpha’s reading recommendations here: Investment Classics
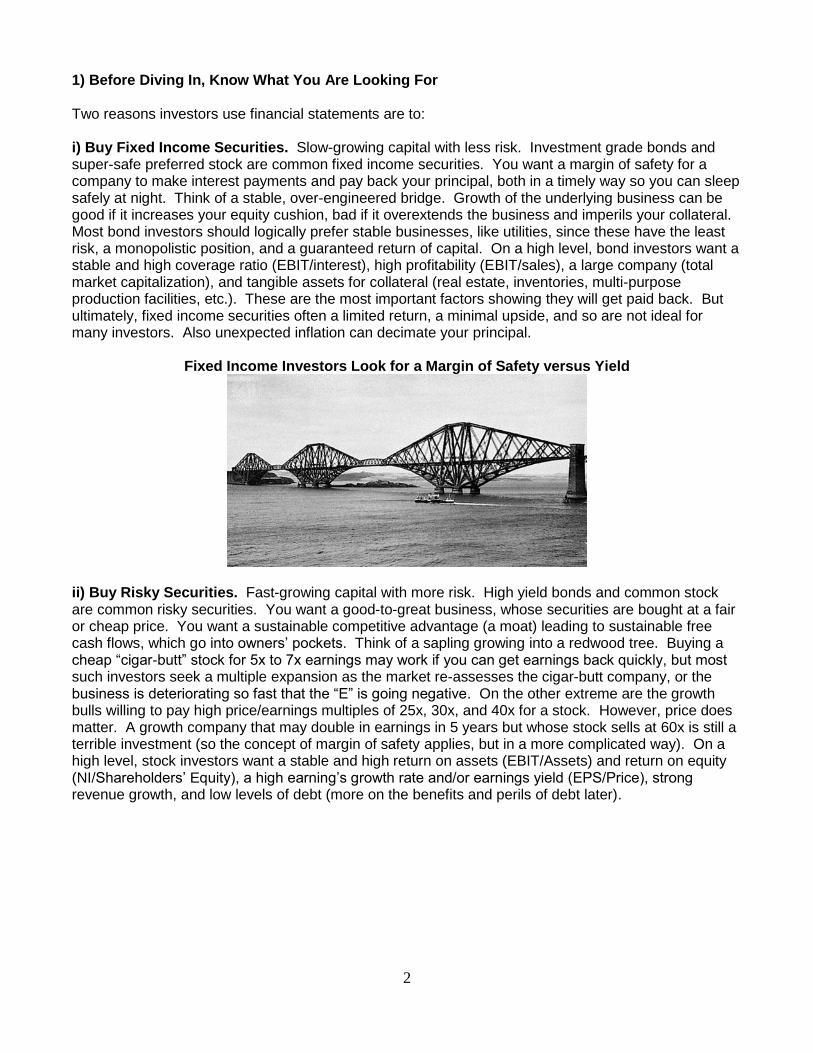
1) Before Diving In, Know What You Are Looking For Two reasons investors use financial statements are to: i) Buy Fixed Income Securities. Slow-growing capital with less risk. Investment grade bonds and super-safe preferred stock are common fixed income securities. You want a margin of safety for a company to make interest payments and pay back your principal, both in a timely way so you can sleep safely at night. Think of a stable, over-engineered bridge. Growth of the underlying business can be good if it increases your equity cushion, bad if it overextends the business and imperils your collateral. Most bond investors should logically prefer stable businesses, like utilities, since these have the least risk, a monopolistic position, and a guaranteed return of capital. On a high level, bond investors want a stable and high coverage ratio (EBIT/interest), high profitability (EBIT/sales), a large company (total market capitalization), and tangible assets for collateral (real estate, inventories, multi-purpose production facilities, etc.). These are the most important factors showing they will get paid back. But ultimately, fixed income securities often a limited return, a minimal upside, and so are not ideal for many investors. Also unexpected inflation can decimate your principal.
Fixed Income Investors Look for a Margin of Safety versus Yield
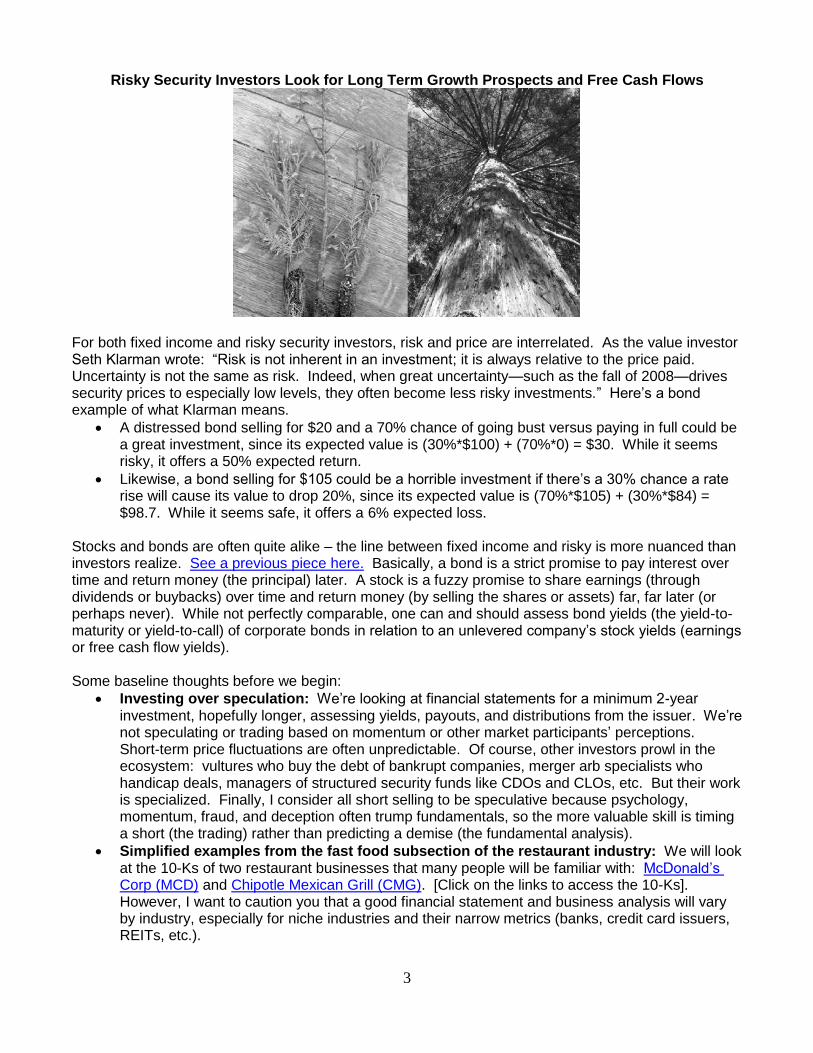
ii) Buy Risky Securities. Fast-growing capital with more risk. High yield bonds and common stock are common risky securities. You want a good-to-great business, whose securities are bought at a fair or cheap price. You want a sustainable competitive advantage (a moat) leading to sustainable free cash flows, which go into owners’ pockets. Think of a sapling growing into a redwood tree. Buying a cheap ―cigar-butt‖ stock for 5x to 7x earnings may work if you can get earnings back quickly, but most such investors seek a multiple expansion as the market re-assesses the cigar-butt company, or the business is deteriorating so fast that the ―E‖ is going negative. On the other extreme are the growth bulls willing to pay high price/earnings multiples of 25x, 30x, and 40x for a stock. However, price does matter. A growth company that may double in earnings in 5 years but whose stock sells at 60x is still a terrible investment (so the concept of margin of safety applies, but in a more complicated way). On a high level, stock investors want a stable and high return on assets (EBIT/Assets) and return on equity (NI/Shareholders’ Equity), a high earning’s growth rate and/or earnings yield (EPS/Price), strong revenue growth, and low levels of debt (more on the benefits and perils of debt later).
3
Risky Security Investors Look for Long Term Growth Prospects and Free Cash Flows
For both fixed income and risky security investors, risk and price are interrelated. As the value investor Seth Klarman wrote: ―Risk is not inherent in an investment; it is always relative to the price paid. Uncertainty is not the same as risk. Indeed, when great uncertainty—such as the fall of 2008—drives security prices to especially low levels, they often become less risky investments.‖ Here’s a bond example of what Klarman means.
A distressed bond selling for $20 and a 70% chance of going bust versus paying in full could be a great investment, since its expected value is (30%*$100) + (70%*0) = $30. While it seems risky, it offers a 50% expected return.
Likewise, a bond selling for $105 could be a horrible investment if there’s a 30% chance a rate rise will cause its value to drop 20%, since its expected value is (70%*$105) + (30%*$84) = $98.7. While it seems safe, it offers a 6% expected loss.
Stocks and bonds are often quite alike – the line between fixed income and risky is more nuanced than investors realize. See a previous piece here. Basically, a bond is a strict promise to pay interest over time and return money (the principal) later. A stock is a fuzzy promise to share earnings (through dividends or buybacks) over time and return money (by selling the shares or assets) far, far later (or perhaps never). While not perfectly comparable, one can and should assess bond yields (the yield-to-maturity or yield-to-call) of corporate bonds in relation to an unlevered company’s stock yields (earnings or free cash flow yields). Some baseline thoughts before we begin:
Investing over speculation: We’re looking at financial statements for a minimum 2-year investment, hopefully longer, assessing yields, payouts, and distributions from the issuer. We’re not speculating or trading based on momentum or other market participants’ perceptions. Short-term price fluctuations are often unpredictable. Of course, other investors prowl in the ecosystem: vultures who buy the debt of bankrupt companies, merger arb specialists who handicap deals, managers of structured security funds like CDOs and CLOs, etc. But their work is specialized. Finally, I consider all short selling to be speculative because psychology, momentum, fraud, and deception often trump fundamentals, so the more valuable skill is timing a short (the trading) rather than predicting a demise (the fundamental analysis).
Simplified examples from the fast food subsection of the restaurant industry: We will look at the 10-Ks of two restaurant businesses that many people will be familiar with: McDonald’s Corp (MCD) and Chipotle Mexican Grill (CMG). [Click on the links to access the 10-Ks]. However, I want to caution you that a good financial statement and business analysis will vary by industry, especially for niche industries and their narrow metrics (banks, credit card issuers, REITs, etc.).
Refer to thoughts from the previous letter: A bird in the hand is worth two in the bush. Principal-agent problems stink. Bounded rationality forces humility. A representation of reality isn’t reality. You can’t buy breakfast with earnings. Numbers without context are meaningless. Treasuries are your measuring stick.
2) A Quick Check of Selected Financial Data The first thing an analyst of financial statements should do is scan the ―Selected Financial Data‖ section in the 10-K (it’s ITEM 6). Click on the links below to see the sections for McDonalds (MCD) and Chipotle (CMG).
McDonalds 2009 10-K: Selected Financial Data http://www.sec.gov/Archives/edgar/data/63908/000119312510042025/d10k.htm#toc84160_8
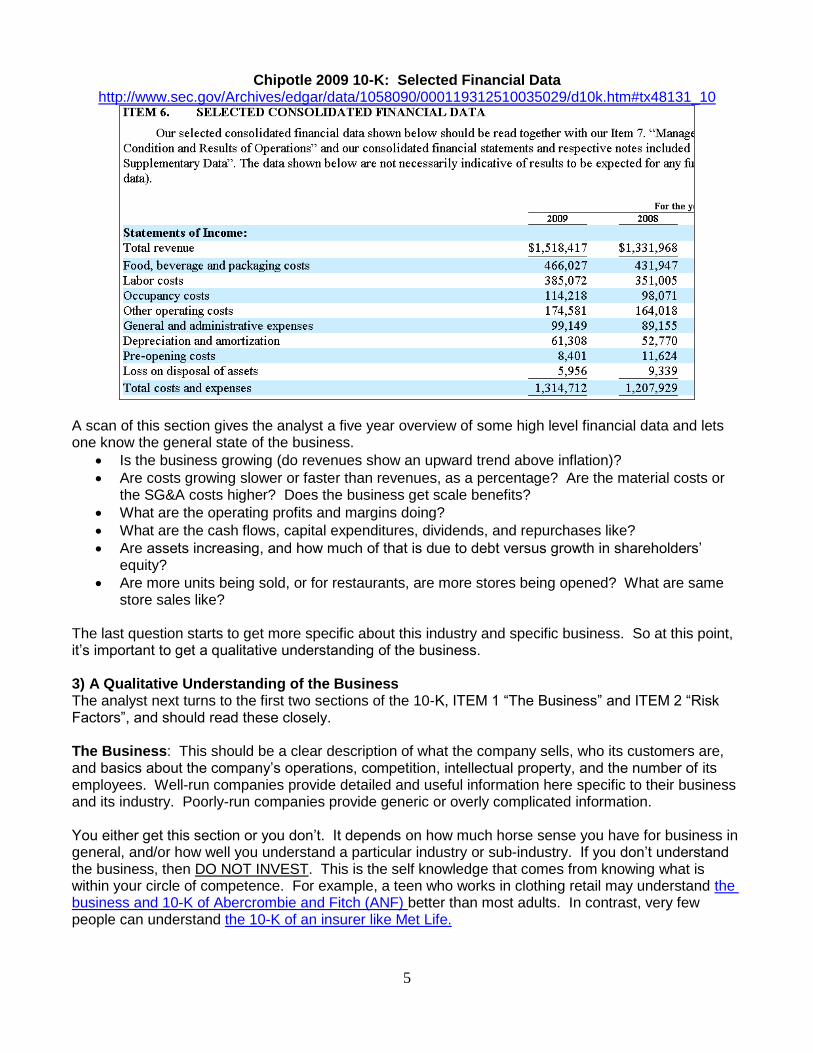
Chipotle 2009 10-K: Selected Financial Data http://www.sec.gov/Archives/edgar/data/1058090/000119312510035029/d10k.htm#tx48131_10
A scan of this section gives the analyst a five year overview of some high level financial data and lets one know the general state of the business.
Is the business growing (do revenues show an upward trend above inflation)?
Are costs growing slower or faster than revenues, as a percentage? Are the material costs or the SG&A costs higher? Does the business get scale benefits?
What are the operating profits and margins doing?
What are the cash flows, capital expenditures, dividends, and repurchases like?
Are assets increasing, and how much of that is due to debt versus growth in shareholders’ equity?
Are more units being sold, or for restaurants, are more stores being opened? What are same store sales like?
The last question starts to get more specific about this industry and specific business. So at this point, it’s important to get a qualitative understanding of the business. 3) A Qualitative Understanding of the Business The analyst next turns to the first two sections of the 10-K, ITEM 1 ―The Business‖ and ITEM 2 ―Risk Factors‖, and should read these closely. The Business: This should be a clear description of what the company sells, who its customers are, and basics about the company’s operations, competition, intellectual property, and the number of its employees. Well-run companies provide detailed and useful information here specific to their business and its industry. Poorly-run companies provide generic or overly complicated information. You either get this section or you don’t. It depends on how much horse sense you have for business in general, and/or how well you understand a particular industry or sub-industry. If you don’t understand the business, then DO NOT INVEST. This is the self knowledge that comes from knowing what is within your circle of competence. For example, a teen who works in clothing retail may understand the business and 10-K of Abercrombie and Fitch (ANF) better than most adults. In contrast, very few people can understand the 10-K of an insurer like Met Life.
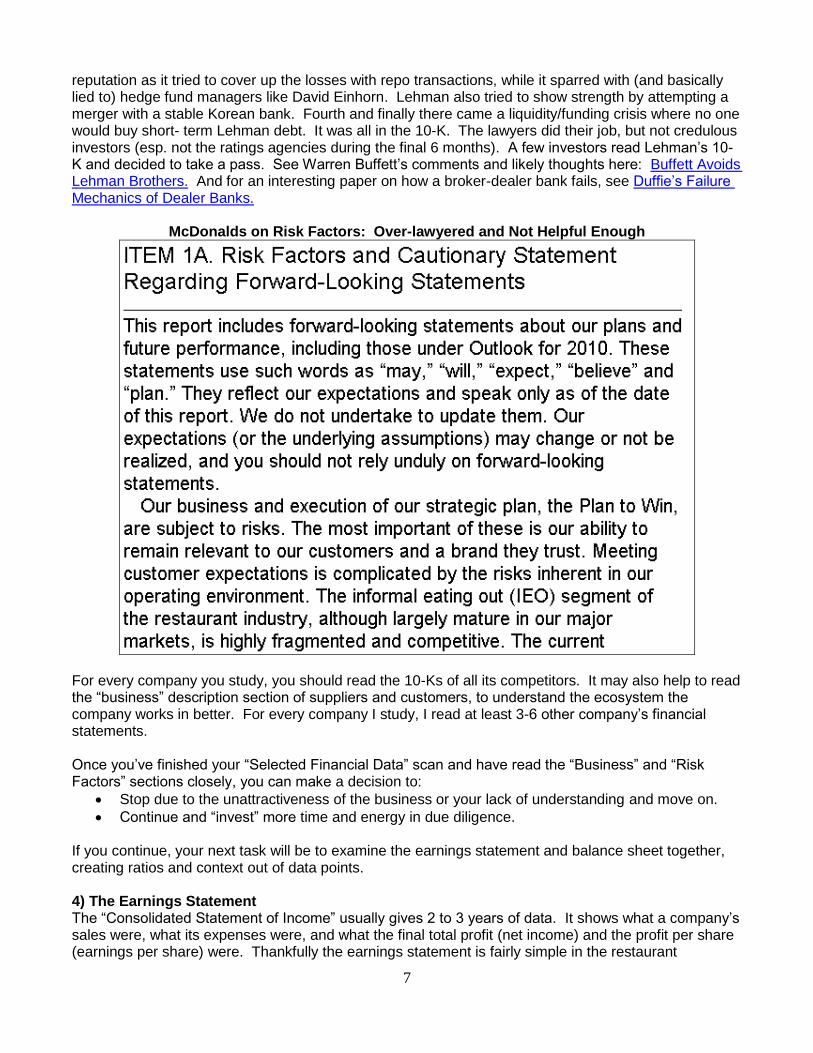
Risk Factors: These are written by managers, accountants, and lawyers. Mostly lawyers. While many investors skip the risk factors section, I always read them. Consider the following risks in a major broker-dealer’s 2008 10-K:
[1] Defaults by Another Large Financial Institution Could Adversely Affect Financial Markets Generally. The commercial soundness of many financial institutions may be closely interrelated as a result of credit, trading, clearing or other relationships between the institutions. As a result, concerns about, or a default by, one institution could lead to significant market-wide liquidity problems, losses or defaults by other institutions. [2] Holding Large and Concentrated Positions May Expose Us to Losses. Concentration of risk may reduce revenues or result in losses in our market-making, specialist, block trading, underwriting, proprietary trading, principal investment and lending businesses in the event of unfavorable market movements even when economic and market conditions are generally favorable for others in the industry. [3] Exposure to Reputational Risks Could Impact the Value of Our Brand. Our reputation is critical in maintaining our relationships with clients, investors, regulators and the general public, and is a key focus in our risk management efforts. [4] Market Risk May Increase the Other Risks That We Face. In addition to the potentially adverse effects on our businesses described above, market risk could exacerbate other risks that we face. For example, if we were to incur substantial market risk losses, our need for liquidity could rise significantly, while our access to liquidity could be impaired. [Numerical labels added; risk factors taken out of order]
All of them came true and the company, Lehman Brothers Holdings (LEH), filed for bankruptcy. First, other large financial institutions went bust (Bear Stearns and Fannie Mae) while second, Lehman’s concentrated commercial real estate positions deteriorated. Third, this caused Lehman to lose its
reputation as it tried to cover up the losses with repo transactions, while it sparred with (and basically lied to) hedge fund managers like David Einhorn. Lehman also tried to show strength by attempting a merger with a stable Korean bank. Fourth and finally there came a liquidity/funding crisis where no one would buy short- term Lehman debt. It was all in the 10-K. The lawyers did their job, but not credulous investors (esp. not the ratings agencies during the final 6 months). A few investors read Lehman’s 10-K and decided to take a pass. See Warren Buffett’s comments and likely thoughts here: Buffett Avoids Lehman Brothers. And for an interesting paper on how a broker-dealer bank fails, see Duffie’s Failure Mechanics of Dealer Banks.
McDonalds on Risk Factors: Over-lawyered and Not Helpful Enough
For every company you study, you should read the 10-Ks of all its competitors. It may also help to read the ―business‖ description section of suppliers and customers, to understand the ecosystem the company works in better. For every company I study, I read at least 3-6 other company’s financial statements. Once you’ve finished your ―Selected Financial Data‖ scan and have read the ―Business‖ and ―Risk Factors‖ sections closely, you can make a decision to:
Stop due to the unattractiveness of the business or your lack of understanding and move on.
Continue and ―invest‖ more time and energy in due diligence. If you continue, your next task will be to examine the earnings statement and balance sheet together, creating ratios and context out of data points. 4) The Earnings Statement The ―Consolidated Statement of Income‖ usually gives 2 to 3 years of data. It shows what a company’s sales were, what its expenses were, and what the final total profit (net income) and the profit per share (earnings per share) were. Thankfully the earnings statement is fairly simple in the restaurant
business, as you can see below. (For a contrast, see the complex earnings statement of Wells Fargo here: http://www.sec.gov/Archives/edgar/data/72971/000095012310017877/f54129exv13.htm#118).
McDonalds Earnings Statement Shows 2009 Revenues were Down, Profits Up http://www.sec.gov/Archives/edgar/data/63908/000119312510042025/d10k.htm#tx84160_1
The MCD earnings statement shows that operating income, net income, and earnings per share were barely up, but revenues fell in company-operated restaurants (the majority of the company’s business). However, due to admirable cost cutting across the board, MCD reported higher profits. This is a positive short-term outcome, but the long-term outlook when revenues are falling is worrisome. Compare this to Chipotle. Chipotle had a great year, with revenues up 14% and profits up 63%. Both CMG and MCD bought back shares, as their weighted-average shares outstanding fell (so current owners will garner more out of future earnings).
Chipotle’s Earnings Statement Shows 2009 Revenues and Profits Were Up http://www.sec.gov/Archives/edgar/data/1058090/000119312510035029/d10k.htm#tx48131_32
Without looking at the balance sheet, there’s not much more an analyst can do know. One should check the revenue recognition policies in the footnotes to make sure they don’t stink (they don’t for CMG and MCD). One should also look for one-off gains and losses, plus other comprehensive income. But those are advanced issues. We now turn to look at the balance sheet by itself and to provide context to the income statement. 5) The Balance Sheet The ―Consolidated Balance Sheet‖ (or ―Consolidated Statements of Position‖) usually gives 2 years of data. It shows a company’s assets (all its property), its liabilities (all the loans, debt, and claims on it), and its shareholder’s equity (the residual, i.e. what stockholders get). The balance sheet must satisfy this accounting identity:
Assets = Liabilities + Shareholder’s Equity (assets are made up of liabilities and shareholders’ equity)
A more intuitive understanding is that if you take a company’s assets, sell them all, then pay off creditors, the remainder is what shareholders get. Shareholder’s equity is what shareholders are left with.
Assets - Liabilities = Shareholder’s Equity (assets minus the liabilities, which have prior claim, leaves shareholders’ equity)
Again, thankfully the restaurant companies have fairly simple balance sheets. (For a contrast, see the balance sheet of Goldman Sachs here: http://www.sec.gov/Archives/edgar/data/886982/000095012310018464/y81914e10vk.htm#305). Looking solely at the balance sheet, some key ratios to note are:
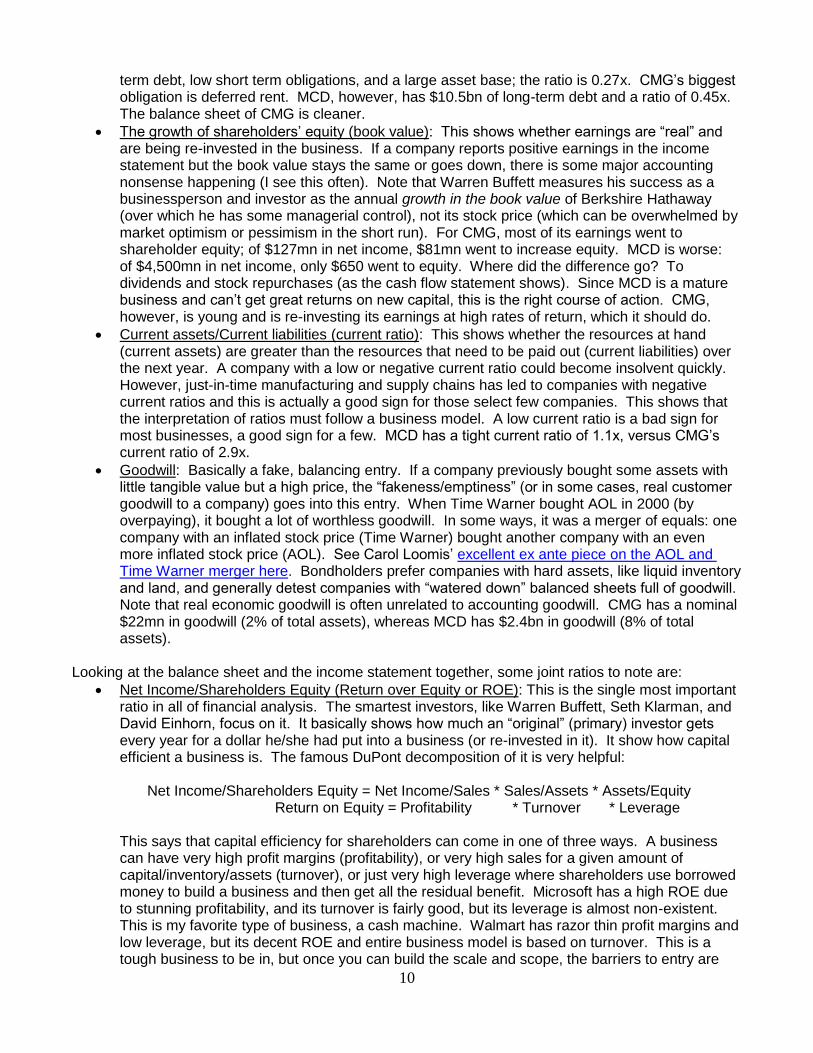
Debt/Assets (the level of total debt to assets, the leverage): This shows how juiced up shareholder returns are, as higher leverage produces higher earnings for the shareholders, but it increases the chance of a default which can wipe out shareholders and aggravate bondholders (who just want to get paid interest and principal). CMG is healthy with no long-
term debt, low short term obligations, and a large asset base; the ratio is 0.27x. CMG’s biggest obligation is deferred rent. MCD, however, has $10.5bn of long-term debt and a ratio of 0.45x. The balance sheet of CMG is cleaner.
The growth of shareholders’ equity (book value): This shows whether earnings are ―real‖ and are being re-invested in the business. If a company reports positive earnings in the income statement but the book value stays the same or goes down, there is some major accounting nonsense happening (I see this often). Note that Warren Buffett measures his success as a businessperson and investor as the annual growth in the book value of Berkshire Hathaway (over which he has some managerial control), not its stock price (which can be overwhelmed by market optimism or pessimism in the short run). For CMG, most of its earnings went to shareholder equity; of $127mn in net income, $81mn went to increase equity. MCD is worse: of $4,500mn in net income, only $650 went to equity. Where did the difference go? To dividends and stock repurchases (as the cash flow statement shows). Since MCD is a mature business and can’t get great returns on new capital, this is the right course of action. CMG, however, is young and is re-investing its earnings at high rates of return, which it should do.
Current assets/Current liabilities (current ratio): This shows whether the resources at hand (current assets) are greater than the resources that need to be paid out (current liabilities) over the next year. A company with a low or negative current ratio could become insolvent quickly. However, just-in-time manufacturing and supply chains has led to companies with negative current ratios and this is actually a good sign for those select few companies. This shows that the interpretation of ratios must follow a business model. A low current ratio is a bad sign for most businesses, a good sign for a few. MCD has a tight current ratio of 1.1x, versus CMG’s current ratio of 2.9x.
Goodwill: Basically a fake, balancing entry. If a company previously bought some assets with little tangible value but a high price, the ―fakeness/emptiness‖ (or in some cases, real customer goodwill to a company) goes into this entry. When Time Warner bought AOL in 2000 (by overpaying), it bought a lot of worthless goodwill. In some ways, it was a merger of equals: one company with an inflated stock price (Time Warner) bought another company with an even more inflated stock price (AOL). See Carol Loomis’ excellent ex ante piece on the AOL and Time Warner merger here. Bondholders prefer companies with hard assets, like liquid inventory and land, and generally detest companies with ―watered down‖ balanced sheets full of goodwill. Note that real economic goodwill is often unrelated to accounting goodwill. CMG has a nominal $22mn in goodwill (2% of total assets), whereas MCD has $2.4bn in goodwill (8% of total assets).
Looking at the balance sheet and the income statement together, some joint ratios to note are:
Net Income/Shareholders Equity (Return over Equity or ROE): This is the single most important ratio in all of financial analysis. The smartest investors, like Warren Buffett, Seth Klarman, and David Einhorn, focus on it. It basically shows how much an ―original‖ (primary) investor gets every year for a dollar he/she had put into a business (or re-invested in it). It show how capital efficient a business is. The famous DuPont decomposition of it is very helpful:
Net Income/Shareholders Equity = Net Income/Sales * Sales/Assets * Assets/Equity
Return on Equity = Profitability * Turnover * Leverage This says that capital efficiency for shareholders can come in one of three ways. A business can have very high profit margins (profitability), or very high sales for a given amount of capital/inventory/assets (turnover), or just very high leverage where shareholders use borrowed money to build a business and then get all the residual benefit. Microsoft has a high ROE due to stunning profitability, and its turnover is fairly good, but its leverage is almost non-existent. This is my favorite type of business, a cash machine. Walmart has razor thin profit margins and low leverage, but its decent ROE and entire business model is based on turnover. This is a tough business to be in, but once you can build the scale and scope, the barriers to entry are
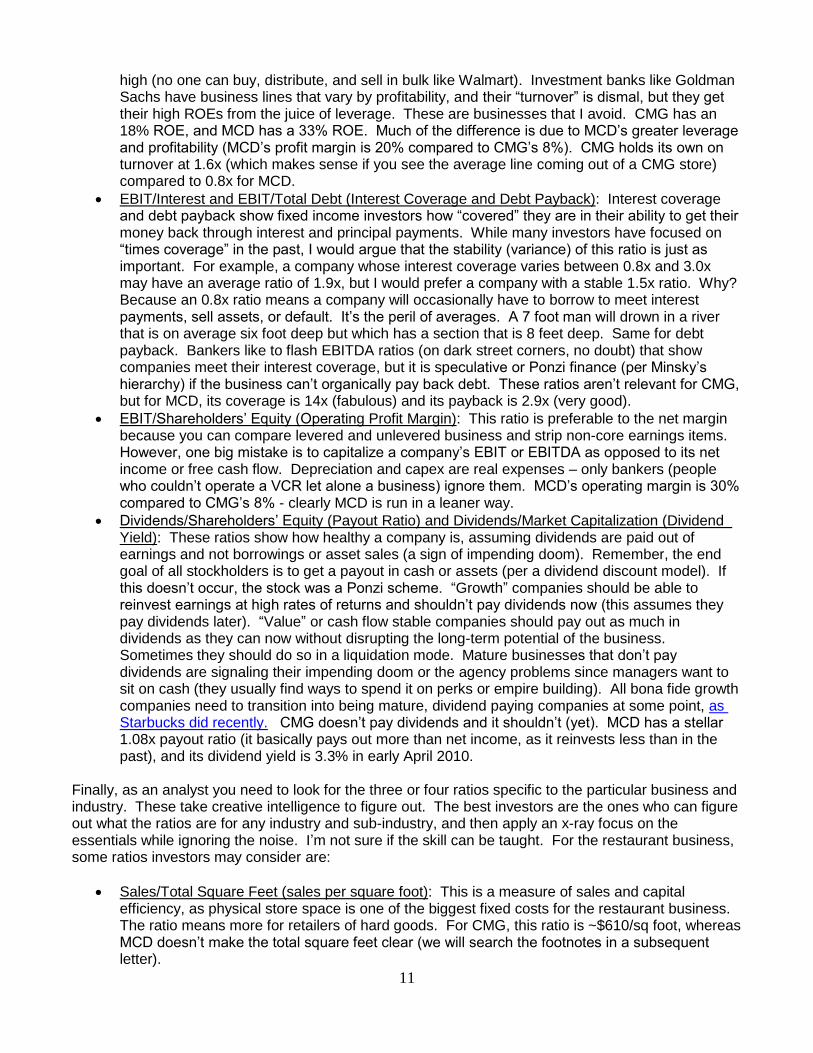
high (no one can buy, distribute, and sell in bulk like Walmart). Investment banks like Goldman Sachs have business lines that vary by profitability, and their ―turnover‖ is dismal, but they get their high ROEs from the juice of leverage. These are businesses that I avoid. CMG has an 18% ROE, and MCD has a 33% ROE. Much of the difference is due to MCD’s greater leverage and profitability (MCD’s profit margin is 20% compared to CMG’s 8%). CMG holds its own on turnover at 1.6x (which makes sense if you see the average line coming out of a CMG store) compared to 0.8x for MCD.
EBIT/Interest and EBIT/Total Debt (Interest Coverage and Debt Payback): Interest coverage and debt payback show fixed income investors how ―covered‖ they are in their ability to get their money back through interest and principal payments. While many investors have focused on ―times coverage‖ in the past, I would argue that the stability (variance) of this ratio is just as important. For example, a company whose interest coverage varies between 0.8x and 3.0x may have an average ratio of 1.9x, but I would prefer a company with a stable 1.5x ratio. Why? Because an 0.8x ratio means a company will occasionally have to borrow to meet interest payments, sell assets, or default. It’s the peril of averages. A 7 foot man will drown in a river that is on average six foot deep but which has a section that is 8 feet deep. Same for debt payback. Bankers like to flash EBITDA ratios (on dark street corners, no doubt) that show companies meet their interest coverage, but it is speculative or Ponzi finance (per Minsky’s hierarchy) if the business can’t organically pay back debt. These ratios aren’t relevant for CMG, but for MCD, its coverage is 14x (fabulous) and its payback is 2.9x (very good).
EBIT/Shareholders’ Equity (Operating Profit Margin): This ratio is preferable to the net margin because you can compare levered and unlevered business and strip non-core earnings items. However, one big mistake is to capitalize a company’s EBIT or EBITDA as opposed to its net income or free cash flow. Depreciation and capex are real expenses – only bankers (people who couldn’t operate a VCR let alone a business) ignore them. MCD’s operating margin is 30% compared to CMG’s 8% - clearly MCD is run in a leaner way.
Dividends/Shareholders’ Equity (Payout Ratio) and Dividends/Market Capitalization (Dividend Yield): These ratios show how healthy a company is, assuming dividends are paid out of earnings and not borrowings or asset sales (a sign of impending doom). Remember, the end goal of all stockholders is to get a payout in cash or assets (per a dividend discount model). If this doesn’t occur, the stock was a Ponzi scheme. ―Growth‖ companies should be able to reinvest earnings at high rates of returns and shouldn’t pay dividends now (this assumes they pay dividends later). ―Value‖ or cash flow stable companies should pay out as much in dividends as they can now without disrupting the long-term potential of the business. Sometimes they should do so in a liquidation mode. Mature businesses that don’t pay dividends are signaling their impending doom or the agency problems since managers want to sit on cash (they usually find ways to spend it on perks or empire building). All bona fide growth companies need to transition into being mature, dividend paying companies at some point, as Starbucks did recently. CMG doesn’t pay dividends and it shouldn’t (yet). MCD has a stellar 1.08x payout ratio (it basically pays out more than net income, as it reinvests less than in the past), and its dividend yield is 3.3% in early April 2010.
Finally, as an analyst you need to look for the three or four ratios specific to the particular business and industry. These take creative intelligence to figure out. The best investors are the ones who can figure out what the ratios are for any industry and sub-industry, and then apply an x-ray focus on the essentials while ignoring the noise. I’m not sure if the skill can be taught. For the restaurant business, some ratios investors may consider are:
Sales/Total Square Feet (sales per square foot): This is a measure of sales and capital efficiency, as physical store space is one of the biggest fixed costs for the restaurant business. The ratio means more for retailers of hard goods. For CMG, this ratio is ~$610/sq foot, whereas MCD doesn’t make the total square feet clear (we will search the footnotes in a subsequent letter).
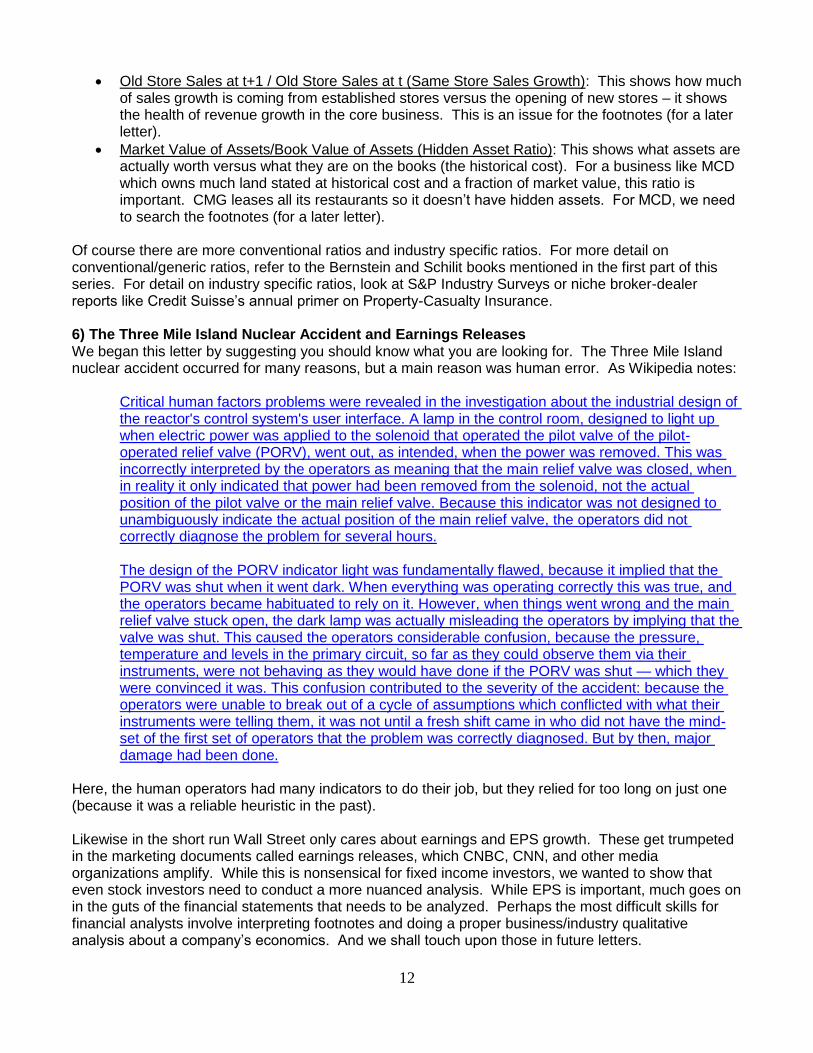
Old Store Sales at t+1 / Old Store Sales at t (Same Store Sales Growth): This shows how much of sales growth is coming from established stores versus the opening of new stores – it shows the health of revenue growth in the core business. This is an issue for the footnotes (for a later letter).
Market Value of Assets/Book Value of Assets (Hidden Asset Ratio): This shows what assets are actually worth versus what they are on the books (the historical cost). For a business like MCD which owns much land stated at historical cost and a fraction of market value, this ratio is important. CMG leases all its restaurants so it doesn’t have hidden assets. For MCD, we need to search the footnotes (for a later letter).
Of course there are more conventional ratios and industry specific ratios. For more detail on conventional/generic ratios, refer to the Bernstein and Schilit books mentioned in the first part of this series. For detail on industry specific ratios, look at S&P Industry Surveys or niche broker-dealer reports like Credit Suisse’s annual primer on Property-Casualty Insurance. 6) The Three Mile Island Nuclear Accident and Earnings Releases We began this letter by suggesting you should know what you are looking for. The Three Mile Island nuclear accident occurred for many reasons, but a main reason was human error. As Wikipedia notes:
Critical human factors problems were revealed in the investigation about the industrial design of the reactor's control system's user interface. A lamp in the control room, designed to light up when electric power was applied to the solenoid that operated the pilot valve of the pilot-operated relief valve (PORV), went out, as intended, when the power was removed. This was incorrectly interpreted by the operators as meaning that the main relief valve was closed, when in reality it only indicated that power had been removed from the solenoid, not the actual position of the pilot valve or the main relief valve. Because this indicator was not designed to unambiguously indicate the actual position of the main relief valve, the operators did not correctly diagnose the problem for several hours. The design of the PORV indicator light was fundamentally flawed, because it implied that the PORV was shut when it went dark. When everything was operating correctly this was true, and the operators became habituated to rely on it. However, when things went wrong and the main relief valve stuck open, the dark lamp was actually misleading the operators by implying that the valve was shut. This caused the operators considerable confusion, because the pressure, temperature and levels in the primary circuit, so far as they could observe them via their instruments, were not behaving as they would have done if the PORV was shut — which they were convinced it was. This confusion contributed to the severity of the accident: because the operators were unable to break out of a cycle of assumptions which conflicted with what their instruments were telling them, it was not until a fresh shift came in who did not have the mind-set of the first set of operators that the problem was correctly diagnosed. But by then, major damage had been done.
Here, the human operators had many indicators to do their job, but they relied for too long on just one (because it was a reliable heuristic in the past). Likewise in the short run Wall Street only cares about earnings and EPS growth. These get trumpeted in the marketing documents called earnings releases, which CNBC, CNN, and other media organizations amplify. While this is nonsensical for fixed income investors, we wanted to show that even stock investors need to conduct a more nuanced analysis. While EPS is important, much goes on in the guts of the financial statements that needs to be analyzed. Perhaps the most difficult skills for financial analysts involve interpreting footnotes and doing a proper business/industry qualitative analysis about a company’s economics. And we shall touch upon those in future letters.
Your 10-K reading and yelling analyst, Alpha [email protected] Copyright 2010 Risk Over Reward. All Rights Reserved
You have permission to publish this article electronically or in print as long as the following is included:
Risk over Reward: A conversation about intelligent investing – we discuss the nature of risk and uncertainty, macroeconomics, security valuation, and how to think about markets and invest profitably - http://www.riskoverreward.com/ Read our online posts at: http://www.riskoverreward.com/ Follow our tweets at: http://twitter.com/riskoverreward Subscribe to the newsletter at: http://blogspot.us1.list-manage.com/subscribe?u=8568d749127b61697bffe2b17&id=40b55d58d8 See Alpha’s reading recommendations here: Investment Classics