"INTRODUCTION TO PROJECT MANAGEMENT AND USE OF PRIMAVERA"Prepared ByMOHAMMED IMTHIYAZ M.AThanks to Mr. Mohammad Imthiyaz for his effort to prepare such a guide.Hope you will find this guide useful, expecially for the beginners
91
PROJECT MANAGEMENT USING PRIMAVERA VISVESVARAYA TECHNOLOGICAL UNIVERSITY BELGUAM-590014 A SEMINAR REPORT ON INTRODUCTION TO PROJECT MANAGEMENT AND USE OF PRIMAVERA SUBMITTED BY MOHAMMED IMTHIYAZ M.A UNDER THE GUIDANCE OF Dr.B.V. Kiran Kumar PROFESSOR DAYANANDA SAGAR COLLEGE OF ENGINEERING DEPARTMENT OF CIVIL ENGINEERING (HIGHWAY TECHNOLOGY) SHAVIGE MALLESHWARA HILLS, KUMARASWAMY LAYOUT,BANGALORE Depar tment Of Civil Engineering, D.S.C.E, Bangalore-78 1
Transcript
PROJECT MANAGEMENT USING PRIMAVERA
VISVESVARAYA TECHNOLOGICAL UNIVERSITY
BELGUAM-590014
A SEMINAR REPORT ON
INTRODUCTION TO PROJECT MANAGEMENT AND USE OF PRIMAVERA
SUBMITTED BY
MOHAMMED IMTHIYAZ M.A
UNDER THE GUIDANCE OF
Dr.B.V. Kiran Kumar
PROFESSOR
DAYANANDA SAGAR COLLEGE OF ENGINEERING
DEPARTMENT OF CIVIL ENGINEERING
(HIGHWAY TECHNOLOGY)
SHAVIGE MALLESHWARA HILLS, KUMARASWAMY LAYOUT,BANGALORE
Department Of Civil Engineering, D.S.C.E, Bangalore-78 1
PROJECT MANAGEMENT USING PRIMAVERA
DAYANANDA SAGAR COLLEGE OF ENGINEERING
SHAVIGE MALLESHWARA HILLS, KUMARSWAMY LAYOUT
BANGALORE-560078
DEPARTMENT OF CIVIL ENGINEERING
CERTIFICATE
This is to certify that seminar work entitled “PROJECT MANAGEMENT AND USE OF
PRIMAVERA” was presented by MOHAMMED IMTHIYAZ M.A, bearing USN 1DS08CHT01
student of 2nd semester, M.Tech Highway Technology, Department of Civil Engineering, in the
partial fulfillment for the award of M.Tech in Highway Technology under the Visvesvaraya
Technological University (VTU), Belgaum, during the year 2008-09. The report is approved as it
satisfies the academic requirements in respect of SEMINAR WORK prescribed for the Post
Graduation degree.
Seminar Guide Head of Department
Dr. B.V. Kiran Kumar Dr. B.S Thandaveswara
Asst. Professor Professor and Head of Department
Department of Civil Engineering Department of Civil Engineering
DSCE, Bangalore-560 078 DSCE, Bangalore-560 078
Department Of Civil Engineering, D.S.C.E, Bangalore-78 2
PROJECT MANAGEMENT USING PRIMAVERA
CHAPTER 1
INTRODUCTION TO PROJECT MANAGEMENT
1.1 INTRODUCTION
A project is a unique, one-time endeavor with a specific start and end, and a strict
budget. Generally, projects are performed by people who have limited experience
working together as a team. It’s also likely that some project participants will work off-
site at several locations. These constraints often make project management difficult and
complex.
At the conceptual level, project management is the process of thinking carefully about
what you want to accomplish, laying out all the steps, and obtaining the resources
required to carry out those steps. At the practical level, project management is your
response to the problems, delays, changes, and obstacles—and, sometimes,
opportunities—that arise during the course of a project.
Planning a project is fun: working out who does what, when, where, and with whom.
The crucial part of successful project management, however, is the actions you take
after the plan is created. Successful project management requires dedication and
constant vigilance: finding out what really happened, how much was actually
accomplished, what remains to be done, and who will be available to do it. You must be
prepared for the future. You need contingency plans that can handle the inevitable
everyday realities of running the project.
Although no shortcuts exist for managing projects, some tools and practices can help
prepare you for the job. Using project management software can organize your thinking
and identify potential problems. Following established project procedures ensures that
you inform the team about options, alternatives, and workarounds efficiently and in time.
And presenting your project to upper management clearly and convincingly makes it
easier to obtain their support when you need it. These are the most important reasons
to use Primavera to make managing projects easier, especially when you encounter
difficulties.
Before implementing Primavera to schedule projects, participants should understand
the processes involved in project management and the associated recommendations
Department Of Civil Engineering, D.S.C.E, Bangalore-78 3
PROJECT MANAGEMENT USING PRIMAVERA
that help smooth implementation of the software that helps you reach your goals. You
should also understand the steps for updating your projects once they are underway. If
your projects have already started, you may want to incorporate or adjust your existing
methodology for planning new projects or updating existing ones. In the various stages
of the project life cycle, the key elements that should guide your decisions are planning,
controlling, and managing.
Planning the project means thinking about and documenting what needs to be done,
defining and coordinating specific activities and work tasks, preparing work schedules,
assigning and allocating resources to competing activities, and developing an
acceptable budget.
Controlling the project means staying on course, measuring performance, suggesting
corrective action when needed, evaluating options, and devising workarounds. You
inform the team about progress and advise them where their performance needs
improvement. Then they make the improvements.
Managing means communicating as accurately as possible with the project team, the
client, and your own management about what has happened, what may happen, what
you will do about it, and what cannot be changed. You motivate the team to do its best.
You help the team get support, resources by presenting accurate and timely information
to the right people.
Planning and controlling process The following illustration summarizes the steps in
the planning and control process:
Department Of Civil Engineering, D.S.C.E, Bangalore-78 4
PROJECT MANAGEMENT USING PRIMAVERA
Figure 1 Planning and control process
Updating process Once your project schedule is in place, your team members are
aware of their roles in controlling it, and you have established a communication system
between team members and groups within your organization, you should follow a
systematic update process. Updating the schedule on a regular basis and comparing it
with the baseline ensures that you are using resources effectively, monitoring project
costs against budget, and keeping abreast of actual durations and costs so you can
initiate your contingency plan if necessary.
Remember that you can use Primavera in combination with other programs to help you
assess project goals from an enterprise-wide perspective. Use Primavera with SureTrak
Project Manager to incorporate smaller projects or project members into the Primavera
schedule; use it with Monte Carlo for Primavera to analyze risks involved with selected
aspects of a project; and use it with Webster for Primavera to collect employee resource
hours spent on projects and roll them into actual durations and costs in Primavera.
Department Of Civil Engineering, D.S.C.E, Bangalore-78 5
PROJECT MANAGEMENT USING PRIMAVERA
These Primavera products, in combination with communication and database access
tools such as E-mail and Structured Query Language (SQL), can give you the
information you need, when you need it, wherever you are.
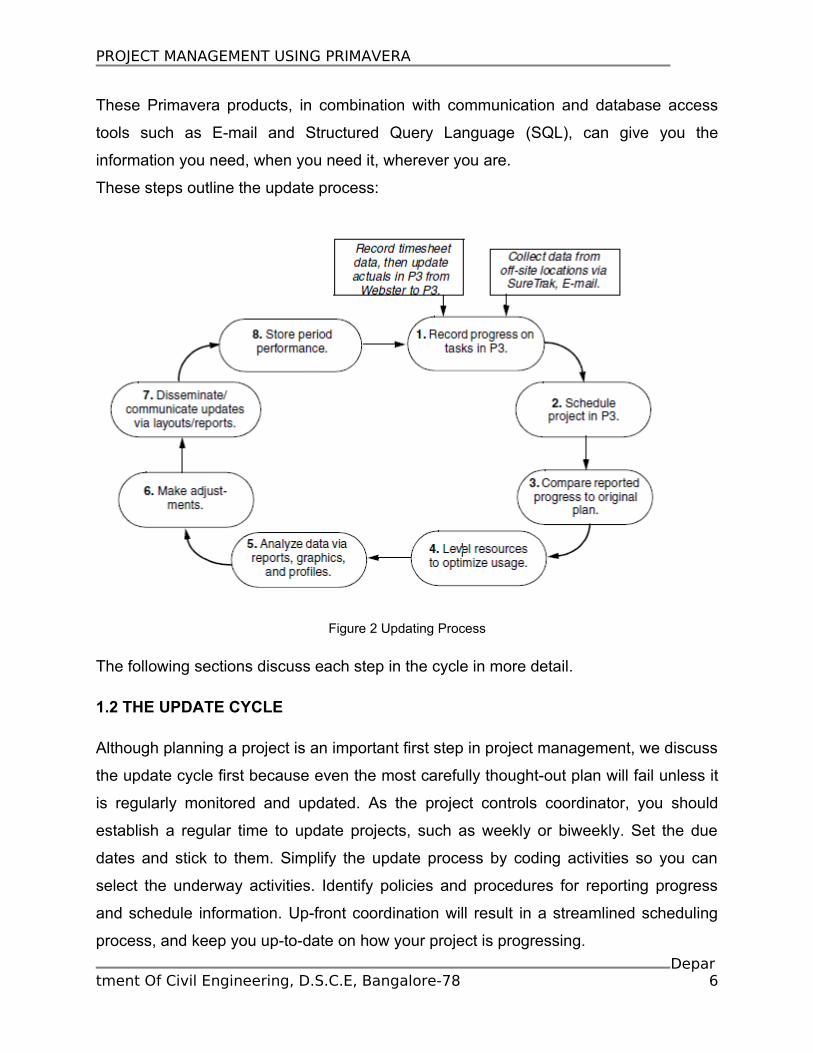
These steps outline the update process:
Figure 2 Updating Process
The following sections discuss each step in the cycle in more detail.
1.2 THE UPDATE CYCLE
Although planning a project is an important first step in project management, we discuss
the update cycle first because even the most carefully thought-out plan will fail unless it
is regularly monitored and updated. As the project controls coordinator, you should
establish a regular time to update projects, such as weekly or biweekly. Set the due
dates and stick to them. Simplify the update process by coding activities so you can
select the underway activities. Identify policies and procedures for reporting progress
and schedule information. Up-front coordination will result in a streamlined scheduling
process, and keep you up-to-date on how your project is progressing.
Department Of Civil Engineering, D.S.C.E, Bangalore-78 6
PROJECT MANAGEMENT USING PRIMAVERA
Update activities or driving resources Track who did what and how much it cost so
that you can improve future estimates. Record how long it takes to perform each activity
or resource, how much of the work is actually accomplished, and how much more time
you expect will be required to finish the activity. If you are updating Primavera with
timesheet data from Webster for Primavera, Primavera updates actual this-period
durations, quantities, and costs for you. Make sure the data you use for your analysis
are accurate.
Integrate project data from remote sites using the Primavera Post Office application to
have off-site personnel update activities using a predefined status sheet, then E-mail
them back for scheduling at the manager’s site. An Expected Finish constraint column is
included on the status sheet so team members updating their status can see when work
is expected to finish. You can send Email from either Primavera or SureTrak. If you do
not use the status sheet, you can use the Mail feature in PRIMAVERA to send and
receive project information and incorporate it in the schedule for updating. Because all
Primavera products use the Btrieve database engine, you can also access information
from other Open Database Connectivity (ODBC)-compliant databases, such as
Microsoft’s Excel, Word, and Access, Corel’s Quatro Pro and Paradox, and Lotus 1-2-3,
among others. Additionally, you can use report writers such as InfoMaker that
communicate with Primavera via ODBC. Primavera software also provides
import/export capabilities to and from spreadsheet and dBASE applications, which helps
expedite data entry in large projects. Communication with other types of software
broadens your data-retrieval base so you can access the project information you need
whether you are on-site, at a remote office, or traveling.
Schedule the project Once you gather all the data you need from various sites and
other programs/databases, you can schedule your projects. Before you press F9 to
calculate a schedule, make sure you have set the Autocost rules in accordance with the
project plan and have set up the series reports/graphics to be generated after the
scheduling run. You may choose to have Primavera automatically schedule whenever
you change data that affect calculated schedule dates. You may also want to use the
Progress Spotlight and Update Progress features to visually identify which activities Depar
tment Of Civil Engineering, D.S.C.E, Bangalore-78 7
PROJECT MANAGEMENT USING PRIMAVERA
were scheduled in the current update period and automatically status their progress if
they are on schedule. The project controls coordinator should have previously
established schedule/level procedures for all project managers in the company.
Compare reported progress to the original plan This is the best way to know
whether the project is on track. If the team is slipping behind, identify the impact it will
have on the schedule and develop a course of action to move forward faster. If you
cannot regain time, make sure everyone knows about the delay so they can adjust their
own schedule. Consider whether delays early in the project will ultimately save time
later. For example, a usability seminar may prevent Designers on the Development
team from meeting their deadlines, but the information they glean from the seminar may
save development time later.
Level resources Resolve conflicts with other activities that use the same resources.
Check that your schedule doesn’t call for more than the normal availability of resources:
level your resource plan and examine the resource-use profiles to determine whether
the plan contains hard-to-manage peaks and valleys. If you use the Store Period
Performance function to store period actuals, you can compare historical and current
data to gauge trends in resource use and make future-use projections, or re-evaluate
your distribution plan. Use crunching, stretching, and/or splitting leveling techniques for
the best resource utilization based on current requirements. You may choose to have
Primavera automatically level whenever you change data that affect calculated level
dates.
Analyze output After you schedule and level, customize layouts to analyze the data
onscreen; review the Bar chart onscreen together with resource profiles. If problem
areas become apparent, perform a more detailed analysis by examining PRIMAVERA
reports, including matrix reports, resource loading and control reports, custom reports
you have set up using the Report Writer, and any schedule reports. You can run all of
these automatically through the reporting provided in primavera.
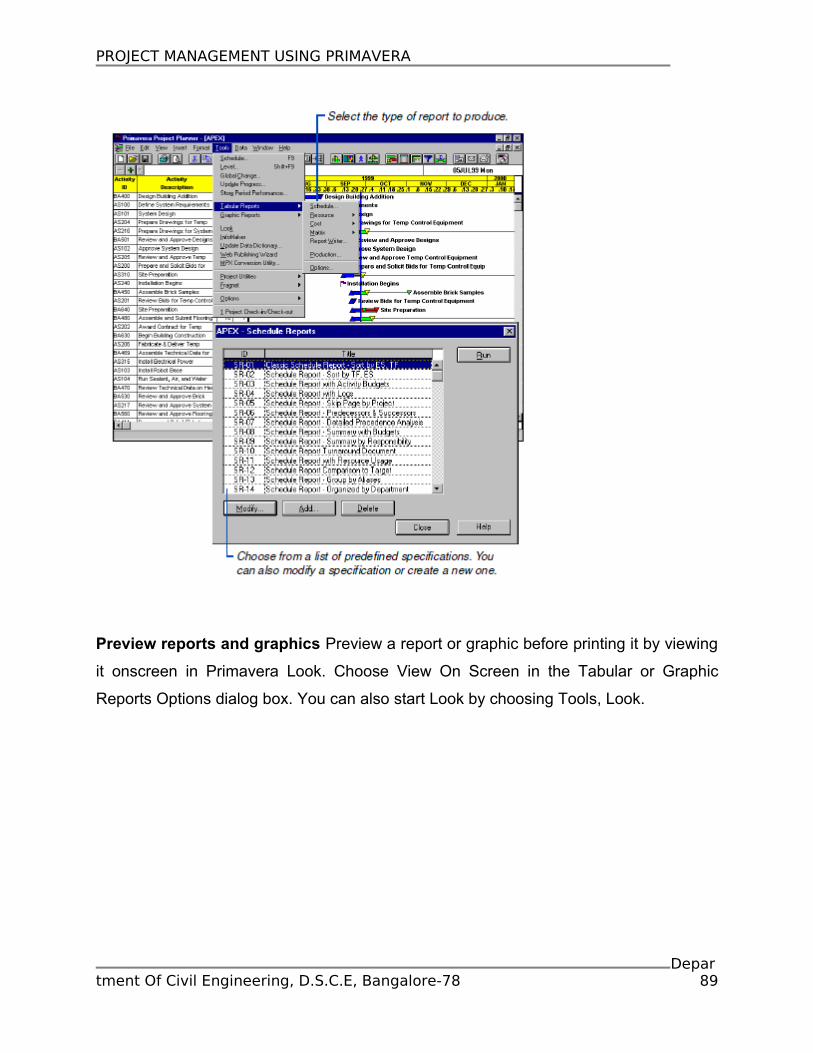
You should select reports and graphics that enable you to track work progress and
actual costs, compare progress and costs to baseline, and forecast trends so you can
recommend action. You need to ask yourself whether project objectives are being met Depar
tment Of Civil Engineering, D.S.C.E, Bangalore-78 8
PROJECT MANAGEMENT USING PRIMAVERA
by looking at output or onscreen outcome. Will the project finish on time? Is it within
budget? Are resources being used effectively?
Adjust the schedule If, after careful planning, updating, and leveling, the project is
behind schedule, the resources promised were reallocated, costs are exceeding your
original budget estimate, a sponsor withdrew funding, or any one of many other likely
events occurs, you need to implement your contingency plan and/or adapt your
schedule to the changed requirements these conditions cause.
Iteratively adjust resource availability in the Resource Dictionary then use leveling until
you achieve the results you want. Stretch resource use during some work periods and
crunch it during others, and use these in combination with splitting activities to optimize
resource use during noncontiguous work periods. Use the different types of primavera
constraints to make the activity network accurately reflect project requirements.
Experiment with these and other methods to maintain control and stay on target.
Communicate, communicate, communicate How you do this must be made clear as
part of the project plan. If teams don’t know what’s going on, they cannot do their job
effectively. Decide who should be involved, what needs to be communicated to them,
and where and when it will be communicated. You can communicate by distributing the
updated schedule at a set time each week, having a monthly status meeting, or sending
reports to managers for their specific resources (employees).
Use schedule reports, Bar charts, and timescaled presentations that are easy to
understand. Show progress and highlight problem areas. Make the project issues
evident. Remember that the level of detail for each report should be appropriate to its
audience. Enterprise- wide dissemination of up-to-date project data is the key to
reaching your collective goals in the world of project management.
Department Of Civil Engineering, D.S.C.E, Bangalore-78 9
PROJECT MANAGEMENT USING PRIMAVERA
CHAPTER 2
THE PROJECT PLAN
As the manager responsible for one or more projects, you should establish the scope of
your projects(s), then meet with the project controls coordinator to develop an initial plan
and determine the level of detail and amount of monitoring that are appropriate to each
project for which you are responsible. Consider the following questions as you establish
the requirements for each project plan:
• What are the company’s goals, and how will the project support those goals?
• What is the overall budgeted estimate (duration and cost) of this project?
• What resources are available to me?
• How detailed a plan is appropriate?
• How often will I update the plan?
• Who needs to receive information about progress?
• What kinds of reports will I prepare?
• What graphics and layouts will help me communicate best?
• How much time can I afford to spend on project management?
Take the time up front to determine how you can effectively communicate the right
information to the right people at the right time.
Make a detailed list of activities Estimate how much time will be needed for each
activity, and define how activities relate to one another. Assign a responsible person to
each activity so that when you update the plan you’ll know who to ask for accurate
information.
Prepare a network diagram that shows relationships between activities Creating a
network diagram is an iterative process best done with the team members who will do
the work. No one knows better than the team what has to be done and why, and what
sequence makes sense. More often than not, you will modify the diagram several times
until the logic is sound and activities seem to flow correctly.
Department Of Civil Engineering, D.S.C.E, Bangalore-78 10
PROJECT MANAGEMENT USING PRIMAVERA
Identify the critical path—the chain of activities that will require the most time to
complete Find ways to simplify the project. Explore options to compress the schedule
by performing activities in parallel. Consider whether you will have sufficient resources
to accomplish several tasks at once. Eliminate negative float by modifying the network.
Build a complete plan When you are satisfied with the basic schedule, apply the
resources to the activities. Although the schedule indicates required actions and when
they must be done, resources—people, equipment, material, and money—do the work.
Make sure you will have required resources when you need them.
Consider the tradeoff of time and money your plan represents
Could you deliver the finished project sooner if you had more money or more
resources? Are these factors worth thinking about before you seek approval of the
plan? Compare costs, list requirements, check assumptions with the project team, and
refine the plan. Then obtain agreement—and commitment— from the team and begin
work.
Organize your project information Categorize activities by phase, responsibility,
department, and location. Set priorities. Make it easy to retrieve and analyze
information. Summarize unnecessary detail. Sharpen your presentation by focusing on
the key elements.
Ask “what-if?” What could happen that you have not yet anticipated?
What would happen if a key resource were diverted to another job? What would happen
if the budget were cut by 10 percent? The new design uses less material but will
manufacturing be able to hold the tolerances? How much time would redesign cost?
Anticipate change, not because disaster will strike, but because you want to have
contingency plans in place in case it does. Know how all the pieces fit together, and
think about the interaction among the pieces.
Plan, control, manage, communicate, and think This is the process of project
management.
Department Of Civil Engineering, D.S.C.E, Bangalore-78 11
PROJECT MANAGEMENT USING PRIMAVERA
CHAPTER 3
WHAT IS SPECIAL ABOUT PRIMAVERA
Primavera is special because project managers designed it for project managers.
Project managers ask many questions—it seems to be their one common characteristic:
“When will this be finished?” “Who’s doing the work?” “What happens if...?” “Suppose
we...” Primavera answers questions quickly, easily, and accurately. You can select
information from the database, sort data in dozens of different ways, condense details,
and prepare graphic presentations—al without knowing anything about computers or
database languages.
Primavera helps you from the moment you begin thinking about a project. Building the
original network and organizing the project data in PRIMAVERA are simple. Use PERT
to quickly add activities in a logic or flow diagram format, where boxes represent each
activity; then use the Bar chart, which is a timescaled spreadsheet, to review the
schedule. If you prefer to remain in PERT, you can organize activities using a
timescaled PERT layout to review the schedule by early start date.
After you develop a list of activities, you can easily connect them to define the network
logic by pointing to the finish of one box or bar and dragging a relationship line to the
start of the next bar. Or you can select an entire group of activities, click the Link icon on
the toolbar, and have primavera automatically define conventional relationships for you.
You can also turn on the Autolink feature to create conventional relationships between
activities as you add them in either view.
Primavera makes it easy for you to organize project data. Primavera helps you structure
your project data. This structure is the power of the software. Organize projects at the
project group level using a common attribute, such as project manager, status, or
location. Organize individual projects into multiple groups that are meaningful to you;
for example, band activities by responsibility, area, phase, resource, or weekly calendar
dates. Make each band a different color and font for effective communication and
presentation, or group data items into one band for each combination of values. Focus a
presentation by extracting only the information you want, when you want it, the way you
want it. You can also design your own data items for activities, resources, and costs and
Department Of Civil Engineering, D.S.C.E, Bangalore-78 12
PROJECT MANAGEMENT USING PRIMAVERA
globally enter or modify data using your own calculations to save time. Primavera
simplifies tracking resources and costs. Primavera’s resource and cost controls are
straightforward. Because all project data are integrated, primavera automatically reflects
changes in unit prices throughout the project. As you record actual data, primavera
automatically revises estimates to complete. In fact, advanced users specify the method
primavera uses to reflect progress by setting simple calculation rules.
Primavera helps you assemble achievable plans through its comprehensive approach to
resource assignment. Allocate a resource across one or several activity. Identify the
activities that are driven by their assigned resources and then let primavera calculate
the impact of resource limitations and time constraints on your schedule. Primavera
quickly identifies potential problems and delays. You can even compare normal vs.
overload staffing on your schedule in onscreen histograms and curves. If usage
exceeds availability, perform a quick “what-if” analysis by graphically adjusting durations
or delaying activities so you can see the effects on resource distribution immediately.
Once your projects are underway, primavera enables you to store actual quantity and
cost data per update period so you can compare historical information to the current
period using resource profiles and reports.
PRIMAVERA lets you constrain activities When you want to impose restrictions on
certain activities to meet external requirements, PRIMAVERA makes it easy by
providing 10 types of constraints, such as early start or early finish dates that you enter.
You can also invoke different techniques to optimize resource allocation. For example,
stretch (reduce) use during some workperiods and crunch (increase) it during others.
You can also split resources in either situation so PRIMAVERA can automatically
suspend and resume work during a noncontiguous workperiod. PRIMAVERA gives you
the scheduling flexibility you need without changing original goals.
PRIMAVERA simplifies the update process If your project is progressing exactly as
planned or if you only need to estimate progress, you can use the Progress Spotlight
feature to highlight the activities that should have been worked on during a specified
timeperiod. You can also drag the data date line to a specific date to highlight the
activities that fall between the last data date and the new data date.
Department Of Civil Engineering, D.S.C.E, Bangalore-78 13
PROJECT MANAGEMENT USING PRIMAVERA
Once you spotlight activities, you can automatically status them, manually update them,
or cut or copy them. You can also show a progress line in the Bar chart to graphically
trace progress on underway activities to see an overall picture of how a project is
performing.
PRIMAVERA helps you update from off-site locations The Primavera Post Office
gives you remote control of project integration from off-site locations using your mail
system to help you collect data, update activity progress, record resource use, and
enter actual costs. You can also update using timesheet data from Webster for
Primavera.
PRIMAVERA easily gathers and consolidates information from various sources and
updates it according to your scheduling needs. With a project’s collective parts
potentially existing anywhere in the world, PRIMAVERA keeps pace.
PRIMAVERA helps you show and tell You can easily print the PERT or Bar chart
information and layout you see onscreen. You can change visual aspects of your project
onscreen, preview it, and then print it when you are ready. But, if you want to change
elements of your onscreen display (such as header or footer information), you can use
primavera’s options for customizing printed displays.
Department Of Civil Engineering, D.S.C.E, Bangalore-78 14
PROJECT MANAGEMENT USING PRIMAVERA
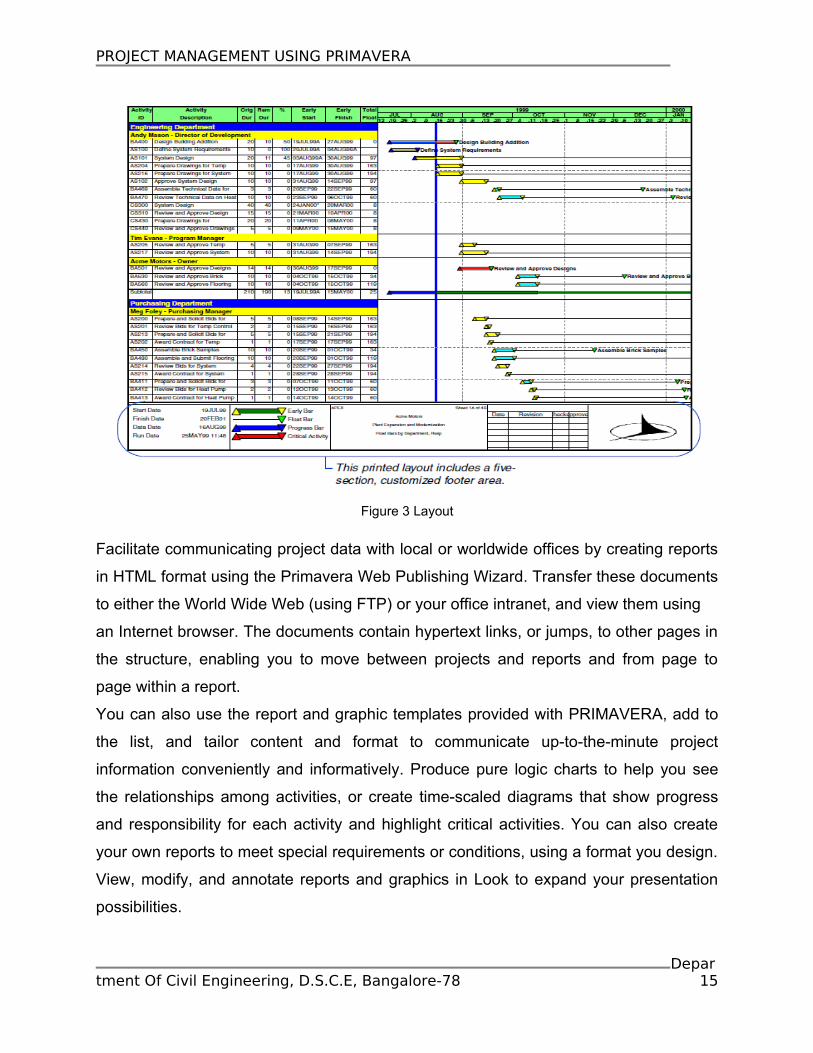
Figure 3 Layout
Facilitate communicating project data with local or worldwide offices by creating reports
in HTML format using the Primavera Web Publishing Wizard. Transfer these documents
to either the World Wide Web (using FTP) or your office intranet, and view them using
an Internet browser. The documents contain hypertext links, or jumps, to other pages in
the structure, enabling you to move between projects and reports and from page to
page within a report.
You can also use the report and graphic templates provided with PRIMAVERA, add to
the list, and tailor content and format to communicate up-to-the-minute project
information conveniently and informatively. Produce pure logic charts to help you see
the relationships among activities, or create time-scaled diagrams that show progress
and responsibility for each activity and highlight critical activities. You can also create
your own reports to meet special requirements or conditions, using a format you design.
View, modify, and annotate reports and graphics in Look to expand your presentation
possibilities.
Department Of Civil Engineering, D.S.C.E, Bangalore-78 15
PROJECT MANAGEMENT USING PRIMAVERA
PRIMAVERA helps you every step of the way primavera suggests the right answer to
every question you ask it and presents the right set of choices whenever decisions are
required. And primavera’s Help system tells you precisely what you need to know, every
step of the way.
PRIMAVERA easily handles large projects primavera handles even the largest, most
complex projects being performed today. But this power stays quietly in the background,
making no demands of you.
Department Of Civil Engineering, D.S.C.E, Bangalore-78 16
PROJECT MANAGEMENT USING PRIMAVERA
Chapter 4
THE PARTS OF THE PRIMAVERA WINDOW
The Primavera window contains several elements that enable you to access information
quickly and easily using either a mouse or the keyboard. The following example shows
the parts of the Primavera window using the Bar chart view; except for the edit bar, the
elements and functionality are the same in either the Bar chart or PERT.
Figure 4 Sample Layout
The default Bar chart layout consists of Activity columns on the left side and bars on the
right side. Determine how much of each side or pane to display by dragging the vertical
split bar to the left or right.
What Is a Layout?
You can customize nearly any part of the PRIMAVERA Bar chart and PERT view to
show different aspects of a project. For example, you can format columns and bars to
meet your specific needs. Choose from a long list of schedule, resource, cost, and
coding items to tailor activity information. Modify the size, endpoints, colors, and
Department Of Civil Engineering, D.S.C.E, Bangalore-78 17
PROJECT MANAGEMENT USING PRIMAVERA
schedule dates on bars in the Bar chart and activities in PERT. Organize project
information by grouping activities using meaningful codes, such as department or
responsibility.
When you customize the Bar chart or PERT view by modifying items such as columns,
colors, shapes, fonts, activity selection, and by grouping, you are creating a layout. A
layout is one view of project data. You and anyone else working on the project can
define as many different layouts as you need for a project. For example, you may create
a layout just for updating schedule data and another for analyzing resources and costs
with your own set of color and font choices. Your manager may want to view only
summary information, using colors he or she specifies. You can save layout
specifications so that once you create and fine-tune them you can use them again and
copy them to other projects.
Sample Layouts
Primavera enables you to plan, organize, and manage your projects using Bar chart and
PERT layouts. A Bar chart layout combines an activity-data spreadsheet (table) with a
timescaled Bar chart, while a PERT layout shows the logical flow of activities. Use the
spreadsheet to add, review, or modify rows or columns of data. The Bar chart shows the
corresponding schedule with activity bars positioned along a timescale. Use PERT to
construct your project plan, adding activities and relationships in a logical flow.
Department Of Civil Engineering, D.S.C.E, Bangalore-78 18
PROJECT MANAGEMENT USING PRIMAVERA
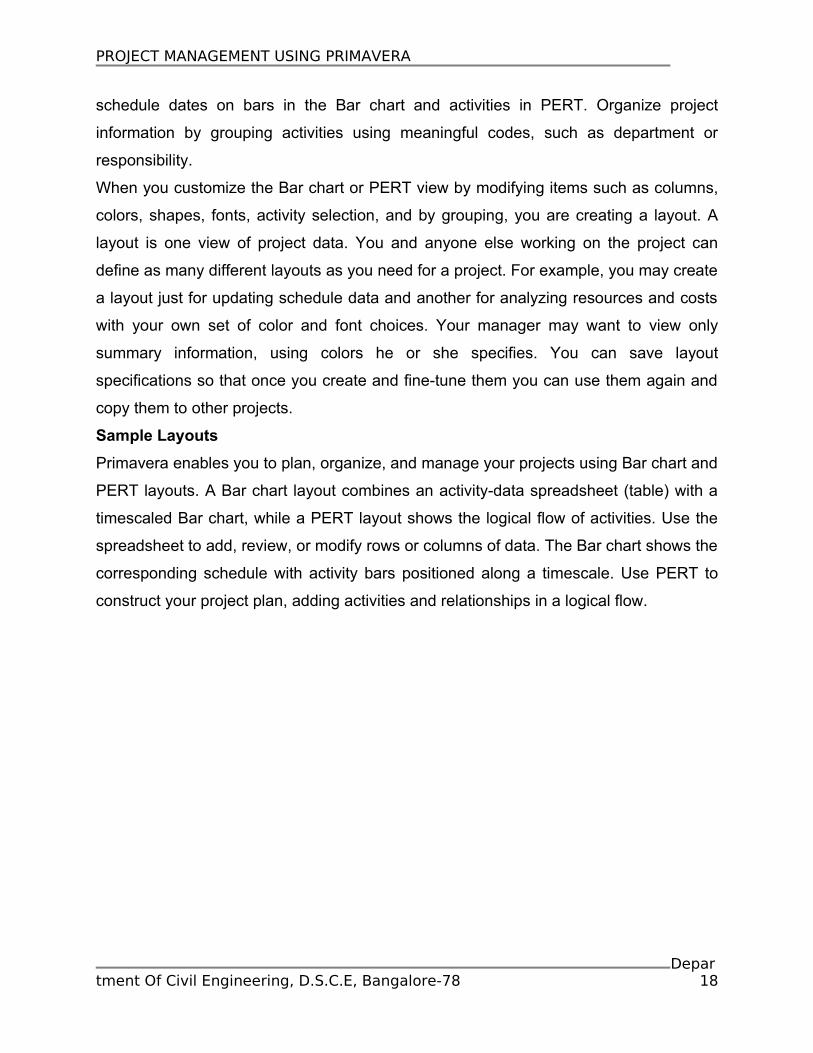
Figure 5 Bar Chart
You can adjust the size of each area of the Bar chart to show more or less data. For
example, when you’re reviewing the schedule, show just the Bar area. This layout
compares target bars to early bars and includes group title bands in the Bar area.
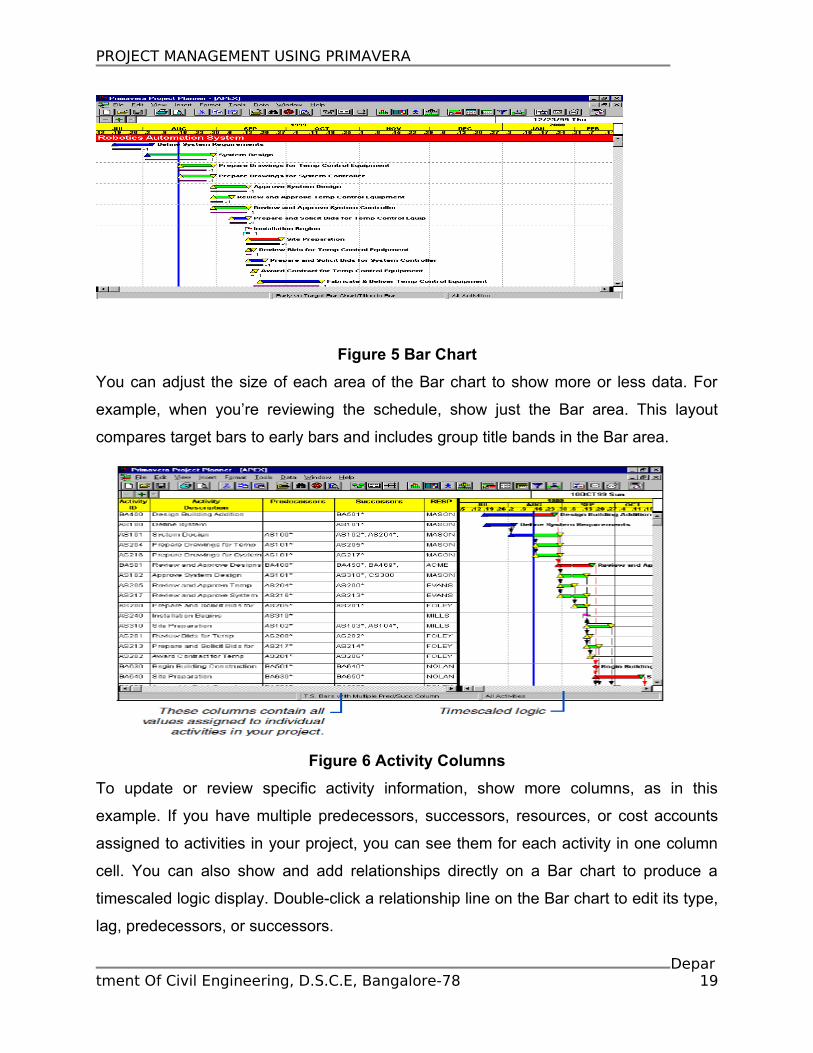
Figure 6 Activity Columns
To update or review specific activity information, show more columns, as in this
example. If you have multiple predecessors, successors, resources, or cost accounts
assigned to activities in your project, you can see them for each activity in one column
cell. You can also show and add relationships directly on a Bar chart to produce a
timescaled logic display. Double-click a relationship line on the Bar chart to edit its type,
lag, predecessors, or successors.
Department Of Civil Engineering, D.S.C.E, Bangalore-78 19
PROJECT MANAGEMENT USING PRIMAVERA
Figure 7 PERT
Examine the logical flow of activities in PERT. Build the network and change the
sequence of events as the project progresses. You can also show an Activity form at
the bottom of either PERT or the Bar chart that shows detailed information about a
selected activity.
Figure 8 Timescaled PERT
Timescaled PERT allows you to see activities and relationships along a daily, weekly, or
monthly timescale based on relationships or early/actual start date. You can also
display Trace Logic in either PERT or timescaled PERT to focus on an activity’s
predecessors and successors.
Department Of Civil Engineering, D.S.C.E, Bangalore-78 20
PROJECT MANAGEMENT USING PRIMAVERA
Figure 9 Activity Detail Forms
Use the Log form as an electronic notepad to enter and track additional information
about an activity. You can display logs with the activity bars, as shown in this example.
Use the buttons along the top of the Activity form to display other detailed forms in
which you can enter and review additional data, such as budgets, resource
assignments, predecessors, and successors.
Figure 10 Group by Category
You can change the organizational scheme for project data at any time. This example
shows activities grouped by the Phase activity code in the Automation System project.
The headings on the left, such as Design and Engineering Phase, indicate the specific
Department Of Civil Engineering, D.S.C.E, Bangalore-78 21
PROJECT MANAGEMENT USING PRIMAVERA
group. The Cosmic View, to the right of the window shows activities at a smaller zoom
level so you can navigate easily through the project.
Figure 11 Group by Dates
You can also group activities according to their schedule dates by days, weeks, months,
or years on a Bar chart. This example groups early start dates on a monthly basis and
focuses on resource use. The bars are customized using a diagonal cross-hatch pattern
that is color coded by project ID. Use this type of display to quickly review activities
scheduled in the months ahead.
Figure 12 Group by Resource
Department Of Civil Engineering, D.S.C.E, Bangalore-78 22
PROJECT MANAGEMENT USING PRIMAVERA
Group by resource to produce a detailed list of activities for each resource in a project.
You can specify the back-ground color, font, and point size for the title bands when you
group. In this example, activities are grouped by resource within each department.
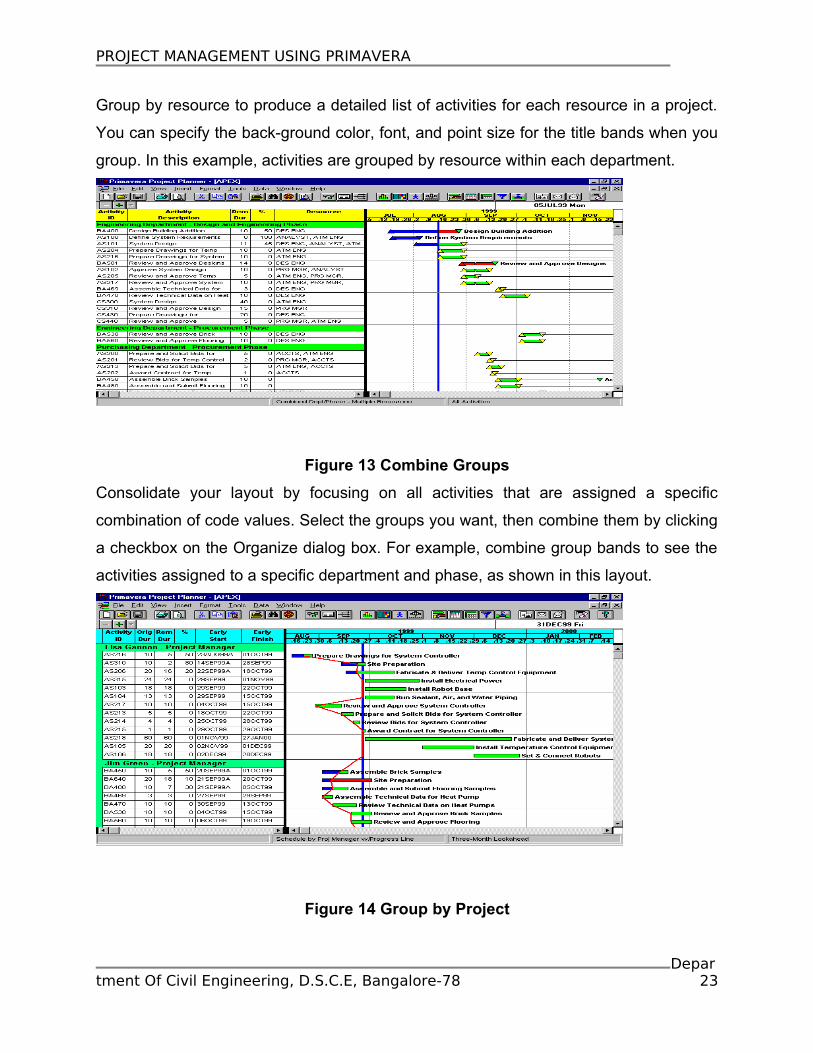
Figure 13 Combine Groups
Consolidate your layout by focusing on all activities that are assigned a specific
combination of code values. Select the groups you want, then combine them by clicking
a checkbox on the Organize dialog box. For example, combine group bands to see the
activities assigned to a specific department and phase, as shown in this layout.
Figure 14 Group by Project
Department Of Civil Engineering, D.S.C.E, Bangalore-78 23
PROJECT MANAGEMENT USING PRIMAVERA
If your project group contains many member projects, assign project codes for better
manageability. This example is organized by the project manager for each project in the
group. The Bar chart shows the progress line, indicating which underway activities are
ahead or behind schedule, based on target dates.
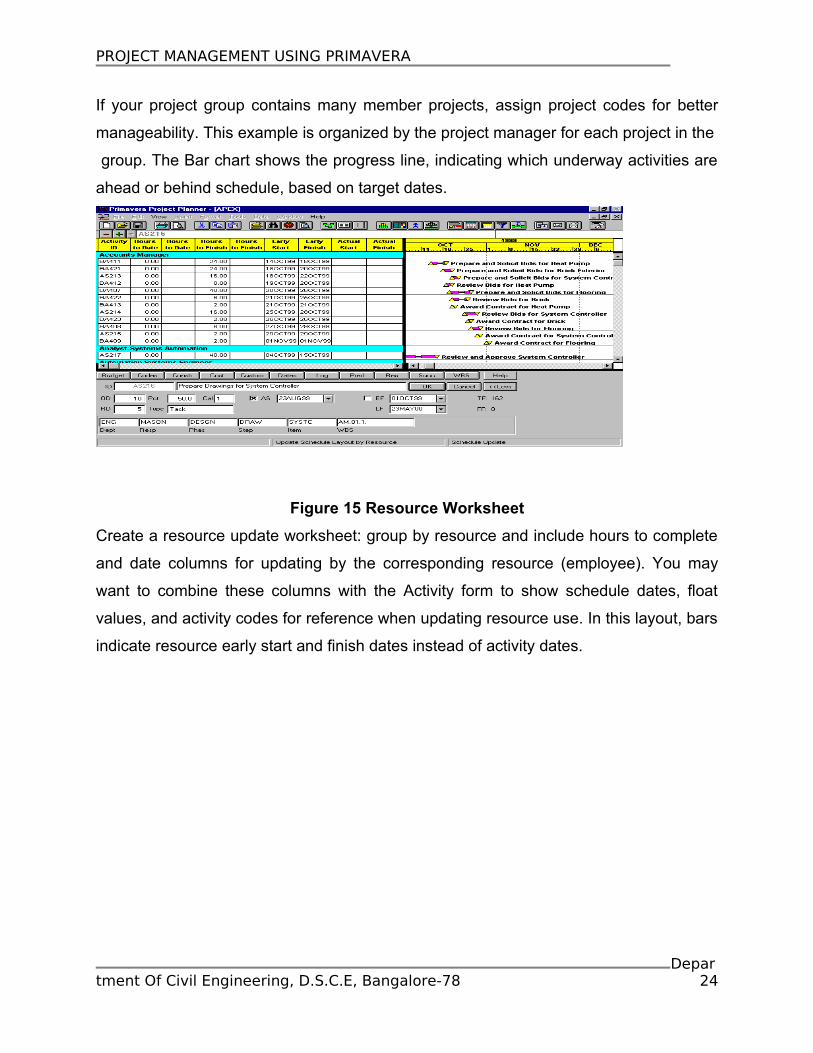
Figure 15 Resource Worksheet
Create a resource update worksheet: group by resource and include hours to complete
and date columns for updating by the corresponding resource (employee). You may
want to combine these columns with the Activity form to show schedule dates, float
values, and activity codes for reference when updating resource use. In this layout, bars
indicate resource early start and finish dates instead of activity dates.
Department Of Civil Engineering, D.S.C.E, Bangalore-78 24
PROJECT MANAGEMENT USING PRIMAVERA
Figure 16 Resource/Cost Profile
A resource or cost profile uses the same timescale as the Bar chart so you can analyze
resource levels together with the schedule. If resource use exceeds availability, you can
modify the logic structure and see the effect on resource use immediately. If you store
period performance, actual quantities and costs are saved for each schedule update
period so you can compare current and historical data.
Figure 17 Resource/Cost Table
Create a resource loading report onscreen to show resource use or costs expended per
timeperiod. You can show total, peak, or average amounts.
Department Of Civil Engineering, D.S.C.E, Bangalore-78 25
PROJECT MANAGEMENT USING PRIMAVERA
Figure 18 WBS Outline
You can also view an outline of a project based on its work breakdown structure (WBS).
Define up to 20 levels of WBS codes, with each level indented to show the hierarchy.
This layout also summarizes data to level 2 of the WBS each column of data is totaled,
and a summary bar is shown.
Department Of Civil Engineering, D.S.C.E, Bangalore-78 26
PROJECT MANAGEMENT USING PRIMAVERA
Figure 19 Summary Layout
You can summarize detailed data on a Bar chart—just double-click the title band.
PRIMAVERA summarizes data in the Activity columns and shows a summary bar. In
this example, data are rolled up by division. A quarterly cost profile for the summary is
also shown.
Department Of Civil Engineering, D.S.C.E, Bangalore-78 27
PROJECT MANAGEMENT USING PRIMAVERA
CHAPTER 5
HOW TO USE PRIMAVERA
5.1 Getting Started
The first step is to open the installed programme:
Select the Primavera Project Planner icon in the Primavera programme folder.
Department Of Civil Engineering, D.S.C.E, Bangalore-78 28
PROJECT MANAGEMENT USING PRIMAVERA
You may be asked for a User Name and password. Unless defined otherwise in the set
up, your password is the same as the user name. The user name is as defined in set
up.
To start on your first programme you need to select the menu “File” and Option “New”
Department Of Civil Engineering, D.S.C.E, Bangalore-78 29
PROJECT MANAGEMENT USING PRIMAVERA
This will open this menu on-screen:
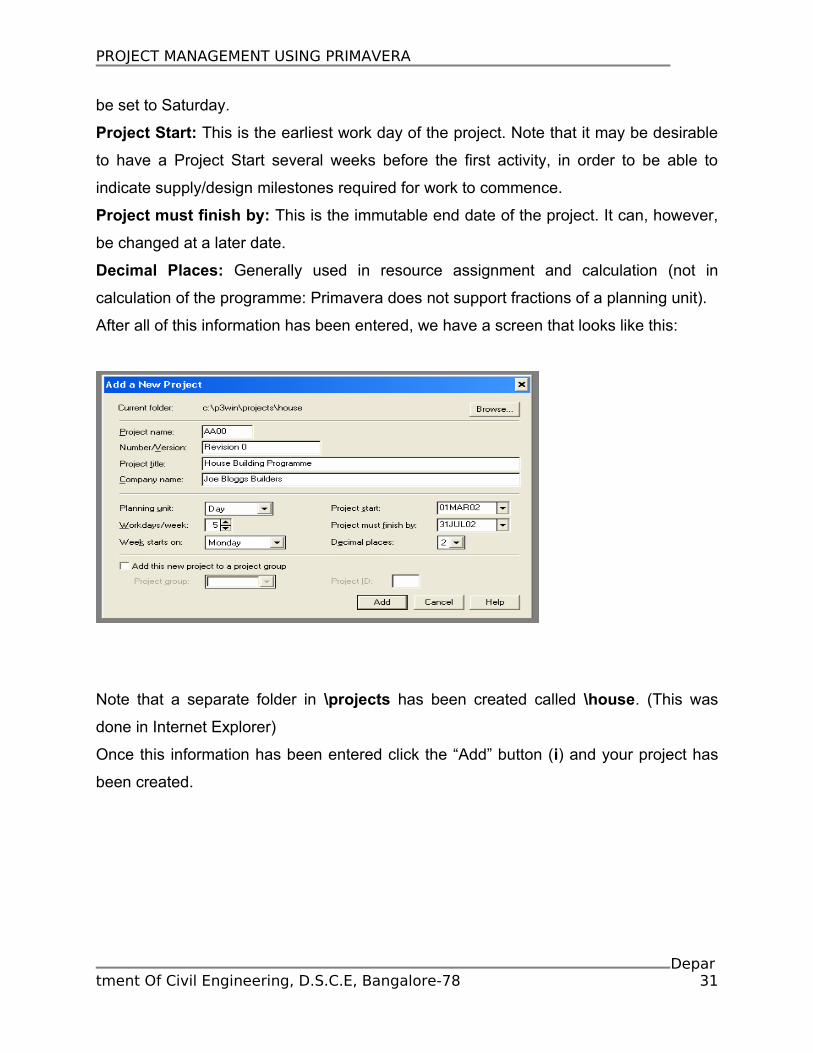
Project Name: This is a 4 character code that will identify your programme. It can be
any alphanumeric character.
Note that the new project will be saved in the folder c:\Primaverawin\projects. It is good
practice to set up a “Project” folder which will keep the project files together in one
place. The reason for this is that a Primavera project consists of 24 individual files: a
single folder containing several projects would have hundreds of files in it!
Number/Version: This indicates the revision number of the programme.
Project Title: This is the title of the current project
Company Name: This is the name of the company for whom this work is being done.
Planning Unit: This is the planning unit of the programme: it is the minimum duration
(except 0) of any activity. It can be any unit from Hour to Month.
Workdays/week: This sets up, on your base calendar, your working days schedule.
Week starts on: This is the first day of the week. For instance, 5 workdays a week in a
week starting on Monday would mean Monday to Friday are work days.
In some countries there is a six day working week, starting on Saturday. Thus there
would be 6 workdays/week and the Week starts on would
Department Of Civil Engineering, D.S.C.E, Bangalore-78 30
PROJECT MANAGEMENT USING PRIMAVERA
be set to Saturday.
Project Start: This is the earliest work day of the project. Note that it may be desirable
to have a Project Start several weeks before the first activity, in order to be able to
indicate supply/design milestones required for work to commence.
Project must finish by: This is the immutable end date of the project. It can, however,
be changed at a later date.
Decimal Places: Generally used in resource assignment and calculation (not in
calculation of the programme: Primavera does not support fractions of a planning unit).
After all of this information has been entered, we have a screen that looks like this:
Note that a separate folder in \projects has been created called \house. (This was
done in Internet Explorer)
Once this information has been entered click the “Add” button (i) and your project has
been created.
Department Of Civil Engineering, D.S.C.E, Bangalore-78 31
PROJECT MANAGEMENT USING PRIMAVERA
5.2 ENTERING YOUR FIRST ACTIVITIES
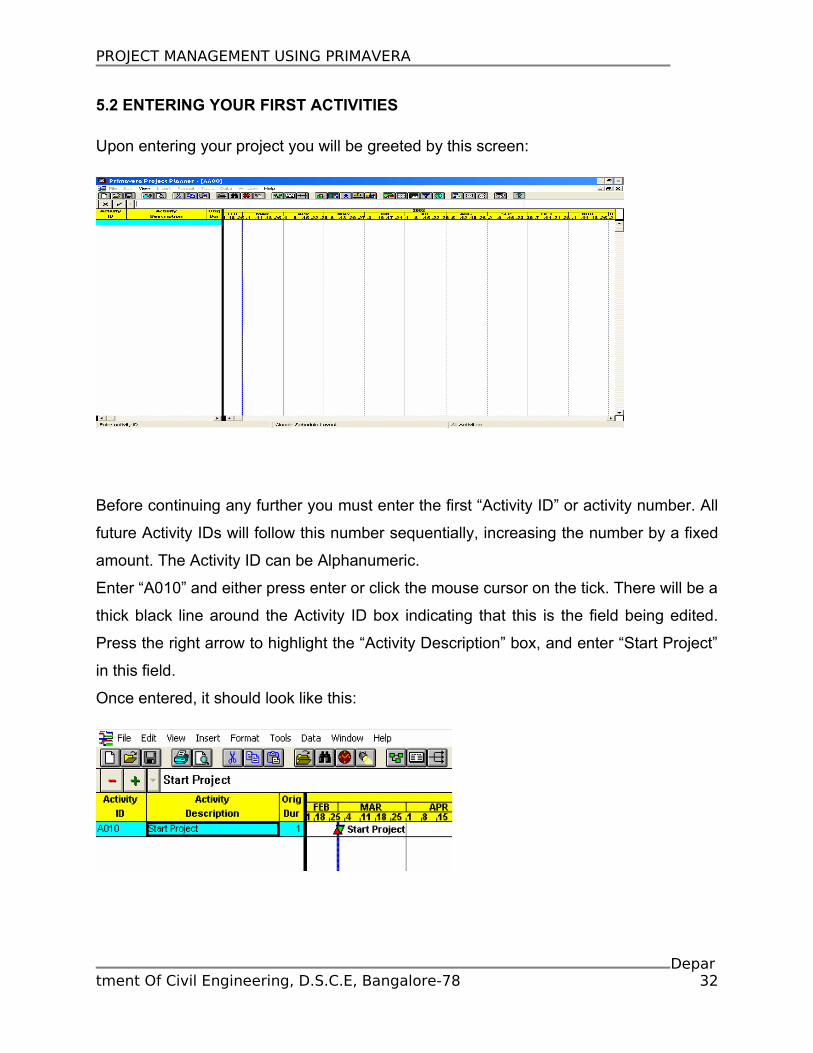
Upon entering your project you will be greeted by this screen:
Before continuing any further you must enter the first “Activity ID” or activity number. All
future Activity IDs will follow this number sequentially, increasing the number by a fixed
amount. The Activity ID can be Alphanumeric.
Enter “A010” and either press enter or click the mouse cursor on the tick. There will be a
thick black line around the Activity ID box indicating that this is the field being edited.
Press the right arrow to highlight the “Activity Description” box, and enter “Start Project”
in this field.
Once entered, it should look like this:
Department Of Civil Engineering, D.S.C.E, Bangalore-78 32
PROJECT MANAGEMENT USING PRIMAVERA
Press the down arrow button (or the “plus” sign) and notice that the Activity ID auto-
increments as the new activity appears. Enter in the next several activities so it looks
like this:
The activities for your first programme have been entered.
Note that the amount by which Primavera auto-increments the next activity can be
adjusted by selecting “Tools” “Options” “Activity Inserting” from the drop-down menus.
Finally we need to assign each activity a duration. This is done by highlighting the “Orig
Dur” box and entering in the required duration. Enter the durations as shown below:
We are now ready to apply logic to our programme, but before we move on we need to
correct the project layout…
5.3 ESTABLISHING YOUR LAYOUT
Department Of Civil Engineering, D.S.C.E, Bangalore-78 33
PROJECT MANAGEMENT USING PRIMAVERA
Using your mouse, move the cursor over the thick black line separating the Activity
details and the Gant chart until it appears as two vertical lines bisected by one
horizontal line with arrow heads pointing left and right.
Now press the left mouse button down and drag the cursor to the right: once you have
moved the cursor across two thirds of the screen, release the mouse button.
Several new columns are exposed, as shown above. At this point in time we do not
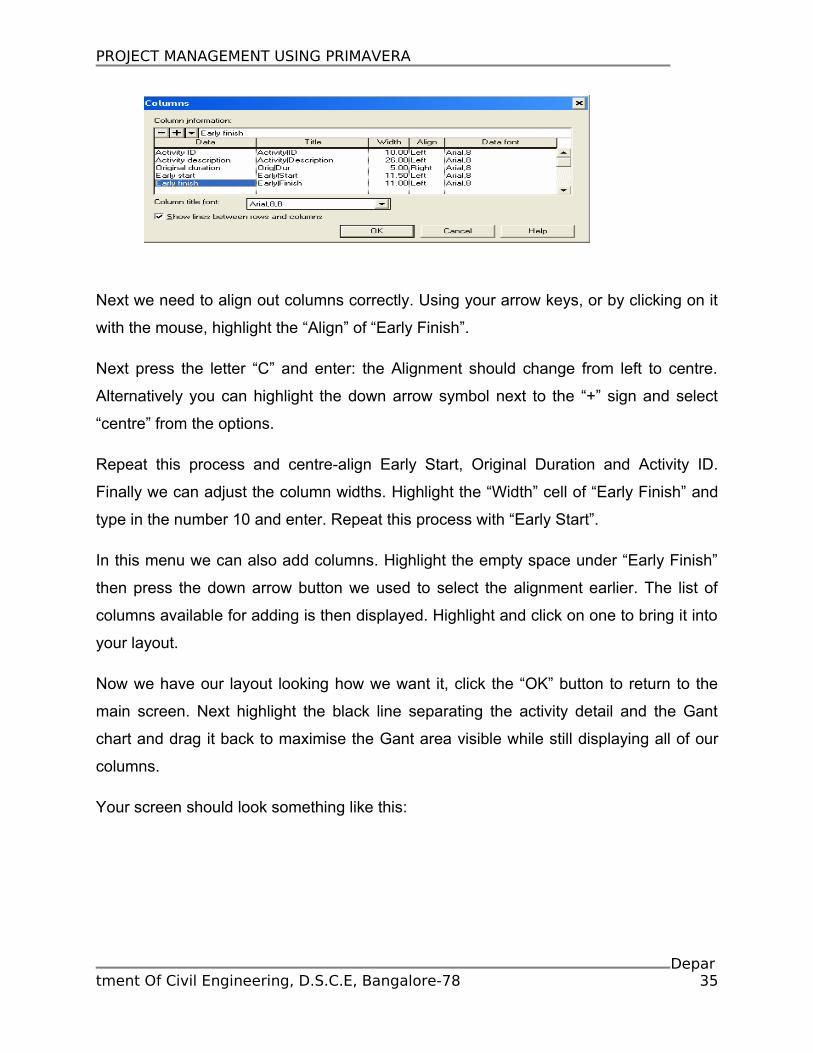
need those columns. Press F11 and this menu should appear.
The first thing we need to do is get rid of the columns which we don’t need. Highlight
“Remaining Duration” (press the down arrow 3 times or click on it with your mouse) and
either press the delete button on your computer or click on the “-“sign in the top left
corner of this menu with your mouse. “Remaining duration” should disappear and
“Percent complete” should now be highlighted. Delete this line also. Next highlight
“Resource” which should now be visible on your menu. Delete this and the next item
that appears, “Budgeted Cost”.You should be left with this:
Department Of Civil Engineering, D.S.C.E, Bangalore-78 34
PROJECT MANAGEMENT USING PRIMAVERA
Next we need to align out columns correctly. Using your arrow keys, or by clicking on it
with the mouse, highlight the “Align” of “Early Finish”.
Next press the letter “C” and enter: the Alignment should change from left to centre.
Alternatively you can highlight the down arrow symbol next to the “+” sign and select
“centre” from the options.
Repeat this process and centre-align Early Start, Original Duration and Activity ID.
Finally we can adjust the column widths. Highlight the “Width” cell of “Early Finish” and
type in the number 10 and enter. Repeat this process with “Early Start”.
In this menu we can also add columns. Highlight the empty space under “Early Finish”
then press the down arrow button we used to select the alignment earlier. The list of
columns available for adding is then displayed. Highlight and click on one to bring it into
your layout.
Now we have our layout looking how we want it, click the “OK” button to return to the
main screen. Next highlight the black line separating the activity detail and the Gant
chart and drag it back to maximise the Gant area visible while still displaying all of our
columns.
Your screen should look something like this:
Department Of Civil Engineering, D.S.C.E, Bangalore-78 35
PROJECT MANAGEMENT USING PRIMAVERA
Our next aim is to format the bars. This can be done by either clicking the “Bar” icon (1),
Format > Bar (from the drop-down menu), or by pressing Ctrl+F11.The following menu
should appear:
Department Of Civil Engineering, D.S.C.E, Bangalore-78 36
PROJECT MANAGEMENT USING PRIMAVERA
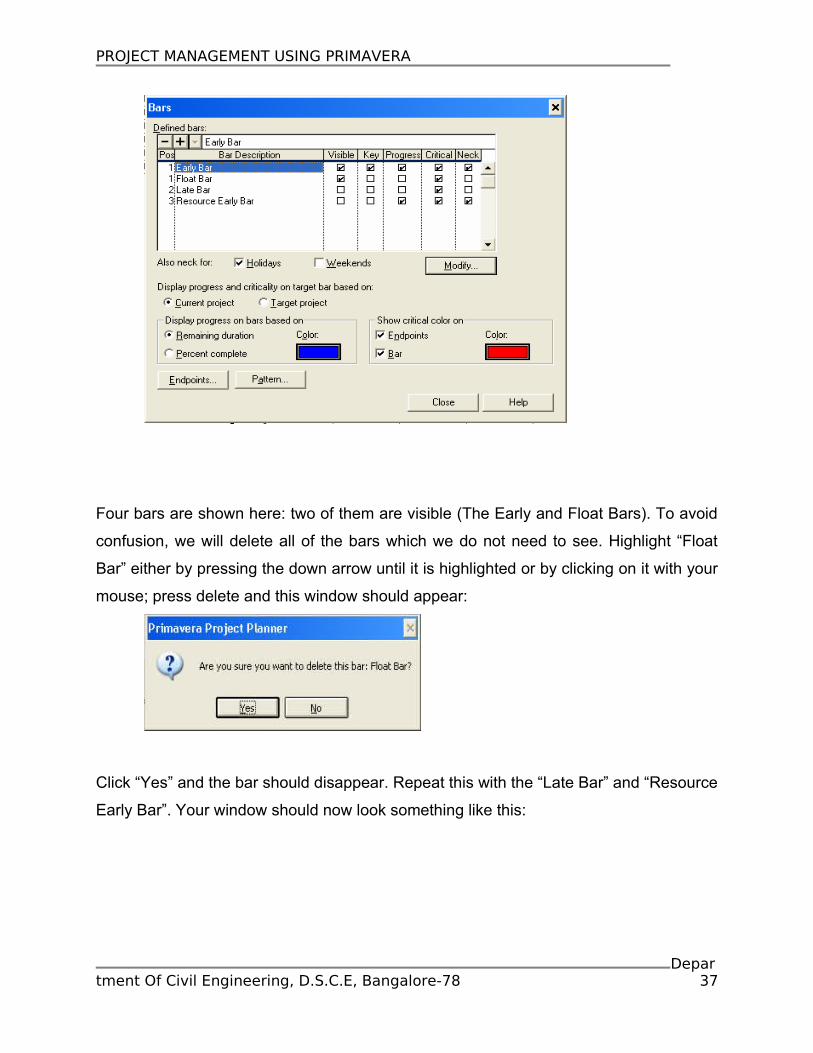
Four bars are shown here: two of them are visible (The Early and Float Bars). To avoid
confusion, we will delete all of the bars which we do not need to see. Highlight “Float
Bar” either by pressing the down arrow until it is highlighted or by clicking on it with your
mouse; press delete and this window should appear:
Click “Yes” and the bar should disappear. Repeat this with the “Late Bar” and “Resource
Early Bar”. Your window should now look something like this:
Department Of Civil Engineering, D.S.C.E, Bangalore-78 37
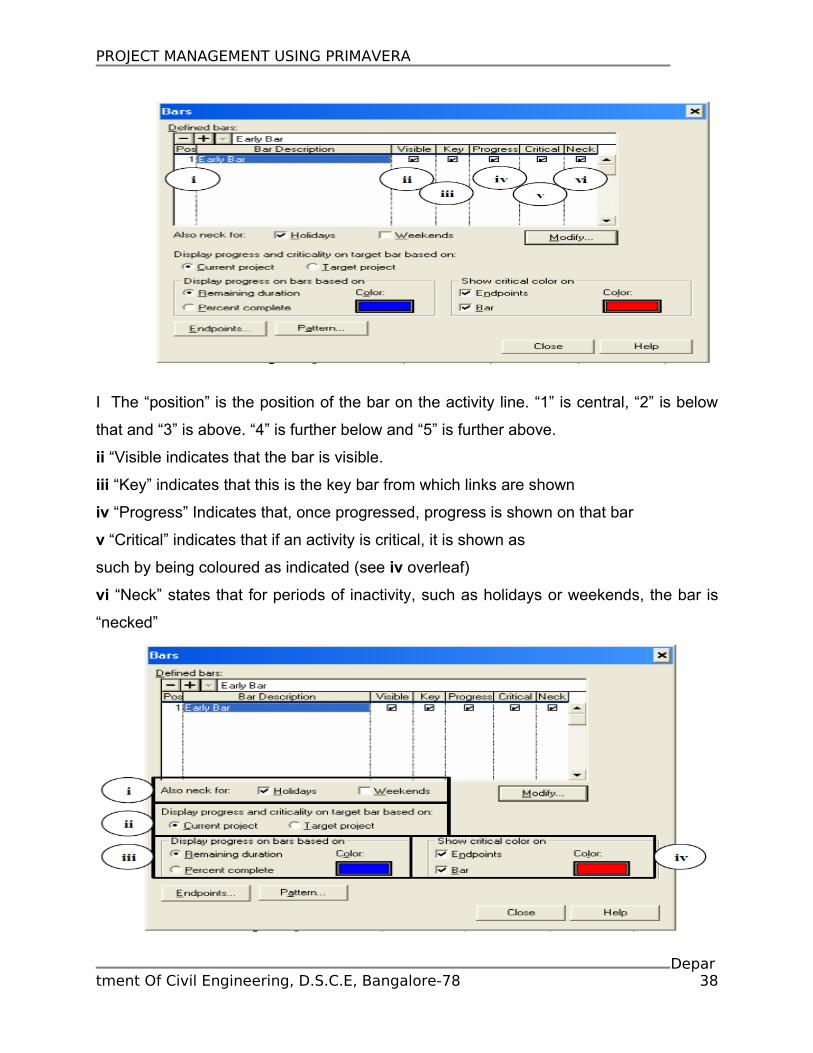
PROJECT MANAGEMENT USING PRIMAVERA
I The “position” is the position of the bar on the activity line. “1” is central, “2” is below
that and “3” is above. “4” is further below and “5” is further above.
ii “Visible indicates that the bar is visible.
iii “Key” indicates that this is the key bar from which links are shown
iv “Progress” Indicates that, once progressed, progress is shown on that bar
v “Critical” indicates that if an activity is critical, it is shown as
such by being coloured as indicated (see iv overleaf)
vi “Neck” states that for periods of inactivity, such as holidays or weekends, the bar is
“necked”
Department Of Civil Engineering, D.S.C.E, Bangalore-78 38
PROJECT MANAGEMENT USING PRIMAVERA
I This allows you to show the bar “necked” for periods of
inactivity, such as weekends or holidays. By default, the bars are necked when, due
to progress or resource constraints, no work can take place.
ii This option becomes relevant when a “target” or “baseline” project has been defined,
and allows you to show criticality on the target bar based on either the current project or
the target project
iii Percentage complete can differ greatly from remaining duration (a ten day activity
can be 90% complete but, due to late delivery or access problems, still have a 10 day
estimated remaining duration). This option allows you to choose which to display.
Finally this option allows you to mask or show the criticality of activities on the bar or
endpoints. “Endpoints” allows you to define the type of endpoint used for the various
bars available, as well as their size and color.
“Pattern” allows you to apply a pattern to the fill of the bar. “Modify” allows you to further
modify the details of that bar. Click on the “Modify” button to proceed to our next step in
defining our layout. This menu will appear:
Department Of Civil Engineering, D.S.C.E, Bangalore-78 39
PROJECT MANAGEMENT USING PRIMAVERA
I This is the description of the bar – it can be renamed as anything.
ii This, again, is the position of the bar. The number can be adjusted both by
highlighting it and entering in the new number, or by clicking (with your mouse button)
the up and down arrows to the right of the box to increase or decrease the number.
iii. This is the Start and End point definition area. At the moment they are defined as
Early Start and Early Finish. However, a Late Bar could be defined, with the Start Point
defined as “Late Start” and the Finish Point as “Late Finish”. Alternatively a Float Bar
could be shown, its start point being “Early Finish” and the finish point being “Late
Finish”. The “Bar” category allows you to define the type of bar. It can be a bar, a solid
line or a dashed line. The “size” category would then define the height, in pixels, of this
bar.
iv. Primavera allows the definition of Milestone points, or 0 duration target dates on your
programme. This box allows you to define the height, in pixels, of these milestones.
v. This defines whether the end point or bar is shown, or is merely outlined.
Department Of Civil Engineering, D.S.C.E, Bangalore-78 40
PROJECT MANAGEMENT USING PRIMAVERA
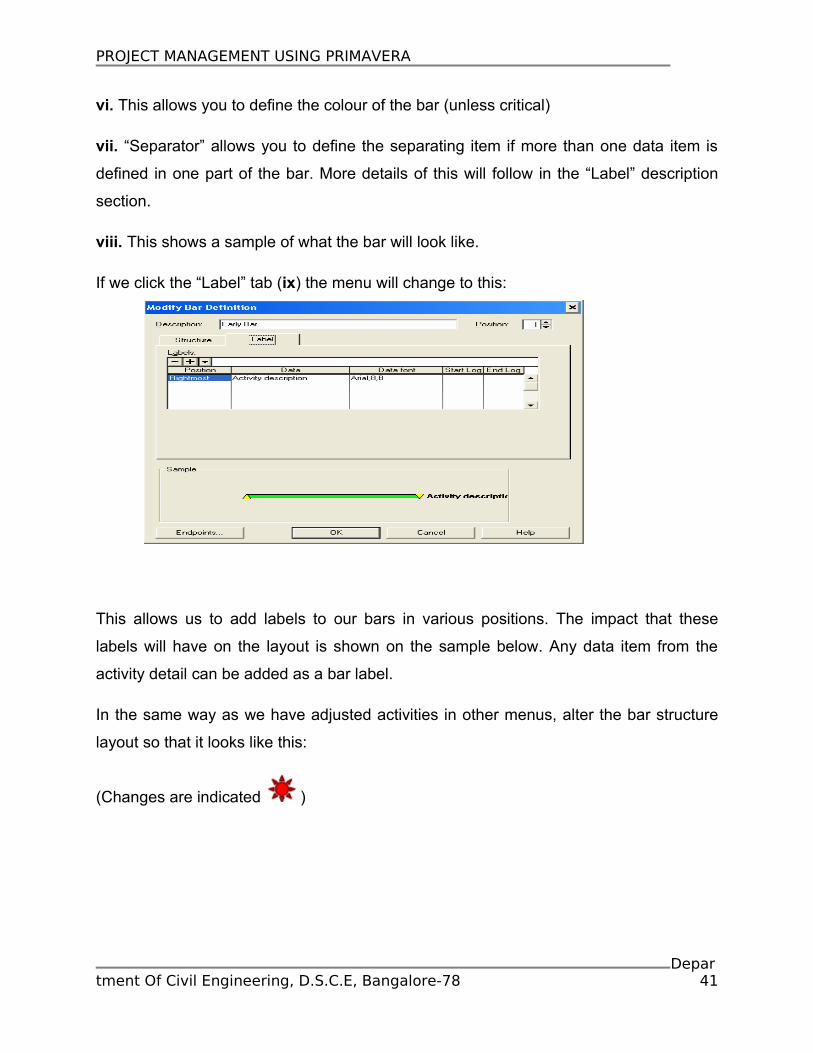
vi. This allows you to define the colour of the bar (unless critical)
vii. “Separator” allows you to define the separating item if more than one data item is
defined in one part of the bar. More details of this will follow in the “Label” description
section.
viii. This shows a sample of what the bar will look like.
If we click the “Label” tab (ix) the menu will change to this:
This allows us to add labels to our bars in various positions. The impact that these
labels will have on the layout is shown on the sample below. Any data item from the
activity detail can be added as a bar label.
In the same way as we have adjusted activities in other menus, alter the bar structure
layout so that it looks like this:
(Changes are indicated )
Department Of Civil Engineering, D.S.C.E, Bangalore-78 41
PROJECT MANAGEMENT USING PRIMAVERA
And alter the Label layout as follows:
If you click “OK” in the “Modify Bar Definition” window and “Close” in the bars window
our layout should now look something like this:
Department Of Civil Engineering, D.S.C.E, Bangalore-78 42
PROJECT MANAGEMENT USING PRIMAVERA
Now we are ready to move on and develop our programme.
5.4 DEVELOPING THE PROGRAMME
With our layout established we can develop our programme and apply logic to it. It
currently looks like this:
We need to link the activities together to form our construction programme (plan or
schedule).
There are several ways of nominating successors and predecessors for activities. The
quickest is to use our mouse. In order to do this we need to turn the relationship lines
option “on”. Click your mouse over the button in the top toolbar. You can now link
activities with your mouse. Place your mouse on the bottom right hand corner of activity
A010 until a three-pronged forked arrow appears. Now depress the left mouse button
and drag to the start of the activity you wish to link to. Try this out from A010 to A020.
Once the three pronged cursor is at the start of the activity bar you would like to link to,
release the mouse button and the link should appear:
Department Of Civil Engineering, D.S.C.E, Bangalore-78 43
PROJECT MANAGEMENT USING PRIMAVERA
The second way of linking activities is through the Successor input window. Highlight
activity A010 and press Ctrl-J .This window appears:
You can see the activity that we have designated A010’s successor shown here. The
“Rel” column indicates the type of relationship that exists between the two activities. In
this case it is a FS – Finish to Start, but could be a Finish-Finish, Start-Start or Start-
Finish.
The Lag indicates any Lag you want to put on the link. For instance, if it was a FS with
+3 days lag, the second activity could only start three days after the finish of the first.
Likewise a SS with +5 days lag would mean that the second activity could only start five
days after the start of the first.
The lag can be negative. For instance, a FS relationship with a -3 day lag would mean
that activity two could start three days before the end of activity one.
Press Enter. The box should jump immediately to the next activity and look like this:
Highlight the area underneath the “Activity ID” column heading and it will highlight blue
an area in which you can enter an Activity number. Type in “A030” and press enter.
Department Of Civil Engineering, D.S.C.E, Bangalore-78 44
PROJECT MANAGEMENT USING PRIMAVERA
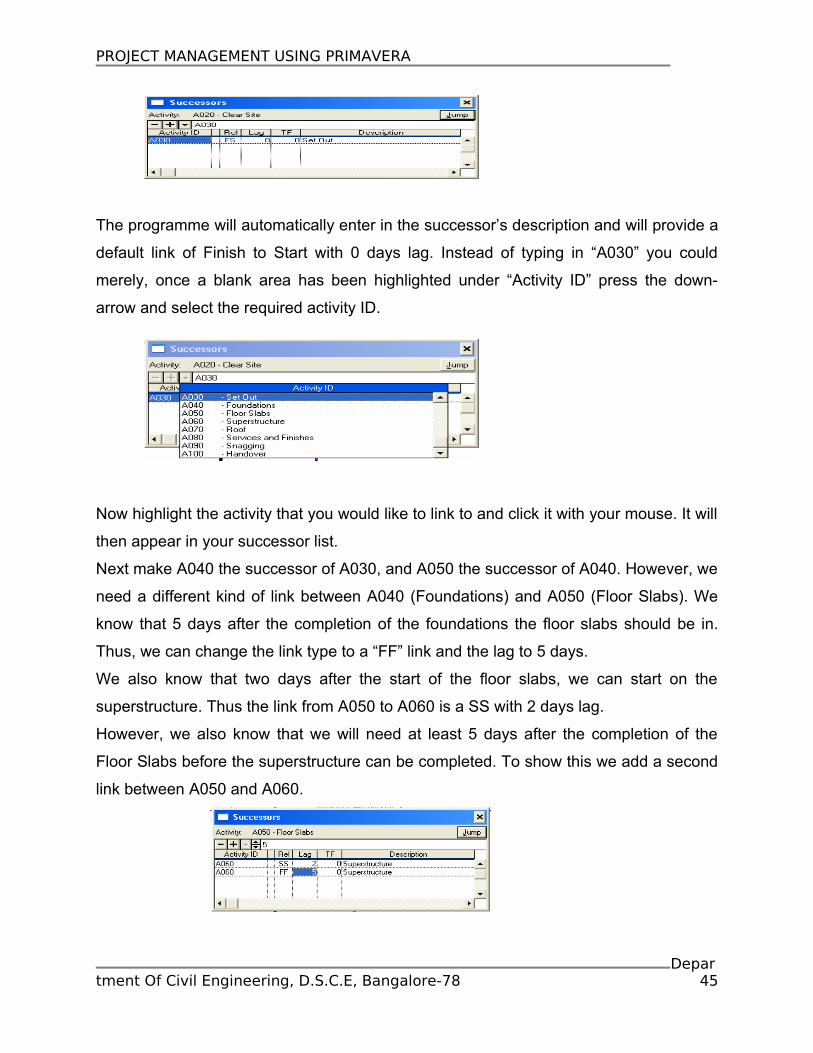
The programme will automatically enter in the successor’s description and will provide a
default link of Finish to Start with 0 days lag. Instead of typing in “A030” you could
merely, once a blank area has been highlighted under “Activity ID” press the down-
arrow and select the required activity ID.
Now highlight the activity that you would like to link to and click it with your mouse. It will
then appear in your successor list.
Next make A040 the successor of A030, and A050 the successor of A040. However, we
need a different kind of link between A040 (Foundations) and A050 (Floor Slabs). We
know that 5 days after the completion of the foundations the floor slabs should be in.
Thus, we can change the link type to a “FF” link and the lag to 5 days.
We also know that two days after the start of the floor slabs, we can start on the
superstructure. Thus the link from A050 to A060 is a SS with 2 days lag.
However, we also know that we will need at least 5 days after the completion of the
Floor Slabs before the superstructure can be completed. To show this we add a second
link between A050 and A060.
Department Of Civil Engineering, D.S.C.E, Bangalore-78 45
PROJECT MANAGEMENT USING PRIMAVERA
Enter in the links mentioned above, and the following:
A060 to A070 – FS
A070 to A080 – FS with -5 day lag
A080 to A090 – FS
A090 to A100 – FS
Then close the Successor activity box, either by pressing Ctrl-J again or by clicking the
small “x” in the top right corner of the box.
Our programme is now linked. Primavera now requires the programme to be
“scheduled” in order to calculate the new end date. Press F9 to schedule the
programme.
The result should be:
Our first problem is that the full width of the bar chart is not visible on the screen. Move
your mouse cursor over the timescale and double left-click.
This window should appear:
Department Of Civil Engineering, D.S.C.E, Bangalore-78 46
PROJECT MANAGEMENT USING PRIMAVERA
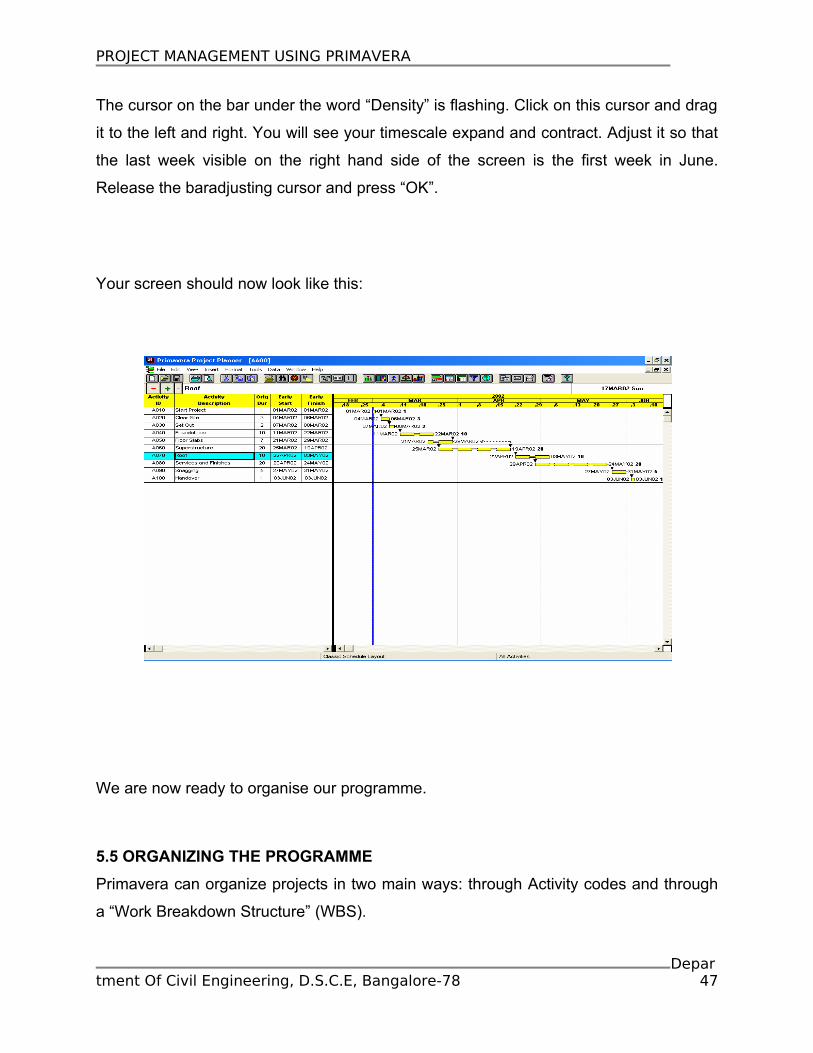
The cursor on the bar under the word “Density” is flashing. Click on this cursor and drag
it to the left and right. You will see your timescale expand and contract. Adjust it so that
the last week visible on the right hand side of the screen is the first week in June.
Release the baradjusting cursor and press “OK”.
Your screen should now look like this:
We are now ready to organise our programme.
5.5 ORGANIZING THE PROGRAMME
Primavera can organize projects in two main ways: through Activity codes and through
a “Work Breakdown Structure” (WBS).
Department Of Civil Engineering, D.S.C.E, Bangalore-78 47
PROJECT MANAGEMENT USING PRIMAVERA
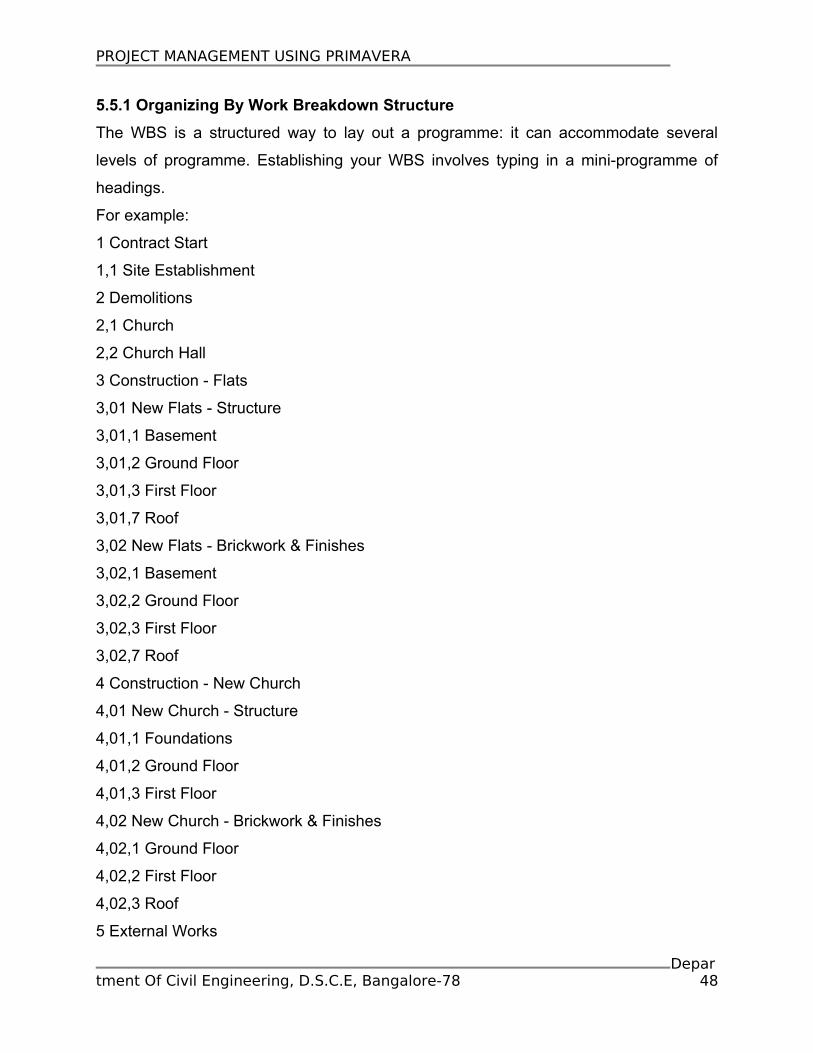
5.5.1 Organizing By Work Breakdown Structure
The WBS is a structured way to lay out a programme: it can accommodate several
levels of programme. Establishing your WBS involves typing in a mini-programme of
headings.
For example:
1 Contract Start
1,1 Site Establishment
2 Demolitions
2,1 Church
2,2 Church Hall
3 Construction - Flats
3,01 New Flats - Structure
3,01,1 Basement
3,01,2 Ground Floor
3,01,3 First Floor
3,01,7 Roof
3,02 New Flats - Brickwork & Finishes
3,02,1 Basement
3,02,2 Ground Floor
3,02,3 First Floor
3,02,7 Roof
4 Construction - New Church
4,01 New Church - Structure
4,01,1 Foundations
4,01,2 Ground Floor
4,01,3 First Floor
4,02 New Church - Brickwork & Finishes
4,02,1 Ground Floor
4,02,2 First Floor
4,02,3 Roof
5 External Works
Department Of Civil Engineering, D.S.C.E, Bangalore-78 48
PROJECT MANAGEMENT USING PRIMAVERA
6 Handover
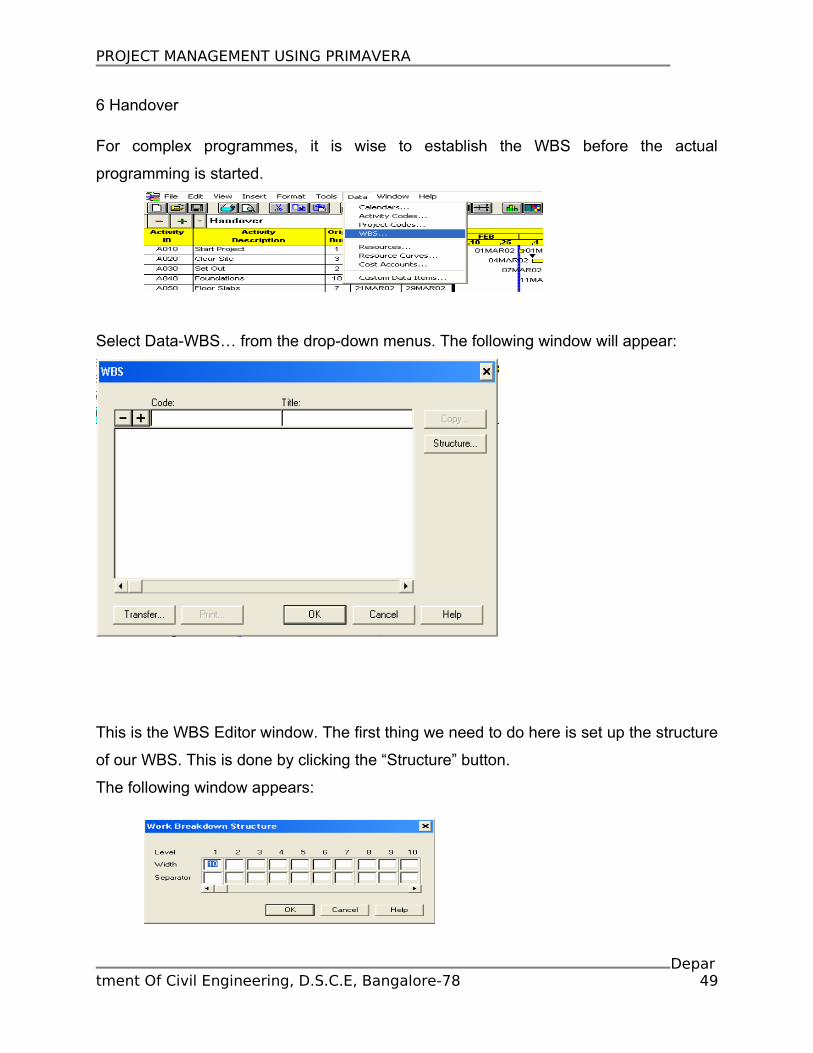
For complex programmes, it is wise to establish the WBS before the actual
programming is started.
Select Data-WBS… from the drop-down menus. The following window will appear:
This is the WBS Editor window. The first thing we need to do here is set up the structure
of our WBS. This is done by clicking the “Structure” button.
The following window appears:
Department Of Civil Engineering, D.S.C.E, Bangalore-78 49
PROJECT MANAGEMENT USING PRIMAVERA
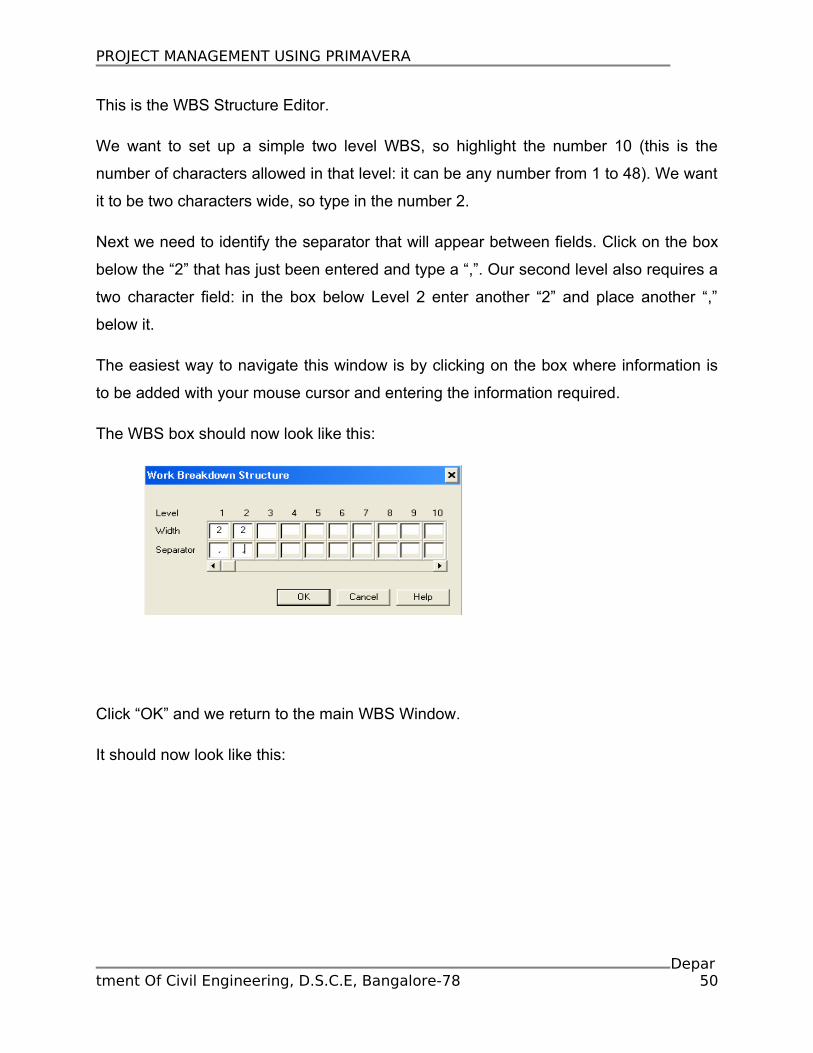
This is the WBS Structure Editor.
We want to set up a simple two level WBS, so highlight the number 10 (this is the
number of characters allowed in that level: it can be any number from 1 to 48). We want
it to be two characters wide, so type in the number 2.
Next we need to identify the separator that will appear between fields. Click on the box
below the “2” that has just been entered and type a “,”. Our second level also requires a
two character field: in the box below Level 2 enter another “2” and place another “,”
below it.
The easiest way to navigate this window is by clicking on the box where information is
to be added with your mouse cursor and entering the information required.
The WBS box should now look like this:
Click “OK” and we return to the main WBS Window.
It should now look like this:
Department Of Civil Engineering, D.S.C.E, Bangalore-78 50
PROJECT MANAGEMENT USING PRIMAVERA
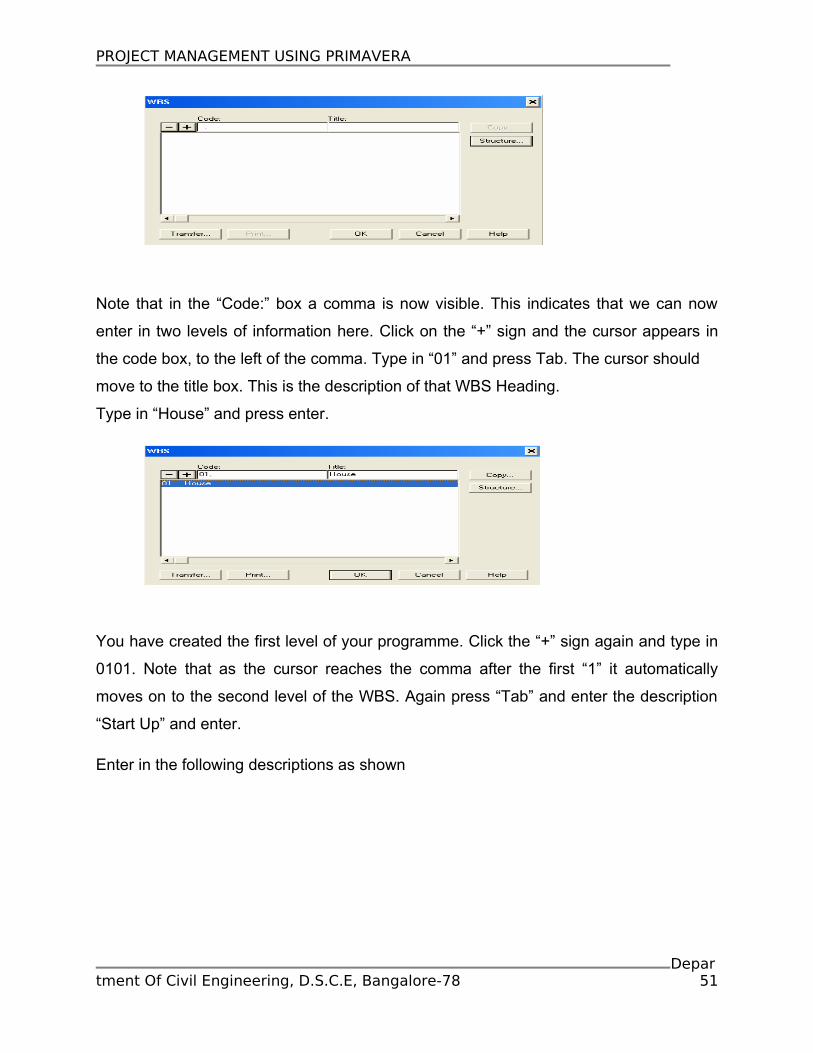
Note that in the “Code:” box a comma is now visible. This indicates that we can now
enter in two levels of information here. Click on the “+” sign and the cursor appears in
the code box, to the left of the comma. Type in “01” and press Tab. The cursor should
move to the title box. This is the description of that WBS Heading.
Type in “House” and press enter.
You have created the first level of your programme. Click the “+” sign again and type in
0101. Note that as the cursor reaches the comma after the first “1” it automatically
moves on to the second level of the WBS. Again press “Tab” and enter the description
“Start Up” and enter.
Enter in the following descriptions as shown
Department Of Civil Engineering, D.S.C.E, Bangalore-78 51
PROJECT MANAGEMENT USING PRIMAVERA
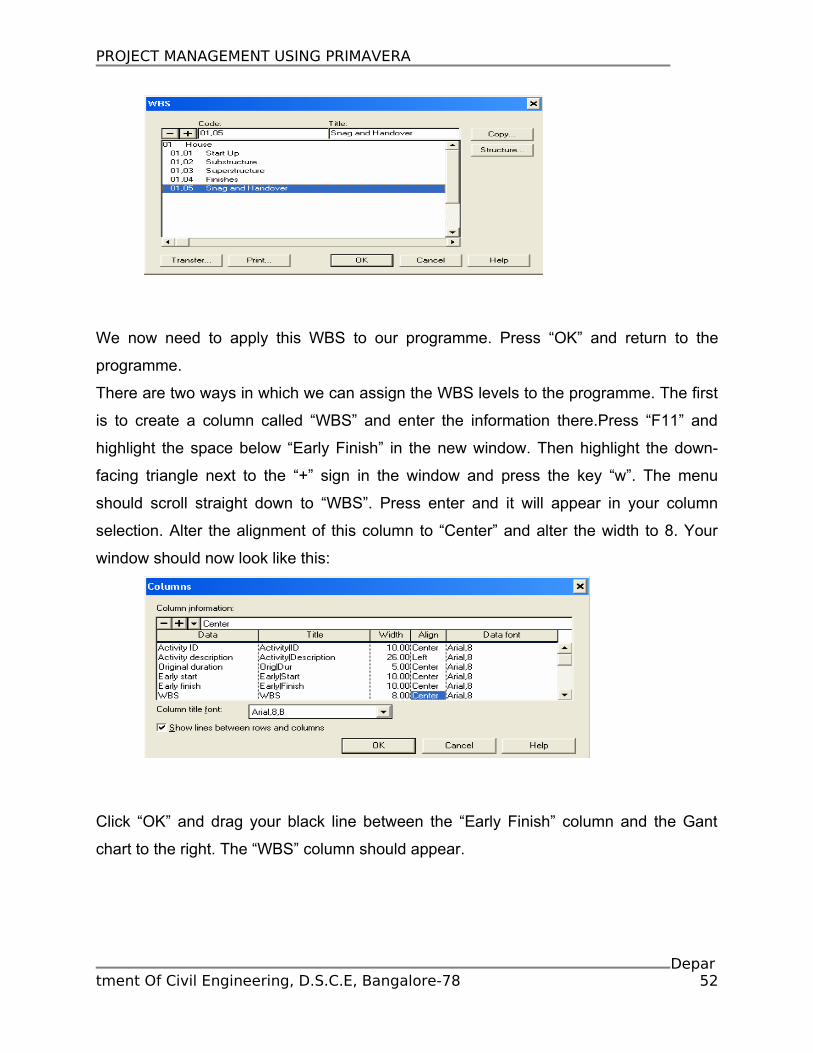
We now need to apply this WBS to our programme. Press “OK” and return to the
programme.
There are two ways in which we can assign the WBS levels to the programme. The first
is to create a column called “WBS” and enter the information there.Press “F11” and
highlight the space below “Early Finish” in the new window. Then highlight the down-
facing triangle next to the “+” sign in the window and press the key “w”. The menu
should scroll straight down to “WBS”. Press enter and it will appear in your column
selection. Alter the alignment of this column to “Center” and alter the width to 8. Your
window should now look like this:
Click “OK” and drag your black line between the “Early Finish” column and the Gant
chart to the right. The “WBS” column should appear.
Department Of Civil Engineering, D.S.C.E, Bangalore-78 52
PROJECT MANAGEMENT USING PRIMAVERA
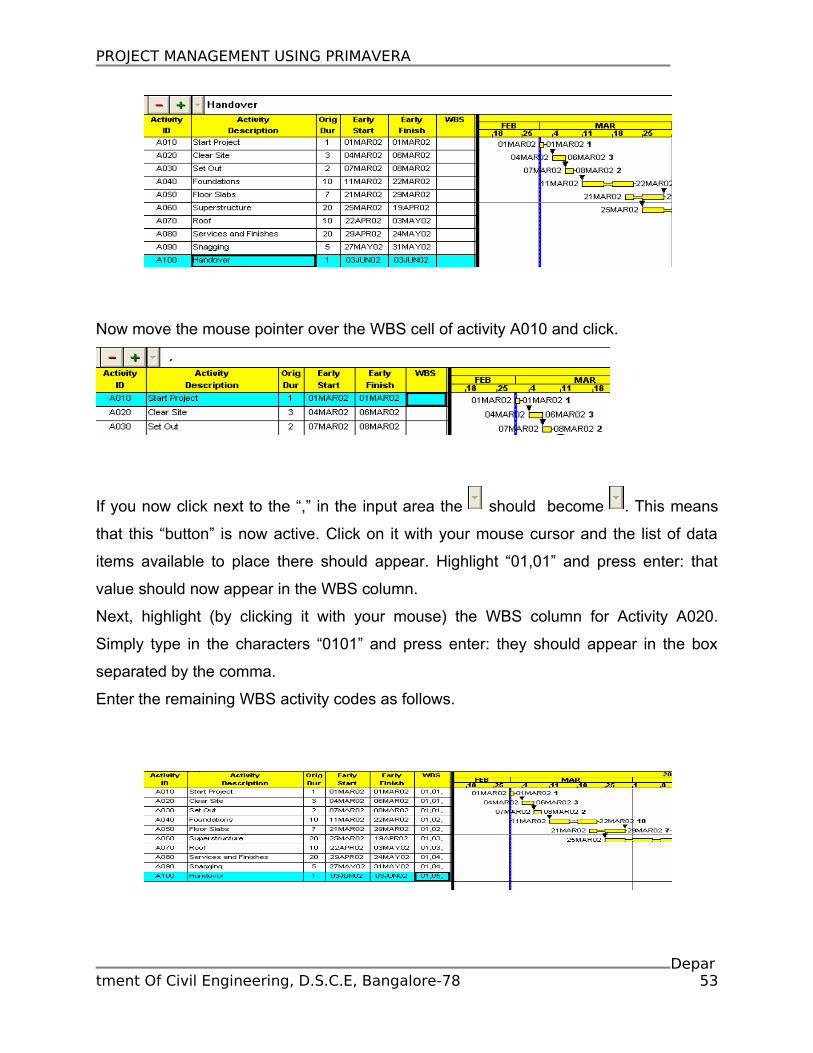
Now move the mouse pointer over the WBS cell of activity A010 and click.
If you now click next to the “,” in the input area the should become . This means
that this “button” is now active. Click on it with your mouse cursor and the list of data
items available to place there should appear. Highlight “01,01” and press enter: that
value should now appear in the WBS column.
Next, highlight (by clicking it with your mouse) the WBS column for Activity A020.
Simply type in the characters “0101” and press enter: they should appear in the box
separated by the comma.
Enter the remaining WBS activity codes as follows.
Department Of Civil Engineering, D.S.C.E, Bangalore-78 53
PROJECT MANAGEMENT USING PRIMAVERA
We have now told Primavera HOW we want the programme organised: now we must
tell it to organise it so.
Click the “Organise” icon on the toolbar.This window will appear:
This opens, by default, on organising by “Activity Code”.
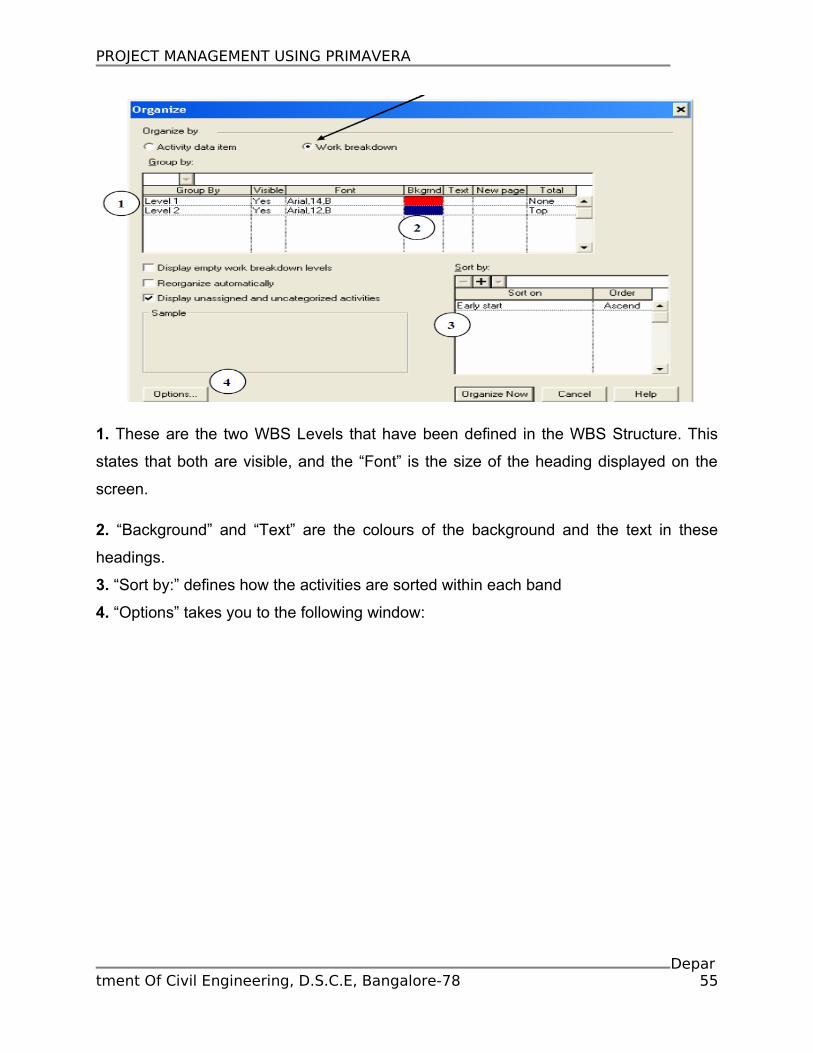
Press the button by the words “Work Breakdown Structure” and the window should
change to this:
Department Of Civil Engineering, D.S.C.E, Bangalore-78 54
PROJECT MANAGEMENT USING PRIMAVERA
1. These are the two WBS Levels that have been defined in the WBS Structure. This
states that both are visible, and the “Font” is the size of the heading displayed on the
screen.
2. “Background” and “Text” are the colours of the background and the text in these
headings.
3. “Sort by:” defines how the activities are sorted within each band
4. “Options” takes you to the following window:
Department Of Civil Engineering, D.S.C.E, Bangalore-78 55
PROJECT MANAGEMENT USING PRIMAVERA
While we are here, we want to display the WBS number (its value) as well as the
description in the header band. Tick the “Value” box beneath the text (1) “Text in
bands:”
Now click “OK” (2) and we return to the “Organise” window.
We can change the settings here for colours, fonts, and whether each heading has a
“Total” band at will. For now, merely highlight the Level
2 “Total Cell” and press “N” – “none” should appear in the box. Press enter and enter
again.
You should return to his screen:
Department Of Civil Engineering, D.S.C.E, Bangalore-78 56
PROJECT MANAGEMENT USING PRIMAVERA
Here we see the headings we defined in our WBS layout assigned to the activities, in
the layout we asked for.
Note that the WBS headings have the number we assigned them in the header bar.
You can summarise these bars under their respective heading by double mouse-
clicking on the header lines (*).
5.5.2 Organizing By Activity Code
The second method of organizing activities in Primavera is by Activity Code. You can
see the current activity codes at the Menu option Data – Activity Codes. This window
will appear:
Department Of Civil Engineering, D.S.C.E, Bangalore-78 57
PROJECT MANAGEMENT USING PRIMAVERA
i. This is the four letter character code assigned to this Activity code as its name
ii. This is the character length of the field
iii. This is the description of the field
iv. These are the “Value’s” of the component parts of that activity code. For instance, if a
Code field is called “Level” with a length of “1” the values could be G, 1, 2, 3, 4 and the
descriptions “Ground Floor”, “First Floor”, etc.
v. This is the order in which those items should be sorted within the activity code. For
instance, Primavera could assume that “G” comes after the numeric codes. In this
instance we would place a “1” in the “order” column by G, a “2” by “1 First
Floor”, etc.
Department Of Civil Engineering, D.S.C.E, Bangalore-78 58
PROJECT MANAGEMENT USING PRIMAVERA
vi. “Transfer” allow us to transfer a coding structure from another programme.
This button will take you to a window in which you can identify the programme from
where you would like the activity codes drawn.
Highlight “RESP” in the name field and then click on “RESP” in the text edit box (a).
Your cursor will appear in that field. Delete the characters RESP there and replace them
with “BLDG” and press Enter.
Now click on the “Description” field of our new Activity Code “BLDG” and change the
description to “Building”. The length of the field can remain at 4.
Now change “AREA” to “PHSE” and enter “Construction Ph.” as its description.
Delete the remaining codes by highlighting them and pressing the delete key.
Department Of Civil Engineering, D.S.C.E, Bangalore-78 59
PROJECT MANAGEMENT USING PRIMAVERA
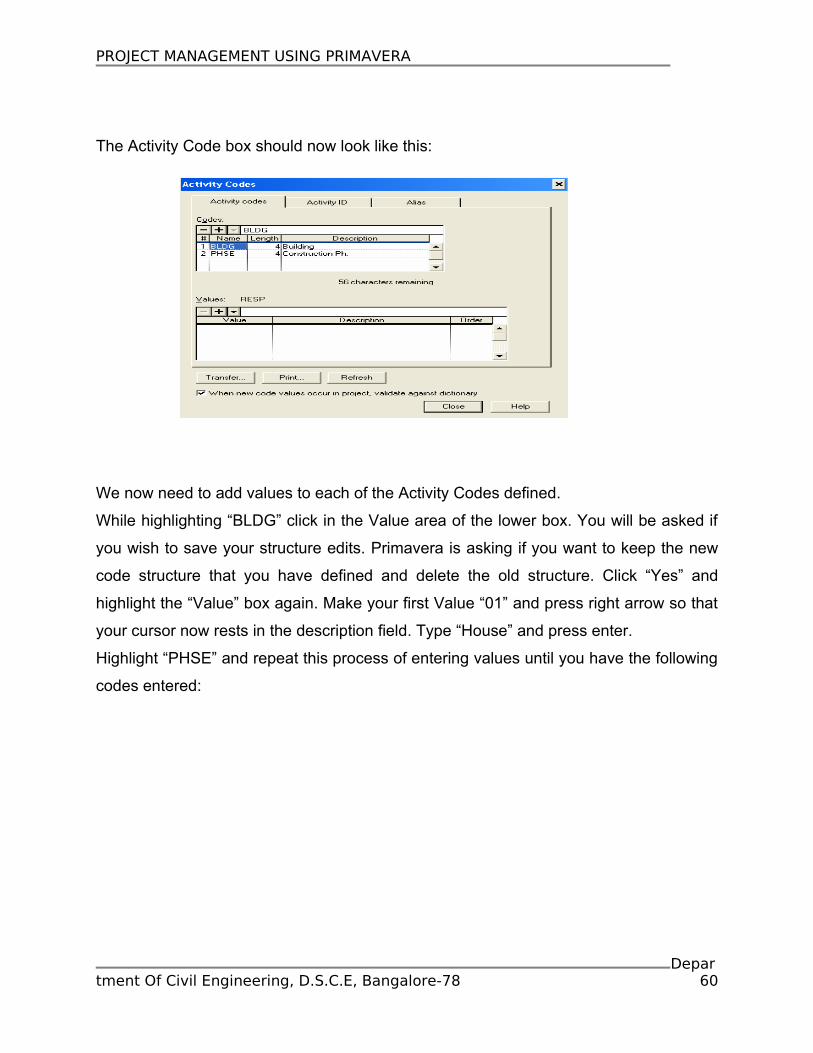
The Activity Code box should now look like this:
We now need to add values to each of the Activity Codes defined.
While highlighting “BLDG” click in the Value area of the lower box. You will be asked if
you wish to save your structure edits. Primavera is asking if you want to keep the new
code structure that you have defined and delete the old structure. Click “Yes” and
highlight the “Value” box again. Make your first Value “01” and press right arrow so that
your cursor now rests in the description field. Type “House” and press enter.
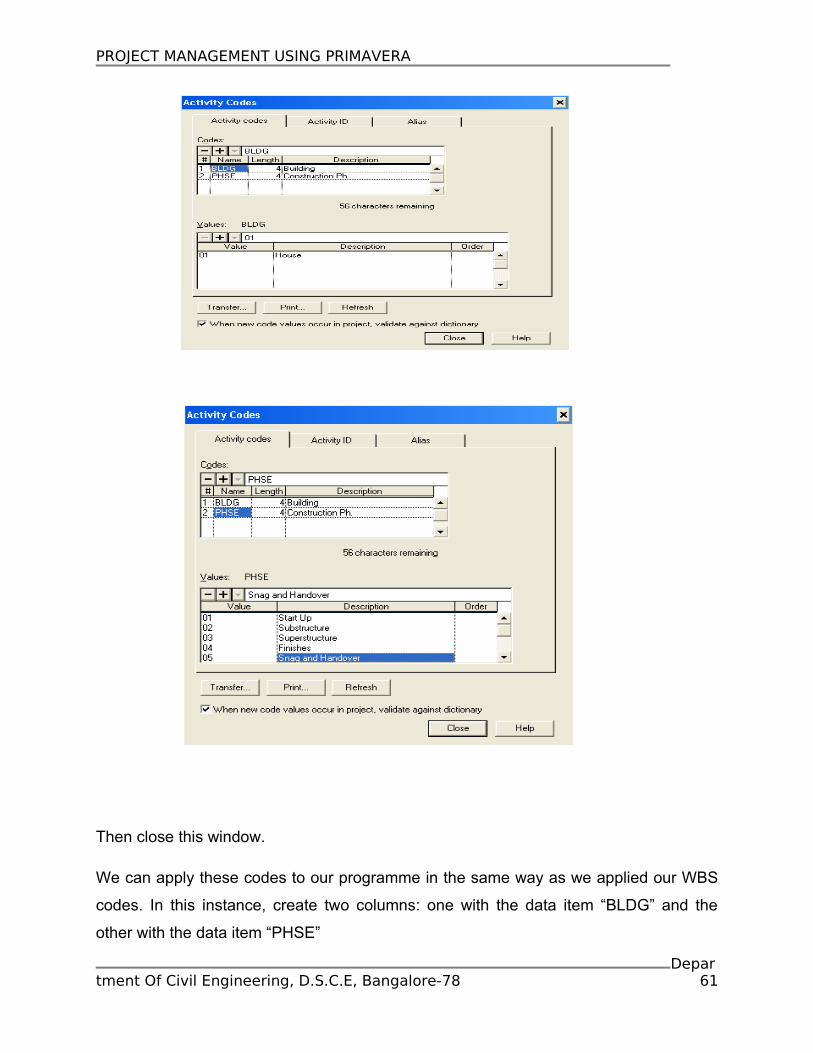
Highlight “PHSE” and repeat this process of entering values until you have the following
codes entered:
Department Of Civil Engineering, D.S.C.E, Bangalore-78 60
PROJECT MANAGEMENT USING PRIMAVERA
Then close this window.
We can apply these codes to our programme in the same way as we applied our WBS
codes. In this instance, create two columns: one with the data item “BLDG” and the
other with the data item “PHSE”
Department Of Civil Engineering, D.S.C.E, Bangalore-78 61
PROJECT MANAGEMENT USING PRIMAVERA
Our Gant Chart will now look like this:
Now it is the simple matter of entering our codes. The code “01” for “BLDG” applies to
all activities, while we will encode “PHSE” to match our WBS.
Department Of Civil Engineering, D.S.C.E, Bangalore-78 62
PROJECT MANAGEMENT USING PRIMAVERA
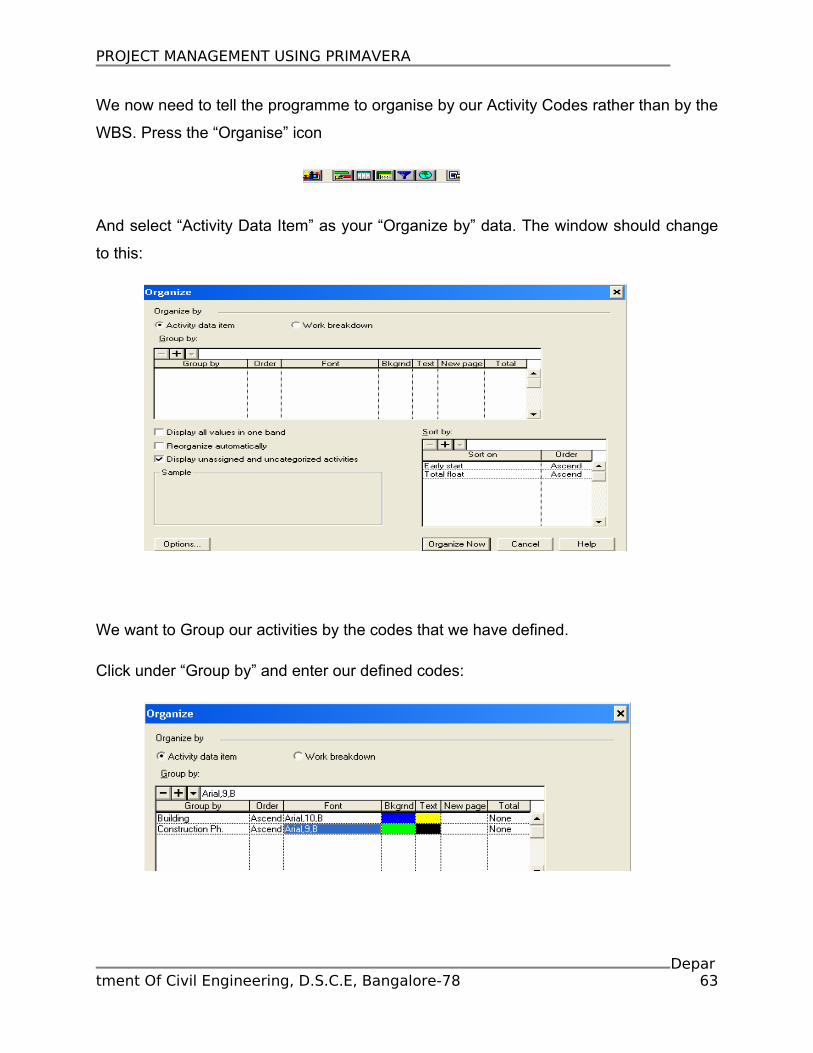
We now need to tell the programme to organise by our Activity Codes rather than by the
WBS. Press the “Organise” icon
And select “Activity Data Item” as your “Organize by” data. The window should change
to this:
We want to Group our activities by the codes that we have defined.
Click under “Group by” and enter our defined codes:
Department Of Civil Engineering, D.S.C.E, Bangalore-78 63
PROJECT MANAGEMENT USING PRIMAVERA
Note in the example shown the “Font” has been altered. This can be changed by
highlighting the font and selecting the required font in the Input area.
Press “Reorganise Now” and the schedule layout should change to this:
Our colour scheme has changed in line with our new layout and “Snagging” has moved
from our previously defined heading of “Finishes” to “Snag and Handover”.
The Activity Code form is useful in two main instances: where there is repetition and
where different layouts might be required by different parties.
Imagine if our example had ten houses: our WBS would run for several pages, but the
Activity Code will only have to be adjusted by adding in one code per house – a house
number identifier.
Further, in that instance a reorganisation could tell our Services Foreman exactly what
his programme will be for the ten houses. First we would organise it by “Construction
Ph.” and then by “Building”.
The below example took just a few minutes to create, organise and sort. Note that in
this example I used a “Filter” to show only the “Finishes” activities i.e. those activities
with Building Ph. Code “04”.
Department Of Civil Engineering, D.S.C.E, Bangalore-78 64
PROJECT MANAGEMENT USING PRIMAVERA
So how do we filter our programmes?
5.6 FILTERING THE PROGRAMME
Our programme should currently look something like this:
We need to create something to filter by: create an additional Activity code, with values,
as follows:
Department Of Civil Engineering, D.S.C.E, Bangalore-78 65
PROJECT MANAGEMENT USING PRIMAVERA
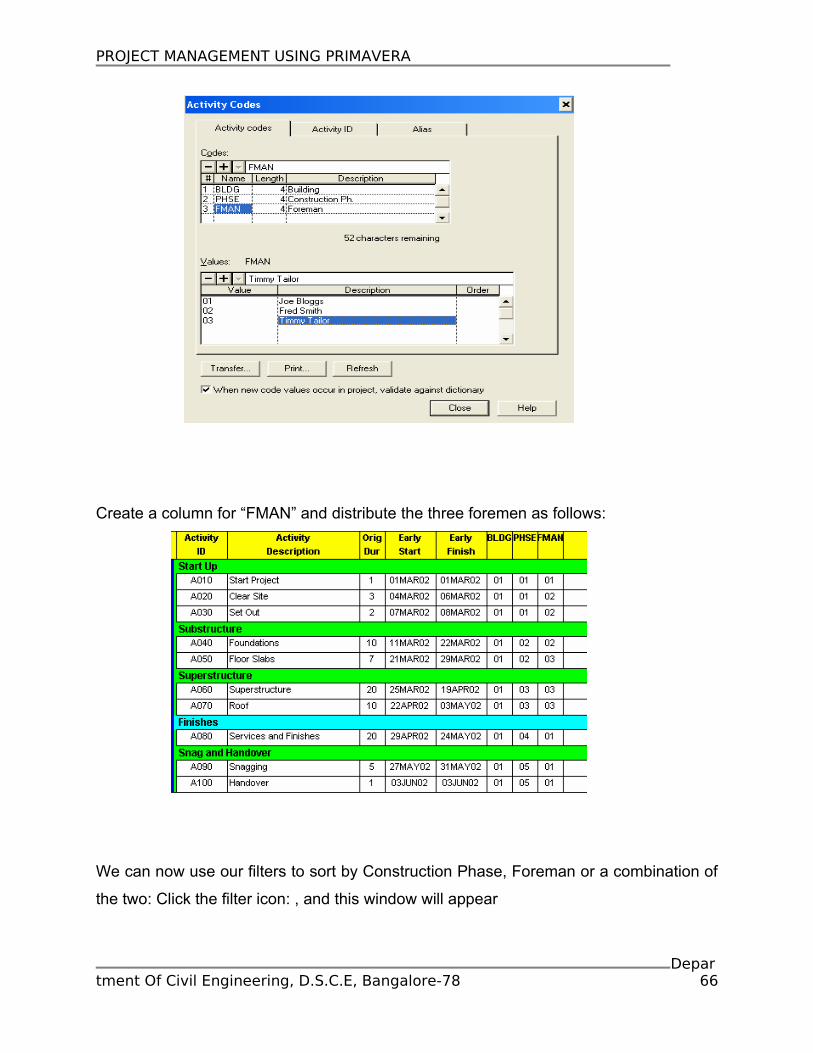
Create a column for “FMAN” and distribute the three foremen as follows:
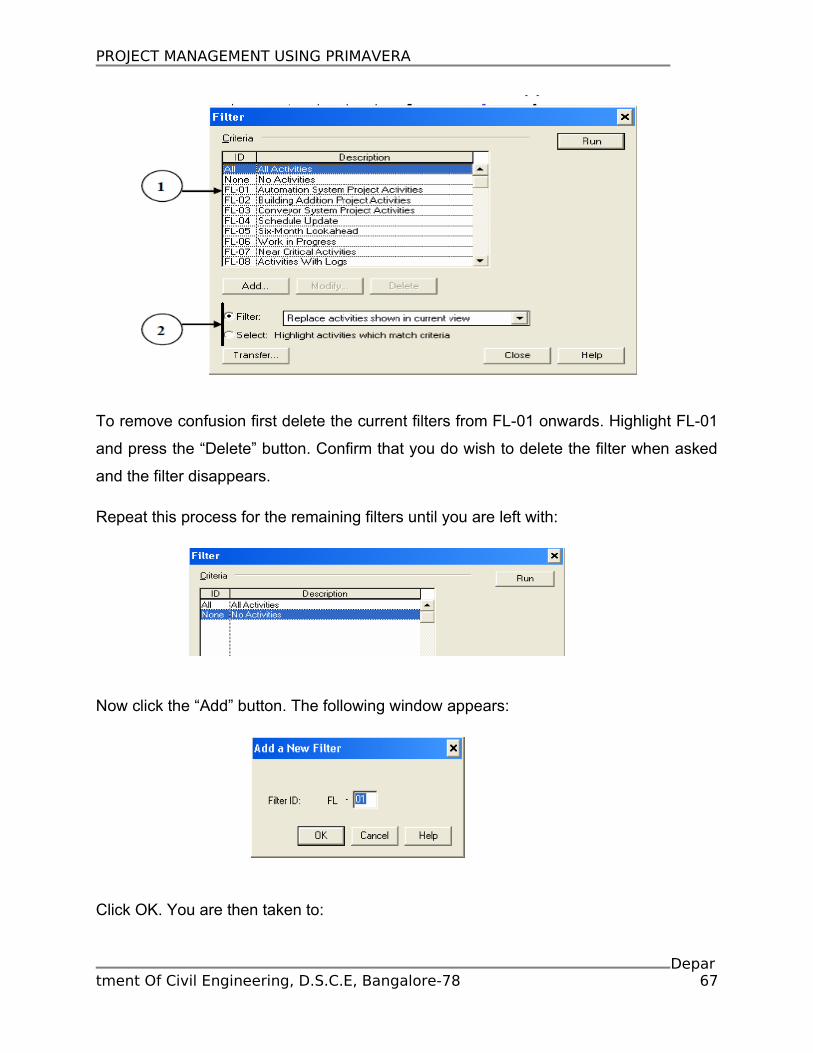
We can now use our filters to sort by Construction Phase, Foreman or a combination of
the two: Click the filter icon: , and this window will appear
Department Of Civil Engineering, D.S.C.E, Bangalore-78 66
PROJECT MANAGEMENT USING PRIMAVERA
To remove confusion first delete the current filters from FL-01 onwards. Highlight FL-01
and press the “Delete” button. Confirm that you do wish to delete the filter when asked
and the filter disappears.
Repeat this process for the remaining filters until you are left with:
Now click the “Add” button. The following window appears:
Click OK. You are then taken to:
Department Of Civil Engineering, D.S.C.E, Bangalore-78 67
PROJECT MANAGEMENT USING PRIMAVERA
1 This is the name of the filter – it can be renamed as anything 2. This section defines
whether, in the case that two conditions are imposed on the filter, activities are required
to fulfill all conditions or only one of the conditions
3. In this section the filter conditions are defined. Any of the data items defined for an
activity can be used in a filter, from dates to activity codes to resource data.
4. Here the “condition” for the filter to apply is defined. It can be any mathematical
function (i.e. <,>, =, etc.) and any value, either of the data item mentioned in “3.”, or any
other data item.
An example would be:
Here we are telling the computer to apply the filter (i.e. select and display that activity)
only if the Foreman is equal to 01 (Joe Bloggs).
A more complex filter would be:
Department Of Civil Engineering, D.S.C.E, Bangalore-78 68
PROJECT MANAGEMENT USING PRIMAVERA
This tells the computer to select an activity if
(i) The Foreman is 01 (Joe Bloggs)
(ii) The Construction Phase is “Within the Range” of (WR) 02- 04 (i.e. is 02, 03 or 04 –
Substructure, Superstructure and Finishes)
(iii) Has an early start date after the 1st April 2002.
In this case, only activity A080 will be selected. Filters are often used in large projects
for progress reporting: it is difficult to sort through hundreds of activities to find those
that have started or finished. A filter can reduce the hundreds to a few dozen.
A useful filter for a “look ahead” view would look like this:
Department Of Civil Engineering, D.S.C.E, Bangalore-78 69
PROJECT MANAGEMENT USING PRIMAVERA
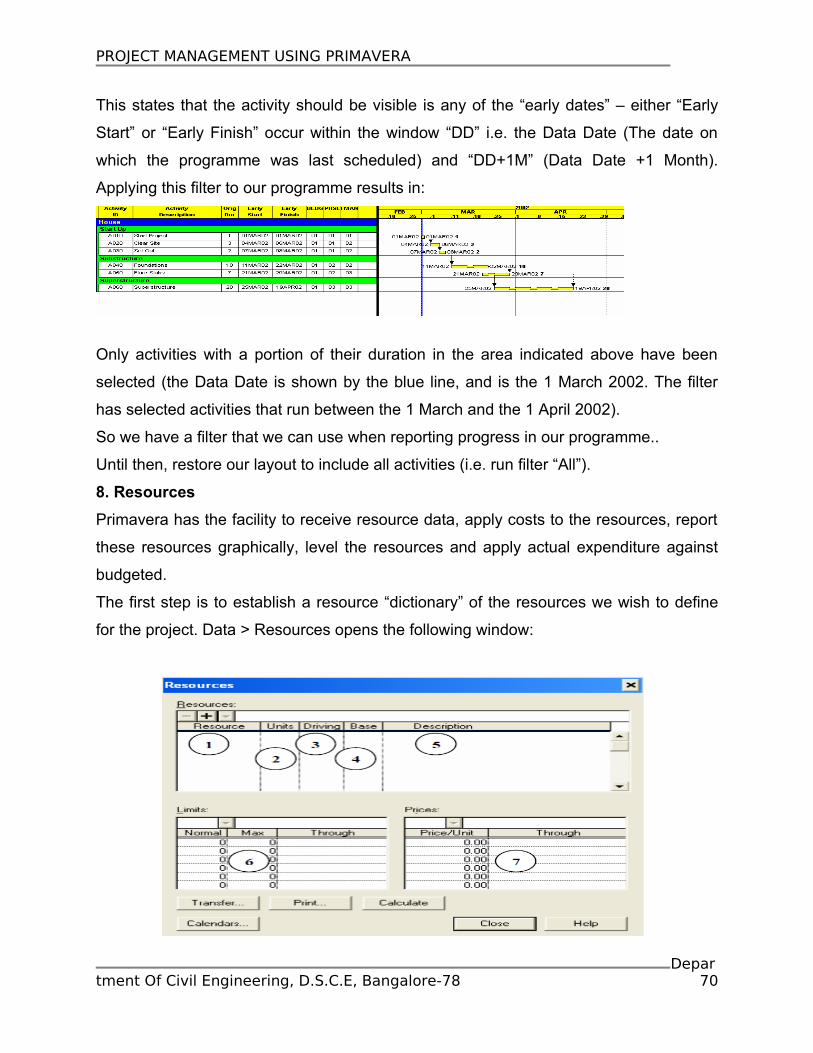
This states that the activity should be visible is any of the “early dates” – either “Early
Start” or “Early Finish” occur within the window “DD” i.e. the Data Date (The date on
which the programme was last scheduled) and “DD+1M” (Data Date +1 Month).
Applying this filter to our programme results in:
Only activities with a portion of their duration in the area indicated above have been
selected (the Data Date is shown by the blue line, and is the 1 March 2002. The filter
has selected activities that run between the 1 March and the 1 April 2002).
So we have a filter that we can use when reporting progress in our programme..
Until then, restore our layout to include all activities (i.e. run filter “All”).
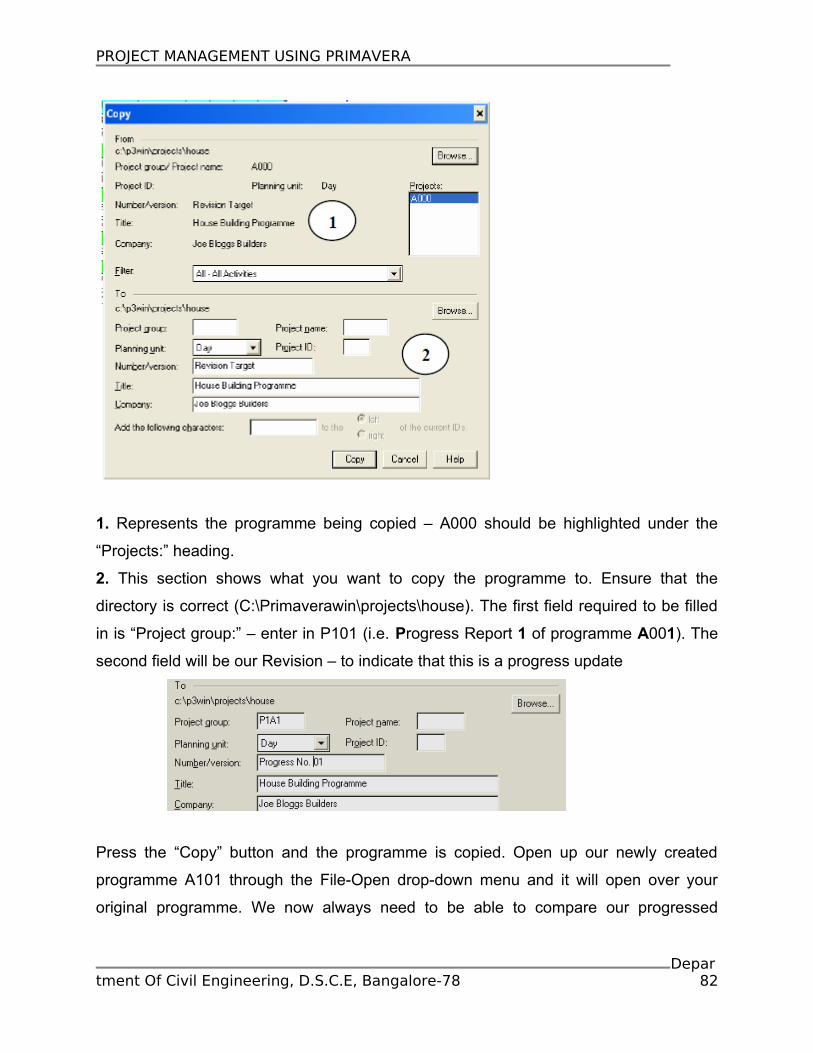
8. Resources
Primavera has the facility to receive resource data, apply costs to the resources, report
these resources graphically, level the resources and apply actual expenditure against
budgeted.
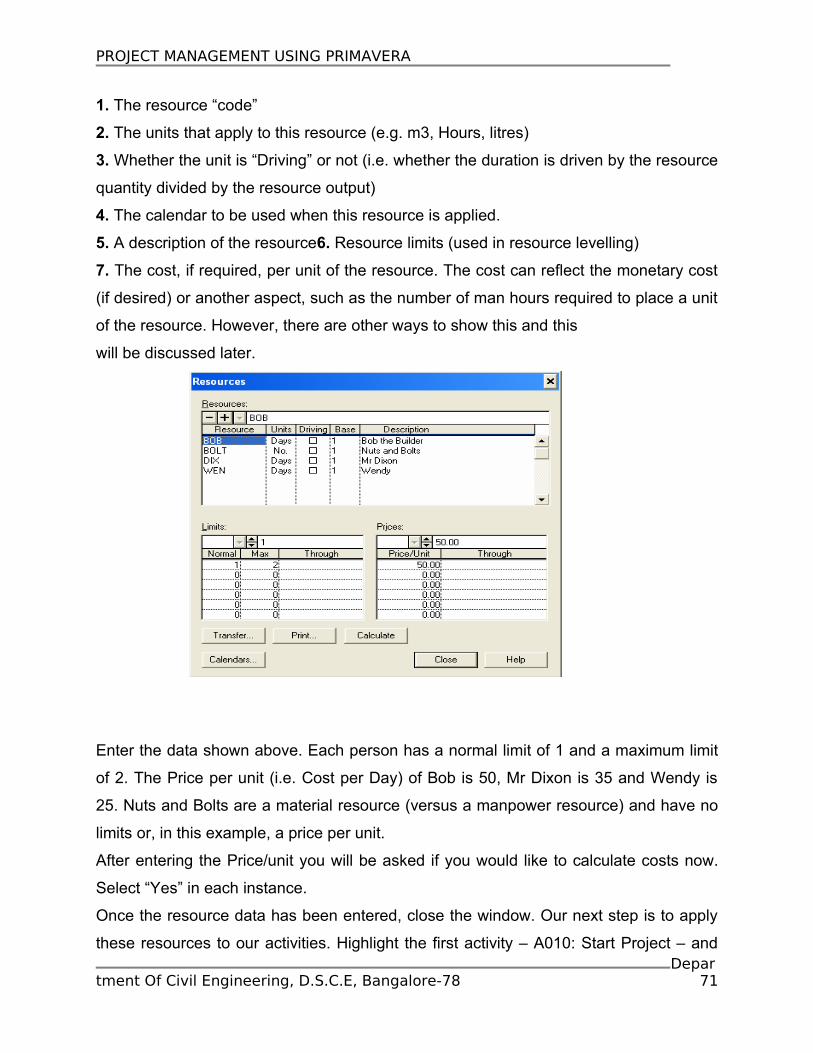
The first step is to establish a resource “dictionary” of the resources we wish to define
for the project. Data > Resources opens the following window:
Department Of Civil Engineering, D.S.C.E, Bangalore-78 70
PROJECT MANAGEMENT USING PRIMAVERA
1. The resource “code”
2. The units that apply to this resource (e.g. m3, Hours, litres)
3. Whether the unit is “Driving” or not (i.e. whether the duration is driven by the resource
quantity divided by the resource output)
4. The calendar to be used when this resource is applied.
5. A description of the resource6. Resource limits (used in resource levelling)
7. The cost, if required, per unit of the resource. The cost can reflect the monetary cost
(if desired) or another aspect, such as the number of man hours required to place a unit
of the resource. However, there are other ways to show this and this
will be discussed later.
Enter the data shown above. Each person has a normal limit of 1 and a maximum limit
of 2. The Price per unit (i.e. Cost per Day) of Bob is 50, Mr Dixon is 35 and Wendy is
25. Nuts and Bolts are a material resource (versus a manpower resource) and have no
limits or, in this example, a price per unit.
After entering the Price/unit you will be asked if you would like to calculate costs now.
Select “Yes” in each instance.
Once the resource data has been entered, close the window. Our next step is to apply
these resources to our activities. Highlight the first activity – A010: Start Project – and Depar
tment Of Civil Engineering, D.S.C.E, Bangalore-78 71
PROJECT MANAGEMENT USING PRIMAVERA
press Ctrl+R (or from the dropdown menu, View > Resource Detail). The following
window will appear:
Now click the “+” sign and the down-triangle and your will be presented with a list of
resources which you can apply to this activity. Let us assume that Bob is required to
start the project – to sign the papers and set out the works. Select “Bob” as the resource
and enter 1 unit per day. The budgeted quantity should immediately become “1” (i.e. 1
unit/day * 1 day). Now, with the cursor in the “Resource” box of this window (i.e.
highlighting BOB), press the right arrow to create another resource. This time use the
resource “Nuts and Bolts” and enter an amount in the Budgeted Quantity of “10”. The
number 10 should also appear in the “Units per Day” column. Highlight the next activity
add resources as per this table:
Department Of Civil Engineering, D.S.C.E, Bangalore-78 72
PROJECT MANAGEMENT USING PRIMAVERA
Close the Resource window and change two of the columns to show the resource
assignments… the column titles will be “Resource” and “Budgeted Quantity”:
Primavera cannot, unfortunately, show more than one resource in this view: it “lumps
together” the resources so that the total Budgeted Quantity is shown for all resources
applied to that activity.We can see how these resources are distributed across time in a
resource profile. Press the button (alternatively, from the dropdown menu, View >
Resource Profile or Ctrl+F7).
This should appear at the bottom of the screen:
This is the resource profile for the resource (or person) “BOB” – Bob The Builder. We
can see he spends a total of 8 days on site, the majority towards the end of March.
We need to modify this to tell us exactly what we want.
Press the “Display” button (under the “Select” button in the Resource Profile/Table
window) and this window will appear:
Department Of Civil Engineering, D.S.C.E, Bangalore-78 73
PROJECT MANAGEMENT USING PRIMAVERA
1. Would you like to see the Units or the Cost (as entered) of those units? i.e. Units or
(Cost/Unit) x Units.
2. Would you like the graphs to show their data based on “Early
Start” dates or “Late Start” dates.
3. Should the graphs show data collected from all activities or only the currently
selected activities.
4. Gives the time interval for the graph data (i.e. a new bar in a histogram chart or a new
plot-point in a line (“curves”) graph.
5. Allows you to choose the type of graph to be displayed – histogram or curves (line
graph).
Department Of Civil Engineering, D.S.C.E, Bangalore-78 74
PROJECT MANAGEMENT USING PRIMAVERA
The following (6 to 10) apply to histograms only:
6. Do you want the graph to display totals per defined time interval (4.), average or peak
usage.
7. Histogram format: Area
or Bar
8. Values, these are used once progress has been entered and the requirement is to
compare planned and actual.
9. Allows you to define the calendar to be used when calculating average resource
usage (i.e. may cause a difference if a resource is only used on a four day week when
the activity runs through a five day week)
10. Drawing of Limits and Overloads refers to resource peak usage and levelling.
11. Refers to the resource usage curves: allow you to define different lines for the
various curves being shown.
Alternatively Primavera will use different colours to highlight the different data lines.
More information on these can be found by pressing the “Help” button.
Change the contents of the window to this:
Depar
tment Of Civil Engineering, D.S.C.E, Bangalore-78 75
PROJECT MANAGEMENT USING PRIMAVERA
Press “Close” and select the resource “BOLT” from the window in the drop-down menu
in the Resource Profile/Table area. Your histogram display should look like this:
This tells us that we will be using a total of about 120 bolts and their distribution across
the project. If we want to see the precise number we should select the resource table,
rather than the graph.
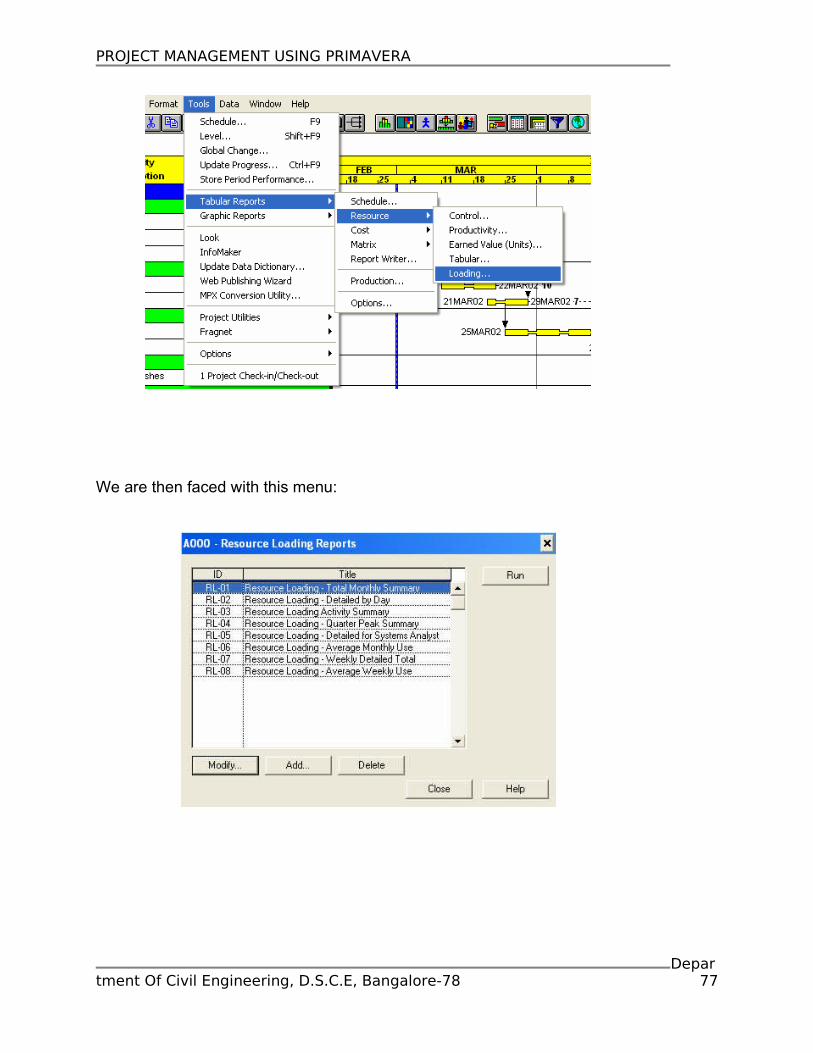
Press the button (Or View > Resource Table or Shift+F7) and select “BOB” from
the drop-down resource list. Your display should change to:
Here we now see the weekly total number of days that each person will be required to
spend on the job, as well as the weekly total numbers of bolts used.
Exporting this data out of Primavera is tricky… it is a case of finding the correct report
type and modifying it to your requirements.
To export this report we need to run report RL-01. It can be found here:
Department Of Civil Engineering, D.S.C.E, Bangalore-78 76
PROJECT MANAGEMENT USING PRIMAVERA
We are then faced with this menu:
Department Of Civil Engineering, D.S.C.E, Bangalore-78 77
PROJECT MANAGEMENT USING PRIMAVERA
Report RL-01 is already selected. Click the “Modify…” button and these windows will
appear. Make the modifications highlighted to create the report we require. The various
screens can be accessed by clicking the “Tabs” under the Title.
Leave this selection blank to select all resources. If we wanted to omit a resource (e.g.
Nuts and Bolts) we could put the condition “NE” (not equal to) under profile and the
resource “NUTS” under “Low Value Resource”
Department Of Civil Engineering, D.S.C.E, Bangalore-78 78
PROJECT MANAGEMENT USING PRIMAVERA
Important points to note here are to generate the report in primavera (1), to organise by
Resource and produce a summary report (2) and to display row totals on the left (3).
The selection is irrelevant to us – we want a report for the whole project. However we
could filter for any of the codes that we have established, in the same way that we
filtered the project in Chapter 7
Finally we set the time we require our report to span (1) and the time unit we require the
report (3). We can also specify whether we want the report to show Total, Peak or
Department Of Civil Engineering, D.S.C.E, Bangalore-78 79
PROJECT MANAGEMENT USING PRIMAVERA
Average resource usage (2). With this information set we can run the report. Click the
“Run” button in the top right hand corner of the window. This window will appear:
We want to see this report on screen so click “OK” and the Primavera report writer will
produce the required report:
To get this report into Excel format, where the data could be manipulate and the report
format modified, we can first copy and paste this data into Microsoft Word, then copy
and paste it again onto an Excel spreadsheet.
For instance, you will notice that due to the width of the report, it spans two pages. We
can copy and paste both pages into Excel and reformat them to a single page. Note that
the export copies only the values of the data and formulae will have to be replaced (e.g.
the weekly totals). A direct copy from Primavera Look to Excel will not work.Depar
tment Of Civil Engineering, D.S.C.E, Bangalore-78 80
PROJECT MANAGEMENT USING PRIMAVERA
5.8 REPORTING PROGRESS
The first thing that we should do though, is save our original programme as a “baseline”
programme against which future revisions and progress updates can be measured. So
open and run the filter for “All Activities” (FL-01) to restore all activities to our layout.
Then save our current layout either through the drop-down menu or by pressing Ctrl+S.
We now need to copy this programme. Again, from the drop down menus highlight
“Copy…”:
That will open this window:
Department Of Civil Engineering, D.S.C.E, Bangalore-78 81
PROJECT MANAGEMENT USING PRIMAVERA
1. Represents the programme being copied – A000 should be highlighted under the
“Projects:” heading.
2. This section shows what you want to copy the programme to. Ensure that the
directory is correct (C:\Primaverawin\projects\house). The first field required to be filled
in is “Project group:” – enter in P101 (i.e. Progress Report 1 of programme A001). The
second field will be our Revision – to indicate that this is a progress update
Press the “Copy” button and the programme is copied. Open up our newly created
programme A101 through the File-Open drop-down menu and it will open over your
original programme. We now always need to be able to compare our progressed
Department Of Civil Engineering, D.S.C.E, Bangalore-78 82
PROJECT MANAGEMENT USING PRIMAVERA
programme to our original or “baseline” programme. We therefore need to call our
original programme the “Target Programme”. We can identify it as such here:
… This opens the following window:
With the Target space beside “1” highlighted press the down arrow in the input area and
select “A000”, our original programme. Click OK and programme “A000” is set as the
Target programme of A101. Now we need to show this target programme in order that,
when progressed, we can see the variation in the bars. Press Ctrl+F11 to bring up our
Department Of Civil Engineering, D.S.C.E, Bangalore-78 83
PROJECT MANAGEMENT USING PRIMAVERA
Bar editing window. Create a new bar under the current “Early Bar” and use these
settings (changes indicated with a ):
Click on “OK” and “Close”. Your display should adjust to this:
The black line indicates the “target” or baseline programme; the yellow indicates the
currently open programme. If adjustments are made to the programme, the yellow lines
will move but the black lines will remain in their current positions. The next step is to
organise our columns for easy data entry. Press F11 and arrange the columns like this:
Department Of Civil Engineering, D.S.C.E, Bangalore-78 84
PROJECT MANAGEMENT USING PRIMAVERA
That is, replace the columns created for the Activity Codes with “Actual Start”, “Actual
Finish” and “Remaining Duration”. Click “OK” and your display should adjust to:
We are going to report progress up to the 23 March 2002. Primavera has a facility
whereby you can highlight the activities that could be affected by progress up to a
particular date. Press the Progress Spotlight - - button and the display will adjust to
this:
Department Of Civil Engineering, D.S.C.E, Bangalore-78 85
PROJECT MANAGEMENT USING PRIMAVERA
The progress spotlight, by default, highlights one week after the current Data Date. We
need to adjust it to highlight the area we wish to progress. Move your cursor over the
rightmost vertical blue line and the cursor will change to . Drag the vertical blue line
to Starting and release. Your display should now look like this:
The five activities affected by the progress “spotlight” are highlighted in yellow. We can
now enter our progress. This is done by entering Actual Start and Actual Finish dates in
the relevant columns. Note that once an “Actual Finish” date is entered, the “Remaining
Duration” automatically reverts to 0.
Enter the following:
In addition to the spotlighted activities, progress has also been entered for Activity
A060: that activity has immediately become part of the “spotlight”.
Once progress has been entered press F9 and schedule the programme to our new
date.
The display should look like this:
Department Of Civil Engineering, D.S.C.E, Bangalore-78 86
PROJECT MANAGEMENT USING PRIMAVERA
A few things to note about the progress reflected: The projected time to completion now
takes into account any links active on that Activity. For instance, A050 only has five
days remaining duration, yet is pushed out to 9 April. The programme reflects the FF+5
day link from A040, which is due to finish on the 2 April, 1 week earlier.
Other necks are reflections of weekends and non-work periods. For instance, the period
of time immediately after the new Data Date is a weekend: there is no activity over a
weekend so the bar is necked. Finally we can see the slippage suffered as a result of
lack of progress in a column called “Variance Target 1 Early Finish” – this column
measures the difference, in days, between the Early Finish of this programme and the
Early Finish of the Target Programme.
Here we can see that the late start of the project pushed back the initial activities by 1
day: later delays in foundations resulted in 7 days being lost. Some early work on the
Department Of Civil Engineering, D.S.C.E, Bangalore-78 87
PROJECT MANAGEMENT USING PRIMAVERA
superstructure has allowed us to recapture 1 day: the overall loss currently is 6 days
behind programme.
For the next progress update, copy the previous progress update into a new programme
and report progress there. Primavera allows two targets to be nominated – slippage (or
gains) on the end date can then be measured against the previous update and the
baseline programme. So we’ve measured time, but how can we compare budgeted
resource usage with actual? Highlight activity A010 and press Ctrl +R. Your resource
window should open.
5.9 PRINTING REPORTS AND GRAPHICS
In addition to printing layouts, P3 provides reports and graphics that you can produce by
specifying options about their content, format, order, and selection. P3 saves your
specifications for each report or graphic type so you can reuse them whenever you
need, such as for weekly meetings. Define as many different specifications as you want
and run a series of reports or graphics to save time. Available reports include tabular
schedule, activity matrix, resource/cost loading, resource matrix, cash flow, and many
more. Presentation-quality graphics include Bar charts, timescaled and pure logic
diagrams, and resource and cost graphics.
Produce a report or graphic Choose Tools, Tabular Reports, to produce reports or
Tools, Graphic Reports, to produce graphics.
Department Of Civil Engineering, D.S.C.E, Bangalore-78 88
PROJECT MANAGEMENT USING PRIMAVERA
Preview reports and graphics Preview a report or graphic before printing it by viewing
it onscreen in Primavera Look. Choose View On Screen in the Tabular or Graphic
Reports Options dialog box. You can also start Look by choosing Tools, Look.
Department Of Civil Engineering, D.S.C.E, Bangalore-78 89
PROJECT MANAGEMENT USING PRIMAVERA
Department Of Civil Engineering, D.S.C.E, Bangalore-78 90
PROJECT MANAGEMENT USING PRIMAVERA
CONCLUSION
• This guide has taken you through the basic functions of Primavera. It has also
given a firm grounding in navigating the menu options in Primavera and entering
data.
• For further general practice it is recommended that you access Primavera’s
tutorial functions (the button in the top toolbar will access these lessons.
Department Of Civil Engineering, D.S.C.E, Bangalore-78 91