The HR The HR Dashboard Dashboard Developing a Powerful Measure Developing a Powerful Measure for tracking HR Results for tracking HR Results Lee Wiersma and Lee Wiersma and Jeffrey Russell Jeffrey Russell
Transcript
The HR The HR DashboardDashboard
Developing a Powerful Measure Developing a Powerful Measure for tracking HR Resultsfor tracking HR Results
Lee Wiersma andLee Wiersma andJeffrey RussellJeffrey Russell
2.2. Discuss the two types of measures: Discuss the two types of measures: lagginglagging and and leadingleading —— and how to use each.and how to use each.
3.3. Identify the Identify the prerequisitesprerequisites for developing an “for developing an “HR HR DashboardDashboard” of leading indicators.” of leading indicators.
4.4. Describe Describe methodsmethods for developing the HR for developing the HR Dashboard.Dashboard.
5.5. Identify how the HR Dashboard is used to Identify how the HR Dashboard is used to influenceinfluence HR, HRD, and OD policies and HR, HRD, and OD policies and practices.practices.
Improving Human PerformanceImproving Human Performance
•• How can HR and HRD professionals How can HR and HRD professionals move an organization toward move an organization toward improvement in human improvement in human performance?performance?
•• What HR initiatives enable great What HR initiatives enable great performance as an organizational performance as an organizational outcome?outcome?
•• How do you know if your HR How do you know if your HR efforts are efforts are successfulsuccessful??
•• How do you How do you measuremeasure the the effects or results of these effects or results of these HR, training, and OD efforts?HR, training, and OD efforts?
•• How will you How will you knowknow that your that your efforts and initiatives have efforts and initiatives have paid off?paid off?
Measuring Health Measuring Health AfterAfter the Factthe Fact
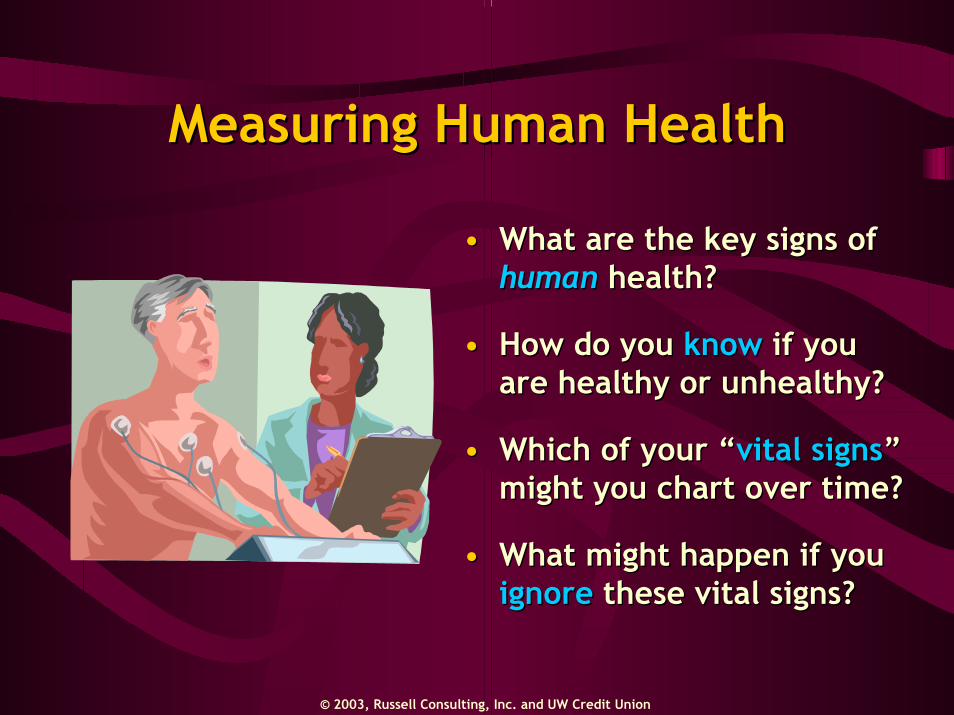
•• Tracking your “vital signs” along the way can Tracking your “vital signs” along the way can give you an early warning of emerging health give you an early warning of emerging health concerns.concerns.
•• Failing to measure these vital signs Failing to measure these vital signs —— or ignoring or ignoring the signs can lead to . . .the signs can lead to . . .
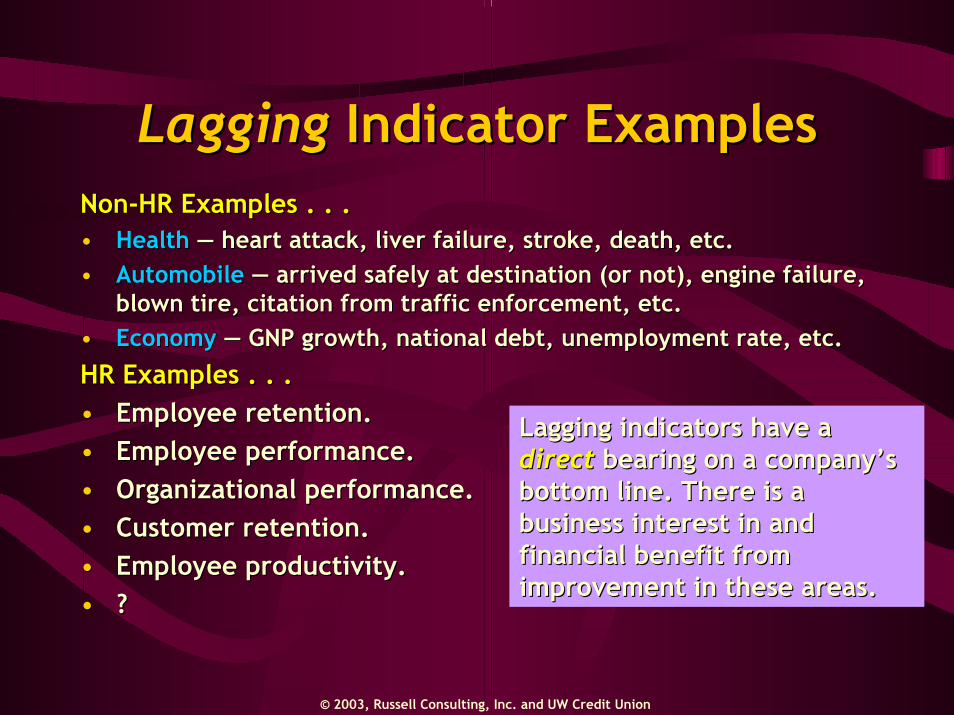
Lagging indicators are Lagging indicators are outcome outcome measuresmeasures that help you gauge that help you gauge your HR progress by examining your HR progress by examining the final end result or the final end result or outcomesoutcomes of your collective of your collective efforts.efforts.
Use of the “lagging” term Use of the “lagging” term reflects the reflects the delaydelay or gap or gap between your actions and a between your actions and a change in the final end result.change in the final end result.
Characteristics
•• OutcomeOutcome measure.measure.
•• Indicates the Indicates the end end resultresult of the system.of the system.
•• Tells you what Tells you what happened, not what happened, not what isishappening.happening.
•• Less effective at Less effective at measuring the effects measuring the effects of specific changes of specific changes made to the system.made to the system.
Lagging indicators have a Lagging indicators have a directdirect bearing on a company’s bearing on a company’s bottom line. There is a bottom line. There is a business interest in and business interest in and financial benefit from financial benefit from improvement in these areas.improvement in these areas.
Leading indicators are Leading indicators are process process measuresmeasures that help you gauge that help you gauge incrementalincremental progress you are progress you are making toward key HR making toward key HR outcome (lagging) measures.outcome (lagging) measures.
Since leading indicators measure the Since leading indicators measure the results from your results from your processesprocesses, there is , there is less of a less of a delaydelay between your actions between your actions and a change in the system.and a change in the system.
They are the They are the performance driversperformance drivers ——the key factors that enable the overall the key factors that enable the overall end result (outcome) you want to end result (outcome) you want to achieve.achieve.
Characteristics
•• ProcessProcess measure.measure.
•• ImmediateImmediate feedback to feedback to the system.the system.
•• Tells you what Tells you what isishappening happening nownow..
•• Can be tracked over Can be tracked over time.time.
•• Provides an “Provides an “early early warningwarning” of emerging ” of emerging results.results.
•• Very Very responsiveresponsive to to changes in the systemchanges in the system
odometer, oil level, indicator lights, rumble strips on the roadodometer, oil level, indicator lights, rumble strips on the roadway, way, GPS coordinates, etc.GPS coordinates, etc.
•• EconomyEconomy —— home starts, capital equipment purchases, layoffs, home starts, capital equipment purchases, layoffs, stock market value, public confidence, exchange rates, etc.stock market value, public confidence, exchange rates, etc.
Leading indicators have an Leading indicators have an indirectindirect bearing on a company’s bearing on a company’s bottom line. While there bottom line. While there isis a a business interest in improvement business interest in improvement in these areas, there is not often in these areas, there is not often an immediate financial benefit to an immediate financial benefit to the company. the company.
–– Active and Progressive Board of Directors.Active and Progressive Board of Directors.•• Strong ties within UW Madison community.Strong ties within UW Madison community.
•• Commitment to being “Employer of Choice”.Commitment to being “Employer of Choice”.
•• Introduce level of accountability.Introduce level of accountability.
–– Shift in Business FocusShift in Business Focus
•• Known as “Student Bank” in past.Known as “Student Bank” in past.•• “Order Takers” to “Retail Environment”.“Order Takers” to “Retail Environment”.•• Appropriate growth.Appropriate growth.
–– Human Capital ImprovementHuman Capital Improvement
What is the HR Dashboard?What is the HR Dashboard?The UW Credit Union’s HR Dashboard is a panel of indicators The UW Credit Union’s HR Dashboard is a panel of indicators that present a reading of the relative health/satisfaction of that present a reading of the relative health/satisfaction of credit union employees on three dimensions: credit union employees on three dimensions: QWL Score, Core QWL Score, Core Values, Values, andand Overall Job SatisfactionOverall Job Satisfaction..
“Working for members to enable their financial “Working for members to enable their financial dreams.”dreams.”
•• Strategic Position:Strategic Position:
“Grow through respect in our marketplace, and “Grow through respect in our marketplace, and by developing relationships through customer by developing relationships through customer intimacy.”intimacy.”
Culture of Culture of AccountabilityAccountability
•• Core ValuesCore Values–– Act in the members' best interestAct in the members' best interest–– Embrace ChangeEmbrace Change–– EducationEducation–– TeamworkTeamwork–– Work/Life BalanceWork/Life Balance
•• Staff perception measured on regular Staff perception measured on regular basis.basis.
•• Leadership expectations definedLeadership expectations defined–– Multiple feedback mechanisms utilized including Multiple feedback mechanisms utilized including
Integrated Performance Integrated Performance Management SystemManagement System
•• Traditional performance appraisal system disbanded Traditional performance appraisal system disbanded in mid 1990’s.in mid 1990’s.
•• Compensation system not upCompensation system not up--toto--date, inadequate date, inadequate merit type system.merit type system.
•• Connections Process Implemented in 2001.Connections Process Implemented in 2001.–– Development of position accountabilities.Development of position accountabilities.–– Development of skill inventories.Development of skill inventories.–– Consistent & regular feedback, coaching, & alignment.Consistent & regular feedback, coaching, & alignment.–– The Cardwell Group, James Cardwell & Karla Norwood.The Cardwell Group, James Cardwell & Karla Norwood.–– www.connectionsonline.netwww.connectionsonline.net / 800/ 800--395395--1410.1410.
•• Pay for performance compensation system Pay for performance compensation system implemented in 2002.implemented in 2002.
–– Base pay Base pay –– Bonus (Variable Reward)Bonus (Variable Reward)
•• All staff must have sufficient access.All staff must have sufficient access.
•• Use of intranet technologies.Use of intranet technologies.–– CommunicationCommunication
•• UpUp--toto--date and relevant.date and relevant.•• Share results of data.Share results of data.•• Procedures, policies, training.Procedures, policies, training.
–– Delivery system for “Connections.”Delivery system for “Connections.”
•• Use of EUse of E--mail systemsmail systems–– Delivery of surveysDelivery of surveys
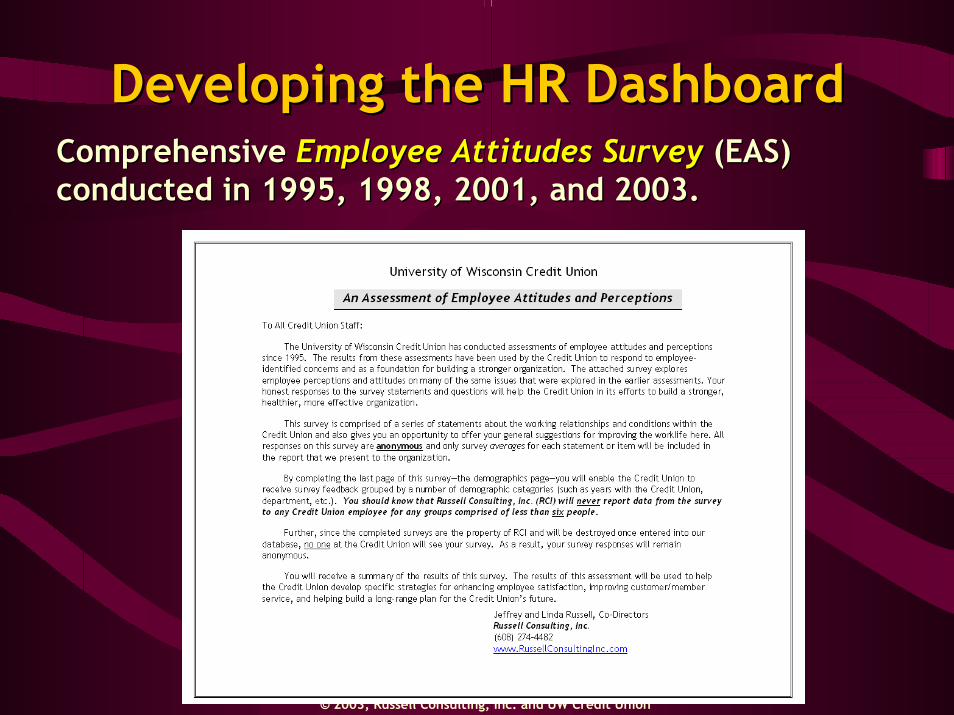
Developing the HR DashboardDeveloping the HR DashboardComprehensive Comprehensive Employee Attitudes SurveyEmployee Attitudes Survey (EAS) (EAS) conducted in 1995, 1998, 2001, and 2003.conducted in 1995, 1998, 2001, and 2003.
•• OpenOpen--Ended Questions Ended Questions —— (a) what people lik(a) what people like e best best about working for credit union and (b) ideas to about working for credit union and (b) ideas to improveimprove QWL.QWL.
1.1. Quarterly SurveyQuarterly Survey —— (a) 20 questions, (b) (a) 20 questions, (b) five core values, (c) overall satisfaction, five core values, (c) overall satisfaction, and (d) two openand (d) two open--ended questions.ended questions.
2.2. Sample SizeSample Size —— 60 to 65 employees.60 to 65 employees.3.3. ValidityValidity —— accurate +/accurate +/-- 1%.1%.4.4. AdministrationAdministration —— ee--mail link to survey.mail link to survey.5.5. ConfidentialityConfidentiality —— external consultant.external consultant.6.6. ReportingReporting Results Results —— Three “instruments” Three “instruments”
•• I feel pride and a sense of accomplishment in the work that I I feel pride and a sense of accomplishment in the work that I do. do.
•• I have input into how I perform my job.I have input into how I perform my job.
•• I feel appreciated for the good work that I do.I feel appreciated for the good work that I do.
•• My direct supervisor gives me clear performance expectations My direct supervisor gives me clear performance expectations that enable me to do quality work.that enable me to do quality work.
•• The Credit UnionThe Credit Union’’s managers and supervisors have clearly s managers and supervisors have clearly communicated the future direction and goals of the Credit communicated the future direction and goals of the Credit Union to me.Union to me.
Example Value StatementsExample Value Statements•• Embrace changeEmbrace change: proactively seek improvement; : proactively seek improvement;
anticipate and support change to meet corporate anticipate and support change to meet corporate strategies and goals; take calculated risks and learn strategies and goals; take calculated risks and learn from experience.from experience.
665544332211
AlwaysAlwaysAlmost Almost AlwaysAlwaysGenerallyGenerallySometimesSometimesAlmost Almost
NeverNeverNeverNever
CurrentCurrent
665544332211
AlwaysAlwaysAlmost Almost AlwaysAlwaysGenerallyGenerallySometimesSometimesAlmost Almost
NeverNeverNeverNever
DesiredDesired
The difference between “current” and “desired = A “gap of 2.0The difference between “current” and “desired = A “gap of 2.0
Considering everything, how satisfied are Considering everything, how satisfied are you you overalloverall with working at the University of with working at the University of Wisconsin Credit Union? Place a mark in the Wisconsin Credit Union? Place a mark in the box that best reflects your box that best reflects your overalloverall job job satisfaction level here. satisfaction level here.
What is the HR Dashboard?What is the HR Dashboard?
3/033/03
The UW Credit Union’s HR Dashboard is a panel of indicators The UW Credit Union’s HR Dashboard is a panel of indicators that present a reading of the relative health/satisfaction of that present a reading of the relative health/satisfaction of credit union employees on three dimensions:credit union employees on three dimensions:QWL Score, Core Values, QWL Score, Core Values, andand Overall Job SatisfactionOverall Job Satisfaction..
5.5. Relationship to other critical measures:Relationship to other critical measures:–– Member/Customer SatisfactionMember/Customer Satisfaction–– Member RetentionMember Retention–– Financial PerformanceFinancial Performance–– Employee SatisfactionEmployee Satisfaction–– Internal Customer ServiceInternal Customer Service
6.6. Focus of monthly management meetings.Focus of monthly management meetings.7.7. Explore the differences between groups Explore the differences between groups
Differences Between Retail Differences Between Retail and Support Departmentsand Support Departments
•• 2001 kicked off retail training for frontline staff.2001 kicked off retail training for frontline staff.
•• In order to be member focused, we needed to be In order to be member focused, we needed to be “Frontline or Retail focused first”.“Frontline or Retail focused first”.
•• Limited training for support staff.Limited training for support staff.
•• Beginning of “Refi” boom.Beginning of “Refi” boom.
•• Active improvement of retail managementActive improvement of retail management
•• Reorganization of support staff & departments.Reorganization of support staff & departments.
1.1. Select the right measures Select the right measures —— and adjust as issues and adjust as issues emerge.emerge.
2.2. Establish realistically challenging goals or targets.Establish realistically challenging goals or targets.
3.3. Present the HR Dashboard graphically: radial Present the HR Dashboard graphically: radial dials, bar charts, and line charts.dials, bar charts, and line charts.
4.4. Provide guidance to leadership and staff in how Provide guidance to leadership and staff in how to interpret and respond.to interpret and respond.
5.5. Allow time for the HR Dashboard to tell the story; Allow time for the HR Dashboard to tell the story; dondon’’t move too quickly to make changes or t move too quickly to make changes or adjust your HR efforts.adjust your HR efforts.
6.6. Use openUse open--ended comments carefully.ended comments carefully.
7.7. Anchor the quarterly assessments with periodic Anchor the quarterly assessments with periodic assessments of the entire employee population.assessments of the entire employee population.
8.8. If using the HR Dashboard in variable compensation: If using the HR Dashboard in variable compensation: (a) use as only one component and (b) test the HR (a) use as only one component and (b) test the HR Dashboard methodology for at least one full year to Dashboard methodology for at least one full year to test its volatility and its responsiveness to managerial test its volatility and its responsiveness to managerial actions.actions.
9.9. Use the HR Dashboard to help you identify areas of Use the HR Dashboard to help you identify areas of ““high leveragehigh leverage”” for effecting change in employee for effecting change in employee attitudes.attitudes.
For a For a FREEFREE copy of our PowerPoint presentation (in copy of our PowerPoint presentation (in PDF format) go to: PDF format) go to: www.RussellConsultingInc.comwww.RussellConsultingInc.com