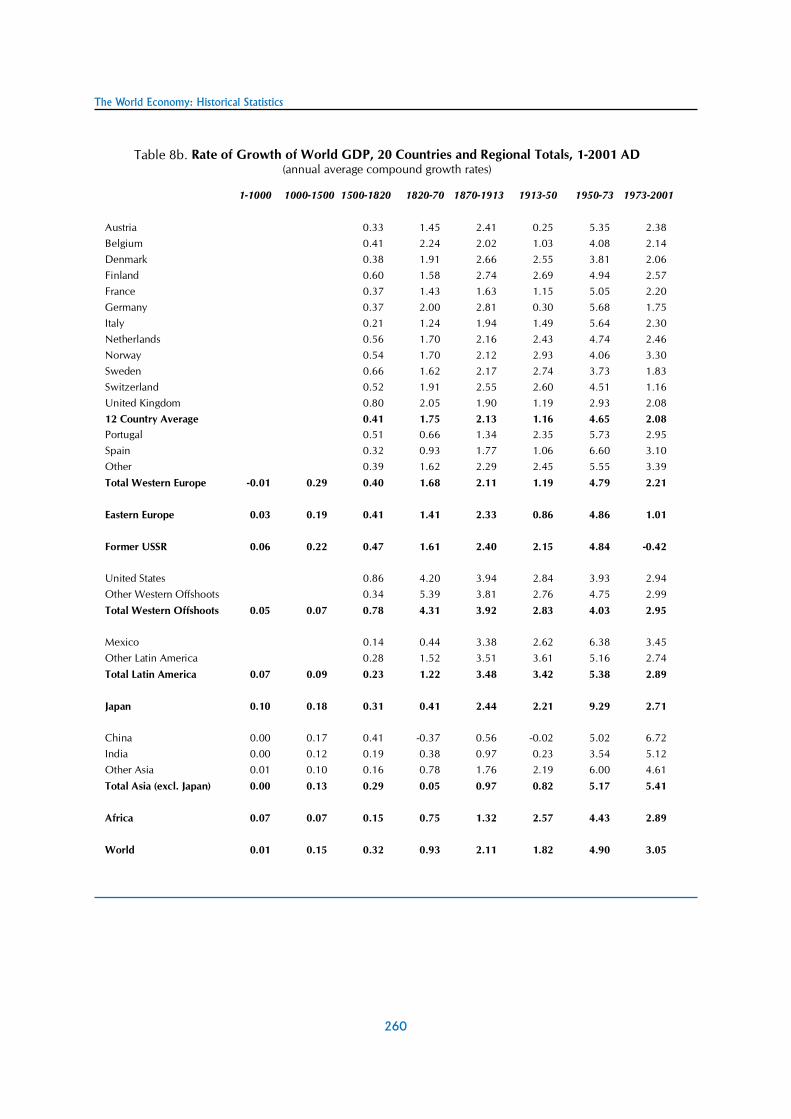
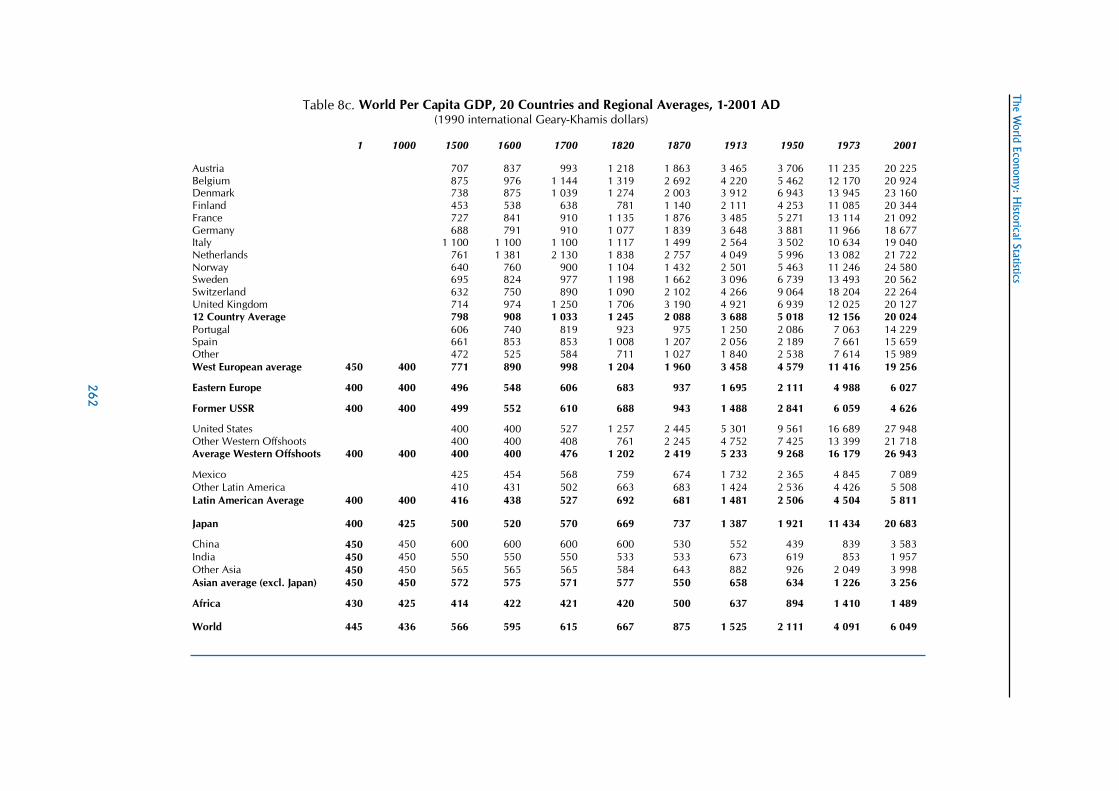
241 The World Economy, 1-2001 AD HS–8: The World Economy, 1–2001 AD Tables HS–8 show levels of population, GDP and per capita GDP in 20 countries, 7 regions and the world for eight benchmark years in the past two millennia. There are also 5 analytical tables showing rates of growth and shares of world population and GDP. HS–7 explained the derivation of estimates for 1950–2001. Earlier than this, it is useful to distinguish between estimates for 1820–1950 and those for the centuries before 1820 where the documentation is weaker and the element of conjecture bigger. Population Movement 1820–1950 For West European countries and Western Offshoots, population estimates for this period are based mainly on censuses dating back to the eighteenth century for Scandinavia and Spain and the early nineteenth for most other countries. The sources are described in HS–1 and HS–2. For Western Europe, annual estimates, adjusted to a midyear basis are shown for all countries back to 1820. For Western Offshoots, they are shown separately for the indigenous population and those of European/ African origin at decade intervals for 1820–1870, with annual estimates for the total population thereafter. For Eastern Europe, annual estimates are shown from 1920. Before the first world–war, these countries were divided between the Austro–Hungarian, Ottoman, Russian and German Empires. Derivation of estimates in the territory corresponding to present boundaries is possible, but they are too rough to warrant presentation on an annual basis. Estimates for the territory of the former USSR are also too rough to warrant annual presentation before 1920. Population sources are described in HS–3. For Latin America annual estimates are shown back to 1900 for 23 countries. The 1820 and 1870 estimates in Maddison (2001) for the smaller countries are revised and augmented from the Cambridge History of Latin America, Engerman and Higman (1997) and other sources cited in HS–4. For Asia annual estimates are shown from 1913 for the 16 core countries, and for benchmark years 1820, 1850 1870 1890 and 1900. For China, India, Indonesia and Japan annual estimates are shown back to 1870. For other countries there are estimates for benchmark years 1820, 1870, 1900 and 1913. In most cases the sources in HS–5 are the same as in Maddison (2001). For Africa, the statistical basis is weaker than elsewhere. I show no annual estimates before 1950, but give detail for the sample countries for 1820, 1870 and 1913 in Table 6–10 of HS–6. Population Change 1–1820 AD For the centuries before 1820 the most comprehensive evidence is for population and it is of greater proportionate importance for analysis as per capita income growth was much slower then and economic growth was largely extensive.
Transcript
241
The World Economy, 1-2001 AD
HS–8: The World Economy, 1–2001 AD
Tables HS–8 show levels of population, GDP and per capita GDP in 20 countries, 7 regions andthe world for eight benchmark years in the past two millennia. There are also 5 analytical tablesshowing rates of growth and shares of world population and GDP. HS–7 explained the derivation ofestimates for 1950–2001. Earlier than this, it is useful to distinguish between estimates for 1820–1950and those for the centuries before 1820 where the documentation is weaker and the element ofconjecture bigger.
Population Movement 1820–1950
For West European countries and Western Offshoots, population estimates for this period arebased mainly on censuses dating back to the eighteenth century for Scandinavia and Spain and theearly nineteenth for most other countries. The sources are described in HS–1 and HS–2. For WesternEurope, annual estimates, adjusted to a midyear basis are shown for all countries back to 1820. ForWestern Offshoots, they are shown separately for the indigenous population and those of European/African origin at decade intervals for 1820–1870, with annual estimates for the total population thereafter.
For Eastern Europe, annual estimates are shown from 1920. Before the first world–war, these countrieswere divided between the Austro–Hungarian, Ottoman, Russian and German Empires. Derivation ofestimates in the territory corresponding to present boundaries is possible, but they are too rough towarrant presentation on an annual basis. Estimates for the territory of the former USSR are also toorough to warrant annual presentation before 1920. Population sources are described in HS–3.
For Latin America annual estimates are shown back to 1900 for 23 countries. The 1820 and1870 estimates in Maddison (2001) for the smaller countries are revised and augmented from theCambridge History of Latin America, Engerman and Higman (1997) and other sources cited in HS–4.
For Asia annual estimates are shown from 1913 for the 16 core countries, and for benchmarkyears 1820, 1850 1870 1890 and 1900. For China, India, Indonesia and Japan annual estimates areshown back to 1870. For other countries there are estimates for benchmark years 1820, 1870, 1900and 1913. In most cases the sources in HS–5 are the same as in Maddison (2001).
For Africa, the statistical basis is weaker than elsewhere. I show no annual estimates before1950, but give detail for the sample countries for 1820, 1870 and 1913 in Table 6–10 of HS–6.
Population Change 1–1820 AD
For the centuries before 1820 the most comprehensive evidence is for population and it is ofgreater proportionate importance for analysis as per capita income growth was much slower then andeconomic growth was largely extensive.
242
The World Economy: Historical Statistics
Demographic changes, e.g. increases in life expectancy, changes in average age which affectlabour force participation, changes in the structure of the labour force, are important in providingclues to per capita income development. A striking example is the urbanisation ratio. Thanks to thework of de Vries for Europe and of Rozman for Asia, one can, for some countries, measure the proportionof population living in towns with more than 10 000 inhabitants. In the year 1000, this ratio wasvirtually zero in Europe (there were only 4 towns with more than 10 000 inhabitants) and in China itwas 3 per cent. By 1800 the West European urban ratio was 10.6 per cent, the Chinese 3.8 per cent.When countries are able to expand their urban ratios, it indicates a growing surplus beyond subsistencein agriculture, and suggests that the non–agricultural component of economic activity is increasing.These changing differentials in urban ratios were used to buttress other evidence on per capita progressin China and Europe in Maddison (1998). The Chinese bureaucracy kept population registers whichgo back more than 2 000 years. These records were designed to assess taxable capacity, and includeinformation on cultivated area and crop production, which was used by Perkins (1969) to assess longrun movements in Chinese output per capita. Bagnall and Frier (1994) made brilliant use of fragmentsof ancient censuses to estimate occupational structure, household size, marriage patterns, fertility andlife expectation in Roman Egypt of the third century.
Serious work on historical demography started in the seventeenth century with John Graunt (seePrologue). Modernised techniques and similar types of evidence have been used to make retrospectiveestimates of population for other European countries for periods before census material was available.Investigations of this character have been carried out by a) the Office of Population Research in PrincetonUniversity (established in 1936); b) INED (Institut National des Études Démographiques) founded inthe 1950s to exploit family reconstitution techniques developed by Louis Henry; c) the CambridgeGroup for the History of Population and Family Structure (established in the 1970s) has carried out amassive research project to reconstitute English population size and structure on an annual basis backto 1541 (Wrigley et al., 1997). This kind of analysis has been sharpened by the application of massivecomputing power.
Research on Japanese population history has blossomed under the leadership of Akira Hayamiand Osamu Saito. Ester Boserup’s (1965) analysis of the interaction between demographic pressure,agricultural technology and intensity of labour input in Asia has helped discredit simplistic Malthusianinterpretations. There has been a flood of publications on Latin American demography and the shipmentof slaves from Africa. As a result of these efforts we are better placed to measure long term changes inworld population. The most detailed and best documented are those in McEvedy and Jones (1978).This was the source of my estimates for Africa (see also the masterly analysis of African developmentin McEvedy, 1995).
Appendix B of Maddison 2001 provided source notes and estimates for 20 countries and 7 regionsfor benchmark years between the first century and 1700. In this study more country detail is shown forWestern Europe, Western Offshoots, Latin America back to 1500 and for Africa back to the first century.There are some changes in the regional totals for Africa (see Table 6–1), but none for other regions.
GDP Growth 1820–1950
Before the second worldwar, only 10 countries had official estimates of national income,assembled without international guidelines to provide comparability. None of these are suitable forour purpose, but there are retrospective official estimates of fairly recent vintage which I used forAustria from 1830, Norway from 1865, Netherlands from 1913, Canada from 1926 and the UnitedStates from 1929.
There were non–official estimates in pre–war years. Colin Clark (1940) made a comprehensivesurvey, but all those he cited have now been superseded. In the past 60 years, work on retrospectivenational accounts has been undertaken by a large number of scholars who have generally linked their
243
The World Economy, 1-2001 AD
series to official post–war estimates. The initial thrust for these exercises in quantitative economichistory was given by Simon Kuznets. His very long career included creation of official US accounts in1934 and 5 monographs of historical accounts for the United States in 1941–61. These set highstandards of scholarship with meticulous and transparent description of sources and methods. Thesecharacteristics have permitted succeeding generations of scholars to stand on his shoulders. Hispersuasive power and influence stemmed from professional integrity and depth of scholarship. Hewas free from partisanship, open to new ideas and willing to comment sympathetically in detail on thework of others. His influence was reinforced by his style of analysis–use of ideas that could be clearlyexpressed in literary form, and implemented with relatively simple statistical techniques. He encourageda band of scholars all over the world to consider that such an enterprise was feasible, exciting, importantand rewarding. He encouraged comparable studies for Australia, China, France, Germany, Italy, Japan,Sweden and the United Kingdom. To facilitate this research he helped found the International Associationfor Income and Wealth in 1947, persuaded the US Social Science Research Council to financecomparative research in other countries, and played a major role in the creation of the Yale GrowthCenter, which produced basic growth studies for Argentina, Egypt, Korea, Sri Lanka, Taiwan, and theUSSR. Between 1953 and 1989 he published 8 volumes containing 70 analytical essays comparing theresults which emerged from these quantitative studies and assessing their significance for the study of“modern economic growth”. The temporal horizon of this new generation of Kuznetsian scholarship wasconcentrated on developments since the mid–nineteenth century.
Several university centres are now active in this field, sponsoring their own research andstrengthening international networks by holding workshops. Kazushi Ohkawa organised a 14–volumestudy (1966–1988) of Japanese growth at Hitotsubashi University. The University now has an ambitiouscomparative project on the quantitative economic history of China, Indonesia, Korea, Taiwan and Vietnam.In the Netherlands, the University of Groningen has been active in this field since 1982. Its Growth andDevelopment Centre has played a major role in international studies of productivity levels and indeveloping an international database on economic growth. It has published research studies on GDPgrowth in Brazil, Germany, Indonesia, Japan, Korea, Mexico, the Netherlands, Taiwan, Thailand, and asix–country comparison for Latin America. It maintained close links with Jan Luiten van Zanden’s teamworking on Dutch growth in the University of Utrecht and with the University of Leuven’s research onlong–run growth in Belgium. It is also linked with the COPPAA group (Comparisons of Output, Productivityand Purchasing Power in Asia and Australia), based in Brisbane, which has carried out a number ofstudies of comparative performance of economies in the Asia–Pacific region, and was associated withthe research of Maddison (1998) on China and Sivasubramonian (2000) on India. Scandinavia has along history in this field. There have been five rounds of research in Sweden since 1937, and Olle Krantzhas made annual estimates of GDP growth since 1800. Riitta Hjerppe supervised a 13 volume study forFinland which was completed in 1989. Svend Aage Hansen produced the second major study of Danishgrowth in 1974, with annual GDP estimates back to 1818. There is now a Nordic Group, which isrevising the Scandinavian historical accounts to enhance their comparability. The International Associationfor Research in Income and Wealth (IARIW) has held conferences and workshops on measurement ofcomparative GDP growth and levels of performance, problems of methodology and definition since1949, and has published its quarterly Review of Income and Wealth since 1968. Its membership hasalways included official statisticians, established scholars working on historical accounts, and youngerresearchers serving their apprenticeship in this field and has played a major role in developing astandardised approach and extending the range of countries for which studies are available. The EuropeanHistorical Economics Society (EHES) has also been active in promoting research on quantitative economichistory since 1997 when it created the European Review of Economic History.
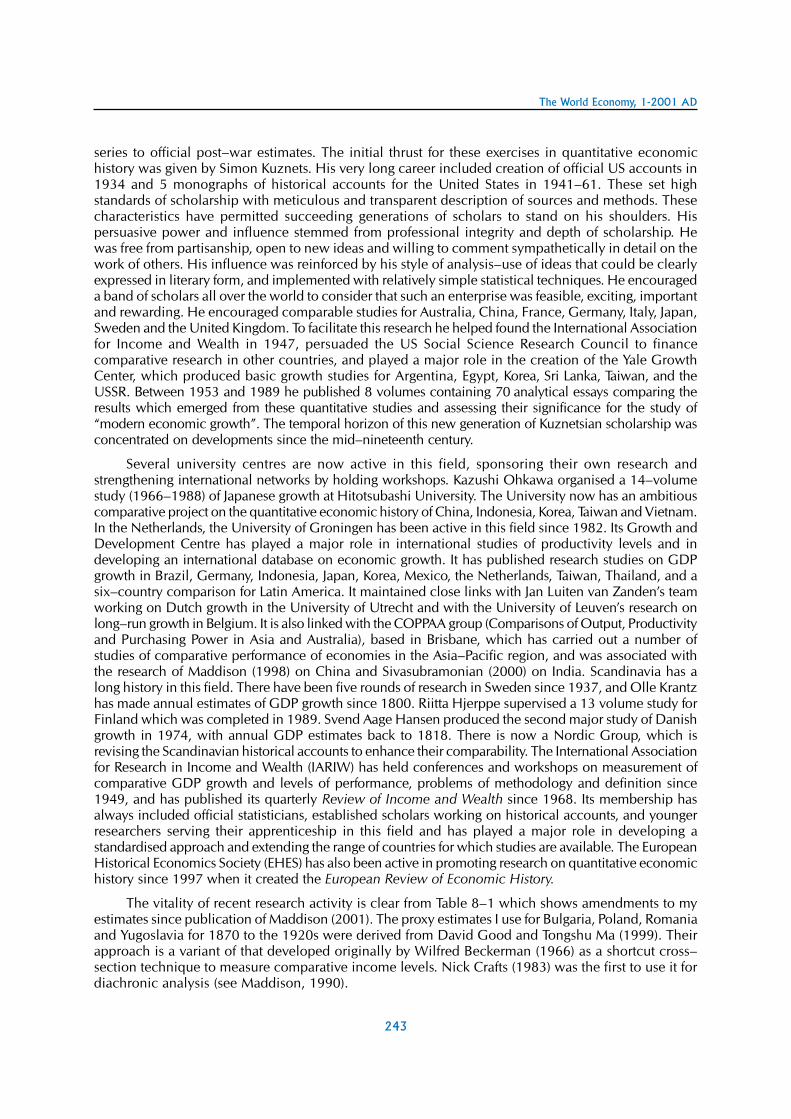
The vitality of recent research activity is clear from Table 8–1 which shows amendments to myestimates since publication of Maddison (2001). The proxy estimates I use for Bulgaria, Poland, Romaniaand Yugoslavia for 1870 to the 1920s were derived from David Good and Tongshu Ma (1999). Theirapproach is a variant of that developed originally by Wilfred Beckerman (1966) as a shortcut cross–section technique to measure comparative income levels. Nick Crafts (1983) was the first to use it fordiachronic analysis (see Maddison, 1990).
244
The World Economy: Historical Statistics
GDP Growth before 1820
Western Europe: Per capita GDP growth rates prior to 1820 in Maddison (2001) are unchangedfor Germany, Greece, the Netherlands, Portugal, Spain, Sweden and 13 small territories, but levels for1500–1700 for these countries are affected by the amendments for 1820. In the case of France, the1700–1820 growth rate is unchanged, but for the second half of the seventeenth century I assumestagnant per capita income because of hunger crises and the depressing influence of more or lesscontinuous warfare, as noted by Boisguilbert and Vauban.
Western Offshoots: There are changes in the “multicultural” per capita GDP estimates 1700–1820 for Australia, Canada and New Zealand, as specified in detail in Tables 2–1 and 2–5; estimatesfor earlier centuries are unchanged.
Eastern Europe: Per capita GDP growth rates prior to 1820 are unchanged (0.1 percent a year),but the level for 1500–1700 is higher due to use of the Good–Ma proxies for the nineteenth century.There was no significant change for Russia.
Latin America: More detailed scrutiny of the evidence for the Caribbean sugar colonies led toupward revision of their per capita GDP and population levels in 1700–1820. See Table 4–1 for amore detailed sub–regional specification for 1500–1820 than in Maddison (2001).
Table 8-1. Amendments to GDP Estimates in Maddison (2001) for 1820-1950
Western Europe Western Offshoots Eastern Europeand former USSR
Latin America Asia Africa
Amendments and New Estimates
France 1820-70 Australia 1820-70,and 1911-38
Hungary 1870-1900 Cuba 1929-50 Jordan 1820-1950 Algeria 1880--1950
Netherlands 1820-1913
Jamaica 1820-1950 Malaysia 1911-50 Egypt 1886-1950
Portugal 1851-1910 Uruguay 1870-1913 Palestine 1820-1950 Ghana 1891-1950
Asia: GDP estimates for China, India, Indonesia and Japan in Maddison (2001) are unchanged,but I was able to make a more detailed scrutiny for West Asia thanks to recent work by Sevket Pamuk(see Tables 5–6 and 5–8). This raised the 1820 per capita GDP level for this group and its rate ofgrowth 1700–1820. However the level estimates for 1700 and earlier are unchanged.
Africa: I have made more detailed sub–regional conjectures of long–run per capita GDP movementthan in Maddison (2001), and presented a detailed analysis of the forces affecting the contours ofdemographic development. See source note HS–6, and Tables 6–1 and 6–2.
Crosschecking Measures of Comparative Levels of Performance before 1950
In this study, the bulk of the evidence consists of measures of inter–temporal change in GDPvolume in individual countries, moving backwards from 2001. These are merged with measures ofcomparative GDP levels in the reference year 1990 at 1990 prices. The derivation of the inter–spatialestimates is explained in the source notes to HS–7 and in Table 7–2. A more comprehensive survey ofthe array of level estimates available for years between 1970 and 1990 can be found in Maddison(1995) pp. 162–179. This indicates the range of variance between the results of the successive ICPand PWT rounds and compares the attributes of alternative aggregation procedures (Paasche, Laspeyres,Fisher, EKS and Geary–Khamis). Heston and Summers (1993) compare the GDP growth rates implicitin ICP cross–section estimates of the relative standing of countries at different points of time withdirect measures of inter–temporal GDP growth. They do not suggest that deviations between implicitand direct measures cast serious doubt on the latter. But such deviations are obviously a usefulcrosscheck.
I am satisfied that the 1990 benchmark estimates I used are the best presently available, with thepossible exception of those for Eastern Europe and Africa, where the results of the OECD (2002) andPWT 6.1 exercises were too recent to be fully digested here (see Table 6–11). My 1990 benchmark canbe subjected to comprehensive review when the World Bank’s ICP exercise for 2004 becomes available.
However, updates of the 1990 benchmarks are less important than crosschecks on their validityas measures of relative performance in the distant past. It is clear that patterns of expenditure havechanged radically over the long–term (as illustrated by the comparison of British expenditure patternsin 1688 and 1996 in Table 1), and there have also been big changes in relative prices and outputstructure. Some of these changes may have had a similar impact across countries, but this certainlyneeds to be investigated.
The most promising crosschecks on my estimates of relative standing in the past have come frombinary comparisons of countries which have a significant weight in the world total. Some of these Ihave done myself, and there are several others which confirm my findings, e. g. those of Broadberry,Toda and van Zanden cited below.
It would also be useful to have ICOP or ICP type multilateral cross–section studies for differentpoints of time in the past. It would not be possible replicate the detail or systemic rigour of modernICP exercises (prices for more than 2000 items for 200 categories of expenditure), but real wageanalysts have accumulated quite a lot of material on price structures which could be mobilised for thispurpose. It would be useful and probably feasible to construct such a measure e. g. for 1900 or 1870,using reduced information, on the same lines as PWT estimates for countries where there has been noICP exercise.
In the absence of such measures, Leandro Prados has made proxy estimates of PPPs and percapita income relatives for benchmark years since 1820, using econometrics, but no information onrelative price structures. The results are too shaky to be a serious challenge to my estimates of relativelevels in 1820 (see Table 8–2).
246
The World Economy: Historical Statistics
There are some authors (Paul Bairoch, Susan Hanley and Kenneth Pomeranz) whose judgementof the relative standing of major Asian countries and Western Europe is very different from mine.I give my reasons for disagreeing with them below.
Finally, I would like to comment on the real wage literature, some of which contradicts my viewof West European development over the past few centuries.
a) Confirmatory Crosschecks
i) Stephen Broadberry (1997a): provides the most important of the binary cross–checks because hescrutinises the relative standing of the two successive lead counties (the United Kingdom and the UnitedStates) for benchmark years between 1870 and 1990. He found US productivity in manufacturing aheadof the United Kingdom by the middle of the 19th century, whereas I found that US productivity leadershipat the aggregate level (GDP per man hour) began several decades later. At first sight these judgementsseemed incompatible. As a test, Broadberry (1997a) made an ICOP type analysis of performance in9 sectors and aggregate GDP in the two countries for 1870–1990 using 1937 value added weights. Hisresults were compatible with my aggregate comparison with 1990 expenditure weights.
Broadberry, 1997b, compared UK and German performance for the same period with 1935weights. He arrived at a similar confirmatory result, reconciling my estimate of the relative standing ofthe two countries in terms of aggregate GDP using 1990 expenditure weights, with his aggregate ofvalue added by sector, using 1935 weights.
ii) Yasushi Toda (1990): presented a binary comparison of Japanese and Russian urban consumptionlevels in 1913 and Japan/USSR in 1975–6. He had a matched sample of 46 items at Japanese andRussian prices for 1913, and 110 items for 1975–6. He found the Japanese real per capita consumptionlevel below that in Russia in 1913 and significantly higher in 1975–6. He had no explicit measure ofgrowth, but the implicit differential in growth rates was very similar to what I found for per capita GDPfor this period.
iii) Jan Luiten van Zanden (2003) expressed his concern that distortions may arise in using 1990benchmarks back to 1820 because of changes in relative price structures. As a test, he comparedDutch growth to his new estimates of Javanese GDP growth for 1815–1880 and made PPP adjustmentsto compare levels of per capita income in the 1820s. He concludes that “in the 1820s per capita GDPin Java was about one third of Dutch per capita GDP” and that my estimates of relative levels of thetwo economies in 1820 are “by and large correct”. He also makes comparative estimates of realwages, food consumption patterns, life expectation, and comparative physical stature of Dutch andIndonesians. These “direct indicators” show a narrower gap. He suggests that the relationship betweenreal wages and average per capita GDP is highly variable and dependent on many factors such as thelength of the working year, distribution of income, relative prices etc.
b) Conflicting Interpretations
i) Leandro Prados (2000) offers proxy estimates of per capita GDP levels relative to the UnitedStates for 17 benchmark years between 1820 and 1990. For 1880 he shows estimates for 23 countriesbut the coverage drops to 6 countries in 1820. He restricts the coverage to OECD countries, Argentinaand Russia. He makes no use of inter-temporal measures of change in real GDP to estimate past levelsof performance, nor does he measure price structures. Instead he backcasts an econometric relationshipbetween purchasing power parity converters and exchange rates which prevailed in 1950-90.
He has 89 ICP or OEEC direct measures of this relationship to support the 155 estimates he showsfor 7 reference years from 1950 to 1990 (see his tables 3 and 9). The gaps are filled by a structuralequation, which attributes spreads between PPPs and exchange rates to four variables: a) openness ofthe economies as measured by the ratio of foreign trade (exports and imports) to GDP; b) the ratio of net
247
The World Economy, 1-2001 AD
capital inflows to GDP: c) the size of the country in terms of its surface area and population; andd) a periphery dummy (in cases where per capita income is less than half of the average level). His cross–section relatives are derived from estimates of these four items for the years he covers, and knowledge ofthe exchange rates prevailing in those years. With this information he infers the Paasche PPP for a givenyear in the past for each of the countries. He applies these PPPs to convert estimates of nominal GDP ineach country from national currencies into US dollars of the year in question. For years before 1950, hehas no ICP or PWT (reduced-information) measures of PPPs. He assumes that the PPP/exchange raterelationships for 1950-1990 are a good guide to the situation in 1820-1938.
He provides two pages of source notes, but shows only his results and none of the basic materialon PPPs, his four variables and estimates of nominal GDP. Estimates of variables a and b are likely tobe pretty shaky for the early years, and nominal estimates of GDP are often not available. This is thecase for his benchmark country, the United States where he derived a nominal value by reflating thereal GDP estimates for 1820–1860 with a cost of living and a wholesale price index.
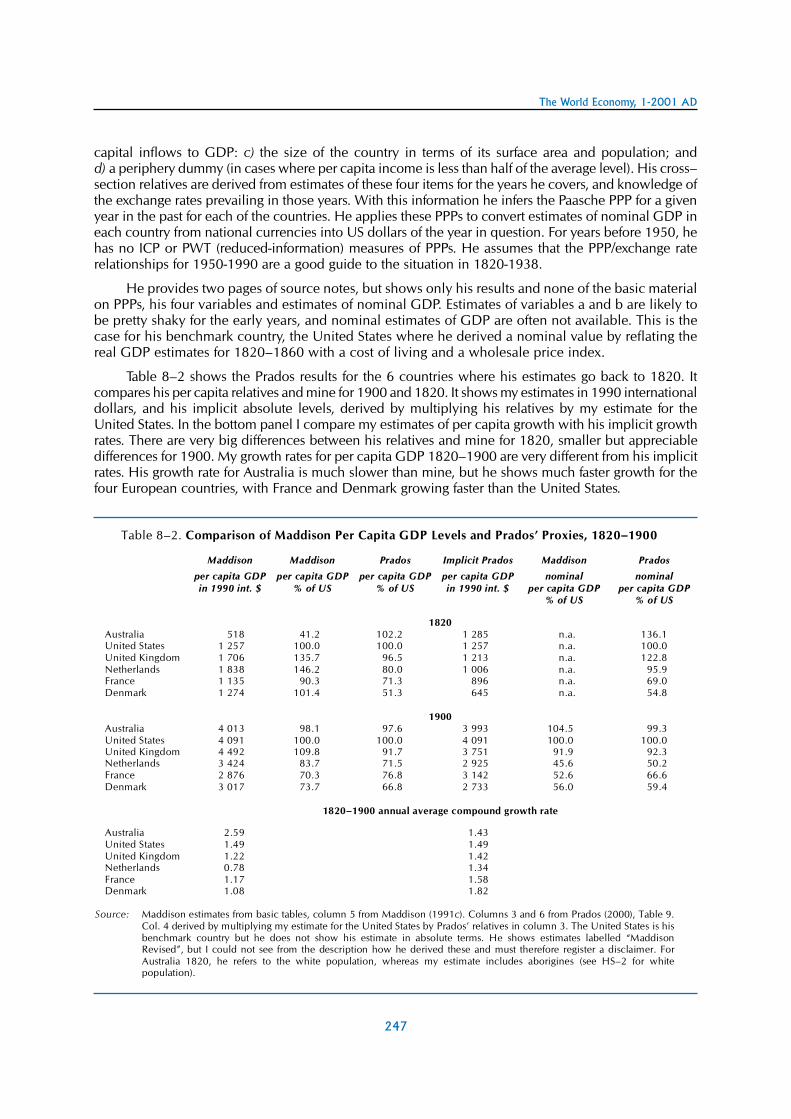
Table 8–2 shows the Prados results for the 6 countries where his estimates go back to 1820. Itcompares his per capita relatives and mine for 1900 and 1820. It shows my estimates in 1990 internationaldollars, and his implicit absolute levels, derived by multiplying his relatives by my estimate for theUnited States. In the bottom panel I compare my estimates of per capita growth with his implicit growthrates. There are very big differences between his relatives and mine for 1820, smaller but appreciabledifferences for 1900. My growth rates for per capita GDP 1820–1900 are very different from his implicitrates. His growth rate for Australia is much slower than mine, but he shows much faster growth for thefour European countries, with France and Denmark growing faster than the United States.
Table 8–2. Comparison of Maddison Per Capita GDP Levels and Prados’ Proxies, 1820–1900
Australia 2.59 1.43United States 1.49 1.49United Kingdom 1.22 1.42Netherlands 0.78 1.34France 1.17 1.58Denmark 1.08 1.82
Source: Maddison estimates from basic tables, column 5 from Maddison (1991c). Columns 3 and 6 from Prados (2000), Table 9.Col. 4 derived by multiplying my estimate for the United States by Prados’ relatives in column 3. The United States is hisbenchmark country but he does not show his estimate in absolute terms. He shows estimates labelled “MaddisonRevised”, but I could not see from the description how he derived these and must therefore register a disclaimer. ForAustralia 1820, he refers to the white population, whereas my estimate includes aborigines (see HS–2 for whitepopulation).
248
The World Economy: Historical Statistics
ii) Paul Bairoch (1930-1999) was a very prolific quantitative historian, who published manycomparative studies of GNP levels, urbanisation and labour force participation. A good deal of hisanalysis concentrated on the forces making for divergence in the growth of advanced capitalist countriesand the third world. He argued (see Bairoch, 1967) that the third world was impoverished by thedevelopment process and policies of the rich countries. In Bairoch, 1981, pp 8, 12, 14, he showed the“third world” with a slightly higher average per capita GNP than the “developed countries” in 1750,and slightly lower in 1800. He showed China at more or less the same level as Western Europe in1800, and Latin America ahead of North America. Bairoch’s source notes were frequently cryptic andoften cited “personal estimates” he did not publish. They were most exiguous for Asia or Latin Americaand his results for these continents must therefore be taken with a pinch of salt. The most detaileddocumentation of his estimates can be found in “Europe’s Gross National Product: 1800-1975”, Journalof European Economic History, Fall 1976. I commented on the quality of these estimates in Maddison(1990), p. 104.
Bairoch’s last major work, (Victoires et Déboires, Gallimard, Paris, 1997, 3 vols., 2 788 pages) isa massive, comprehensive and fascinating survey of world economic history from 1492 to 1995. It ismuch less quantitative than most of his other work. He has a very small table P.4 on p. 111 of volume1 comparing the aggregate per capita GNP performance of the “developed countries” (Europe, WesternOffshoots and Japan) and the “third world” (Africa, Asia and Latin America) for 6 benchmark yearsbetween 1750 and 1995. As in his earlier work, the third world is credited with a higher level than thedeveloped group in 1750, with minimal progress until after 1950, but he shows no country detail forthe third world. Table XII.2 in volume 2, pp. 252–3, presents estimates for each of his 24 “developedcountries” for 7 benchmark years from 1800 to 1913. The estimates for Europe are similar to those hepresented in 1976 and are in 1960 dollars derived mainly from the OEEC (1958) study of purchasingpower, augmented by the proxy PPPs in Beckerman (1966).
To me the most surprising and interesting part of his 1997 study is his discussion of the relativeperformance and interaction of the European and Asian economies between 1500 and 1800 (pp. 527–645). He suggests that Asia was probably somewhat more advanced than Europe around 1500 andthat by the eighteenth century this advantage had disappeared. The Muslim advantage over Europe inthe Abbasid caliphate peaked in the 10th century; Chinese superiority had been greatest in the 12thcentury; the peak for Moghul India was in the 16th century, and that of the Ottoman Empire around1600. Stagnation or decline followed thereafter, whereas Europe made substantial progress from 1500to 1800 (see pp. 642–5). This analysis is difficult to reconcile with his earlier position, or the estimatesin Table P.4, but it is much nearer to my view of the relative performance of these two parts of theworld economy between 1500 and 1800.
iii) Susan Hanley is a demographer and social historian who has concentrated mainly on theeconomic history of Tokugawa Japan. She is a member of the revisionist school which found evidenceto warrant a much more positive view of economic performance from 1600 to the 1860s than that ofan earlier generation of scholars. However, she is an unconstrained admirer of Japan, and greatlyexaggerates its level of performance in the 1860s. In Hanley (1997) she asserted that “Japanese physicalwell–being in the 1860s was at least as high as in nineteenth century England”. Her evidence forEngland is pretty flimsy. She admits that Japanese ate virtually no meat, but alleges that this was alsothe case in mid–nineteenth century England. She alleges that English working class diets in the mid–nineteenth century consisted largely of “bread and margarine” (i.e. at a time before margarine wasinvented). In fact, we can see from Table 1 (in the Prologue) that already in 1695 only 20 per cent ofEnglish food and drink expenditure consisted of bread or things made of meal or flour, and 35 per centconsisted of meat, fish, and dairy products.
In assessing the relative position of two countries at a given point in the past, it is always useful toconsider their growth trajectories since that point. The historical accounts of both Japan and the UnitedKingdom are of high quality. Our basic tables show that per capita income has risen 28–fold in Japan since1870. In Britain it rose 6–fold. If Hanley’s judgement on nineteenth century levels were correct, Japanwould now have a gigantic lead over the United Kingdom. In fact the two countries had a similar level ofper capita GDP in 2001.
249
The World Economy, 1-2001 AD
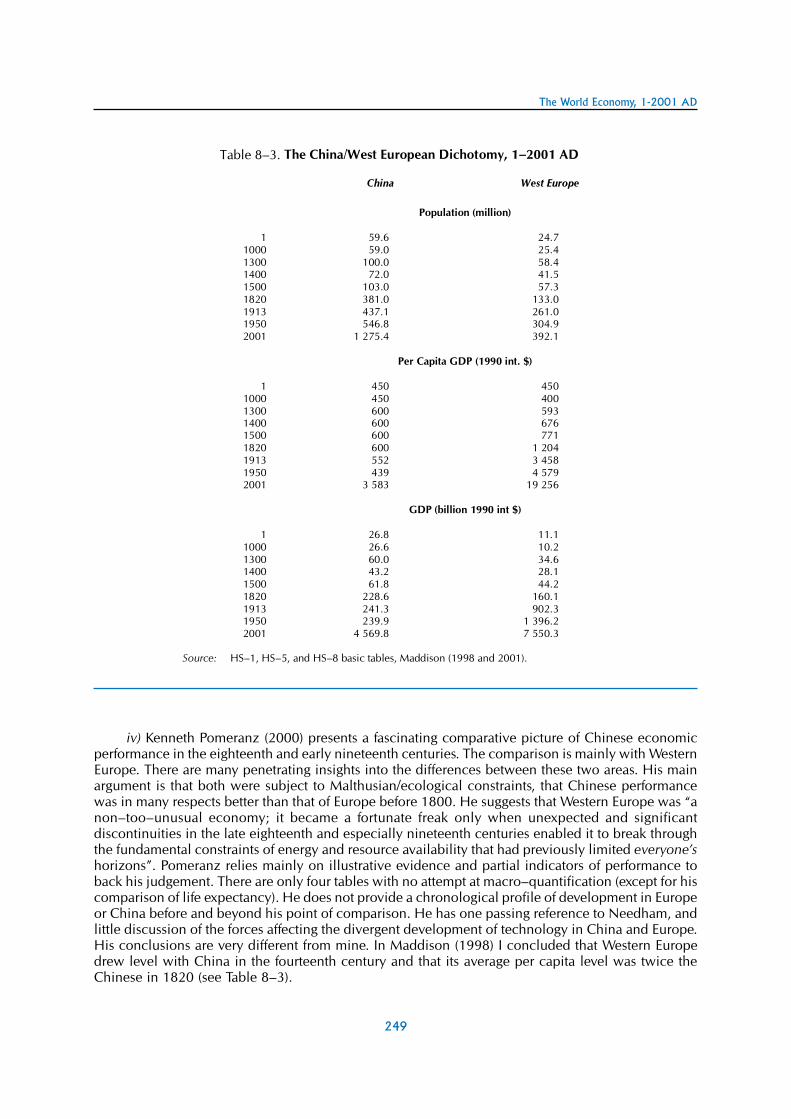
Table 8–3. The China/West European Dichotomy, 1–2001 AD
Source: HS–1, HS–5, and HS–8 basic tables, Maddison (1998 and 2001).
iv) Kenneth Pomeranz (2000) presents a fascinating comparative picture of Chinese economicperformance in the eighteenth and early nineteenth centuries. The comparison is mainly with WesternEurope. There are many penetrating insights into the differences between these two areas. His mainargument is that both were subject to Malthusian/ecological constraints, that Chinese performancewas in many respects better than that of Europe before 1800. He suggests that Western Europe was “anon–too–unusual economy; it became a fortunate freak only when unexpected and significantdiscontinuities in the late eighteenth and especially nineteenth centuries enabled it to break throughthe fundamental constraints of energy and resource availability that had previously limited everyone’shorizons”. Pomeranz relies mainly on illustrative evidence and partial indicators of performance toback his judgement. There are only four tables with no attempt at macro–quantification (except for hiscomparison of life expectancy). He does not provide a chronological profile of development in Europeor China before and beyond his point of comparison. He has one passing reference to Needham, andlittle discussion of the forces affecting the divergent development of technology in China and Europe.His conclusions are very different from mine. In Maddison (1998) I concluded that Western Europedrew level with China in the fourteenth century and that its average per capita level was twice theChinese in 1820 (see Table 8–3).
250
The World Economy: Historical Statistics
I find Pomeranz’s judgements unconvincing. In 1800, the degree of urbanisation was three timeshigher in Western Europe than in China, the proportion of the population employed in agriculturewas a good deal smaller, though the European diet included a much higher proportion of meat anddairy products. Chinese life expectation was two–thirds of that in Western Europe. Pomeranz stressesWestern Europe’s benefits from international trade, which augmented its supply of food and rawmaterials from the “ghost acreage” of distant lands. He treats this benefit as if it were a windfall gain.In fact, China turned its back on international trade in the middle of the fifteenth century, and theChing dynasty forbade settlement on its own ghost acres in Manchuria.
The Pomeranz position is stated with four degrees of nuance. On p. 49 he says “it seems likelythat average incomes in Japan, China and parts of southeast Asia were comparable to (or higher than)those in western Europe even in the late eighteenth century.” Elsewhere his position is more cautious,and he claims Asian superiority was characteristic only for “core regions”. Thus on p. 17, he says“core regions in China and Japan circa 1750 seem to resemble the most advanced parts of westernEurope”. For China, his core region is the lower Yangtse (which had about 18 per cent of China’spopulation). Here he is on firmer ground, but I think he still exaggerates Chinese performance. Researchon Chinese economic history has increased substantially in quantity and quantity in the past twodecades. Li (1998) has shown significant advances in productivity and income in the lower Yangtsearea during the Ching dynasty. Ma (2003) shows its per capita land tax revenue was about 145 percent of that for China as a whole in 1753. My estimate of Chinese and West European income levelsin 1750 can be derived by interpolating between the estimates for 1700 and 1820 in Table 8c. If Ma’sfiscal estimate is taken as a proxy for lower Yangtse per capita income around 1750, it would havebeen about 870 dollars compared to 1 080 for western Europe as a whole and more than 1 400 for theUnited Kingdom.
On p. 44, Pomeranz states that “Europeans were not ahead in overall productivity in 1750”. Thisproposition I find completely implausible, because Chinese multi–cropping of rice, intensive watermanagement and rural industry demanded much higher labour inputs, (particularly in the lower Yangtseregion) than was the case in Europe. Ester Boserup has stressed increased labour intensity as theChinese response to land shortage. Pomeranz’s obsession with Malthusian constraints leads him toneglect this Chinese–European differential in labour inputs.
Pomeranz, p. 37 suggests that Chinese longevity was “quite comparable” to European. He citesan estimate of Chinese life expectancy of 32 years at age 1 for both sexes combined in Manchuria in1792–1867 (from Lee and Campbell, 1997). He compares this with the Wrigley and Schofield (1981)estimate of English life expectancy at birth of 37 years for 1600–1749. Following a critique by Razzell,he suggests that Wrigley and Schofield got it wrong and that their figure should be reduced to“somewhere between 31.6 and 34.0”, i.e. an average of 32.8. If this were a legitimate correction,it would mean that longevity in England and China were indeed “quite comparable”. However, theirestimate for England should be adjusted upwards, not downwards. Life expectation at age 1 in eighteenthcentury England was about 7 years higher than at birth, because 17 per cent of infants died beforetheir first birthday (I am grateful to Jim Oeppen for this information). The Cambridge group rebuttedRazzell’s critique in their 1997 study (Wrigley, Davies, Oeppen, and Schofield). In Maddison (2001)I compared life expectation in different parts of the world in 1820. The average for Western Europewas 36 years and 24 for Asia at birth.
There are at least four views on the contours of long–run Chinese development and two on WestEuropean.
On China, Joseph Needham’s view was that its technology gave it a lead over Western Europefrom the second century AD. “Chinese evolution represented a slowly rising curve. Running at ahigher and sometimes much higher level than Europe between the second and fifteenth centuries”.Because of its meritocratic bureaucracy, its precocity in developing printing and the existence of acommon written language, best–practice technology was more easily diffused than in Europe (a point
251
The World Economy, 1-2001 AD
stressed by Justin Yifu Lin, 1995). China lost its leadership position because it had no counterpart toEurope’s scientific revolution. Needham gave a graphical comparison of the contours of Chinese andEuropean technological development in Clerks and Craftsmen in China and the West (1970), p. 414.It is similar in shape to my graph of Chinese and West European per capita GDP in Maddison, 2001,p. 42, except that Needham makes no allowance for Sung exceptionalism.
Mark Elvin’s (1973) interpretation is that China made a major advance in the Sung dynasty (960–1280), and had high–level stagnation until the nineteenth century. I think Elvin is correct in stressingthe special character of Sung experience. However, he did not attempt macro–quantification, and hisqualitative judgement probably implies a bigger leap in the Sung than I find. I think Elvin overstatesstagnation after the Sung. Between 1400 and 1820, Chinese population grew significantly faster thanthat of Western Europe, and its GDP growth was only slightly less than Europe’s. China experiencedextensive growth, whereas Europe had a mild degree of intensive growth.
My interpretation is a hybrid of Needham and Elvin. It is summarised in quantitative terms inTable 8–3 and in graphical form in Maddison (2001), p. 42.
The least plausible interpretation is that of Kang Chao (1986, pp. 87, 89, 216–220). He suggeststhat per capita grain output rose by half from the 1st to the 11th century, followed by a millennium ofdecline, with per capita output falling back to 1st century levels in 1949, because of Malthusianpressure of population on limited land resources. The sources for his estimates are not adequatelydocumented, and their plausibility is not heightened when he throws in supposedly corroborativeestimates of real wages which rise (in sheng of grain per person) from 120 in the first century to 800in 1086 and fall to 12 in 1818!
My view of the contours of West European development is that there was a decline in per capitaincome after the fall of the Roman Empire, which has no counterpart in China, and a sustained processof slow per capita growth from the eleventh to the early nineteenth century. Thereafter there was asubstantial acceleration of growth. The alternative view is that there were centuries of Malthusiantorpor followed by an industrial revolution and a sudden take–off. Pomeranz’s interpretation involvesacceptance of this second view.
v) The Real Wage Literature and its Relation to National Accounts.
The serious study of real wages began with Thorold Rogers (1823–1890). His major works inthis field were A History of Agriculture and Prices in England (7 vols. 1866–1902) and Six Centuriesof Work and Wages (1884). Rogers was an active politician, as well as a prolific price historian andprofessor of political economy in Oxford. He was a Liberal member of parliament (1880–1886) andan advocate of political reform who argued that the condition of English wage earners could beimproved by extending the franchise and encouraging trade union activity. Later generations of realwage analysts have generally followed his lead: a) adopting a very long–term perspective; b) givingalmost exclusive emphasis to labour income; c) giving substantial attention to price history, d) reachingpessimistic conclusions. However, Rogers differed from some of his disciples in two important respects.He was not a Malthusian, and would certainly not have regarded real wages as a proxy for real GDP.For him low wages were the result of exploitation of the labourer by the ruling elite. He made a cleardistinction between wage income and national income, as is clear in his citation of Gregory King’sestimates of inequality (Rogers, 1884 pp. 463–465). He summarised his position, saying (p. 355)“society may make notable progress in wealth, and wages remain low, …relatively speaking, theworking man of today is not so well off as he was in the fifteenth century”
It is interesting to compare his work with that of his near–contemporary Michael Mulhall (1836–1900). Mulhall was a pioneer in comparative analysis of national income. His main concern was tomeasure aggregate value added (see Table 3 in the Prologue), whereas Rogers concentrated on one kindof income. Mulhall’s temporal horizon was much shorter than that of Rogers, and he was not a social orpolitical reformer. Mulhall’s estimates all referred to nominal income, except for the United Kingdom,where he used wheat prices as a crude deflator. Rogers devoted massive effort to price history.
252
The World Economy: Historical Statistics
The Rogers–Mulhall dichotomy is interesting because real wage analysis and historical nationalaccounts have continued to tread separate paths. Historical national accountants have progressedwell beyond Mulhall. They have developed techniques for measuring real output and real expenditure,and have deflators for the components of these aggregates, but they almost never attempt separatedeflation of the components of nominal income (see Maddison, 1995, pp. 120–123). Until recentlyreal wage analysis had not progressed much beyond Rogers. It continued to ignore non–wage income,and used data for a small fraction of wage earners without indicating what proportion of the labourforce were covered. National accountants take a macroeconomic view, have developed a standardisedsystem (which defines coverage within clearly defined boundaries of activity) and there are fairlycomprehensive crosschecks on consistency. However, their time horizon was, until recently, muchshorter than that of real wage analysts.
In the 1920s–40s there was a coordinated European–US research effort with financial supportfrom the International Committee on Price History. Some of the researchers (Beveridge and Posthumus)concentrated on price history, but there was also a substantial effort to measure long–term trends inreal wages. It is clear from the account of Cole and Crandall (1964) that they had no guidelines oncoverage and methodology. They measured wage rates rather than earnings, without indicating annualhours worked. There was no attempt to determine the relative size of non–wage income. Within thefield of wage–income, sample coverage was usually quite small. The validity of the inter–temporalmeasures was questionable and there were no cross–country comparisons of wage levels. From 1939to 1968, Jürgen Kuczynski (1904–95) provided a Marxist counterpart, producing 40 volumes on thedeteriorating condition of the proletariat under capitalism. At that time there was some interactionwith national accountants. Colin Clark (1940) used real wages as a real income proxy for 20 countries.Arthur Bowley (1869–1957) made a considerable effort to incorporate real wage and real incomeanalysis into national accounts.
A third wave of interest in real wages was sparked in 1952–57, when Henry Phelps Brown(1906–94), Sheila Hopkins and other associates produced scholarly articles developing new annualmeasures of wages and prices in England from 1264 to 1954. (Phelps Brown and Hopkins, 1981)They synthesised the work of the pre–war group (Elsas, Hamilton and Pribram) on Austria, Germany,and Spain, and made new estimates for France. For England, they had daily wage rates for buildingworkers hired by Oxford and Cambridge colleges, Eton school and some other employers in the southof England. For the most part, they had 15 or more quotations a year for craftsmen and 3 for buildingworkers. Between 1500 and 1800 there were 82 years for which they had no wage estimates. Theyhad no data on weekly or annual earnings or days worked. They did not discuss the representativity oftheir measure. Even if their coverage of building workers is assumed to be adequate, they representedonly 5 per cent of the workforce in 1700. People employed in agriculture were 56 per cent of the totaland most of them were producing and directly consuming the items which figure in the price index.Many others, such as servants, artisans, the clergy, and the armed forces received an appreciable partof their remuneration in kind. A large part of the working population were thus sheltered from theimpact of price rises. In spite of these shortcomings, their findings attracted interest because of thelong period they covered and their meticulous scholarship in providing detailed and transparentdiscussion of sources and methods. As there was no work in historical national accounts for thisperiod, their results were readily accepted.
The conclusions of Phelps Brown and Hopkins were extremely pessimistic. From 1500 to 1800,they suggested that real wages for building workers in southern England fell by 60 per cent. Theirresults were enthusiastically received by Braudel and Spooner (Cambridge Economic History of Europe,1967, p. 429). They concluded that “from the late fifteenth century until well into the beginning of theeighteenth century, the standard of living in Europe progressively declined. Before this time, in thefourteenth and fifteenth centuries …conditions were better”. This judgement was easily accepted inFrance because members of the Annales school were profoundly Malthusian. Le Roy Ladurie’sjudgement in 1960 was that Languedoc had suffered recurrent and prolonged population setbacksbecause limited land resources had set rigid limits to agricultural production. His inaugural lecture at
253
The World Economy, 1-2001 AD
the Collège de France in 1973 restated this notion of l’histoire immobile. Wilhelm Abel (1978), theGerman historian, suggested that real living standards fell in Germany from the first half of the fourteenthto the first half of the eighteenth century.
The Phelps Brown analysis was also accepted by Wrigley and Schofield (1981) as a complementto their analysis of English demographic experience from 1541 to 1871. They found it convenientbecause it was “an approximate guide to fluctuations in the standard of living” in their period (pp. 312–313). They adjusted the results to interpolate gaps (pp. 638–41), they made some judicious commentson its deficiencies, but they took the real wage index to be a representative picture of living standards.In their analysis (pp. 402–412) of the relation between population growth and living standards theyconcluded that Malthus was right “Before 1800 matters fell out much as Malthus insisted they must..thefaster population grew, the lower the standard of living and the grimmer the struggle to exist” A “decisivebreak” occurred during the industrial revolution. They rejected Boserup’s view that “population growthin a pre–industrial economy tended to spark off changes in agricultural techniques which wouldallow productivity per head in agriculture to be maintained, albeit at the cost of longer hours of work,while at the same time encouraging changes elsewhere in the economy that would lead to a rise inoutput per head overall”.
The Phelps Brown results have now been almost universally rejected as a proxy for the movementof real GDP per capita. Braudel reversed his judgement with characteristic insouciance. In Braudel(1985) p. 314, he stated that there were “clear continuities in European history. The first of these is theregular rise in GNP come hell or high water”. Wrigley (1988) concluded his penetrating new analysisthus: ”The single most remarkable feature of the economic history of England between the later sixteenthand the early nineteenth century was the rise in output per head in agriculture”(p. 39).
Jan de Vries (1993) joined the attack on the real wage approach. He questioned the representativityof construction worker experience, emphasised the large number of items omitted from the PhelpsBrown price index, and contrasted its sombre and stagnant conclusions with his own evidence fromprobate inventories “All the studies I have examined for colonial New England and the Chesapeake,England and the Netherlands consistently reveal two features. With very few exceptions, each generationof decedents from the mid–seventeenth to the late eighteenth century left behind more and betterpossessions”. He concluded that “economic growth began earlier than previously thought, that thetransforming power of industry was felt later than previously thought , and that the century of theIndustrial Revolution witnessed no sharp acceleration–not in production, not in consumption”. In deVries (1994) he developed the notion of an “industrious revolution” which is similar to Ester Boserup’s(1965) analysis in the Asian context. It helps explain how intensified labour inputs overcame whatwere previously considered Malthusian constraints.
One reason real wage analysis remained primitive was that historical national accountants andtheir leading figure, Kuznets, showed no interest in it. Kuznets’ (1973, pp. 139–140) speculations onthe likely growth of European real per capita GDP between 1500 and 1750 contrasted sharply withthe conclusions of Phelps Brown and his disciples, but he made no reference to their work. The twomajor historians of the national accounting tradition, Studenski (1958) and Stone (1997) made nomention of the real wage literature.
There was a fifth wave of real wage analysis in the past decade. This includes 2 articles on Asia;Feinstein, 1998, is the first rigorous and comprehensive measurement of real earnings of manualworkers (1770–1870) by a historical national accountant since Bowley (1900); repair work on thesecond generation estimates by Robert Allen (2001), and new estimates by Jeffrey Williamson (1995)for 17 countries 1830–1988, which incorporate inter–spatial as well as inter–temporal comparisons.
The articles on Asia break new ground and are discussed below.
Özmucur and Pamuk (2002) present estimates of real wages of building workers in Istanbul for1489–1914. They find a level in 1820 similar to that at the end of the fifteenth century (with some bigdips in between) and about 40 per cent higher by 1910–14. They do not suggest that their measure is
254
The World Economy: Historical Statistics
a satisfactory proxy for per capita income, but as they have no estimates of the latter before the nineteenthcentury, they conclude from their evidence that the decline of the Ottoman empire in the sixteenthcentury was reversed, and it adapted successfully to changing circumstances from the seventeenth to thenineteenth century. Their research is well documented, their conclusions are cautious and Pamuk hasalso made tentative estimates for of GDP in Turkey and other parts of the Ottoman Empire back to 1820.This study throws new light on a region that has played a significant role in world history for centuries.
Parthasarathi (1998), is a cross–country level comparison of weavers’ wages in South India andEngland in the eighteenth century. He also covers spinners and farm labourers where his evidence ismuch thinner. He converts weekly wages of weavers in both countries into grain units, assuming a lb ofIndian rice equivalent to 1500 calories and a lb of British bread 1000 calories. In Britain weekly earningsof weavers bought 40 to 140 lbs of grain and in South India 65 to 160. He claims that labourers in SouthIndia were in a better bargaining position than their English counterparts because they operated asvillage collectives, appealing to even–handed political authorities in case of dispute. In England legislationprohibited combinations of workers. The article is useful in shaking up conventional views, but is certainlycontestable. It may be true that individual workers in England had a weak bargaining position, but itseems likely that in Indian village “collectives” lower castes and untouchables were exploited by thebrahmin elite. The sources of his Indian wage estimates are not very clear, and his assumption that Britishworkers got their calories from wheaten loaves bought from bakeries is rather odd. They probably gotquite a lot of calories from meat and potatoes, cheese and beer which were not available in south India.A good deal of their bread must have been home–baked.
Chronology
In surveying economic development over the last two millennia in Maddison (2001), it seemedlogical to start with the year zero, as official celebrations treated the year 2000 as the beginning of anew millennium. In fact, there is no year zero in the Christian era which begins in AD 1, with I BC asthe preceding year. In tables HS–8, I have bowed to convention, and substituted year 1 for year zero.This makes no difference to estimates of growth rates for the first millennium.
It is perhaps useful to consider changes in conventions for measuring time over these two millennia.The Julian calendar, with an average year of 365.25 days was inaugurated by the Roman dictator,Julius Caesar in 46 BC, on the advice of the Alexandrian astronomer Sosigenes. It exaggerated thelength of the year by a tiny fraction, and was replaced in the Catholic countries of Europe on October4th 1582, as decreed in a papal bull of Gregory XIII, on advice from the astronomer Clavius andothers. The Gregorian year was a little shorter (averaging of 365.2425 days). 10 days (5–14th October)were dropped from that year to link the two systems. The Protestant countries of Europe started toadopt this calendar in 1700. The last European country to switch was the USSR in 1918.
England and its colonies changed over in 1752. Until then their year began with Lady Day, on25th March. The British parliament endorsed the change in 1751, stipulating that the year would endon 31st December, and the new Gregorian year would start on 1st January. To complete the transition,3rd to 13th September were omitted from the 1752 calendar (Wednesday 2nd September beingfollowed by Thursday 14th). The previous anachronistic system meant that anything published from1st January to 24th March was attributed to the preceding year.
255
The World Economy, 1-2001 AD
There have also been changes in the dating and denomination of eras. The traditional Roman erabegan with the foundation of Rome (ab urbe condita) which was thought to have been in 753 BC.There was an era of the Emperor Augustus, dating from the battle of Actium in 31BC, and an era of theEmperor Diocletian dating from his accession in 284 AD. The Christian era was first proposed byDionysius Exiguus in AD 532. He had been asked by Pope John the 1st to provide clear guidelines forcalculating the date of Easter. He also suggested the creation of a Christian era to replace that ofDiocletian (who martyred Christians). Dionysius believed that Christ was born in 1BC, and that thefirst year of the new era (anno domini) should be the following year which he called AD 1 (seeRichards, pp. 106, 217–8 and 351). There was no symbol for zero in the Roman system of numeration,and the concept of zero as a number did not come to Europe until several centuries later. The Christianera does not seem to have been inaugurated by a papal bull, and did not come into general use untilthe eleventh century. The first author to use the concept systematically for his chronology was Bede inhis Ecclesiastical History of the English People, completed in 731. He did not use the term annodomini, referring instead to a year in the era as “anno dominicae incarnationis”(see Colgrave andMynors, 1969).
In fact, there is a precedent for starting the Christian era in year zero. Gregory King in his Notebook,p. 4, made a comprehensive survey and forecast of world population, using the concept of annomundi, with continuous numbering since the creation which he assumed had occurred 5630 yearsbefore 1695. He provided an alternative numbering system for years before and after Christ, with adividing point in the year 0. He did not use the terms BC and AD, but distinguished years ante andpost Christum.
25
6
The W
orld
Econom
y: H
istoric
al S
tatistic
s
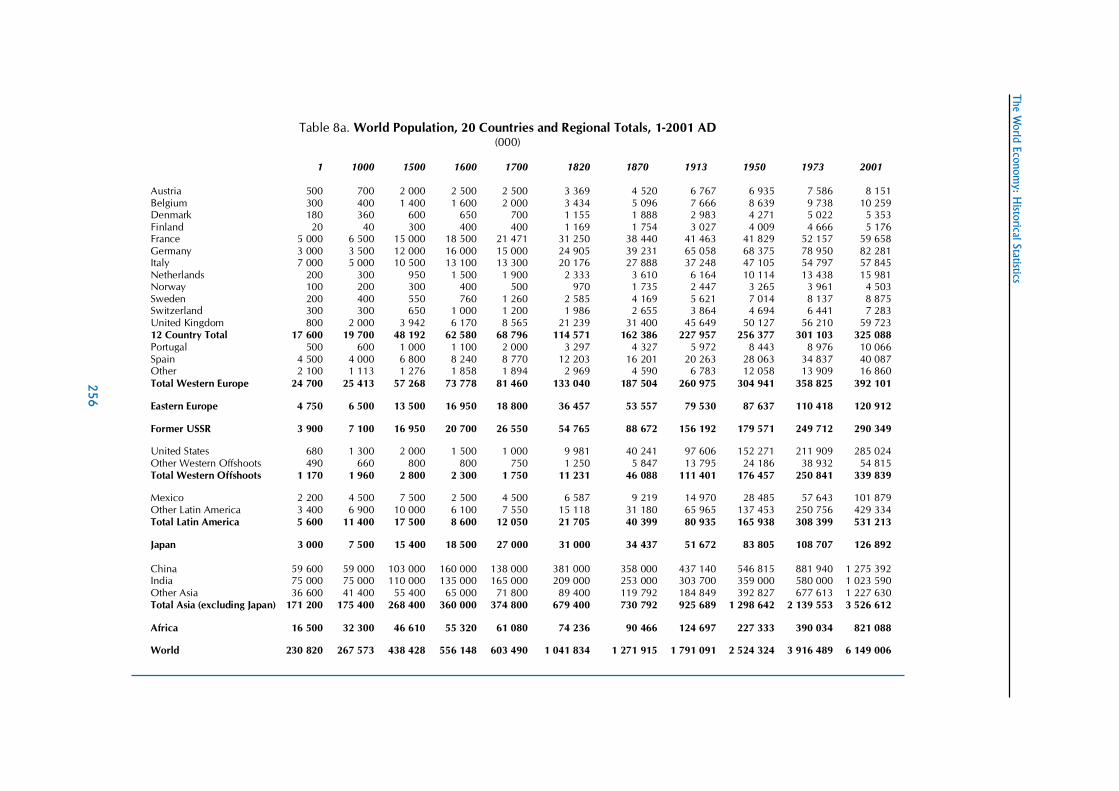
Table 8a. World Population, 20 Countries and Regional Totals, 1-2001 AD(000)


![HS^Wd[W FZa Se =ad]k BSg^ Winnie in Winter...Winnie in Winter Heg^c\ WjaWh! XdciV^cZg VcY eaVci ÅWgZ 6gi bViZg^Vah HS^Wd[W FZa_Se S`V =ad]k BSg^ % % ' ( % ' % % % ) #& % & ' EBD736](https://static.documents.pub/doc/80x56/604cf7a73f090c05ce7cf58d/hswdw-fza-se-adk-bsg-winnie-in-winnie-in-winter-hegc-wjawh-xdcivczg.jpg)


