MONEY MARKET FUNDS Class A Class B Class C Class D Class E Class I Class Y HSBC Prime Money Market Fund REAXX HSMXX HMMXX HIMXX HMEXX HSIXX RMYXX HSBC U.S. Government Money Market Fund FTRXX HUBXX HUMXX HGDXX HGEXX HGIXX RGYXX HSBC U.S. Treasury Money Market Fund HWAXX HTBXX HUCXX HTDXX HTEXX HBIXX HTYXX HSBC Global Asset Management (USA) Inc. HSBC Funds Semi-Annual Report April 30, 2013
Transcript
MONEY MARKET FUNDS Class A Class B Class C Class D Class E Class I Class Y
HSBC Prime Money Market Fund REAXX HSMXX HMMXX HIMXX HMEXX HSIXX RMYXX
HSBC U.S. Government Money Market Fund FTRXX HUBXX HUMXX HGDXX HGEXX HGIXX RGYXX
HSBC U.S. Treasury Money Market Fund HWAXX HTBXX HUCXX HTDXX HTEXX HBIXX HTYXX
HSBC Global Asset Management (USA) Inc.
HSBC FundsSemi-Annual ReportApril 30, 2013
JOB TITLE HSBC Money Market SAR REVISION 6 SERIAL <12345678> DATE Thursday, June 27, 2013 JOB NUMBER 251995 TYPE PAGE NO. 1 OPERATOR PM4
JOB TITLE HSBC Money Market SAR REVISION 6 SERIAL <12345678> DATE Thursday, June 27, 2013 JOB NUMBER 251995 TYPE PAGE NO. 2 OPERATOR PM4
Table of Contents
HSBC Family of FundsSemi-Annual Report - April 30, 2013
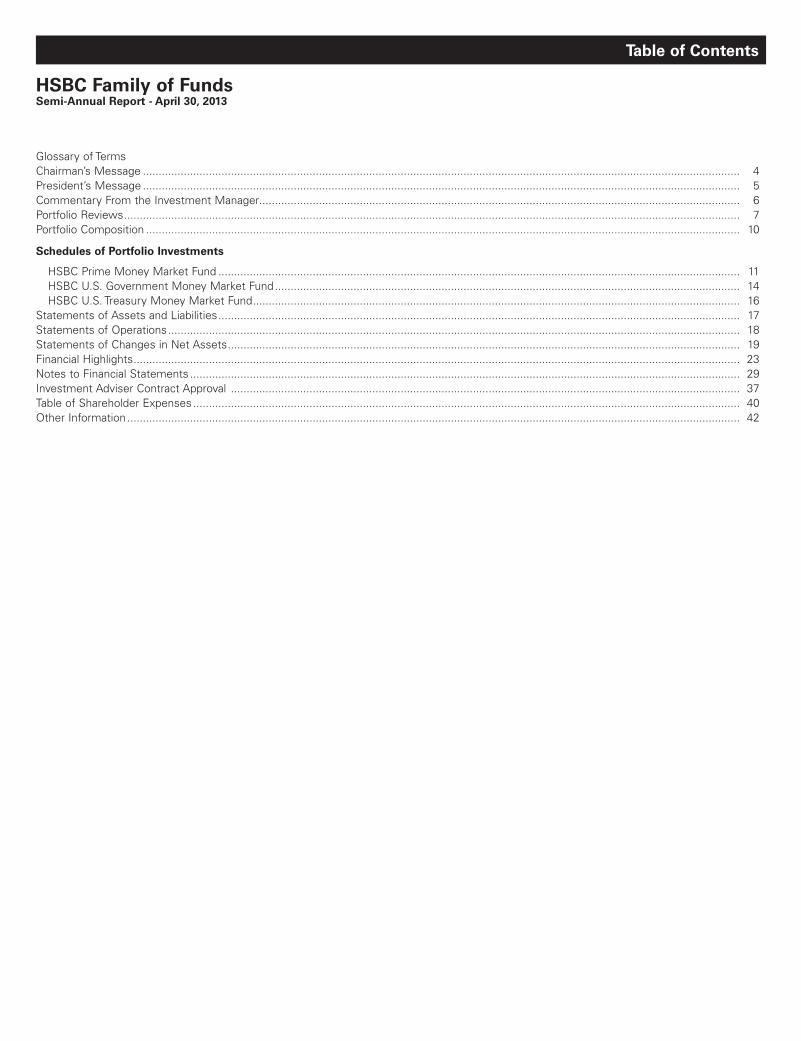
Glossary of TermsChairman’s Message .............................................................................................................................................................................................. 4President’s Message .............................................................................................................................................................................................. 5Commentary From the Investment Manager......................................................................................................................................................... 6Portfolio Reviews .................................................................................................................................................................................................... 7Portfolio Composition ............................................................................................................................................................................................. 10
Schedules of Portfolio Investments
HSBC Prime Money Market Fund ...................................................................................................................................................................... 11 HSBC U.S. Government Money Market Fund .................................................................................................................................................... 14 HSBC U.S. Treasury Money Market Fund ........................................................................................................................................................... 16Statements of Assets and Liabilities ...................................................................................................................................................................... 17Statements of Operations ...................................................................................................................................................................................... 18Statements of Changes in Net Assets ................................................................................................................................................................... 19Financial Highlights ................................................................................................................................................................................................. 23Notes to Financial Statements ............................................................................................................................................................................... 29Investment Adviser Contract Approval .................................................................................................................................................................. 37Table of Shareholder Expenses .............................................................................................................................................................................. 40Other Information ................................................................................................................................................................................................... 42
JOB TITLE HSBC Money Market SAR REVISION 6 SERIAL <12345678> DATE Thursday, June 27, 2013 JOB NUMBER 251995 TYPE PAGE NO. 3 OPERATOR PM4
[This Page Intentionally Left Blank]
JOB TITLE HSBC Money Market SAR REVISION 6 SERIAL <12345678> DATE Thursday, June 27, 2013 JOB NUMBER 251995 TYPE PAGE NO. 4 OPERATOR PM4
Glossary of Terms
Barclays U.S. Aggregate Bond Index is an unmanaged index generally representative of investment-grade, fixed-rate debt issues, including government, corporate, asset-backed, and mortgage-backed securities, with maturities of at least one year.
Barclays U.S. High-Yield Corporate Bond Index is an unmanaged index that measures the non-investment grade, USD-denominated, fixed-rate, taxable corporate bond market. Securities are classified as high-yield if the middle rating of Moody’s, Fitch, and S&P is Ba1/BB+/BB+ or below. The index excludes emerging markets debt.
Gross Domestic Product (“GDP”) measures the market value of the goods and services produced by labor and property in the United States.
Lipper Money Market Funds Average is an equally weighted average of mutual funds that invest in high-quality financial instruments rated in the top two grades with dollar-weighted average maturities of less than 90 days. These funds intend to keep a constant net asset value.
Lipper U.S. Government Money Market Funds Average is an equally weighted average of mutual funds that invest principally in financial instruments issued or guaranteed by the U.S. government, its agencies, or its instrumentalities, with dollar-weighted average maturities of less than 90 days. These funds intend to keep a constant net asset value.
Lipper U.S. Treasury Money Market Funds Average is an equally weighted average of mutual funds that invest principally in U.S. Treasury obligations with dollar-weighted average maturities of less than 90 days. These funds intend to keep a constant net asset value.
Morgan Stanley Capital International Europe Australasia and Far East (“MSCI EAFE”) Index is an unmanaged free float-adjusted market capitalization index that is designed to measure the equity market performance of developed markets, excluding the U.S. & Canada. The MSCI EAFE Index consists of the following 22 developed market countries: Australia, Austria, Belgium, Denmark, Finland, France, Germany, Greece, Hong Kong, Ireland, Israel, Italy, Japan, the Netherlands, New Zealand, Norway, Portugal, Singapore, Spain, Sweden, Switzerland, and the United Kingdom.
Morgan Stanley Capital International Emerging Market (“MSCI EM”) Index is a free float-adjusted market capitalization index that is designed to measure equity market performance of emerging markets. The MSCI EM Index consists of the following 21 emerging market countries: Brazil, Chile, China, Colombia, Czech Republic, Egypt, Hungary, India, Indonesia, Korea, Malaysia, Mexico, Morocco, Peru, the Philippines, Poland, Russia, South Africa, Taiwan, Thailand, and Turkey.
Standard & Poor’s MidCap 400 Index is an unmanaged index that is the most widely used index for mid-sized companies. The S&P MidCap 400 covers 7% of the U.S. equities market, and is part of a series of S&P U.S. indices that can be used as building blocks for portfolio composition.
Standard & Poor’s 500 (“S&P 500”) Index is an unmanaged index that is widely regarded as a gauge of the U.S. equities market. This index includes 500 leading companies in leading industries of the U.S. economy. The S&P 500 Index focuses on the large-cap segment of the market, with approximately 75% coverage of U.S. equities.
Russell 2000® Index is an unmanaged index that measures the performance of the small-cap segment of the U.S. equity universe. The Russell 2000® Index is a subset of the Russell 3000® Index representing approximately 10% of the total market capitalization of that index. It includes approximately 2000 of the smallest securities based on a combination of their market cap and current index membership.
Lipper is an independent mutual fund performance monitor whose results are based on total return and do not reflect a sales charge.
Securities indices assume reinvestment of all distributions and interest payments and do not take in account brokerage fees or expenses. Securities in the Funds do not match those in the indices and performance of the Funds will differ. Investors cannot invest directly in an index.
JOB TITLE HSBC Money Market SAR REVISION 6 SERIAL <12345678> DATE Thursday, June 27, 2013 JOB NUMBER 251995 TYPE PAGE NO. 5 OPERATOR PM4
HSBC FAMILY OF FUNDS
Chairman’s Message
4
June 24, 2013
Fellow Shareholders:
During the recently-concluded semi-annual period, the HSBC Money Market Funds delivered performance that was consistent with each Fund’s benchmark for the six months ended April 30, 2013.
More specific information about each fund’s performance appears in their respective Portfolio Reviews in the following pages of this report. These investment results were achieved in an environment marked by uncertainty about the economic and market outlook, including speculation about future Federal Reserve policy and its market effects. We have no crystal ball, but our portfolio managers generally view the outlook as mildly positive. Several factors contributed to this outlook, including:
• The slowly improving U.S. economic growth, with little signs of inflation, provides a positive backdrop for stocks.
• Any normalization of Federal Reserve policy, and an end to so-called “quantitative easing,” should boost interest rates and improve returns in our money market offerings.
• A global economic recovery carries positive implications for emerging and frontier debt and equity markets, which is important for our roster of emerging market products.
That said, past performance is no guarantee of future results. To that end, the board and HSBC Global Asset Management (USA) Inc. constantly monitor the funds’ investment results, meeting regularly with portfolio managers and effect management change when we think it to be in our shareholders’ best interests. When managers consistently under-perform, we monitor their performance more closely and add additional oversight and scrutiny.
The Securities and Exchange Commission recently released for comment a number of proposals relating to money market fund reform. These included a floating net asset value and/or liquidity fees and redemption gates for certain types of money market funds. We will continue to monitor these developments as we work to provide the best money market fund structures and products to meet the needs of our shareholders.
The HSBC Funds lost a great friend and major contributor on April 28, 2013, when Larry Robbins, a trustee for 23 years and our chairman for eight years, succumbed to cancer, which he had fought with his usual grace and courage for almost five years. Larry resigned from the Board in December 2010, but remained an insightful counselor to me and a cheerleader to all of us. There’s no replacing a person like Larry.
His resignation did, however, open a vacancy on the Board, and this month we appointed Susan Gause to the board. The search was exhaustive and choosing among many attractive candidates wasn’t easy, we’re delighted to welcome Susan to the board. Susan has broad asset management experience having served as the CEO and CFO of a major asset management company and we believe that experience will serve HSBC Funds’ shareholders well.
Sincerely,
Michael Seely
Chairman, HSBC Funds
This literature must be preceded or accompanied by an effective prospectus for the HSBC Funds. Investors should consider the investment objectives, risks, charges, and expenses of the investment company carefully before investing. The prospectus contains this and other important information about the investment company. To obtain more information, for clients of HSBC Securities (USA) Inc., please call 1-888-525-5757 or visit www.investorfunds.us.hsbc.com. For other investors and prospective investors, please call the Funds directly at 1-888-936-4722. Investors should read the prospectus carefully before investing or sending money.
JOB TITLE HSBC Money Market SAR REVISION 6 SERIAL <12345678> DATE Thursday, June 27, 2013 JOB NUMBER 251995 TYPE PAGE NO. 4 OPERATOR PM4
HSBC FAMILY OF FUNDS
President’s Message
5
Dear Shareholder,
We are pleased to send to you the HSBC Funds semi-annual report, covering the six-month fiscal period ended April 30, 2013. This report contains detailed information about your Funds’ investments and results. We encourage you to review it carefully.
Inside these pages you will find a letter from the Funds’ Chairman, Michael Seely, in which he comments on recent market developments. The report also includes commentary from the Funds’ portfolio managers in which they discuss the investment markets and their respective Fund’s performance. Each commentary is accompanied by the Fund’s return for the period, listed alongside the returns of its benchmark index and peer group average for comparative purposes.
In closing, we would like to thank you for investing in the HSBC Funds. We continue to focus the HSBC Fund Family on investment solutions to assist our shareholders in reaching their financial goals. We appreciate the trust you place in us, and will continue working to earn it. Please contact us at any time with questions or concerns.
Sincerely,
Richard A. Fabietti
President
JOB TITLE HSBC Money Market SAR REVISION 6 SERIAL <12345678> DATE Thursday, June 27, 2013 JOB NUMBER 251995 TYPE PAGE NO. 5 OPERATOR PM4
HSBC FAMILY OF FUNDS
Commentary From the Investment Manager
6
HSBC Global Asset Management (USA) Inc.
U.S. Economic Review
The global economy experienced moderate growth during the six-month period between November 1, 2012 and April 30, 2013. Many major economies produced disappointing economic data during much of the period. Consumer spending weakened and fiscal problems continued to plague the eurozone. However, U.S. equity markets made strong gains as the housing market showed significant improvement and consumer spending increased. Markets continued to benefit from the Federal Reserve Board’s decision to maintain the federal funds rate—a key factor in lending rates—at a historically low target range between 0.00% and 0.25% through 2014.
The period began with equities in the U.S. retreating somewhat from gains made in the previous quarter. This pullback was caused in part by renewed concerns about the eurozone debt crisis and the looming threat in the U.S. of the “fiscal cliff”—a collection of spending cuts and tax increases scheduled to take effect in January 2013. Markets both in the U.S. and abroad performed much stronger during the first quarter of 2013 due to improving circumstances in the eurozone and positive domestic economic data. Still, new signs of slowing economic growth—and concerns about political crises in Italy and Cyprus—contributed to higher volatility in the equity markets during the spring. Despite these issues, in addition to lingering weakness in the labor market, equity U.S. markets ended the period significantly higher than six months earlier.
The housing market was the area of the U.S. economy that showed the clearest signs of improvement. Data indicated that home prices were rising and sales were increasing. Home prices in February made their largest year-over-year gain since May 2006. These positive developments produced optimism that the market could finally be headed towards a full recovery from its 2008 collapse.
Another development that supported recent market gains was the European Central Bank’s efforts to reduce borrowing costs for peripheral European countries. These efforts included an aggressive government bond-buying program known as Outright Monetary Transactions. The formation of a governing political coalition in Italy also helped alleviate concerns about a political crisis in that country. Nonetheless, lingering sovereign debt and fiscal problems persist in Europe, and the continent remains in recession.
The unemployment rate continued to edge downward, but remained well above pre-recession levels. Real income and the consumer savings rate remained weak during the period, while consumer confidence declined slightly. Economic activity in the manufacturing sector expanded during each of the last five months of the period, though the rate of growth slowed.
Emerging markets as a whole performed poorly during the period, as the dollar gained strength and commodity prices fell. Economic data from China were mixed, though there were no signs that its economy was about to suffer the “hard landing” that some analyst had feared.
U.S. Gross Domestic Product1 (GDP) grew at a rate of 0.4% during the fourth quarter of 2012—the slowest rate since the first quarter of 2011. A preliminary estimate puts GDP growth during the first quarter of 2013 at 2.5%.
Market Review
The period began with a steep sell-off in U.S. markets that bottomed out in mid-November. Equities then reversed direction and began a strong rally that persisted through the duration of the period with only a few brief interruptions. Equities performed well despite investors’ concerns that the political deadlock over the fiscal cliff and the subsequent onset of automatic budget cuts—known as the sequester—would undermine economic growth. A political compromise that avoided the most dire consequences of the fiscal cliff, along with improvement in the housing market, helped buoy investor confidence and fuel gains in the equity markets.
During the period, small- and mid-cap stocks outperformed large-cap stocks, and emerging markets generally underperformed developed economies. The Russell 2000® Index1 of small-company stocks returned 16.58% and the MSCI Emerging Market Index1 returned 5.40%.
Stocks in developed economies rose. Japanese equities performed especially well due to optimism regarding its central bank’s efforts to revive its economy. European stocks made gains, but lagged well behind U.S. markets. The S&P 500 Index1 of large-company stocks returned 14.42% for the six months through April 2013. That compared to a 17.18% return for the MSCI EAFE Index1 of international stocks in developed markets.
Among fixed-income securities, yields on U.S. Treasury bonds increased during the period, sending prices lower. Investment-grade corporate bonds also declined. Investors sought the higher yields offered by high-yield corporate bonds and high-yield municipal bonds, which were the best-performing fixed-income sectors during the quarter. The Barclays U.S. Aggregate Bond Index1, which tracks the broad investment-grade fixed-income market, returned 0.90% for the six months through April, while the Barclays U.S. High-Yield Corporate Bond Index1 returned 7.26%. Fixed-income markets in Europe generated modest returns, while fixed-income in emerging markets ended the period higher, though it performed poorly during the first quarter of 2013 following strong gains throughout 2012.
1 For additional information, please refer to the Glossary of Terms.
JOB TITLE HSBC Money Market SAR REVISION 6 SERIAL <12345678> DATE Thursday, June 27, 2013 JOB NUMBER 251995 TYPE PAGE NO. 6 OPERATOR PM4
Portfolio Reviews (Unaudited)
Investment Concerns
An investment in the Fund is not insured or guaranteed by the FDIC or any other government agency. Although the Fund seeks to preserve the value of your investment at $1.00 per share, it is possible to lose money by investing in the Fund.
For a complete description of these and other risks associated with investment in a mutual fund, please refer to the Fund’s prospectus.
Portfolio Performance
Money market yields fell during the six-month period ended April 30, 2013.
The Federal Reserve Board (the “Fed”) during the period ended Operation Twist, a program that was designed to lower long-term bond yields and stimulate economic growth by simultaneously selling short-dated Treasuries and buying long-dated Treasuries. The end of that program reduced the supply of short-term securities in the market, which in turn led to higher prices and lower yields for these securities. In addition, supply fell during the period because broker/
dealers issued fewer money market securities due to regulations that incentivized those broker/dealers to extend the duration of their balance sheets through longer-term securities.
Rates stayed low during the period in view of the fact that the Fed indicated that it would not consider raising short-term interest rates in the near future in order to continue to support economic growth.
We positioned the Fund with a relatively long weighted average maturity during the period, which helped the Fund capture the additional yield offered by longer-term securities. We continued to favor high-quality issues. Most of the longer-term issues in the Fund were Treasury securities and high-quality floating rate notes issued by banks.†
† Portfolio composition is subject to change.
HSBC Prime Money Market Fund(Class A Shares, Class B Shares, Class C Shares, Class D Shares, Class I Shares and Class Y Shares)
by John ChiodiSenior Portfolio Manager
Fund PerformanceAverage Annual Total Return (%) Yield (%)2
Expense Ratio (%)3
As of April 30, 2013Inception
DateSix
Months*1
Year5
Year10
YearSince
Inception7-Day
Average Gross Net
Class A 11/13/98 0.01 0.01 0.27 1.49 2.15 0.01 0.69 0.69
Past performance does not guarantee future results. The performance data quoted represents past performance and current returns may be lower or higher. Total return figures include change in share price, reinvestment of dividends and capital gains and do not reflect taxes that a shareholder would pay on Fund distributions or on the redemption of Fund shares. Investment return and principal value will fluctuate so that an investor’s shares, when redeemed may be worth more or less than the original cost. To obtain performance information current to the most recent month end, please call 1-800-782-8183.
The performance above reflects any fee waivers that have been in effect during the applicable periods, as well as any expense reimbursements that have periodically been made. Absent such waivers and reimbursements, returns would have been lower.
Certain returns shown include monies received by the Fund in respect of a one-time payment in respect of a class action settlement and a one-time reimbursement from HSBC Global Asset Management (USA) Inc. related to past marketing arrangements. As a result, the Fund’s total returns for those periods were higher than they would have been had the Fund not received the payments.
* Aggregate total return.1 The “Aaa” and “AAAm” money market fund rating is historical and reflects Moody’s and Standard & Poor’s opinion as to the quality of the Fund’s investments, liquidity
management, and operations and trading support. Periodic reviews are conducted to ensure a secure operations environment. Moody’s and Standard & Poor’s ratings represent an opinion only, not a recommendation to buy or sell. Obligations rated A-1+, A-1 or P-1 are rated in the highest short-term rating category by Standard & Poor’s (A-1+ or A-1) or Moody’s Investor Service (P-1). The obligor’s capacity to meet its financial commitments on these obligations is regarded to be “extremely strong” (A-1+), “strong” (A-1) or “superior” (P-1).
2 The seven-day yield quotation more closely reflects the current earnings of the money market fund than the total return quotation. The seven-day yield reflects voluntary fee waivers/expense reimbursements. Without the voluntary fee waivers/expense reimbursements, the yields would have been -0.43%, -1.03%, -1.03%, -0.28%, 0.07% and -0.03% for Class A Shares, Class B Shares, Class C Shares, Class D Shares, Class I Shares and Class Y Shares, respectively.
3 Reflects the expense ratio as reported in the prospectus dated February 28, 2013. 4 Reflects the applicable contingent deferred sales charge, maximum of 4.00%. Class B Shares were operational during a portion of the periods presented. Amounts reflect
performance for the period of time the Class had operations, which was 147 and 211 days for the years ended October 31, 2002 and 2001, respectively. The Class was operational during the entire years ended October 31, 2003, 2004, 2005, 2006, 2007, 2008, 2009, 2010, 2011 and 2012, respectively and for the entire six-months ended April 30, 2013.
5 Reflects the applicable contingent deferred sales charge, maximum of 1.00%. Class C Shares were operational during a portion of the periods presented. Amounts reflect performance for the period of time the Class had operations, which was 201 days for the year ended October 31, 2001. The Class was operational during the entire years ended October 31, 2002, 2003, 2004, 2005, 2006, 2007, 2008, 2009, 2010, 2011 and 2012, respectively and for the entire six-months ended April 30, 2013.
6 For additional information, please refer to the Glossary of Terms.7 Return for the period October 31, 1998 to April 30, 2013.
HSBC FAMILY OF FUNDS 7
Moody’s and Standard & Poor’s have assigned an “Aaa” and
“AAAm” rating to the HSBC Prime Money Market Fund.1
JOB TITLE HSBC Money Market SAR REVISION 6 SERIAL <12345678> DATE Thursday, June 27, 2013 JOB NUMBER 251995 TYPE PAGE NO. 7 OPERATOR PM4
Portfolio Reviews (Unaudited)
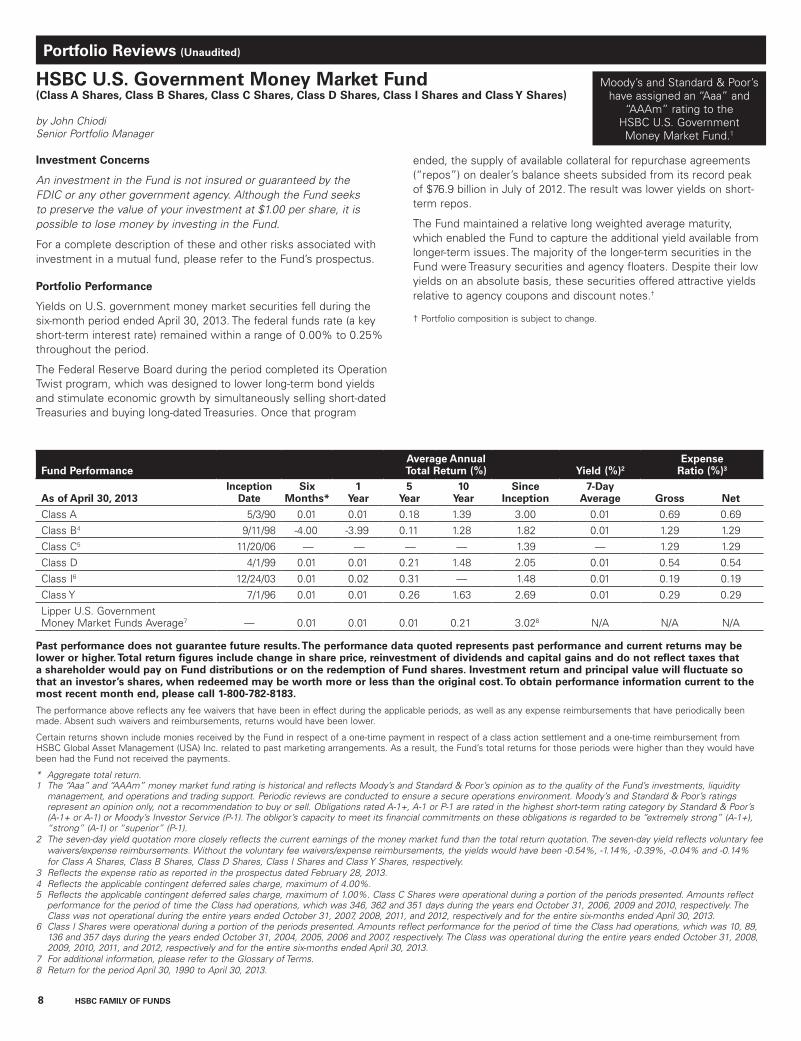
HSBC U.S. Government Money Market Fund(Class A Shares, Class B Shares, Class C Shares, Class D Shares, Class I Shares and Class Y Shares)
by John ChiodiSenior Portfolio Manager
Investment Concerns
An investment in the Fund is not insured or guaranteed by the FDIC or any other government agency. Although the Fund seeks to preserve the value of your investment at $1.00 per share, it is possible to lose money by investing in the Fund.
For a complete description of these and other risks associated with investment in a mutual fund, please refer to the Fund’s prospectus.
Portfolio Performance
Yields on U.S. government money market securities fell during the six-month period ended April 30, 2013. The federal funds rate (a key short-term interest rate) remained within a range of 0.00% to 0.25% throughout the period.
The Federal Reserve Board during the period completed its Operation Twist program, which was designed to lower long-term bond yields and stimulate economic growth by simultaneously selling short-dated Treasuries and buying long-dated Treasuries. Once that program
ended, the supply of available collateral for repurchase agreements (“repos”) on dealer’s balance sheets subsided from its record peak of $76.9 billion in July of 2012. The result was lower yields on short-term repos.
The Fund maintained a relative long weighted average maturity, which enabled the Fund to capture the additional yield available from longer-term issues. The majority of the longer-term securities in the Fund were Treasury securities and agency floaters. Despite their low yields on an absolute basis, these securities offered attractive yields relative to agency coupons and discount notes.†
† Portfolio composition is subject to change.
Moody’s and Standard & Poor’s have assigned an “Aaa” and
“AAAm” rating to the HSBC U.S. Government Money Market Fund.1
Fund PerformanceAverage Annual Total Return (%) Yield (%)2
Expense Ratio (%)3
As of April 30, 2013Inception
DateSix
Months*1
Year5
Year10
YearSince
Inception7-Day
Average Gross Net
Class A 5/3/90 0.01 0.01 0.18 1.39 3.00 0.01 0.69 0.69
Class Y 7/1/96 0.01 0.01 0.26 1.63 2.69 0.01 0.29 0.29
Lipper U.S. Government Money Market Funds Average7 — 0.01 0.01 0.01 0.21 3.028 N/A N/A N/A
Past performance does not guarantee future results. The performance data quoted represents past performance and current returns may be lower or higher. Total return figures include change in share price, reinvestment of dividends and capital gains and do not reflect taxes that a shareholder would pay on Fund distributions or on the redemption of Fund shares. Investment return and principal value will fluctuate so that an investor’s shares, when redeemed may be worth more or less than the original cost. To obtain performance information current to the most recent month end, please call 1-800-782-8183.
The performance above reflects any fee waivers that have been in effect during the applicable periods, as well as any expense reimbursements that have periodically been made. Absent such waivers and reimbursements, returns would have been lower.
Certain returns shown include monies received by the Fund in respect of a one-time payment in respect of a class action settlement and a one-time reimbursement from HSBC Global Asset Management (USA) Inc. related to past marketing arrangements. As a result, the Fund’s total returns for those periods were higher than they would have been had the Fund not received the payments.
* Aggregate total return.1 The “Aaa” and “AAAm” money market fund rating is historical and reflects Moody’s and Standard & Poor’s opinion as to the quality of the Fund’s investments, liquidity
management, and operations and trading support. Periodic reviews are conducted to ensure a secure operations environment. Moody’s and Standard & Poor’s ratings represent an opinion only, not a recommendation to buy or sell. Obligations rated A-1+, A-1 or P-1 are rated in the highest short-term rating category by Standard & Poor’s (A-1+ or A-1) or Moody’s Investor Service (P-1). The obligor’s capacity to meet its financial commitments on these obligations is regarded to be “extremely strong” (A-1+), “strong” (A-1) or “superior” (P-1).
2 The seven-day yield quotation more closely reflects the current earnings of the money market fund than the total return quotation. The seven-day yield reflects voluntary fee waivers/expense reimbursements. Without the voluntary fee waivers/expense reimbursements, the yields would have been -0.54%, -1.14%, -0.39%, -0.04% and -0.14% for Class A Shares, Class B Shares, Class D Shares, Class I Shares and Class Y Shares, respectively.
3 Reflects the expense ratio as reported in the prospectus dated February 28, 2013.4 Reflects the applicable contingent deferred sales charge, maximum of 4.00%.5 Reflects the applicable contingent deferred sales charge, maximum of 1.00%. Class C Shares were operational during a portion of the periods presented. Amounts reflect
performance for the period of time the Class had operations, which was 346, 362 and 351 days during the years end October 31, 2006, 2009 and 2010, respectively. The Class was not operational during the entire years ended October 31, 2007, 2008, 2011, and 2012, respectively and for the entire six-months ended April 30, 2013.
6 Class I Shares were operational during a portion of the periods presented. Amounts reflect performance for the period of time the Class had operations, which was 10, 89, 136 and 357 days during the years ended October 31, 2004, 2005, 2006 and 2007, respectively. The Class was operational during the entire years ended October 31, 2008, 2009, 2010, 2011, and 2012, respectively and for the entire six-months ended April 30, 2013.
7 For additional information, please refer to the Glossary of Terms.8 Return for the period April 30, 1990 to April 30, 2013.
8 HSBC FAMILY OF FUNDS
JOB TITLE HSBC Money Market SAR REVISION 6 SERIAL <12345678> DATE Thursday, June 27, 2013 JOB NUMBER 251995 TYPE PAGE NO. 8 OPERATOR PM4
Portfolio Reviews (Unaudited)
HSBC U.S. Treasury Money Market Fund(Class A Shares, Class B Shares, Class C Shares, Class D Shares, Class I Shares and Class Y Shares)
by John ChiodiSenior Portfolio Manager
Investment Concerns
An investment in the Fund is not insured or guaranteed by the FDIC or any other government agency. Although the Fund seeks to preserve the value of your investment at $1.00 per share, it is possible to lose money by investing in the fund. The Fund’s income may be subject to the federal alternative minimum tax and to certain state and local taxes.
For a complete description of these and other risks associated with investment in a mutual fund, please refer to the Fund’s prospectus.
Portfolio Performance
Treasury bill yields remained low during the six-month period ended April 30, 2013.
The Federal Reserve Board (the “Fed”) kept the federal funds rate (a key short-term interest rate) between 0.00% and 0.25% during the period. Additionally, the Fed set new thresholds for when it would consider raising rates, including unemployment falling to 6.5% and the rate of inflation rising above 2%. Given the current state of high unemployment and low inflation, we believe investors were confident that the Fed would not raise rates in the near future.
Supply and demand factors also affected money market yields. Demand for Treasuries rose near the end of 2012, as it generally
does at the end of each calendar year as institutional investors shift assets into short-term, liquid securities to improve the quality of their balance sheets. That increase in demand caused Treasury yields to fall at year-end and into early 2013. The Fed later increased the supply of Treasury bills by issuing cash management bills, and Treasury yields rose due to that increase in supply.
Early in the period, we positioned the Fund with a relatively long weighted average maturity, which enabled the Fund to lock in the relatively high yields offered by longer-term securities. The Fund’s yield fell somewhat early in 2013, when the Fund had to reinvest at relatively low yields. As we reinvested, we strategically positioned the Fund with a relatively short weighted average maturity in anticipation of the Treasury’s upcoming new issuance. That allowed the Fund to take advantage of the added supply of Treasury bills starting in February.
The Fund also continued to implement a barbell strategy that concentrates holdings among very short-term securities and longer-term issues. This approach enabled the Fund to take advantage of the rise in short-term rates when the supply of Treasury bills increased, while still capturing the additional yield on longer-term money market securities.†
† Portfolio composition is subject to change.
Fund PerformanceAverage Annual Total Return (%) Yield (%)2
Expense Ratio (%)3
As of April 30, 2013Inception
DateSix
Months*1
Year5
Year10
YearSince
Inception7-Day
Average Gross Net
Class A 5/24/01 0.00 0.00 0.09 1.17 1.17 0.00 0.69 0.69
Past performance does not guarantee future results. The performance data quoted represents past performance and current returns may be lower or higher. Total return figures include change in share price, reinvestment of dividends and capital gains and do not reflect taxes that a shareholder would pay on Fund distributions or on the redemption of Fund shares. Investment return and principal value will fluctuate so that an investor’s shares, when redeemed may be worth more or less than the original cost. To obtain performance information current to the most recent month end, please call 1-800-782-8183.
The performance above reflects any fee waivers that have been in effect during the applicable periods, as well as any expense reimbursements that have periodically been made. Absent such waivers and reimbursements, returns would have been lower.
Certain returns shown include monies received by the Fund in respect of a one-time payment in respect of a class action settlement and a one-time reimbursement from HSBC Global Asset Management (USA) Inc. related to past marketing arrangements. As a result, the Fund’s total returns for those periods were higher than they would have been had the Fund not received the payments.
* Aggregate total return.1 The “AAA” money market fund rating is historical and reflects Standard & Poor’s opinion as to the quality of the Fund’s investments, liquidity management, and operations
and trading support. Periodic reviews are conducted to ensure a secure operations environment. Standard & Poor’s rating represent an opinion only, not a recommendation to buy or sell. Obligations rated A-1+, A-1 or P-1 are rated in the highest short-term rating category by Standard & Poor’s (A-1+ or A-1) or Moody’s Investor Service (P-1). The obligor’s capacity to meet its financial commitments on these obligations is regarded to be “extremely strong” (A-1+), “strong” (A-1) or “superior” (P-1).
2 The seven-day yield quotation typically more closely reflects the current earnings of the money market fund than the total return quotation. The seven-day yield reflects voluntary fee waivers/expense reimbursements. Without the voluntary fee waivers/expense reimbursements, the yields would have been -0.60%, -1.20%, -0.45%, -0.10% and -0.20% for Class A Shares, Class B Shares, Class D Shares, Class I Shares and Class Y Shares, respectively.
3 Reflects the expense ratio as reported in the prospectus dated February 28, 2013.4 Reflects the applicable contingent deferred sales charge, maximum of 4.00%.5 Reflects the applicable contingent deferred sales charge, maximum of 1.00%. Class C Shares were operational during a portion of the periods presented.
Amounts reflect performance for the period of time the Class had operations, which was 26 and 351 days during the years ended October 31, 2008 and 2010, respectively. The Class was operational during the entire years ended October 31, 2005, 2006, 2007 and 2009. The Class was not operational during the entire years ended October 31, 2011 and 2012 and for the entire six-months ended April 30, 2013.
6 Class I Shares were operational during a portion of the periods presented. Amounts reflect performance for the period of time the Class had operations, which was 13 and 280 days during the years ended October 31, 2004 and 2005, respectively. The Class was operational during the entire years ended October 31, 2006, 2007, 2008, 2009, 2010, 2011, and 2012, respectively and for the entire six-months ended April 30, 2013.
7 For additional information, please refer to the Glossary of Terms. 8 Return for the period April 30, 2001 to April 30, 2013.
HSBC FAMILY OF FUNDS 9
Standard & Poor’s has assigned an “AAA” rating to the HSBC U.S.
Treasury Money Market Fund.1
JOB TITLE HSBC Money Market SAR REVISION 6 SERIAL <12345678> DATE Thursday, June 27, 2013 JOB NUMBER 251995 TYPE PAGE NO. 9 OPERATOR PM4
Po r t f o l i o R e v i e w s
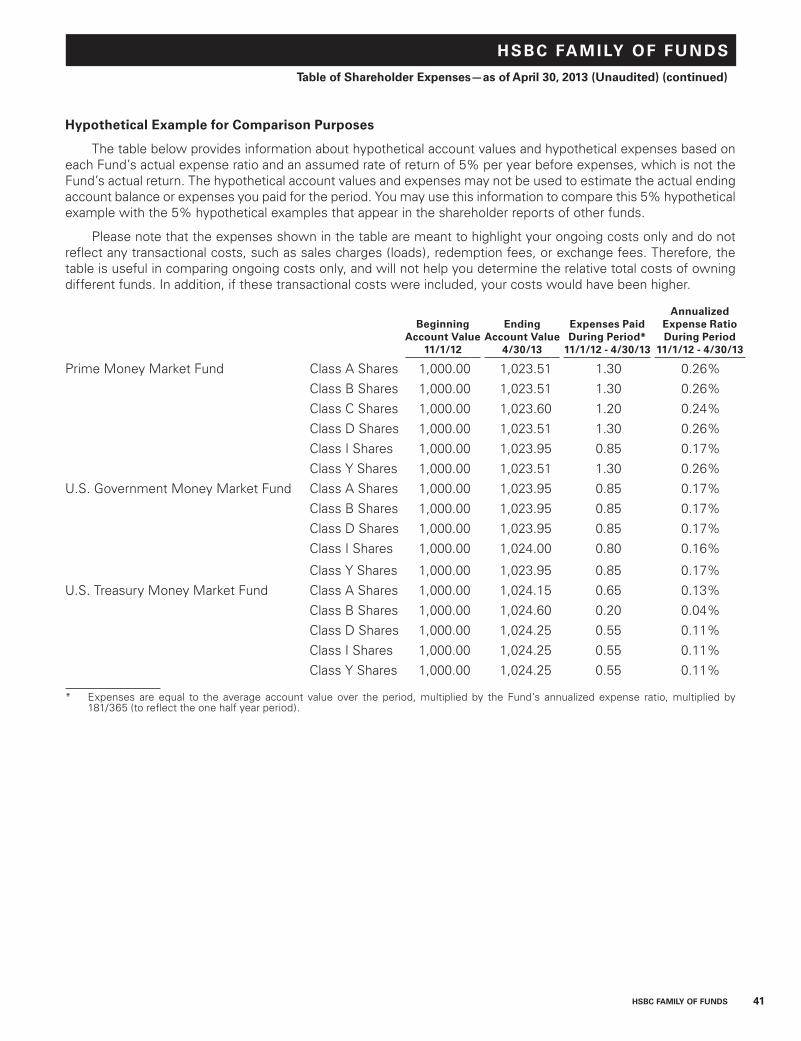
Portfolio Composition*April 30, 2013 (Unaudited)
10 HSBC FAMILY OF FUNDS
HSBC Prime Money Market FundInvestment Allocation Percentage of Investments at Value (%)
Commercial Paper and Notes 39.8Certificates of Deposit 36.0Time Deposits 9.9U.S. Treasury Obligations 7.9Yankee Dollars 2.5Variable Rate Demand Notes 1.5Corporate Obligations 1.3U.S. Government and Government Agency Obligations 0.6Repurchase Agreements 0.5Total 100.0
HSBC U.S. Government Money Market FundInvestment Allocation Percentage of Investments at Value (%)
Repurchase Agreements 55.4U.S. Government and Government Agency Obligations 22.7U.S. Treasury Obligations 21.9Total 100.0
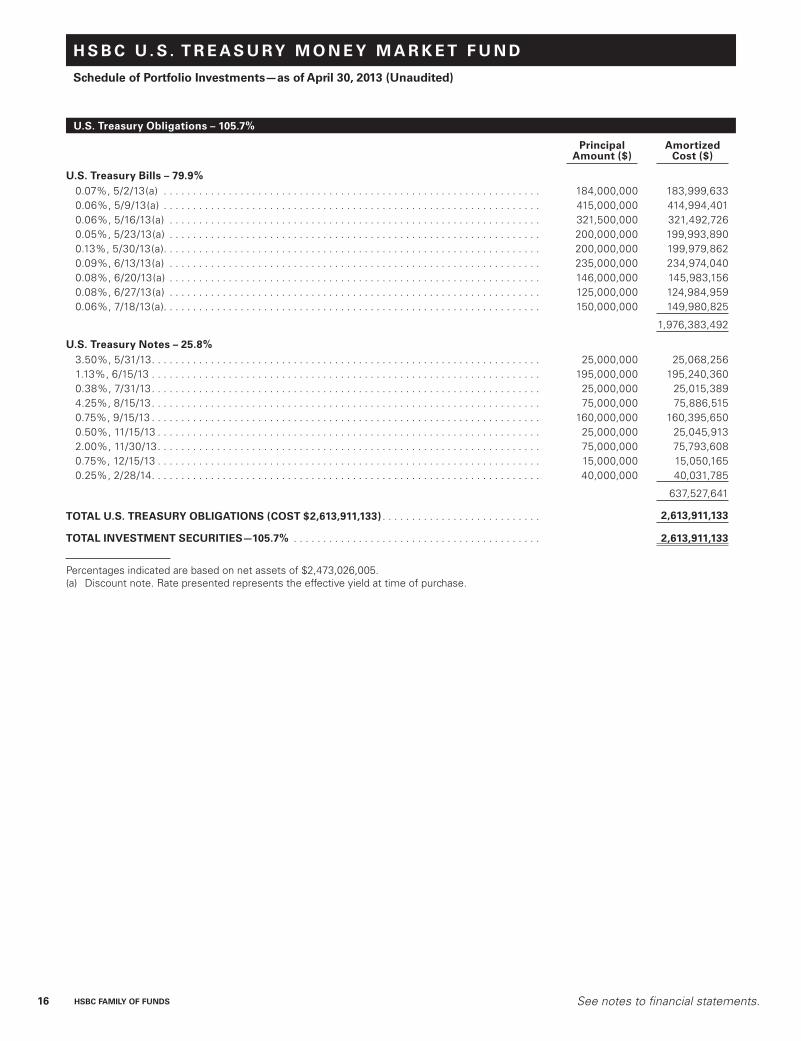
HSBC U.S. Treasury Money Market FundInvestment Allocation Percentage of Investments at Value (%)
U.S. Treasury Obligations 100.0Total 100.0
* Portfolio composition is subject to change.
JOB TITLE HSBC Money Market SAR REVISION 9 SERIAL <12345678> DATE Friday, June 28, 2013 JOB NUMBER 251995 TYPE PAGE NO. 10 OPERATOR PM3
H S B C P R I M E M O N E Y M A R K E T F U N D
Schedule of Portfolio Investments—as of April 30, 2013 (Unaudited)
See notes to financial statements. HSBC FAMILY OF FUNDS 11
Certificates of Deposit – 36.0%
Principal Amount ($)
Amortized Cost ($)
Banking – 36.0%Bank of Montreal Chicago,
0.25%, 9/25/13 . . . . . . . . . . . . 50,000,000 50,000,000Bank of Nova Scotia Houston,
TOTAL U.S. TREASURY OBLIGATIONS (COST $382,984,741) . . . . . . . 382,984,741
Repurchase Agreements – 0.5%
BNP Paribas, purchased on 4/24/13, 0.09%, due on 5/1/13 with a maturity value of $25,000,438, collateralized by Various U.S. Government and Government Agency Obligations, 2.43%-6.00%, 8/1/19-7/1/42, fair value $25,500,000 . . . . . . . . 25,000,000 25,000,000
Percentages indicated are based on net assets of $4,879,237,164.(a) Variable rate security. The interest rates on these securities are
adjusted periodically to reflect then-current short-term interest rates. The rates presented represent the rates in effect on April 30, 2013. The maturity dates presented reflect the final maturity dates. However, some of these securities may contain put or demand features that allow the Fund to require the issuer to repurchase the security from the fund within various time periods, including daily, weekly, monthly, or semi-annually.
(b) Rule 144A security or other security which is restricted as to resale to institutional investors. This security has been deemed liquid by the Investment Adviser based on procedures approved by the Board of Trustees.
(c) Rate presented represents the effective yield at time of purchase.(d) Step Bond. Income recognition is on the effective yield method for
Step Bonds.AMT — Interest on security is subject to federal alternative
minimum taxLLC — Limited Liability CompanyLOC — Letter of CreditMTN — Medium Term Note
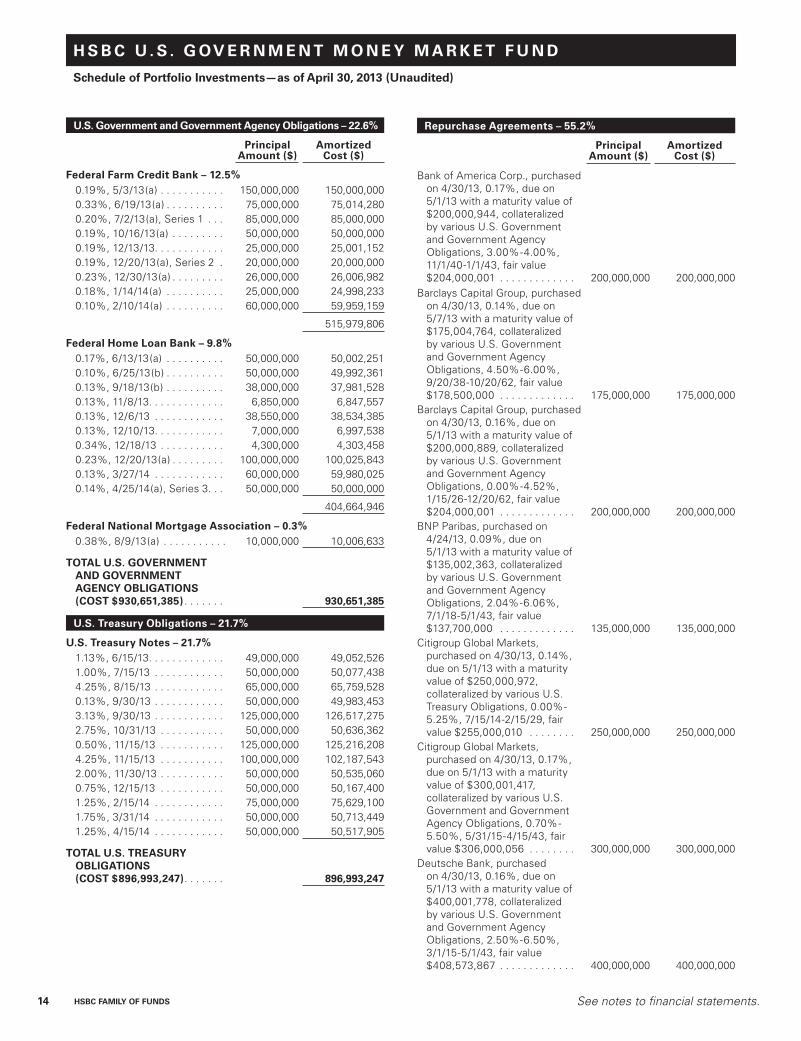
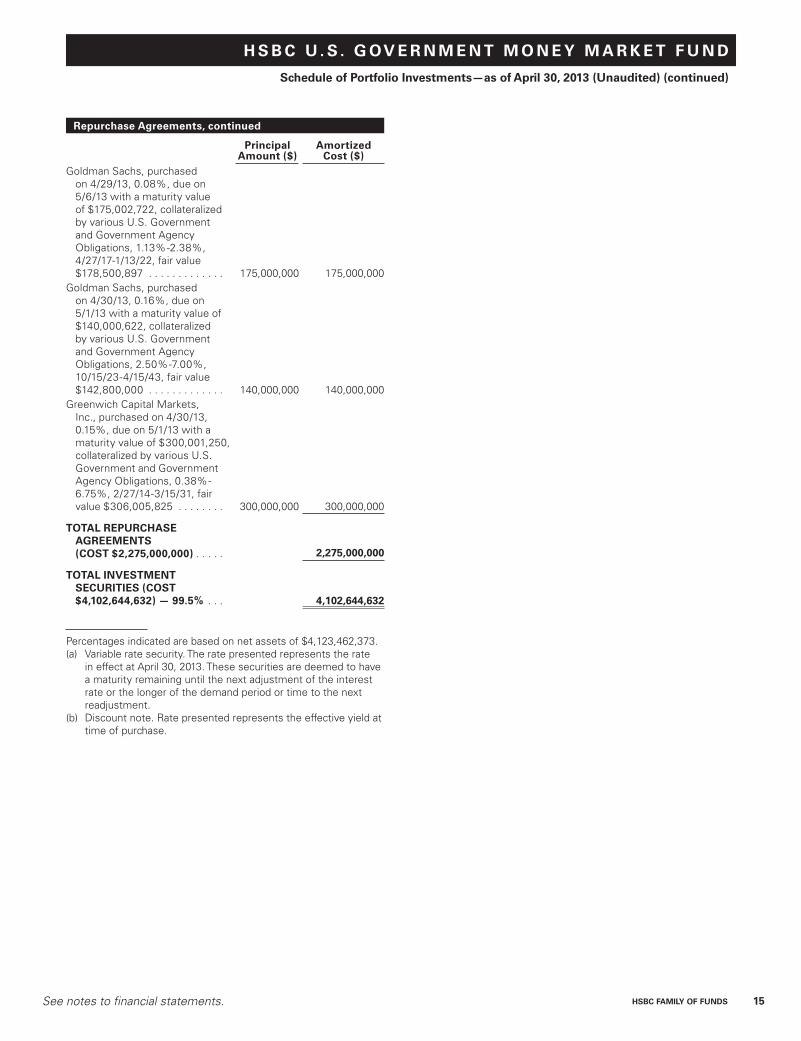
TOTAL U.S. TREASURY OBLIGATIONS (COST $896,993,247) . . . . . . . 896,993,247
Repurchase Agreements – 55.2%
Principal Amount ($)
Amortized Cost ($)
Bank of America Corp., purchased on 4/30/13, 0.17%, due on 5/1/13 with a maturity value of $200,000,944, collateralized by various U.S. Government and Government Agency Obligations, 3.00%-4.00%, 11/1/40-1/1/43, fair value $204,000,001 . . . . . . . . . . . . . 200,000,000 200,000,000
Barclays Capital Group, purchased on 4/30/13, 0.14%, due on 5/7/13 with a maturity value of $175,004,764, collateralized by various U.S. Government and Government Agency Obligations, 4.50%-6.00%, 9/20/38-10/20/62, fair value $178,500,000 . . . . . . . . . . . . . 175,000,000 175,000,000
Barclays Capital Group, purchased on 4/30/13, 0.16%, due on 5/1/13 with a maturity value of $200,000,889, collateralized by various U.S. Government and Government Agency Obligations, 0.00%-4.52%, 1/15/26-12/20/62, fair value $204,000,001 . . . . . . . . . . . . . 200,000,000 200,000,000
BNP Paribas, purchased on 4/24/13, 0.09%, due on 5/1/13 with a maturity value of $135,002,363, collateralized by various U.S. Government and Government Agency Obligations, 2.04%-6.06%, 7/1/18-5/1/43, fair value $137,700,000 . . . . . . . . . . . . . 135,000,000 135,000,000
Citigroup Global Markets, purchased on 4/30/13, 0.14%, due on 5/1/13 with a maturity value of $250,000,972, collateralized by various U.S. Treasury Obligations, 0.00%-5.25%, 7/15/14-2/15/29, fair value $255,000,010 . . . . . . . . 250,000,000 250,000,000
Citigroup Global Markets, purchased on 4/30/13, 0.17%, due on 5/1/13 with a maturity value of $300,001,417, collateralized by various U.S. Government and Government Agency Obligations, 0.70%-5.50%, 5/31/15-4/15/43, fair value $306,000,056 . . . . . . . . 300,000,000 300,000,000
Deutsche Bank, purchased on 4/30/13, 0.16%, due on 5/1/13 with a maturity value of $400,001,778, collateralized by various U.S. Government and Government Agency Obligations, 2.50%-6.50%, 3/1/15-5/1/43, fair value $408,573,867 . . . . . . . . . . . . . 400,000,000 400,000,000
JOB TITLE HSBC Money Market SAR REVISION 9 SERIAL <12345678> DATE Friday, June 28, 2013 JOB NUMBER 251995 TYPE PAGE NO. 14 OPERATOR PM10
H S B C U . S . G OV E R N M E N T M O N E Y M A R K E T F U N D
Schedule of Portfolio Investments—as of April 30, 2013 (Unaudited) (continued)
See notes to financial statements. HSBC FAMILY OF FUNDS 15
Repurchase Agreements, continued
Principal Amount ($)
Amortized Cost ($)
Goldman Sachs, purchased on 4/29/13, 0.08%, due on 5/6/13 with a maturity value of $175,002,722, collateralized by various U.S. Government and Government Agency Obligations, 1.13%-2.38%, 4/27/17-1/13/22, fair value $178,500,897 . . . . . . . . . . . . . 175,000,000 175,000,000
Goldman Sachs, purchased on 4/30/13, 0.16%, due on 5/1/13 with a maturity value of $140,000,622, collateralized by various U.S. Government and Government Agency Obligations, 2.50%-7.00%, 10/15/23-4/15/43, fair value $142,800,000 . . . . . . . . . . . . . 140,000,000 140,000,000
Greenwich Capital Markets, Inc., purchased on 4/30/13, 0.15%, due on 5/1/13 with a maturity value of $300,001,250, collateralized by various U.S. Government and Government Agency Obligations, 0.38%-6.75%, 2/27/14-3/15/31, fair value $306,005,825 . . . . . . . . 300,000,000 300,000,000
Percentages indicated are based on net assets of $4,123,462,373.(a) Variable rate security. The rate presented represents the rate
in effect at April 30, 2013. These securities are deemed to have a maturity remaining until the next adjustment of the interest rate or the longer of the demand period or time to the next readjustment.
(b) Discount note. Rate presented represents the effective yield at time of purchase.
JOB TITLE HSBC Money Market SAR REVISION 9 SERIAL <12345678> DATE Friday, June 28, 2013 JOB NUMBER 251995 TYPE PAGE NO. 15 OPERATOR PM10
H S B C U . S . T R E A S U RY M O N E Y M A R K E T F U N D
Schedule of Portfolio Investments—as of April 30, 2013 (Unaudited)
16 HSBC FAMILY OF FUNDS See notes to financial statements.
Percentages indicated are based on net assets of $2,473,026,005.(a) Discount note. Rate presented represents the effective yield at time of purchase.
JOB TITLE HSBC Money Market SAR REVISION 9 SERIAL <12345678> DATE Friday, June 28, 2013 JOB NUMBER 251995 TYPE PAGE NO. 16 OPERATOR PM10
See notes to financial statements. HSBC FAMILY OF FUNDS 17
H S B C FA M I LY O F F U N D SStatements of Assets and Liabilities—as of April 30, 2013 (Unaudited)
Prime Money Market
Fund
U.S. Government
Money Market Fund
U.S. Treasury Money Market
Fund
Assets:Investments, at value and amortized cost $4,851,654,577 $1,827,644,632 $2,613,911,133Repurchase agreements, at value and cost 25,000,000 2,275,000,000 —Total Investments 4,876,654,577 4,102,644,632 2,613,911,133Cash 471,218 16,819,768 6,364,424Interest receivable 3,158,483 4,627,815 2,771,246Receivable for capital shares issued 118,977 35,828 —Receivable from Investment Adviser — — 278,726Prepaid expenses and other assets 37,117 47,516 40,218Total Assets 4,880,440,372 4,124,175,559 2,623,365,747
Liabilities:Dividends payable 215,682 42,984 —Payable for investments purchased — — 149,996,384Accrued expenses and other liabilities:
Total Liabilities 1,203,208 713,186 150,339,742Net Assets $4,879,237,164 $4,123,462,373 $2,473,026,005
Composition of Net Assets:Capital 4,879,234,746 4,123,392,266 2,473,001,782Undistributed (distributions in excess of) net investment income 365 5,929 9Accumulated net realized gains (losses) from investments 2,053 64,178 24,214
Net Assets $4,879,237,164 $4,123,462,373 $2,473,026,005
Net Assets:Class A Shares $ 41,351,566 $ 635,891 $ 5,099Class B Shares 33,225 48,741 1,030Class C Shares 23 — —Class D Shares 1,267,253,752 617,033,445 558,659,448Class I Shares 2,948,531,003 1,238,969,734 489,813,172Class Y Shares 622,067,595 2,266,774,562 1,424,547,256
($0.001 par value, unlimited number of shares authorized):Class A Shares 41,352,161 635,889 5,091Class B Shares 33,255 48,727 1,031Class C Shares 23 — —Class D Shares 1,267,193,078 616,842,737 558,649,516Class I Shares 2,948,607,702 1,239,062,976 489,838,843Class Y Shares 622,062,753 2,266,802,298 1,424,512,279
Net Asset Value, Offering Price and Redemption Price per share:Class A Shares $ 1.00 $ 1.00 $ 1.00Class B Shares(a) $ 1.00 $ 1.00 $ 1.00Class C Shares(a) $ 1.00 $ — $ —Class D Shares $ 1.00 $ 1.00 $ 1.00Class I Shares $ 1.00 $ 1.00 $ 1.00Class Y Shares $ 1.00 $ 1.00 $ 1.00
(a) Redemption Price per share varies by length of time shares are held.
JOB TITLE HSBC Money Market SAR REVISION 9 SERIAL <12345678> DATE Friday, June 28, 2013 JOB NUMBER 251995 TYPE PAGE NO. 17 OPERATOR PM3
18 HSBC FAMILY OF FUNDS See notes to financial statements.
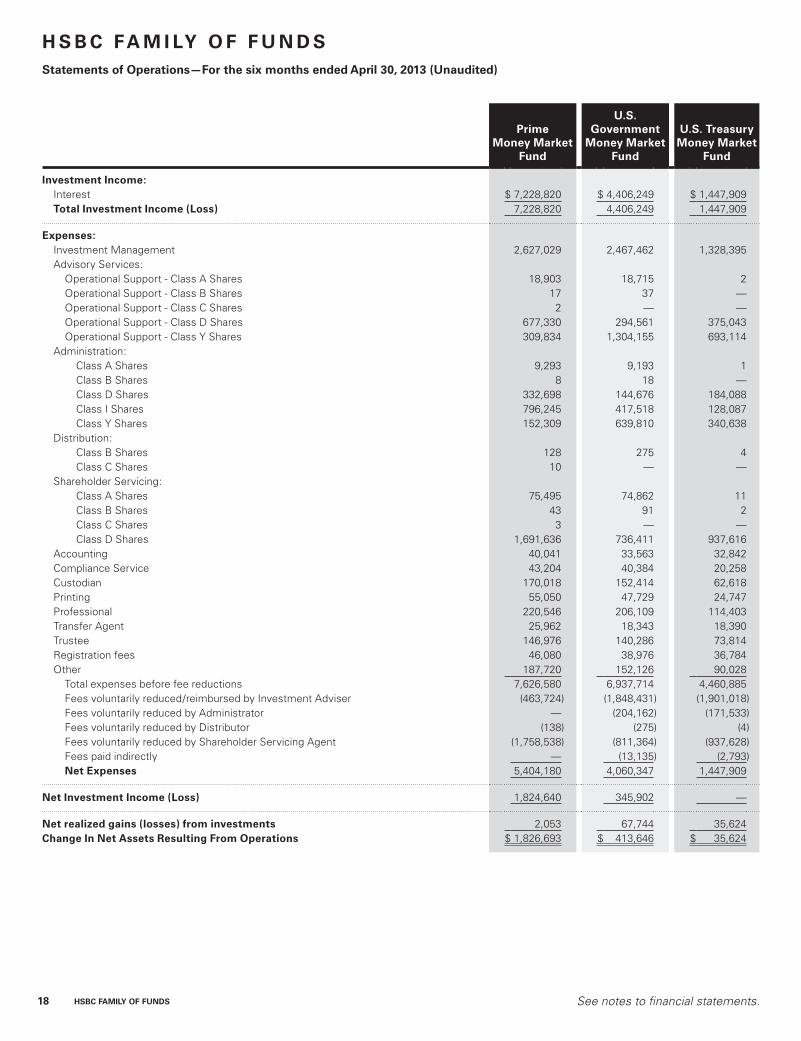
H S B C FA M I LY O F F U N D SStatements of Operations—For the six months ended April 30, 2013 (Unaudited)
Operational Support - Class A Shares 18,903 18,715 2Operational Support - Class B Shares 17 37 —Operational Support - Class C Shares 2 — —Operational Support - Class D Shares 677,330 294,561 375,043Operational Support - Class Y Shares 309,834 1,304,155 693,114
Administration:Class A Shares 9,293 9,193 1Class B Shares 8 18 —Class D Shares 332,698 144,676 184,088Class I Shares 796,245 417,518 128,087Class Y Shares 152,309 639,810 340,638
Distribution:Class B Shares 128 275 4Class C Shares 10 — —
Shareholder Servicing:Class A Shares 75,495 74,862 11Class B Shares 43 91 2Class C Shares 3 — —Class D Shares 1,691,636 736,411 937,616
Total expenses before fee reductions 7,626,580 6,937,714 4,460,885Fees voluntarily reduced/reimbursed by Investment Adviser (463,724) (1,848,431) (1,901,018)Fees voluntarily reduced by Administrator — (204,162) (171,533)Fees voluntarily reduced by Distributor (138) (275) (4)Fees voluntarily reduced by Shareholder Servicing Agent (1,758,538) (811,364) (937,628)Fees paid indirectly — (13,135) (2,793)Net Expenses 5,404,180 4,060,347 1,447,909
Net Investment Income (Loss) 1,824,640 345,902 —
Net realized gains (losses) from investments 2,053 67,744 35,624Change In Net Assets Resulting From Operations $ 1,826,693 $ 413,646 $ 35,624
JOB TITLE HSBC Money Market SAR REVISION 9 SERIAL <12345678> DATE Friday, June 28, 2013 JOB NUMBER 251995 TYPE PAGE NO. 18 OPERATOR PM3
See notes to financial statements. HSBC FAMILY OF FUNDS 19
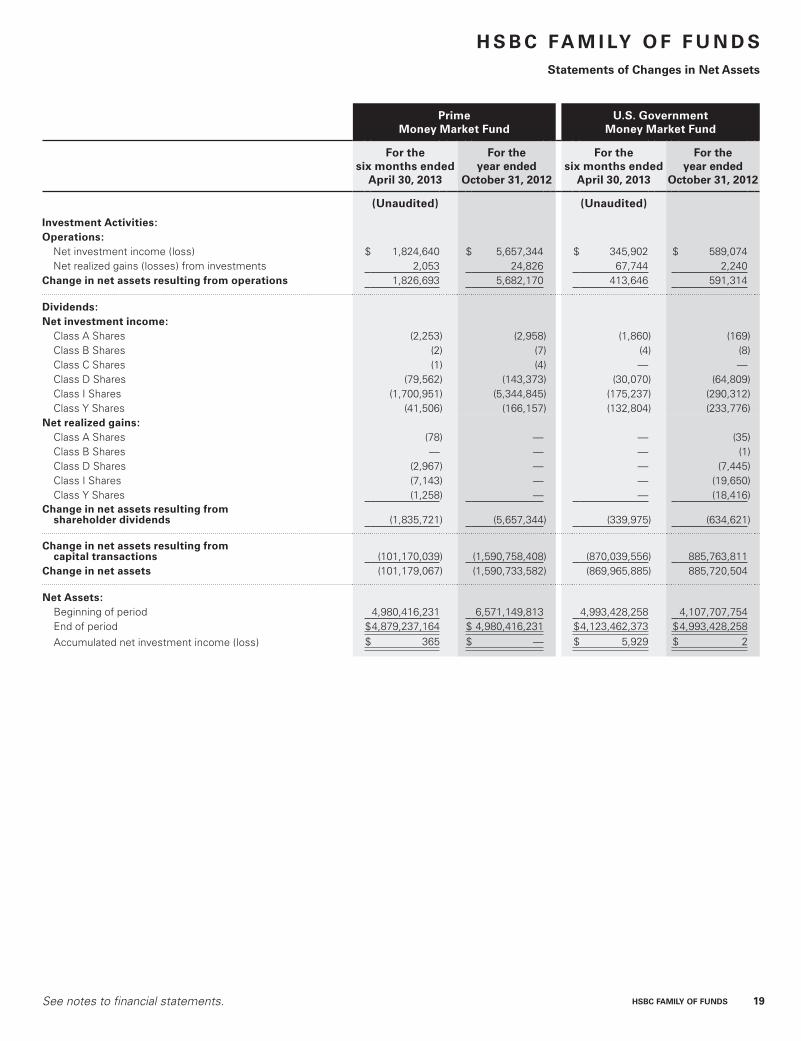
H S B C FA M I LY O F F U N D SStatements of Changes in Net Assets
Prime Money Market Fund
U.S. Government Money Market Fund
For the six months ended
April 30, 2013
For the year ended
October 31, 2012
For the six months ended
April 30, 2013
For the year ended
October 31, 2012
(Unaudited) (Unaudited)
Investment Activities:Operations:
Net investment income (loss) $ 1,824,640 $ 5,657,344 $ 345,902 $ 589,074Net realized gains (losses) from investments 2,053 24,826 67,744 2,240
Change in net assets resulting from operations 1,826,693 5,682,170 413,646 591,314
Dividends:Net investment income:
Class A Shares (2,253) (2,958) (1,860) (169)Class B Shares (2) (7) (4) (8)Class C Shares (1) (4) — —Class D Shares (79,562) (143,373) (30,070) (64,809)Class I Shares (1,700,951) (5,344,845) (175,237) (290,312)Class Y Shares (41,506) (166,157) (132,804) (233,776)
Net realized gains:Class A Shares (78) — — (35)Class B Shares — — — (1)Class D Shares (2,967) — — (7,445)Class I Shares (7,143) — — (19,650)Class Y Shares (1,258) — — (18,416)
Change in net assets resulting from shareholder dividends (1,835,721) (5,657,344) (339,975) (634,621)
Change in net assets resulting from capital transactions (101,170,039) (1,590,758,408) (870,039,556) 885,763,811
Change in net assets (101,179,067) (1,590,733,582) (869,965,885) 885,720,504
Net Assets:Beginning of period 4,980,416,231 6,571,149,813 4,993,428,258 4,107,707,754End of period $4,879,237,164 $ 4,980,416,231 $4,123,462,373 $4,993,428,258Accumulated net investment income (loss) $ 365 $ — $ 5,929 $ 2
JOB TITLE HSBC Money Market SAR REVISION 9 SERIAL <12345678> DATE Friday, June 28, 2013 JOB NUMBER 251995 TYPE PAGE NO. 19 OPERATOR PM3
20 HSBC FAMILY OF FUNDS See notes to financial statements.
H S B C FA M I LY O F F U N D SStatements of Changes in Net Assets (continued)
Class A Shares capital transactions 7,805,537 5,783,406 397,333 (3,755,463)
Class B Shares:Proceeds from shares issued — 19,430 — —Dividends reinvested 2 6 3 9Value of shares redeemed (8,072) (110,006) (27,646) (17,135)
Class B Shares capital transactions (8,070) (90,570) (27,643) (17,126)
Class C Shares:Proceeds from shares issued 373 745 — —Dividends reinvested 1 4 — —Value of shares redeemed (6,109) (777) — —
Class C Shares capital transactions (5,735) (28) — —
Class D Shares:Proceeds from shares issued 2,515,251,256 5,747,496,581 1,077,866,836 2,112,895,877Dividends reinvested 60,178 112,060 14,646 41,463Value of shares redeemed (2,551,882,595) (6,035,401,728) (1,075,356,543) (2,244,889,380)
Class D Shares capital transactions (36,571,161) (287,793,087) 2,524,939 (131,952,040)
Class I Shares:Proceeds from shares issued 14,865,577,969 37,580,221,468 5,327,378,593 15,350,488,166Dividends reinvested 801,233 2,814,430 95,010 206,034Value of shares redeemed (14,943,530,985) (38,866,710,107) (5,961,698,655) (15,123,273,533)
Class I Shares capital transactions (77,151,783) (1,283,674,209) (634,225,052) 227,420,667
Class Y Shares:Proceeds from shares issued 910,454,101 2,112,812,015 11,552,776,720 16,530,799,457Dividends reinvested 38,166 146,189 131,613 250,271Value of shares redeemed (905,731,094) (2,137,942,124) (11,791,617,466) (15,736,981,955)
Class Y Shares capital transactions 4,761,173 (24,983,920) (238,709,133) 794,067,773Change in net assets resulting from
capital transactions $ (101,170,039) $ (1,590,758,408) $ (870,039,556) $ 885,763,811
JOB TITLE HSBC Money Market SAR REVISION 9 SERIAL <12345678> DATE Friday, June 28, 2013 JOB NUMBER 251995 TYPE PAGE NO. 20 OPERATOR PM3
See notes to financial statements. HSBC FAMILY OF FUNDS 21
H S B C FA M I LY O F F U N D SStatements of Changes in Net Assets (continued)
U.S. Treasury Money Market Fund
For the six months ended
April 30, 2012
For the year ended
October 31, 2012
(Unaudited)
Investment Activities:Operations:
Net investment income (loss) $ — $ 9Net realized gains (losses) from investments 35,624 8,482
Change in net assets resulting from operations 35,624 8,491
Dividends:Net realized gains:
Class D Shares — (6,485)Class I Shares — (6,826)Class Y Shares — (10,955)
Change in net assets resulting from shareholder dividends — (24,266)
Change in net assets resulting from capital transactions 99,004,200 (229,081,790)
Change in net assets 99,039,824 (229,097,565)
Net Assets:Beginning of period 2,373,986,181 2,603,083,746End of period $2,473,026,005 $2,373,986,181Accumulated net investment income (loss) $ 9 $ 9
JOB TITLE HSBC Money Market SAR REVISION 9 SERIAL <12345678> DATE Friday, June 28, 2013 JOB NUMBER 251995 TYPE PAGE NO. 21 OPERATOR PM3
22 HSBC FAMILY OF FUNDS See notes to financial statements.
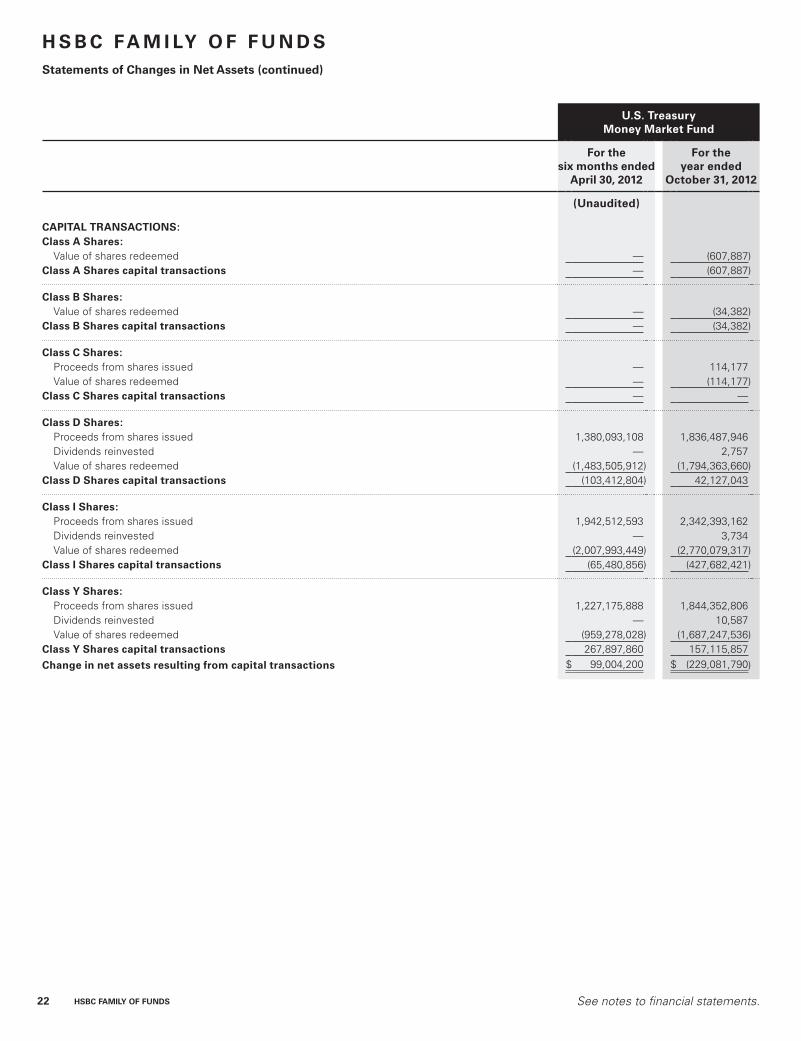
H S B C FA M I LY O F F U N D SStatements of Changes in Net Assets (continued)
U.S. Treasury Money Market Fund
For the six months ended
April 30, 2012
For the year ended
October 31, 2012
(Unaudited)
CAPITAL TRANSACTIONS:Class A Shares:
Value of shares redeemed — (607,887)Class A Shares capital transactions — (607,887)
Class B Shares:Value of shares redeemed — (34,382)
Class B Shares capital transactions — (34,382)
Class C Shares:Proceeds from shares issued — 114,177Value of shares redeemed — (114,177)
Class C Shares capital transactions — —
Class D Shares:Proceeds from shares issued 1,380,093,108 1,836,487,946Dividends reinvested — 2,757Value of shares redeemed (1,483,505,912) (1,794,363,660)
Class D Shares capital transactions (103,412,804) 42,127,043
Class I Shares:Proceeds from shares issued 1,942,512,593 2,342,393,162Dividends reinvested — 3,734Value of shares redeemed (2,007,993,449) (2,770,079,317)
Class I Shares capital transactions (65,480,856) (427,682,421)
Class Y Shares:Proceeds from shares issued 1,227,175,888 1,844,352,806Dividends reinvested — 10,587Value of shares redeemed (959,278,028) (1,687,247,536)
Class Y Shares capital transactions 267,897,860 157,115,857Change in net assets resulting from capital transactions $ 99,004,200 $ (229,081,790)
JOB TITLE HSBC Money Market SAR REVISION 9 SERIAL <12345678> DATE Friday, June 28, 2013 JOB NUMBER 251995 TYPE PAGE NO. 22 OPERATOR PM3
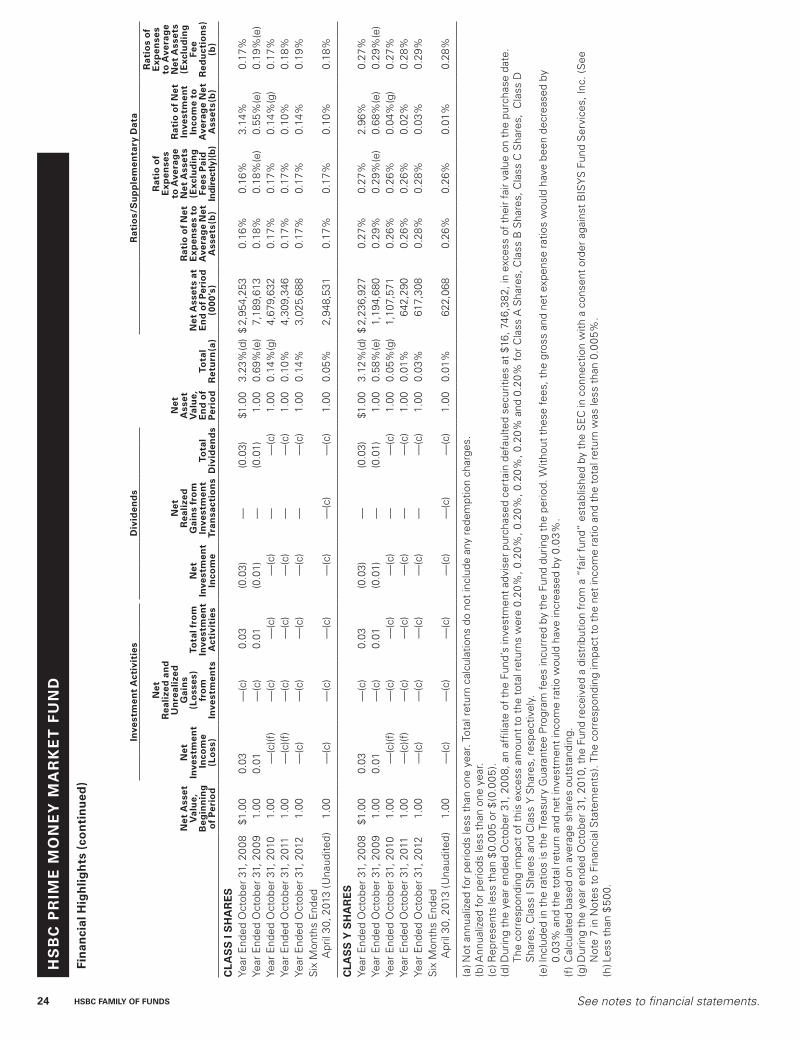
See notes to financial statements. HSBC FAMILY OF FUNDS 23
HS
BC
Pr
IMe
MO
Ne
Y M
Ar
ke
t F
UN
D
Fin
anci
al H
igh
ligh
ts
Sel
ecte
d d
ata
for
a sh
are
ou
tsta
nd
ing
th
rou
gh
ou
t th
e p
erio
ds
ind
icat
ed.
Inve
stm
ent
Act
ivit
ies
Div
iden
ds
rat
ios/
Su
pp
lem
enta
ry D
ata
Net
Ass
et
Val
ue,
B
egin
nin
g
of
Per
iod
Net
In
vest
men
t In
com
e (L
oss
)
Net
r
eali
zed
an
d
Un
real
ized
G
ain
s (L
oss
es)
fro
m
Inve
stm
ents
tota
l fro
m
Inve
stm
ent
Act
ivit
ies
Net
In
vest
men
t In
com
e
Net
r
eali
zed
G
ain
s fr
om
In
vest
men
t tr
ansa
ctio
ns
tota
l D
ivid
end
s
Net
A
sset
V
alu
e,
en
d o
f P
erio
dto
tal
ret
urn
(a)
Net
Ass
ets
at
en
d o
f P
erio
d
(000
’s)
rat
io o
f N
et
exp
ense
s to
A
vera
ge
Net
A
sset
s(b
)
rat
io o
f e
xpen
ses
to A
vera
ge
Net
Ass
ets
(exc
lud
ing
Fe
es P
aid
In
dir
ectl
y)(b
)
rat
io o
f N
et
Inve
stm
ent
Inco
me
to
Ave
rag
e N
et
Ass
ets(
b)
rat
ios
of
exp
ense
s to
Ave
rag
e N
et A
sset
s (e
xclu
din
g
Fee
red
uct
ion
s)
(b)
CL
AS
S A
SH
Ar
eS
Year
End
ed O
ctob
er 3
1, 2
008
$1.0
00.
03—
(c)
0.03
(0.0
3)—
(0.0
3)$1
.00
2.71
%(d
)$
308,
499
0.67
%0.
67%
2.73
%0.
67%
Year
End
ed O
ctob
er 3
1, 2
009
1.00
—(c
)—
(c)
—(c
)—
(c)
——
(c)
1.00
0.32
%(e
)34
3,26
50.
55%
0.55
%(e
)0.
31%
(e)
0.69
%(e
)Ye
ar E
nded
Oct
ober
31,
201
01.
00—
(c)(f
)—
(c)
—(c
)—
(c)
——
(c)
1.00
0.01
%(g
)32
,943
0.29
%0.
29%
0.01
%(g
)0.
67%
Year
End
ed O
ctob
er 3
1, 2
011
1.00
—(c
)(f)
—(c
)—
(c)
—(c
)—
—(c
)1.
000.
01%
27,7
630.
26%
0.26
%0.
01%
0.68
%Ye
ar E
nded
Oct
ober
31,
201
21.
00—
(c)
—(c
)—
(c)
—(c
)—
—(c
)1.
000.
01%
33,5
460.
30%
0.30
%0.
01%
0.69
%S
ix M
onth
s E
nded
A
pril
30, 2
013
(Una
udite
d)
1.00
—(c
)—
(c)
—(c
)—
(c)
—(c
)—
(c)
1.00
0.01
%41
,352
0.26
%0.
26%
0.01
%0.
68%
CL
AS
S B
SH
Ar
eS
Year
End
ed O
ctob
er 3
1, 2
008
$1.0
00.
02—
(c)
0.02
(0.0
2)—
(0.0
2)$1
.00
2.10
%(d
)$
199
1.27
%1.
27%
2.08
%1.
27%
Year
End
ed O
ctob
er 3
1, 2
009
1.00
—(c
)—
(c)
—(c
)—
——
1.00
0.17
%(e
)31
20.
68%
0.68
%(e
)0.
13%
(e)
1.30
%(e
)Ye
ar E
nded
Oct
ober
31,
201
01.
00—
(c)(f
)—
(c)
—(c
)—
(c)
——
(c)
1.00
0.01
%(g
)22
60.
29%
0.29
%0.
01%
(g)
1.27
%Ye
ar E
nded
Oct
ober
31,
201
11.
00—
(c)(f
)—
(c)
—(c
)—
(c)
——
(c)
1.00
0.01
%13
20.
26%
0.26
%0.
01%
1.28
%Ye
ar E
nded
Oct
ober
31,
201
21.
00—
(c)
—(c
)—
(c)
—(c
)—
—(c
)1.
000.
01%
410.
29%
0.29
%0.
01%
1.29
%S
ix M
onth
s E
nded
A
pril
30, 2
013
(Una
udite
d)
1.00
—(c
)—
(c)
—(c
)—
(c)
—(c
)—
(c)
1.00
0.01
%33
0.26
%0.
26%
0.01
%1.
27%
CL
AS
S C
SH
Ar
eS
Year
End
ed O
ctob
er 3
1, 2
008
$1.0
00.
02—
(c)
0.02
(0.0
2)—
(0.0
2)$1
.00
2.10
%(d
)$
316,
779
1.27
%1.
27%
2.04
%1.
27%
Year
End
ed O
ctob
er 3
1, 2
009
1.00
—(c
)—
(c)
—(c
)—
(c)
——
(c)
1.00
0.17
%(e
)25
9,36
40.
74%
0.74
%(e
)0.
19%
(e)
1.29
%(e
)Ye
ar E
nded
Oct
ober
31,
201
01.
00—
(c)(f
)—
(c)
—(c
)—
(c)
——
(c)
1.00
0.01
%(g
)44
0.29
%0.
29%
0.01
%(g
)1.
27%
Year
End
ed O
ctob
er 3
1, 2
011
1.00
—(c
)(f)
—(c
)—
(c)
—(c
)—
—(c
)1.
000.
01%
60.
25%
0.25
%0.
01%
1.28
%Ye
ar E
nded
Oct
ober
31,
201
21.
00—
(c)
—(c
)—
(c)
—(c
)—
—(c
)1.
000.
06%
60.
25%
0.25
%0.
06%
1.29
%S
ix M
onth
s E
nded
A
pril
30, 2
013
(Una
udite
d)
1.00
—(c
)—
(c)
—(c
)—
(c)
—(c
)—
(c)
1.00
0.01
%—
(h)
0.24
%0.
24%
0.07
%1.
32%
CL
AS
S D
SH
Ar
eS
Year
End
ed O
ctob
er 3
1, 2
008
$1.0
00.
03—
(c)
0.03
(0.0
3)—
(0.0
3)$1
.00
2.86
%(d
)$
2,72
0,59
20.
52%
0.52
%2.
89%
0.52
%Ye
ar E
nded
Oct
ober
31,
20
091.
00—
(c)
—(c
)—
(c)
—(c
)—
—(c
)1.
000.
40%
(e)
1,99
4,44
80.
49%
0.49
%(e
)0.
42%
(e)
0.54
%(e
)Ye
ar E
nded
Oct
ober
31,
201
01.
00—
(c)(f
)—
(c)
—(c
)—
(c)
——
(c)
1.00
0.01
%(g
)1,
695,
222
0.29
%0.
29%
0.01
%(g
)0.
52%
Year
End
ed O
ctob
er 3
1, 2
011
1.00
—(c
)(f)
—(c
)—
(c)
—(c
)—
—(c
)1.
000.
01%
1,59
1,61
40.
26%
0.26
%0.
01%
0.53
%Ye
ar E
nded
Oct
ober
31,
201
21.
00—
(c)
—(c
)—
(c)
—(c
)—
—(c
)1.
000.
01%
1,30
3,82
70.
30%
0.30
%0.
01%
0.54
%S
ix M
onth
s E
nded
A
pril
30, 2
013
(Una
udite
d)
1.00
—(c
)—
(c)
—(c
)—
(c)
—(c
)—
(c)
1.00
0.01
%1,
267,
254
0.26
%0.
26%
0.01
%0.
53%
JOB TITLE HSBC Money Market SAR REVISION 9 SERIAL <12345678> DATE Friday, June 28, 2013 JOB NUMBER 251995 TYPE PAGE NO. 23 OPERATOR PM3
24 HSBC FAMILY OF FUNDS See notes to financial statements.
HS
BC
Pr
IMe
MO
Ne
Y M
Ar
ke
t F
UN
D
Inve
stm
ent
Act
ivit
ies
Div
iden
ds
rat
ios/
Su
pp
lem
enta
ry D
ata
Net
Ass
et
Val
ue,
B
egin
nin
g
of
Per
iod
Net
In
vest
men
t In
com
e (L
oss
)
Net
r
eali
zed
an
d
Un
real
ized
G
ain
s (L
oss
es)
fro
m
Inve
stm
ents
tota
l fro
m
Inve
stm
ent
Act
ivit
ies
Net
In
vest
men
t In
com
e
Net
r
eali
zed
G
ain
s fr
om
In
vest
men
t tr
ansa
ctio
ns
tota
l D
ivid
end
s
Net
A
sset
V
alu
e,
en
d o
f P
erio
dto
tal
ret
urn
(a)
Net
Ass
ets
at
en
d o
f P
erio
d
(000
’s)
rat
io o
f N
et
exp
ense
s to
A
vera
ge
Net
A
sset
s(b
)
rat
io o
f e
xpen
ses
to A
vera
ge
Net
Ass
ets
(exc
lud
ing
Fe
es P
aid
In
dir
ectl
y)(b
)
rat
io o
f N
et
Inve
stm
ent
Inco
me
to
Ave
rag
e N
et
Ass
ets(
b)
rat
ios
of
exp
ense
s to
Ave
rag
e N
et A
sset
s (e
xclu
din
g
Fee
red
uct
ion
s)
(b)
CL
AS
S I
SH
Ar
eS
Year
End
ed O
ctob
er 3
1, 2
008
$1.0
00.
03—
(c)
0.03
(0.0
3)—
(0.0
3)$1
.00
3.23
%(d
)$
2,95
4,25
30.
16%
0.16
%3.
14%
0.17
%Ye
ar E
nded
Oct
ober
31,
20
091.
000.
01—
(c)
0.01
(0.0
1)—
(0.0
1)1.
000.
69%
(e)
7,18
9,61
30.
18%
0.18
%(e
)0.
55%
(e)
0.19
%(e
)Ye
ar E
nded
Oct
ober
31,
201
01.
00—
(c)(f
)—
(c)
—(c
)—
(c)
——
(c)
1.00
0.14
%(g
)4,
679,
632
0.17
%0.
17%
0.14
%(g
)0.
17%
Year
End
ed O
ctob
er 3
1, 2
011
1.00
—(c
)(f)
—(c
)—
(c)
—(c
)—
—(c
)1.
000.
10%
4,30
9,34
60.
17%
0.17
%0.
10%
0.18
%Ye
ar E
nded
Oct
ober
31,
201
21.
00—
(c)
—(c
)—
(c)
—(c
)—
—(c
)1.
000.
14%
3,02
5,68
80.
17%
0.17
%0.
14%
0.19
%S
ix M
onth
s E
nded
A
pril
30, 2
013
(Una
udite
d)
1.00
—(c
)—
(c)
—(c
)—
(c)
—(c
)—
(c)
1.00
0.05
%2,
948,
531
0.17
%0.
17%
0.10
%0.
18%
CLA
SS
Y S
HA
re
SYe
ar E
nded
Oct
ober
31,
20
08$1
.00
0.03
—(c
)0.
03(0
.03)
—(0
.03)
$1.0
03.
12%
(d)
$ 2,
236,
927
0.27
%0.
27%
2.96
%0.
27%
Year
End
ed O
ctob
er 3
1, 2
009
1.00
0.01
—(c
)0.
01(0
.01)
—(0
.01)
1.00
0.58
%(e
)1,
194,
680
0.29
%0.
29%
(e)
0.68
%(e
)0.
29%
(e)
Year
End
ed O
ctob
er 3
1, 2
010
1.00
—(c
)(f)
—(c
)—
(c)
—(c
)—
—(c
)1.
000.
05%
(g)
1,10
7,57
10.
26%
0.26
%0.
04%
(g)
0.27
%Ye
ar E
nded
Oct
ober
31,
201
11.
00—
(c)(f
)—
(c)
—(c
)—
(c)
——
(c)
1.00
0.01
%64
2,29
00.
26%
0.26
%0.
02%
0.28
%Ye
ar E
nded
Oct
ober
31,
201
21.
00—
(c)
—(c
)—
(c)
—(c
)—
—(c
)1.
000.
03%
617,
308
0.28
%0.
28%
0.03
%0.
29%
Six
Mon
ths
End
ed
Apr
il 30
, 201
3 (U
naud
ited
)1.
00—
(c)
—(c
)—
(c)
—(c
)—
(c)
—(c
)1.
000.
01%
622,
068
0.26
%0.
26%
0.01
%0.
28%
(a) N
ot a
nnua
lized
for
per
iods
less
tha
n on
e ye
ar. T
otal
ret
urn
calc
ulat
ions
do
not
incl
ude
any
rede
mpt
ion
char
ges.
(b) A
nnua
lized
for
per
iods
less
tha
n on
e ye
ar.
(c) R
epre
sent
s le
ss t
han
$0.
005
or
$(0
.005
).(d
) Dur
ing
the
year
end
ed O
ctob
er 3
1, 2
008
, an
affil
iate
of
the
Fund
’s in
vest
men
t ad
vise
r pu
rcha
sed
cert
ain
defa
ulte
d se
curit
ies
at $
16, 7
46,3
82, i
n ex
cess
of
thei
r fa
ir va
lue
on t
he p
urch
ase
date
. Th
e co
rres
pond
ing
impa
ct o
f th
is e
xces
s am
ount
to
the
tota
l ret
urns
wer
e 0.
20%
, 0.2
0%, 0
.20%
, 0.2
0%, 0
.20%
and
0.2
0% f
or C
lass
A S
hare
s, C
lass
B S
hare
s, C
lass
C S
hare
s, C
lass
D
Sha
res,
Cla
ss I
Sha
res
and
Cla
ss Y
Sha
res,
res
pect
ivel
y.(e
) Inc
lude
d in
the
rat
ios
is t
he T
reas
ury
Gua
rant
ee P
rogr
am fe
es in
curr
ed b
y th
e Fu
nd d
urin
g th
e pe
riod.
With
out
thes
e fe
es, t
he g
ross
and
net
exp
ense
rat
ios
wou
ld h
ave
been
dec
reas
ed b
y 0.
03%
and
the
tot
al r
etur
n an
d ne
t in
vest
men
t in
com
e ra
tio w
ould
hav
e in
crea
sed
by 0
.03%
.(f
) C
alcu
late
d ba
sed
on a
vera
ge s
hare
s ou
tsta
ndin
g.(g
) Dur
ing
the
year
end
ed O
ctob
er 3
1, 2
010,
the
Fun
d re
ceiv
ed a
dis
trib
utio
n fr
om a
“fa
ir fu
nd”
esta
blis
hed
by t
he S
EC
in c
onne
ctio
n w
ith a
con
sent
ord
er a
gain
st B
ISY
S F
und
Ser
vice
s, In
c. (
See
N
ote
7 in
Not
es t
o Fi
nanc
ial S
tate
men
ts).
The
corr
espo
ndin
g im
pact
to
the
net
inco
me
ratio
and
the
tot
al r
etur
n w
as le
ss t
han
0.0
05%
.(h
) Les
s th
an $
500.
Fin
anci
al H
igh
ligh
ts (
con
tin
ued
)
JOB TITLE HSBC Money Market SAR REVISION 9 SERIAL <12345678> DATE Friday, June 28, 2013 JOB NUMBER 251995 TYPE PAGE NO. 24 OPERATOR PM3
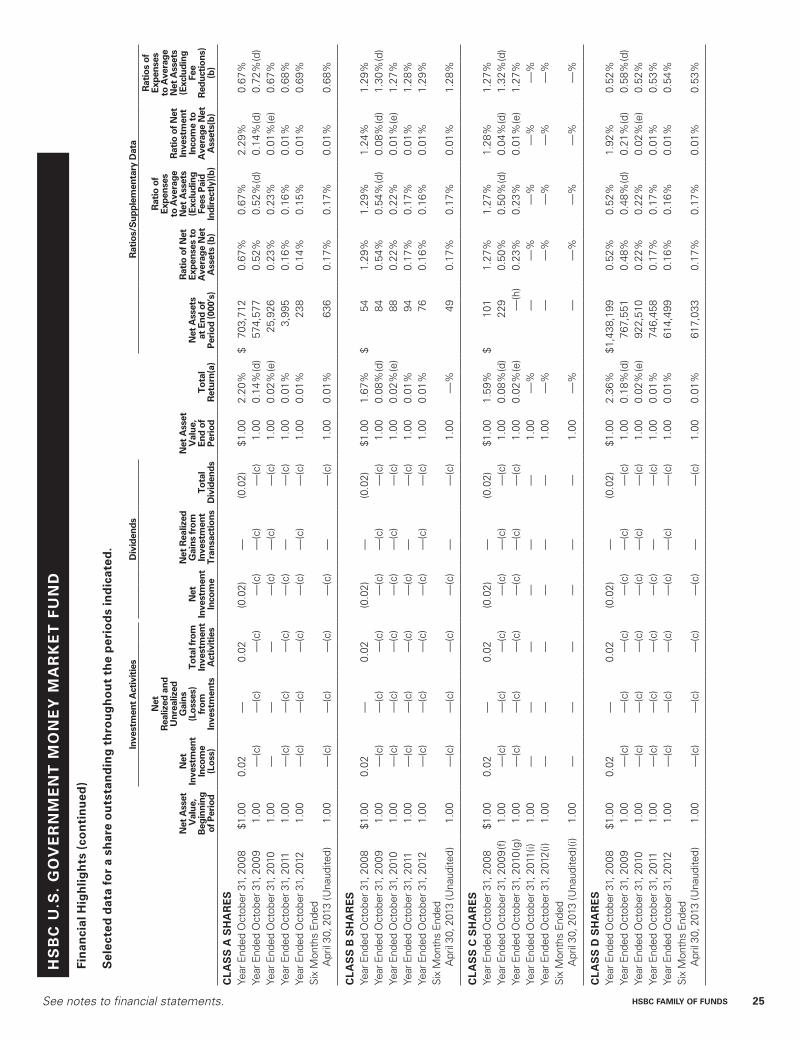
See notes to financial statements. HSBC FAMILY OF FUNDS 25
HS
BC
U.S
. G
OV
er
NM
eN
t M
ON
eY
MA
rk
et
FU
ND
Fin
anci
al H
igh
ligh
ts (
con
tin
ued
)
Sel
ecte
d d
ata
for
a sh
are
ou
tsta
nd
ing
th
rou
gh
ou
t th
e p
erio
ds
ind
icat
ed.
Inve
stm
ent
Act
ivit
ies
Div
iden
dsr
atio
s/S
uppl
emen
tary
Dat
a
Net
Ass
et
Val
ue,
Beg
inni
ng
of P
erio
d
Net
In
vest
men
t In
com
e (L
oss)
Net
r
ealiz
ed a
nd
Unr
ealiz
ed
Gai
ns
(Los
ses)
fr
om
Inve
stm
ents
tota
l fro
m
Inve
stm
ent
Act
ivit
ies
Net
In
vest
men
t In
com
e
Net
rea
lized
G
ains
from
In
vest
men
t tr
ansa
ctio
nsto
tal
Div
iden
ds
Net
Ass
et
Val
ue,
end
of
Peri
odto
tal
ret
urn(
a)
Net
Ass
ets
at e
nd o
f Pe
riod
(000
’s)
rat
io o
f Net
ex
pens
es t
o
Ave
rage
Net
A
sset
s (b
)
rat
io o
f ex
pens
es
to A
vera
ge
Net
Ass
ets
(exc
ludi
ng
Fees
Pai
d
Indi
rect
ly)(
b)
rat
io o
f Net
In
vest
men
t In
com
e to
A
vera
ge N
et
Ass
ets(
b)
rat
ios
of
expe
nses
to
Ave
rage
N
et A
sset
s (e
xclu
ding
Fe
e r
educ
tion
s)
(b)
CL
AS
S A
SH
Ar
eS
Year
End
ed O
ctob
er 3
1, 2
008
$1.0
00.
02—
0.02
(0.0
2)—
(0.0
2)$1
.00
2.20
%$
703,
712
0.67
%0.
67%
2.29
%0.
67%
Year
End
ed O
ctob
er 3
1, 2
009
1.00
—(c
)—
(c)
—(c
)—
(c)
—(c
)—
(c)
1.00
0.14
%(d
)57
4,57
70.
52%
0.52
%(d
)0.
14%
(d)
0.72
%(d
)Ye
ar E
nded
Oct
ober
31,
201
01.
00—
——
—(c
)—
(c)
—(c
)1.
000.
02%
(e)
25,9
260.
23%
0.23
%0.
01%
(e)
0.67
%Ye
ar E
nded
Oct
ober
31,
201
11.
00—
(c)
—(c
)—
(c)
—(c
)—
—(c
)1.
000.
01%
3,99
50.
16%
0.16
%0.
01%
0.68
%Ye
ar E
nded
Oct
ober
31,
201
21.
00—
(c)
—(c
)—
(c)
—(c
)—
(c)
—(c
)1.
000.
01%
238
0.14
%0.
15%
0.01
%0.
69%
Six
Mon
ths
Ende
d
Apr
il 30
, 201
3 (U
naud
ited)
1.00
—(c
)—
(c)
—(c
)—
(c)
——
(c)
1.00
0.01
%63
60.
17%
0.17
%0.
01%
0.68
%
CL
AS
S B
SH
Ar
eS
Year
End
ed O
ctob
er 3
1, 2
008
$1.0
00.
02—
0.02
(0.0
2)—
(0.0
2)$1
.00
1.67
%$
541.
29%
1.29
%1.
24%
1.29
%Ye
ar E
nded
Oct
ober
31,
200
91.
00—
(c)
—(c
)—
(c)
—(c
)—
(c)
—(c
)1.
000.
08%
(d)
840.
54%
0.54
%(d
)0.
08%
(d)
1.30
%(d
)Ye
ar E
nded
Oct
ober
31,
201
01.
00—
(c)
—(c
)—
(c)
—(c
)—
(c)
—(c
)1.
000.
02%
(e)
880.
22%
0.22
%0.
01%
(e)
1.27
%Ye
ar E
nded
Oct
ober
31,
201
11.
00—
(c)
—(c
)—
(c)
—(c
)—
—(c
)1.
000.
01%
940.
17%
0.17
%0.
01%
1.28
%Ye
ar E
nded
Oct
ober
31,
201
21.
00—
(c)
—(c
)—
(c)
—(c
)—
(c)
—(c
)1.
000.
01%
760.
16%
0.16
%0.
01%
1.29
%Si
x M
onth
s En
ded
A
pril
30, 2
013
(Una
udite
d)1.
00—
(c)
—(c
)—
(c)
—(c
)—
—(c
)1.
00—
%49
0.17
%0.
17%
0.01
%1.
28%
CL
AS
S C
SH
Ar
eS
Year
End
ed O
ctob
er 3
1, 2
008
$1.0
00.
02—
0.02
(0.0
2)—
(0.0
2)$1
.00
1.59
%$
101
1.27
%1.
27%
1.28
%1.
27%
Year
End
ed O
ctob
er 3
1, 2
009
(f)
1.00
—(c
)—
(c)
—(c
)—
(c)
—(c
)—
(c)
1.00
0.08
%(d
)22
90.
50%
0.50
%(d
)0.
04%
(d)
1.32
%(d
)Ye
ar E
nded
Oct
ober
31,
201
0(g
)1.
00—
(c)
—(c
)—
(c)
—(c
)—
(c)
—(c
)1.
000.
02%
(e)
—(h
)0.
23%
0.23
%0.
01%
(e)
1.27
%Ye
ar E
nded
Oct
ober
31,
201
1(i)
1.00
——
——
——
1.00
—%
——
%—
%—
%—
%Ye
ar E
nded
Oct
ober
31,
201
2(i)
1.00
——
——
——
1.00
—%
——
%—
%—
%—
%Si
x M
onth
s En
ded
A
pril
30, 2
013
(Una
udite
d)(i)
1.00
——
——
——
1.00
—%
——
%—
%—
%—
%
CL
AS
S D
SH
Ar
eS
Year
End
ed O
ctob
er 3
1, 2
008
$1.0
00.
02—
0.02
(0.0
2)—
(0.0
2)$1
.00
2.36
%$ 1
,438
,199
0.52
%0.
52%
1.92
%0.
52%
Year
End
ed O
ctob
er 3
1, 2
009
1.00
—(c
)—
(c)
—(c
)—
(c)
—(c
)—
(c)
1.00
0.18
%(d
)76
7,55
10.
48%
0.48
%(d
)0.
21%
(d)
0.58
%(d
)Ye
ar E
nded
Oct
ober
31,
201
01.
00—
(c)
—(c
)—
(c)
—(c
)—
(c)
—(c
)1.
000.
02%
(e)
922,
510
0.22
%0.
22%
0.02
%(e
)0.
52%
Year
End
ed O
ctob
er 3
1, 2
011
1.00
—(c
)—
(c)
—(c
)—
(c)
——
(c)
1.00
0.01
%74
6,45
80.
17%
0.17
%0.
01%
0.53
%Ye
ar E
nded
Oct
ober
31,
201
21.
00—
(c)
—(c
)—
(c)
—(c
)—
(c)
—(c
)1.
000.
01%
614,
499
0.16
%0.
16%
0.01
%0.
54%
Six
Mon
ths
Ende
d
Apr
il 30
, 201
3 (U
naud
ited)
1.00
—(c
)—
(c)
—(c
)—
(c)
——
(c)
1.00
0.01
%61
7,03
30.
17%
0.17
%0.
01%
0.53
%
JOB TITLE HSBC Money Market SAR REVISION 9 SERIAL <12345678> DATE Friday, June 28, 2013 JOB NUMBER 251995 TYPE PAGE NO. 25 OPERATOR PM3
26 HSBC FAMILY OF FUNDS See notes to financial statements.
HS
BC
U.S
. G
OV
er
NM
eN
t M
ON
eY
MA
rk
et
FU
ND
Inve
stm
ent
Act
ivit
ies
Div
iden
dsr
atio
s/S
uppl
emen
tary
Dat
a
Net
Ass
et
Val
ue,
Beg
inni
ng
of P
erio
d
Net
In
vest
men
t In
com
e (L
oss)
Net
r
ealiz
ed a
nd
Unr
ealiz
ed
Gai
ns
(Los
ses)
fr
om
Inve
stm
ents
tota
l fro
m
Inve
stm
ent
Act
ivit
ies
Net
In
vest
men
t In
com
e
Net
rea
lized
G
ains
from
In
vest
men
t tr
ansa
ctio
nsto
tal
Div
iden
ds
Net
Ass
et
Val
ue,
end
of
Peri
odto
tal
ret
urn(
a)
Net
Ass
ets
at e
nd o
f Pe
riod
(000
’s)
rat
io o
f Net
ex
pens
es t
o
Ave
rage
Net
A
sset
s (b
)
rat
io o
f ex
pens
es
to A
vera
ge
Net
Ass
ets
(exc
ludi
ng
Fees
Pai
d
Indi
rect
ly)(
b)
rat
io o
f Net
In
vest
men
t In
com
e to
A
vera
ge N
et
Ass
ets(
b)
rat
ios
of
expe
nses
to
Ave
rage
N
et A
sset
s (e
xclu
ding
Fe
e r
educ
tion
s)
(b)
CL
AS
S I
SH
Ar
eS
Year
End
ed O
ctob
er 3
1, 2
008
$1.0
00.
03—
0.03
(0.0
3)—
(0.0
3)$1
.00
2.72
%$4
,908
,887
0.17
%0.
17%
2.23
%0.
18%
Year
End
ed O
ctob
er 3
1, 2
009
1.00
—(c
)—
(c)
—(c
)—
(c)
—(c
)—
(c)
1.00
0.43
%(d
)8,
176,
980
0.22
%0.
22%
(d)
0.38
%(d
)0.
22%
(d)
Year
End
ed O
ctob
er 3
1, 2
010
1.00
—(c
)—
(c)
—(c
)—
(c)
—(c
)—
(c)
1.00
0.08
%(e
)5,
100,
891
0.16
%0.
16%
0.07
%(e
)0.
17%
Year
End
ed O
ctob
er 3
1, 2
011
1.00
—(c
)—
(c)
—(c
)—
(c)
——
(c)
1.00
0.03
%1,
645,
764
0.16
%0.
16%
0.03
%0.
18%
Year
End
ed O
ctob
er 3
1, 2
012
1.00
—(c
)—
(c)
—(c
)—
(c)
—(c
)—
(c)
1.00
0.02
%1,
873,
166
0.16
%0.
16%
0.01
%0.
19%
Six
Mon
ths
Ende
d
Apr
il 30
, 201
3 (U
naud
ited)
1.00
—(c
)—
(c)
—(c
)—
(c)
——
(c)
1.00
0.01
% 1
,238
,970
0.16
%0.
16%
0.02
%0.
18%
CL
AS
S Y
SH
Ar
eS
Year
End
ed O
ctob
er 3
1, 2
008
$1.0
00.
03—
0.03
(0.0
3)—
(0.0
3)$1
.00
2.61
%$6
,747
,758
0.27
%0.
27%
2.53
%0.
27%
Year
End
ed O
ctob
er 3
1, 2
009
1.00
—(c
)—
(c)
—(c
)—
(c)
—(c
)—
(c)
1.00
0.32
%(d
)3,
370,
299
0.33
%0.
33%
(d)
0.38
%(d
)0.
33%
(d)
Year
End
ed O
ctob
er 3
1, 2
010
1.00
—(c
)—
(c)
—(c
)—
(c)
—(c
)—
(c)
1.00
0.02
%(e
)2,
918,
347
0.22
%0.
22%
0.02
%(e
)0.
27%
Year
End
ed O
ctob
er 3
1, 2
011
1.00
—(c
)—
(c)
—(c
)—
(c)
——
(c)
1.00
0.01
%1,
711,
397
0.17
%0.
17%
0.01
%0.
28%
Year
End
ed O
ctob
er 3
1, 2
012
1.00
—(c
)—
(c)
—(c
)—
(c)
—(c
)—
(c)
1.00
0.01
%2,
505,
448
0.17
%0.
17%
0.01
%0.
29%
Six
Mon
ths
Ende
d
Apr
il 30
, 201
3 (U
naud
ited)
1.00
—(c
)—
(c)
—(c
)—
(c)
——
(c)
1.00
0.01
% 2
,266
,775
0.17
%0.
17%
0.01
%0.
28%
(a) N
ot a
nnua
lized
for
per
iods
less
tha
n on
e ye
ar. T
otal
ret
urn
calc
ulat
ions
do
not
incl
ude
any
rede
mpt
ion
char
ges.
(b) A
nnua
lized
for
per
iods
less
tha
n on
e ye
ar.
(c) R
epre
sent
s le
ss t
han
$0.
005
or
$(0
.005
).(d
) Inc
lude
d in
the
rat
ios
is t
he T
reas
ury
Gua
rant
ee P
rogr
am fe
es in
curr
ed b
y th
e Fu
nd d
urin
g th
e pe
riod.
With
out
thes
e fe
es, t
he g
ross
and
net
exp
ense
rat
ios
wou
ld h
ave
been
dec
reas
ed b
y 0.
06%
an
d th
e to
tal r
etur
n an
d ne
t in
vest
men
t in
com
e ra
tio w
ould
hav
e in
crea
sed
by 0
.06%
.(e
)Dur
ing
the
year
end
ed O
ctob
er 3
1, 2
010,
the
Fun
d re
ceiv
ed a
dis
trib
utio
n fr
om a
“fa
ir fu
nd”
esta
blis
hed
by t
he S
EC
in c
onne
ctio
n w
ith a
con
sent
ord
er a
gain
st B
ISY
S F
und
Ser
vice
s, In
c. (
See
N
ote
7 in
Not
es t
o Fi
nanc
ial S
tate
men
ts).
The
corr
espo
ndin
g im
pact
to
the
net
inco
me
ratio
and
the
tot
al r
etur
n w
as le
ss t
han
0.0
05%
.(f
) C
lass
C S
hare
s w
ere
oper
atio
nal d
urin
g a
port
ion
of t
he y
ear
only
. Am
ount
s re
flect
per
form
ance
for
the
per
iod
of t
ime
the
clas
s ha
d op
erat
ions
, whi
ch w
as 3
62 d
ays
durin
g th
e pe
riod.
(g) C
lass
C S
hare
s w
ere
oper
atio
nal d
urin
g a
port
ion
of t
he y
ear
only
. Am
ount
s re
flect
per
form
ance
for
the
per
iod
of t
ime
the
clas
s ha
d op
erat
ions
, whi
ch w
as 3
51 d
ays
durin
g th
e pe
riod.
(h) L
ess
than
$50
0.(i)
Dur
ing
the
perio
d th
e cl
ass
had
no o
pera
tions
. The
net
ass
et v
alue
s re
flect
ed r
epre
sent
the
last
day
the
cla
ss h
ad s
hare
hold
ers.
Fin
anci
al H
igh
ligh
ts (
con
tin
ued
)
JOB TITLE HSBC Money Market SAR REVISION 9 SERIAL <12345678> DATE Friday, June 28, 2013 JOB NUMBER 251995 TYPE PAGE NO. 26 OPERATOR PM3
See notes to financial statements. HSBC FAMILY OF FUNDS 27
HS
BC
U.S
. t
re
AS
Ur
Y M
ON
eY
MA
rk
et
FU
ND
Fin
anci
al H
igh
ligh
ts (
con
tin
ued
)
Sel
ecte
d d
ata
for
a sh
are
ou
tsta
nd
ing
th
rou
gh
ou
t th
e p
erio
ds
ind
icat
ed.
Inve
stm
ent
Act
ivit
ies
Div
iden
ds
rat
ios/
Su
pp
lem
enta
ry D
ata
Net
Ass
et
Val
ue,
B
egin
nin
g
of
Per
iod
Net
In
vest
men
t In
com
e (
Loss
)
Net
r
ealiz
ed a
nd
U
nre
aliz
ed
Gai
ns
(Lo
sses
) fr
om
In
vest
men
ts
tota
l fro
m
Inve
stm
ent
Act
ivit
ies
Net
In
vest
men
t In
com
e
Net
rea
lize
d
Gai
ns
fro
m
Inve
stm
ent
tran
sact
ion
sto
tal
Div
iden
ds
Net
Ass
et
Val
ue,
e
nd
of
Per
iod
tota
l r
etu
rn(a
)
Net
Ass
ets
at e
nd
of
Per
iod
(00
0’s)
rat
io o
f N
et
exp
ense
s to
A
vera
ge
Net
A
sset
s(b
)
rat
io o
f e
xpen
ses
to
Ave
rag
e N
et
Ass
ets
(exc
lud
ing
Fe
es P
aid
In
dir
ectl
y)(b
)
rat
io o
f Net
In
vest
men
t In
com
e to
A
vera
ge
Net
A
sset
s(b
)
rat
ios
of
exp
ense
s to
Ave
rag
e N
et A
sset
s (e
xclu
din
g
Fee
red
uct
ion
s)
(b)
CL
AS
S A
SH
Ar
eS
Year
End
ed O
ctob
er 3
1, 2
008
$1.0
00.
01—
0.01
(0.0
1)—
(0.0
1)$1
.00
1.38
%$
580,
458
0.67
%0.
67%
1.06
%0.
67%
Year
End
ed O
ctob
er 3
1, 2
009
1.00
—(c
)—
(c)
— (c
)—
(c)
—(c
)—
(c)
1.00
0.07
%38
5,99
40.
24%
0.24
%0.
07%
0.66
%Ye
ar E
nded
Oct
ober
31,
201
01.
00—
(c)(d
)—
(c)
—(c
)—
(c)
——
(c)
1.00
0.01
%(e
)32
,973
0.14
%0.
14%
0.01
%(e
)0.
67%
Year
End
ed O
ctob
er 3
1, 2
011
1.00
—(c
)(d)
—(c
)—
(c)
—(c
)—
(c)
—(c
)1.
000.
01%
613
0.11
%0.
12%
0.01
%0.
68%
Year
End
ed O
ctob
er 3
1, 2
012
1.00
—(c
)—
(c)
—(c
)—
—(c
)—
(c)
1.00
—%
50.
05%
0.06
%—
%0.
70%
Six
Mon
ths
Ende
d
Apr
il 30
, 201
3 (U
naud
ited)
1.00
—(c
)—
(c)
—(c
)—
——
1.00
—%
50.
13%
0.13
%—
%0.
71%
CL
AS
S B
SH
Ar
eS
Year
End
ed O
ctob
er 3
1, 2
008
$1.0
00.
01—
0.01
(0.0
1)—
(0.0
1)$1
.00
0.86
%$
131
1.11
%1.
11%
1.01
%1.
28%
Year
End
ed O
ctob
er 3
1, 2
009
1.00
—(c
)—
(c)
—(c
)—
(c)
—(c
)—
(c)
1.00
0.07
%60
0.24
%0.
24%
0.07
%1.
26%
Year
End
ed O
ctob
er 3
1, 2
010
1.00
—(c
)(d)
—(c
)—
(c)
—(c
)—
—(c
)1.
000.
01%
(e)
500.
14%
0.14
%0.
01%
(e)
1.27
%Ye
ar E
nded
Oct
ober
31,
201
11.
00—
(c)(d
)—
(c)
—(c
)—
(c)
—(c
)—
(c)
1.00
0.01
%35
0.10
%0.
10%
0.01
%1.
28%
Year
End
ed O
ctob
er 3
1, 2
012
1.00
—(c
)—
(c)
—(c
)—
—(c
)—
(c)
1.00
—%
10.
06%
0.06
%—
%1.
29%
Six
Mon
ths
Ende
d
Apr
il 30
, 201
3 (U
naud
ited)
1.00
—(c
)—
(c)
—(c
)—
——
1.00
—%
10.
04%
0.04
%—
%1.
06%
CL
AS
S C
SH
Ar
eS
(f)
Year
End
ed O
ctob
er 3
1, 2
008
(f)
$1.0
0—
(c)
——
——
—$1
.00
0.01
%$
1,10
30.
64%
0.64
%0.
20%
1.26
%Ye
ar E
nded
Oct
ober
31,
200
91.
00—
(c)
—(c
)—
(c)
—(c
)—
(c)
—(c
)1.
000.
07%
7,13
80.
22%
0.22
%0.
04%
1.26
%Ye
ar E
nded
Oct
ober
31,
201
0(g
)1.
00—
(c)(d
)—
(c)
—(c
)—
(c)
——
(c)
1.00
0.01
%(e
)—
(h)
0.13
%0.
13%
—%
(e)
1.27
%Ye
ar E
nded
Oct
ober
31,
201
1(i)
1.00
—(d
)—
——
——
1.00
—%
——
%—
%—
%—
%Ye
ar E
nded
Oct
ober
31,
201
2(i)
1.00
——
——
——
1.00
—%
——
%—
%—
%—
%Si
x M
onth
s En
ded
A
pril
30, 2
013
(Una
udite
d)(i)
1.00
——
(c)
—(c
)—
(c)
——
1.00
—%
——
%—
%—
%—
%
CL
AS
S D
SH
Ar
eS
Year
End
ed O
ctob
er 3
1, 2
008
$1.0
00.
02—
0.02
(0.0
2)—
(0.0
2)$1
.00
1.53
%$
937,
905
0.52
%0.
52%
1.33
%0.
59%
Year
End
ed O
ctob
er 3
1, 2
009
1.00
—(c
)—
(c)
—(c
)—
(c)
—(c
)—
(c)
1.00
0.07
%95
5,65
20.
23%
0.23
%0.
06%
0.51
%Ye
ar E
nded
Oct
ober
31,
201
01.
00—
(c)(d
)—
(c)
—(c
)—
(c)
——
(c)
1.00
0.01
%(e
)72
6,24
40.
14%
0.14
%0.
01%
(e)
0.52
%Ye
ar E
nded
Oct
ober
31,
201
11.
00—
(c)(d
)—
(c)
—(c
)—
(c)
—(c
)—
(c)
1.00
0.01
%61
9,94
00.
10%
0.10
%0.
01%
0.53
%Ye
ar E
nded
Oct
ober
31,
201
21.
00—
(c)
—(c
)—
(c)
——
(c)
—(c
)1.
00—
%66
2,06
30.
08%
0.09
%—
%0.
54%
Six
Mon
ths
Ende
d
Apr
il 30
, 201
3 (U
naud
ited)
1.00
—(c
)—
(c)
—(c
)—
——
1.00
—%
558,
659
0.11
%0.
11%
—%
0.53
%
JOB TITLE HSBC Money Market SAR REVISION 9 SERIAL <12345678> DATE Friday, June 28, 2013 JOB NUMBER 251995 TYPE PAGE NO. 27 OPERATOR PM3
28 HSBC FAMILY OF FUNDS See notes to financial statements.
HS
BC
U.S
. t
re
AS
Ur
Y M
ON
eY
MA
rk
et
FU
ND
Inve
stm
ent
Act
ivit
ies
Div
iden
ds
rat
ios/
Su
pp
lem
enta
ry D
ata
Net
Ass
et
Val
ue,
B
egin
nin
g
of
Per
iod
Net
In
vest
men
t In
com
e (
Loss
)
Net
r
ealiz
ed a
nd
U
nre
aliz
ed
Gai
ns
(Lo
sses
) fr
om
In
vest
men
ts
tota
l fro
m
Inve
stm
ent
Act
ivit
ies
Net
In
vest
men
t In
com
e
Net
rea
lize
d
Gai
ns
fro
m
Inve
stm
ent
tran
sact
ion
sto
tal
Div
iden
ds
Net
Ass
et
Val
ue,
e
nd
of
Per
iod
tota
l r
etu
rn(a
)
Net
Ass
ets
at e
nd
of
Per
iod
(00
0’s)
rat
io o
f N
et
exp
ense
s to
A
vera
ge
Net
A
sset
s(b
)
rat
io o
f e
xpen
ses
to
Ave
rag
e N
et
Ass
ets
(exc
lud
ing
Fe
es P
aid
In
dir
ectl
y)(b
)
rat
io o
f Net
In
vest
men
t In
com
e to
A
vera
ge
Net
A
sset
s(b
)
rat
ios
of
exp
ense
s to
Ave
rag
e N
et A
sset
s (e
xclu
din
g
Fee
red
uct
ion
s)
(b)
CL
AS
S I
SH
Ar
eS
Year
End
ed O
ctob
er 3
1, 2
008
$1.0
00.
02—
0.02
(0.0
2)—
(0.0
2)$1
.00
1.90
%$3
,771
,262
0.16
%0.
16%
1.26
%0.
16%
Year
End
ed O
ctob
er 3
1, 2
009
1.00
—(c
)—
(c)
—(c
)—
(c)
—(c
)—
(c)
1.00
0.14
%3,
322,
962
0.16
%0.
16%
0.14
%0.
16%
Year
End
ed O
ctob
er 3
1, 2
010
1.00
—(c
)(d)
—(c
)—
(c)
—(c
)—
—(c
)1.
000.
01%
(e)
1,37
9,04
20.
13%
0.13
%0.
01%
(e)
0.17
%Ye
ar E
nded
Oct
ober
31,
201
11.
00—
(c)(d
)—
(c)
—(c
)—
(c)
—(c
)—
(c)
1.00
0.01
%98
2,97
40.
10%
0.10
%0.
01%
0.18
%Ye
ar E
nded
Oct
ober
31,
201
21.
00—
(c)
—(c
)—
(c)
——
(c)
—(c
)1.
00—
%55
5,28
70.
08%
0.08
%—
%0.
19%
Six
Mon
ths
Ende
d
Apr
il 30
, 201
3 (U
naud
ited)
1.00
—(c
)—
(c)
—(c
)—
——
1.00
—%
489,
813
0.11
%0.
11%
—%
0.18
%
CL
AS
S Y
SH
Ar
eS
Year
End
ed O
ctob
er 3
1, 2
008
$1.0
00.
02—
0.02
(0.0
2)—
(0.0
2)$1
.00
1.78
%$1
,364
,310
0.27
%0.
27%
1.34
%0.
27%
Year
End
ed O
ctob
er 3
1, 2
009
1.00
—(c
)—
(c)
—(c
)—
(c)
—(c
)—
(c)
1.00
0.08
%99
6,30
90.
22%
0.22
%0.
08%
0.26
%Ye
ar E
nded
Oct
ober
31,
201
01.
00—
(c)(d
)—
(c)
—(c
)—
(c)
——
(c)
1.00
0.01
%(e
)1,
147,
150
0.14
%0.
14%
0.01
%(e
)0.
27%
Year
End
ed O
ctob
er 3
1, 2
011
1.00
—(c
)(d)
—(c
)—
(c)
—(c
)—
(c)
—(c
)1.
000.
01%
999,
521
0.09
%0.
10%
0.01
%0.
28%
Year
End
ed O
ctob
er 3
1, 2
012
1.00
—(c
)—
(c)
—(c
)—
—(c
)—
(c)
1.00
—%
1,15
6,63
10.
09%
0.09
%—
%0.
29%
Six
Mon
ths
Ende
d
Apr
il 30
, 201
3 (U
naud
ited)
1.00
—(c
)—
(c)
—(c
)—
——
1.00
—%
1,42
4,54
70.
11%
0.11
%—
%0.
28%
(a) N
ot a
nnua
lized
for
per
iods
less
tha
n on
e ye
ar. T
otal
ret
urn
calc
ulat
ions
do
not
incl
ude
any
rede
mpt
ion
char
ges.
(b) A
nnua
lized
for
per
iods
less
tha
n on
e ye
ar.
(c) R
epre
sent
s le
ss t
han
$0.
005
or
$(0
.005
).(d
) Cal
cula
ted
base
d on
ave
rage
sha
res
outs
tand
ing.
(e) D
urin
g th
e ye
ar e
nded
Oct
ober
31,
201
0, t
he F
und
rece
ived
a d
istr
ibut
ion
from
a “
fair
fund
” es
tabl
ishe
d by
the
SE
C in
con
nect
ion
with
a c
onse
nt o
rder
aga
inst
BIS
YS
Fun
d S
ervi
ces,
Inc.
(S
ee N
ote
7 in
Not
es t
o Fi
nanc
ial S
tate
men
ts).
The
corr
espo
ndin
g im
pact
to
the
net
inco
me
ratio
and
the
tot
al r
etur
n w
as le
ss t
han
0.0
05%
.(f
) C
lass
C S
hare
s w
ere
oper
atio
nal d
urin
g a
port
ion
of t
he y
ear
only
. Am
ount
s re
flect
per
form
ance
for
the
per
iod
of t
ime
the
clas
s ha
d op
erat
ions
, whi
ch w
as 2
6 da
ys d
urin
g th
e pe
riod.
(g) C
lass
C S
hare
s w
ere
oper
atio
nal d
urin
g a
port
ion
of t
he y
ear
only
. Am
ount
s re
flect
per
form
ance
for
the
per
iod
of t
ime
the
clas
s ha
d op
erat
ions
, whi
ch w
as 3
51 d
ays
durin
g th
e pe
riod.
(h) L
ess
than
$50
0.(i)
Dur
ing
the
perio
d th
e cl
ass
had
no o
pera
tions
. The
net
ass
et v
alue
s re
flect
ed r
epre
sent
the
last
day
the
cla
ss h
ad s
hare
hold
ers.
Fin
anci
al H
igh
ligh
ts (
con
tin
ued
)
JOB TITLE HSBC Money Market SAR REVISION 9 SERIAL <12345678> DATE Friday, June 28, 2013 JOB NUMBER 251995 TYPE PAGE NO. 28 OPERATOR PM3
HSBC FAMILY OF FUNDS 29
HSBC FAM ILY OF FUNDS
Notes to Financial Statements—as of April 30, 2013 (Unaudited)
1. Organization:
The HSBC Funds (the “Trust’’), a Massachusetts business trust organized on April 22, 1987, is registered under the Investment Company Act of 1940, as amended (the “Act’’), as an open-end management investment company. As of April 30, 2013, the Trust is comprised of 15 separate operational funds, each a series of the HSBC Family of Funds, which also includes the HSBC Advisor Funds Trust and the HSBC Portfolios (the “Trusts’’). The accompanying financial statements are presented for the following 3 funds (individually a “Fund,’’ collectively the “Funds’’):
Fund Short Name
HSBC Prime Money Market Fund Prime Money Market Fund
HSBC U.S. Government Money Market Fund U.S. Government Money Market Fund
HSBC U.S. Treasury Money Market Fund U.S. Treasury Money Market Fund
All the Funds are diversified funds. Financial statements for all other funds of the Trusts are published separately.
The Funds are authorized to issue an unlimited number of shares of beneficial interest with a par value of $ 0.001 per share. The Funds are authorized to issue seven classes of shares: Class A Shares, Class B Shares, Class C Shares, Class D Shares, Class E Shares, Class I Shares and Class Y Shares. The Class B Shares of the Funds are offered without any front-end sales charge but will be subject to a contingent deferred sales charge (“CDSC’’) ranging from a maximum of 4.00% if redeemed less than one year after purchase to 0.00% if redeemed more than four years after purchase. Class C Shares of the Funds are offered without any front-end sales charge but will be subject to a maximum CDSC of 1.00% if redeemed less than one year after purchase. No sales charges are assessed with respect to Class A, Class D, Class E, Class I or Class Y Shares of the Funds. Each class of shares in each Fund has identical rights and privileges, except with respect to arrangements pertaining to shareholder servicing and/or distribution, class-related expenses, voting rights on matters affecting a single class of shares, and exchange privileges. As of April 30, 2013, Class E Shares were not operational.
Under the Trust’s organizational documents, the Funds’ officers and Trustees are indemnified against certain liabilities arising out of the performance of their duties to the Funds. In addition, in the normal course of business, the Trust may enter into contracts with its service providers, which also provide for indemnifications by the Funds. The Funds’ maximum exposure under these arrangements is unknown as this would involve future claims that may be made against the Funds. However, based on experience, the Trust expects that risk of loss to be remote.
2. Significant Accounting Policies:
The following is a summary of the significant accounting policies followed by the Funds in the preparation of their financial statements. The policies are in conformity with U.S. generally accepted accounting principles (“GAAP’’). The preparation of financial statements requires management to make certain estimates and assumptions that affect the reported amounts of assets and liabilities and disclosure of contingent assets and liabilities at the date of the financial statements and the reported amounts of increases and decreases in net assets from operations during the reporting period. Actual results could differ from those estimates.
Securities Valuation:
Investments of the Funds are valued using the amortized cost method pursuant to Rule 2a-7 under the Act, which approximates fair value. Fair value is defined as the price that would be received to sell an asset or paid to transfer a liability in an orderly transaction between market participants at the measurement date. The valuation techniques used to determine fair value are further described below.
JOB TITLE HSBC Money Market SAR REVISION 9 SERIAL <12345678> DATE Thursday, June 27, 2013 JOB NUMBER 251995 TYPE PAGE NO. 29 OPERATOR PM4
30 HSBC FAMILY OF FUNDS
HSBC FAM ILY OF FUNDS
Notes to Financial Statements—as of April 30, 2013 (Unaudited) (continued)
Investment Transactions and Related Income:
Investment transactions are accounted for not later than on the business day after trade date. However, for financial reporting purposes, investment transactions are accounted for on trade date. Investment gains and losses are calculated on the identified cost basis. Interest income is recognized on the accrual basis and includes, where applicable, the amortization or accretion of premium or discount. Dividend income is recorded on the ex-dividend date.
Restricted and Illiquid Securities:
A restricted security is a security which has been purchased through a private offering and cannot be resold to the general public without prior registration under the Securities Act of 1933 (the “1933 Act’’) or pursuant to the resale limitations provided by Rule 144 under the 1933 Act, or another exemption from the registration requirements of the 1933 Act. Certain restricted securities may be resold in transactions exempt from registration, normally to qualified institutional buyers, and may be deemed liquid by the Investment Adviser (as defined in Note 4) based on procedures established by the Board of Trustees (the “Board’’). Therefore, not all restricted securities are considered illiquid. At April 30, 2013, the Funds did not hold any restricted securities that were deemed illiquid.
Repurchase Agreements:
The Funds (except U.S. Treasury Money Market Fund) may enter into repurchase agreements with an entity which is a member of the Federal Reserve System or which is a “primary dealer’’ (as designated by the Federal Reserve Bank of New York) in U.S. government obligations. The U.S. Treasury Money Market Fund may temporarily invest in repurchase agreements collaterized by U.S. Treasury Obligations. The repurchase price generally equals the price paid by a Fund plus interest negotiated on the basis of current short-term rates, which may be more or less than the rate on the underlying portfolio securities. The seller, under a repurchase agreement, is required to maintain the collateral held pursuant to the agreement, with a fair value equal to or greater than the repurchase price (including accrued interest). Collateral subject to repurchase agreements is held by the Funds’ custodian or another qualified custodian or in the Federal Reserve/Treasury book-entry system. In the event of counterparty default, the Fund has the right to use the collateral to offset losses incurred. There is potential for loss to a Fund in the event the Fund is delayed or prevented from exercising its rights to dispose of the collateral securities, including the risk of a possible decline in the fair value of the underlying securities during the period while the Fund seeks to assert its rights.
Allocations:
Expenses directly attributable to a Fund are charged to that Fund. Expenses not directly attributable to a Fund are allocated proportionately among the applicable series within the Trusts in relation to the net assets of each fund or on another reasonable basis. Class specific expenses are charged directly to the class incurring the expense. In addition, income, expenses (other than class specific expenses), and unrealized and realized gains and losses are allocated to each class based on relative net assets on a daily basis.
Dividends to Shareholders:
Dividends to shareholders from net investment income, if any, are declared daily and paid monthly from each Fund. Dividends from net realized gains, if any, are declared and paid at least annually by the Funds. Additional distributions are also made to the Funds’ shareholders to the extent necessary to avoid the federal excise tax on certain undistributed income and net realized gains of regulated investment companies.
The character of net investment income and net realized gains distributed are determined in accordance with federal income tax regulations, which may differ from GAAP. These “book/tax’’ differences are either considered temporary or permanent in nature. To the extent these differences are permanent in nature (e.g., reclassification of market discounts, certain gain/loss, paydowns, and distributions), such amounts are reclassified within the composition of net assets based on their federal tax-basis treatment; temporary differences (e.g., wash losses and post-October loss deferrals) do not require reclassification. To the extent distributions to shareholders from net investment income and net realized gains exceed net investment income and net realized gains for tax purposes, they are reported as distributions of capital.
JOB TITLE HSBC Money Market SAR REVISION 9 SERIAL <12345678> DATE Thursday, June 27, 2013 JOB NUMBER 251995 TYPE PAGE NO. 30 OPERATOR PM4
HSBC FAMILY OF FUNDS 31
HSBC FAM ILY OF FUNDS
Notes to Financial Statements—as of April 30, 2013 (Unaudited) (continued)
Federal Income Taxes:
Each Fund is a separate taxable entity for federal income tax purposes. Each Fund has qualified and intends to continue to qualify each year as a “regulated investment company’’ under Subchapter M of the Internal Revenue Code, as amended, and to distribute substantially all of its taxable net investment income and net realized gains, if any, to its shareholders. Accordingly, no provision for federal income or excise tax is required.
Management of the Funds has reviewed tax positions taken in tax years that remain subject to examination by all major tax jurisdictions, including federal (i.e., the last four tax year ends and the interim tax period since then, as applicable). Management believes that there is no tax liability resulting from unrecognized tax benefits related to uncertain tax positions taken.
3. Investment Valuation Summary:
The valuation techniques employed by the Funds, as described below, maximize the use of observable inputs and minimize the use of unobservable inputs in determining fair value. The inputs used for valuing the Funds’ investments are summarized in the three broad levels listed below:
• Level3:significantunobservable inputs(includingaFund’sownassumptions indeterminingthefairvalue of investments)
Changes in valuation techniques may result in transfers in or out of an assigned level within the disclosure hierarchy. The Funds determine transfers between fair value hierarchy levels at the reporting period end. The inputs or methodology used for valuing investments is not necessarily an indication of the risk associated with investing in those investments.
Investments of the Funds are valued using the amortized cost method pursuant to Rule 2a-7 under the Act,whichapproximates fair valueandare typically categorizedasLevel2 in the fair valuehierarchy.Theamortized cost method involves valuing an instrument at its cost initially and thereafter assuming a constant amortization to maturity of any discounts or premium, regardless of the impact of fluctuating interest rates on the market value of the instrument. The amortized cost method may result in periods during which value, as determined by amortized cost, is higher or lower than the price a Fund holding the instrument would receive if it sold the instrument. The fair value of securities in the Funds can be expected to vary with changes in prevailing interest rates.
Investments in other money market funds are priced at net asset value as reported by such companies andaretypicallycategorizedasLevel1inthefairvaluehierarchy.
FortheperiodendedApril30,2013,therewerenoLevel3investmentsforwhichsignificantunobservableinputs were used to determine fair value.
JOB TITLE HSBC Money Market SAR REVISION 9 SERIAL <12345678> DATE Thursday, June 27, 2013 JOB NUMBER 251995 TYPE PAGE NO. 31 OPERATOR PM4
32 HSBC FAMILY OF FUNDS
HSBC FAM ILY OF FUNDS
Notes to Financial Statements—as of April 30, 2013 (Unaudited) (continued)
The following is a summary of the valuation inputs used as of April 30, 2013 in valuing the Funds’ investments based upon the three levels defined above:
(a) For detailed investment categorizations, see the accompanying Schedules of Portfolio Investments.
New Accounting Pronouncements:
In January 2013, the Financial Accounting Standards Board issued Accounting Standards Update (“ASU”) No.2013-01“Clarifying theScopeofDisclosuresaboutOffsettingAssetsandLiabilities (“ASU2013-01”)which amended Accounting Standards Codification Subtopic 210-20, Balance Sheet Offsetting. ASU 2013-01 clarifiedthescopeofASUNo.2011-11“DisclosuresaboutOffsettingAssetsandLiabilities”(“ASU2011-11”).ASU 2011-11 requires an entity to disclose information about offsetting and related arrangements to enable users of the financial statements to understand the effect of those arrangements on the entity’s financial position. ASU 2013-01 clarifies the scope of ASU 2011-11 as applying to derivatives accounted for in accordance with Topic 815, Derivatives and Hedging, including bifurcated embedded derivatives, repurchase agreements and reverse repurchase agreements, and securities borrowing and securities lending transactions that are offset either in accordance with other requirements of U.S. GAAP or subject to an enforceable master netting arrangement or similar agreement. The guidance in ASU 2013-01 and ASU 2011-11 is effective for interim and annual periods beginning on or after January 1, 2013. Management is evaluating any impact ASU 2013-01 and ASU 2011-11 may have on the Funds’ financial statements.
JOB TITLE HSBC Money Market SAR REVISION 9 SERIAL <12345678> DATE Thursday, June 27, 2013 JOB NUMBER 251995 TYPE PAGE NO. 32 OPERATOR PM4
HSBC FAMILY OF FUNDS 33
HSBC FAM ILY OF FUNDS
Notes to Financial Statements—as of April 30, 2013 (Unaudited) (continued)
4. Related Party Transactions and Other Agreements and Plans:
Investment Management:
HSBC Global Asset Management (USA) Inc. (“HSBC’’ or the “Investment Adviser’’), a wholly owned subsidiary of HSBC Bank USA, N.A., a national bank organized under the laws of the United States, acts as Investment Adviser to the Funds. As Investment Adviser, HSBC manages the investments of the Funds and continuously reviews, supervises and administers the Funds’ investments pursuant to an Investment Advisory Agreement. For its services as investment adviser, HSBC receives a fee from each Fund, accrued daily and paid monthly, based on the average daily net assets of each respective Fund, at an annual rate of 0.10%.
HSBC also provides operational support services to the Funds pursuant to an Operational Support Services Agreement. For its services in this capacity, HSBC receives a fee, accrued daily and paid monthly, based on the average daily net assets of Class A Shares, Class B Shares, Class C Shares, Class D Shares and Class Y Shares, at an annual rate of:
The Bank of New York Mellon (the “Servicer”) provides recordkeeping, reporting and processing services to the Prime Money Market Fund, U.S. Government Money Market Fund and U.S. Treasury Money Market Fund, Class I Shares. The Servicer is paid by the Investment Adviser from its profits and not by the Funds, for these services.
Administration:
HSBC also serves as Administrator to the Trusts. Under the terms of the Administration Agreement, HSBC received from the Trusts a fee, accrued daily and paid monthly, at an annual rate of:
The fee breakpoints are determined on the basis of the aggregate average daily net assets of the Trusts. The fee is allocated to each series based upon its proportionate share of the aggregate net assets of the Trusts, subject to certain allocations in cases where one fund invests some or all of its assets in another fund. An amount equal to 50% of the administration fees is deemed to be class specific.
Pursuant to a Sub-Administration Agreement with HSBC, Citi Fund Services Ohio, Inc. (“Citi’’), a wholly- owned subsidiary of Citigroup, Inc., serves as the Trusts’ Sub-Administrator, subject to the general supervision by the Board and HSBC. For these services, Citi is entitled to a fee, payable by HSBC, at an annual rate equivalent to the fee rates set forth above subject to certain reductions associated with services provided to new funds, minus 0.02% which is retained by HSBC. During the period ended April 30, 2013, Citi voluntarily reduced its sub-administration fees by $110,800.
Under a Compliance Services Agreement between the Trusts and Citi (the “CCO Agreement’’), Citi makes an employee available to serve as the Trusts’ Chief Compliance Officer (the “CCO’’). Under the CCO Agreement, Citi also provides infrastructure and support in implementing the written policies and procedures comprising the Trusts’ compliance program, including support services to the CCO. For the services provided under the CCO Agreement, the Trusts paid Citi $143,262 for the period ended April 30, 2013, plus reimbursement of certain out of pocket expenses. Expenses incurred by each Fund are reflected on the Statements of Operations as “Compliance Services.’’ Citi pays the salary and other compensation earned by individuals performing these services, as employees of Citi.
JOB TITLE HSBC Money Market SAR REVISION 9 SERIAL <12345678> DATE Thursday, June 27, 2013 JOB NUMBER 251995 TYPE PAGE NO. 33 OPERATOR PM4
34 HSBC FAMILY OF FUNDS
HSBC FAM ILY OF FUNDS
Notes to Financial Statements—as of April 30, 2013 (Unaudited) (continued)
Distribution Arrangements:
ForesideDistributionServices,L.P.(“Foreside’’),awholly-ownedsubsidiaryofForesideFinancialGroupLLC,servestheTrustasDistributor(the“Distributor’’).TheTrusthasadoptedanon-compensatoryDistributionPlan and Agreement (the “Distribution Plan’’) pursuant to Rule 12b-1 of the Act. The Distribution Plan provides for reimbursement of expenses incurred by the Distributor related to distribution and marketing, at a rate not to exceed 0.25%, 1.00%, 1.00% and 0.25% of the average daily net assets of Class A Shares (currently not being charged), Class B Shares (currently charging 0.75%), Class C Shares (currently charging 0.75%) and Class D Shares (currently not being charged) of the Funds, respectively. For the period ended April 30, 2013, Foreside, as Distributor, also received $126,262, $85,049 and $21,867 in commissions from sales of the Trusts, for Class A Shares, Class B Shares and Class C Shares, respectively, of which $0, $0 and $0 were reallocated to HSBC-affiliated brokers and dealers for Class A Shares, Class B Shares and Class C Shares, respectively. Expenses reduced during the period ended April 30, 2013 are reflected on the Statements of Operations as “Fees voluntarily reduced by Distributor.’’
Shareholder Servicing:
The Trust has adopted a Shareholder Services Plan, which provides for payments to shareholder servicing agents (which primarily consist of HSBC and its affiliates) for providing various shareholder services. For performing these services, the shareholder servicing agents receive a fee that is computed daily and paid monthly up to 0.60%, 0.25%, 0.25%, 0.25% and 0.10% of the average daily net assets of Class A Shares (currently charging 0.40%), Class B Shares, Class C Shares, Class D Shares and Class E Shares (expected to charge 0.05%) of the Funds, respectively. The fees paid to the Distributor pursuant to the Distribution Plan and to shareholder servicing agents pursuant to the Shareholder Services Plan may not exceed, in the aggregate, 0.85%, 1.00%, 1.00%, 0.50% and 0.10% annually of each Fund’s average daily net assets of Class A Shares, Class B Shares, Class C Shares, Class D Shares and Class E Shares, respectively. Expenses reduced during the period ended April 30, 2013 are reflected on the Statements of Operations as “Fees voluntarily reduced by Shareholder Servicing Agent.’’
Fund Accounting and Transfer Agency:
Citi provides fund accounting and transfer agency services for each Fund. As transfer agent, Citi receives a fee based on the number of funds and shareholder accounts, subject to certain minimums, reductions associated with services provided to new funds and reimbursement of certain expenses. As fund accountant, Citi receives an annual fee per fund and share class, subject to certain minimums and reimbursement of certain expenses. Citi receives additional fees paid by the Trust for blue sky exemption services and money market fund reporting services.
Independent Trustees:
The Trusts pay each Independent Trustee an annual retainer of $100,000. The Trusts pay a fee of $10,000 for each regular meeting of the Board of Trustees attended and a fee of $ 3,000 for each special meeting attended. The Trusts pay each Committee Chair an annual retainer of $ 3,000, with the exception of the Chair of the Audit Committee, who receives a retainer of $ 6,000. The Trusts also pay the Chairman of the Board, an additional annual retainer of $24,000. In addition, for time expended on Board duties outside normal meetings, which is authorized by the Board, a Trustee is compensated at the rate of $ 500 per hour, up to a maximum of $ 3,000 per day.
JOB TITLE HSBC Money Market SAR REVISION 9 SERIAL <12345678> DATE Thursday, June 27, 2013 JOB NUMBER 251995 TYPE PAGE NO. 34 OPERATOR PM4
HSBC FAMILY OF FUNDS 35
HSBC FAM ILY OF FUNDS
Notes to Financial Statements—as of April 30, 2013 (Unaudited) (continued)
Fee Reductions:
The Investment Adviser has agreed to contractually limit through March 1, 2014 the annual total expenses, exclusive of interest, taxes, brokerage commissions, and extraordinary expenses, of certain classes of the Funds. Each Fund Class has its own expense limitations based on the average daily net assets for any full fiscal year as follows:
* As of April 30, 2013, Class E Shares were not operational.
Any amounts contractually waived or reimbursed by the Investment Adviser will be subject to repayment by the respective Fund to the Investment Adviser within three years to the extent that the repayment will not cause the Fund’s operating expenses to exceed the contractual expense limit that was in effect at the time of such waiver or reimbursement. At April 30, 2013, there were no remaining contractual reimbursements that are subject to repayment by the Funds in subsequent years.
The Administrator and Citi may voluntarily waive/reimburse fees to help support the expense limits of the Funds. In addition, the Administrator and Investment Adviser, may waive/reimburse additional fees at their discretion. Any voluntary fee waivers/reimbursements are not subject to recoupment in subsequent fiscal periods. Voluntary waivers/reimbursements may be stopped at any time. Amounts waived/reimbursed by the Investment Adviser, Administrator and Citi are reported separately on the Statements of Operations, as applicable.
The Funds have entered into an arrangement with their custodian whereby credits realized as a result of uninvested cash balances are used to reduce a portion of the Funds’ custodian expenses. Expenses reduced during the period ended April 30, 2013 are reflected on the Statements of Operations as “Fees paid indirectly,” as applicable.
5. Federal Income Tax Information:
At April 30, 2013, the cost basis of securities for federal income tax purposes, gross unrealized appreciation, gross unrealized depreciation and net unrealized appreciation/depreciation were as follows:
Fund Tax Cost($)Tax Unrealized Appreciation($)
Tax Unrealized Depreciation($)
Net Unrealized Appreciation/
(Depreciation)($)*
Prime Money Market Fund . . . . . . . . . . . . 4,876,654,577 — — —U.S. Government Money Market Fund . . . 4,102,644,632 — — —U.S. Treasury Money Market Fund . . . . . . 2,613,911,133 — — —
* The difference between book-basis unrealized appreciation (depreciation) is attributable primarily to tax deferral of losses on wash sales.
JOB TITLE HSBC Money Market SAR REVISION 9 SERIAL <12345678> DATE Thursday, June 27, 2013 JOB NUMBER 251995 TYPE PAGE NO. 35 OPERATOR PM4
36 HSBC FAMILY OF FUNDS
HSBC FAM ILY OF FUNDS
Notes to Financial Statements—as of April 30, 2013 (Unaudited) (continued)
The tax character of dividends paid by the Funds as of the latest tax year ended October 31, 2012 was as follows:
As of the end of the latest tax year ended October 31, 2012, the Funds have net capital loss carryforwards (“CLCFs”)assummarizedinthetablesbelow.CLCFssubjectstoexpirationareappliedasshort-termcapitallossregardlessofwhethertheoriginatingcapitallosswasshort-termorlong-term.CLCFsthatarenotsubjectto expiration must be utilized before those that are subject to expiration. The Board does not intend to authorize adistributionofanyrealizedgainfortheFundsuntilanyapplicableCLCFhasbeenoffsetorexpires.
On September 26, 2006 BISYS Fund Services, Inc. (“BISYS’’), an affiliate of BISYS Fund Services Ohio, Inc. which provided various services to the Funds, reached a settlement with the Securities and Exchange Commission (the “SEC’’) regarding the SEC’s investigation related to BISYS’ past payment of certain marketing and other expenses with respect to certain of its mutual fund clients. The related settlement monies were received by the Funds during the year ended October 31, 2010. The corresponding impact to the net income ratio and total return for the year ended October 31, 2010 are disclosed in the Funds’ Financial Highlights.
7. Subsequent Events:
Management has evaluated events and transactions through the date the financial statements were issued, for purposes of recognition or disclosure in these financial statements and there are no additional subsequent events to report.
JOB TITLE HSBC Money Market SAR REVISION 9 SERIAL <12345678> DATE Thursday, June 27, 2013 JOB NUMBER 251995 TYPE PAGE NO. 36 OPERATOR PM4
HSBC FAMILY OF FUNDS 37
Investment Adviser Contract Approval
HSBC FAM ILY OF FUNDS
Section 15(c) of the Investment Company Act of 1940, as amended (the “1940 Act”), generally requires that a majority of the trustees of a mutual fund who are not parties to an investment advisory agreement for the fund or “interested persons” of the investment adviser, as defined in the 1940 Act (the “Independent Trustees”), review and approve the investment advisory agreement at an in person meeting for an initial period of up to two years and thereafter on an annual basis. A summary of the material factors considered by the Independent Trustees and the Boards of Trustees (the “Board”) of HSBC Funds, HSBC Advisor Funds Trust and HSBC Portfolios (each, a “Trust”) in connection with approving investment advisory and sub-advisory agreements for the series of the Trusts (each, a “Fund”) during the semi-annual period ended April 30, 2013 and the conclusions the Independent Trustees and Board made as a result of those considerations are set forth below.
Annual Continuation of Advisory and Sub-Advisory Agreements
The Board met in person and the Contracts and Expense Committee thereof, which consists of the Independent Trustees of the Trusts (the “Contracts Committee”), met separately to consider, among other matters:
• theapprovalofthecontinuationofthe:(i)InvestmentAdvisoryContractsandrelatedSupplements(“AdvisoryContracts”) between the Trusts and HSBC Global Asset Management (USA) Inc. (the “Adviser”) and (ii) Sub-Advisory Agreements (“Sub-Advisory Contracts”) between the Adviser and each investment sub-adviser (“Sub-Adviser”) to one or more Funds; and
• theapprovalofthecontinuationofcertainotherancillaryagreementstowhichtheAdviserisapartythatobligate the Adviser to provide the Funds with administrative services, such as the Administration Agreement, Support Services Agreement and Operational Support Services Agreement (each, an “Ancillary Agreement”).
Prior to the meetings, the Independent Trustees received and reviewed the information they thought reasonably necessary to evaluate the terms of the Advisory Contracts, Sub-Advisory Contracts and Ancillary Agreements (collectively, the “Agreements”). This information included, among other things, information about: (i) the services that the Adviser and Sub-Advisers provide; (ii) the personnel who provide such services; (iii) investment performance, including comparative data provided by Lipper Inc. (“Lipper”); (iv) trading practices of the Adviser and Sub-Advisers; (v) fees received or to be received by the Adviser and Sub-Advisers, including in comparison with the advisory fees paid by other similar funds based on materials provided by Lipper; (vi) total expense ratios, including in comparison with the total expense ratios of other similar funds based on Lipper data; (vii) the profitability of the Adviser and certain of the Sub-Advisers; and (viii) compliance-related matters pertaining to the Adviser and Sub-Advisers. Counsel to the Trusts and to the Independent Trustees were present at each Contracts Committee meeting and the Board meeting.
When it met, the Contracts Committee and its members reviewed the information provided in advance of the meeting and discussed, among other things: (i) the Funds’ investment advisory arrangements and expense limitation agreements with the Adviser; (ii) the Trusts’ arrangements with the unaffiliated investment sub-advisers to the Trusts, Westfield Capital Management Company, LP (“Westfield”) and Winslow Capital Management, LLC (“Winslow”); (iii) the Trusts’ Administration Agreement with the Adviser; and (iv) regulatory considerations. The Contracts Committee also convened to consider, among other things: (i) the Support Services Agreement and Operational Support Services Agreement with the Adviser; (ii) the Adviser’s Multimanager function; (iii) the Adviser’s advisory services with respect to the Funds that are money market funds (“Money Market Funds”); (iv) the Adviser’s profitability; and (v) additional information provided by the Adviser at the request of the Board. Following the December 5, 2012 and December 17-18, 2012 Contracts Committee meetings, the members of the Contracts Committee determined to recommend to the Board that the Agreements be continued for an additional one-year period.
At the in-person meeting, held on December 17-18, 2012, the Board, including the Independent Trustees, reviewed and discussed the materials and other information provided by the Adviser and Sub-Advisers and considered the previous deliberations and recommendation of the Contracts Committee. As a result of this process, the Board and Independent Trustees determined to approve the continuation of the Agreements with respect to each Fund.
JOB TITLE HSBC Money Market SAR REVISION 9 SERIAL <12345678> DATE Friday, June 28, 2013 JOB NUMBER 251995 TYPE PAGE NO. 37 OPERATOR PM3
38 HSBC FAMILY OF FUNDS
HSBC FAM ILY OF FUNDS
Investment Adviser Contract Approval (continued)
The Board and the Independent Trustees made these determinations on the basis of the following considerations, among others:
Nature, Extent, and Quality of Services Provided by Adviser and Sub-Advisers. The Independent Trustees examined the nature, quality and extent of the investment advisory and administrative support services provided by the Adviser to the Funds, as well as the quality and experience of the Adviser’s personnel. In this regard, the Independent Trustees considered the capabilities and performance of the Adviser’s Multimanager unit with respect to the World Selection Funds and the Equity Funds, the capabilities and performance of the Adviser’s Emerging Markets Debt Team with respect to the Emerging Markets Debt Funds, the capabilities of the Adviser’s oversight with respect to the Frontier Markets Fund, as well as the capabilities and performance of the Adviser’s portfolio management and credit review teams with respect to the Money Market Funds. The Independent Trustees also considered the nature, quality and extent of the administrative support services that the Adviser provides to the Funds, including the Adviser’s oversight and management of the Funds’ other service providers.
The Independent Trustees also took note of: (i) the long-term relationship between the Adviser and the Funds; (ii) the Adviser’s reputation and financial condition; (iii) the reduction during the period in the HSBC Family of Fund’s net assets, and its effect on economies of scale; (iv) the recent liquidation of certain Funds; and (v) the efforts undertaken by the Adviser to foster the growth and development of the Funds since the inception of each of the Funds, including the recent development and launch of the HSBC RMB Fixed Income Fund and HSBC Total Return Fund, and an increased entrepreneurial commitment to the success of the Funds with new classes of shareholders. With respect to the Money Market Funds, the Independent Trustees considered the financial support the Adviser and its affiliates have afforded the Money Market Funds, such as the voluntary fee waivers and reimbursements made to maintain a non-negative yield for the Money Market Funds more recently, and noted the material increase in these waivers and reimbursements due to the economic environment for money market funds over the previous year. In addition, the Independent Trustees considered the Adviser’s performance in fulfilling its responsibilities for overseeing its own and the Sub-Advisers’ compliance with the Funds’ compliance policies and procedures and investment objectives. In assessing the Adviser’s reputation, the Independent Trustees considered a recent regulatory matter affecting the parent of the Adviser which did not relate to the Funds.
The Independent Trustees also examined the nature, quality and extent of the services that the Sub-Advisers provide to their respective Funds. In this regard, the Independent Trustees considered the investment performance and the portfolio risk characteristics achieved by the Sub-Advisers and the Sub-Advisers’ portfolio management teams, their experience, and the quality of their compliance programs, among other factors.
Based on these considerations, the Independent Trustees concluded that they were satisfied with the nature, quality and extent of the services provided by the Adviser and Sub-Advisers, and that the services provided supported continuance of the Agreements.
Investment Performance of the Funds, Adviser and Sub-Advisers. The Independent Trustees considered the investment performance of each Fund over various periods of time, as compared to one another as well as to comparable funds and one or more benchmark indices. In the context of the World Selection Funds, the Independent Trustees took note of the expenses of underlying funds and considered the performance of the World Selection Funds, and particularly the Aggressive Strategy Fund, in light of the World Selection Funds’ relative positioning and peers. In the context of the HSBC Growth Portfolio, although the Independent Trustees noted the recent underperformance of the Portfolio in light of data provided by Lipper, it favorably noted the consistent performance record of the Portfolio and the strong compliance culture at the Portfolio’s Sub-Adviser. In the context of the HSBC Opportunity Portfolio, the Independent Trustees considered that the Portfolio was relatively expensive as compared to its peers, yet was also characterized by relatively high return as well as higher volatility. With respect to the HSBC Opportunity Portfolio, the Independent Trustees also considered the compliance efforts of the Portfolio’s Sub-Adviser.
In the context of the Emerging Markets Debt Funds, the Independent Trustees found the expenses of the HSBC Emerging Markets Debt Fund to be reasonable and its performance to be acceptable, but the Independent Trustees noted that the HSBC Emerging Markets Local Debt Fund had performed less competitively. With respect to the Emerging Markets Debt Funds, the Independent Trustees also requested and received information regarding the Funds’ integration into the overall structure of the HSBC Family of Funds. In the context of the HSBC Frontier Markets Fund, the Independent Trustees noted the Fund’s fees and expenses as compared to its peers, and
JOB TITLE HSBC Money Market SAR REVISION 9 SERIAL <12345678> DATE Friday, June 28, 2013 JOB NUMBER 251995 TYPE PAGE NO. 38 OPERATOR PM3
HSBC FAMILY OF FUNDS 39
HSBC FAM ILY OF FUNDS
Investment Adviser Contract Approval (continued)
requested and received information regarding the advisory fee split between the Adviser and the Fund’s Sub-Adviser. In the context of the Money Market Funds, the Independent Trustees considered the yield support that the Adviser had provided in order for the Money Market Funds to maintain positive yield and performance. The Independent Trustees determined that the Funds’ investment performance and the Adviser’s actions to improve investment performance, where applicable, supported continuance of the Agreements, although they would continue to monitor performance closely, particularly for those Funds that had weaker performance compared to peers during the past year.
Costs of Services and Profits Realized by the Adviser and Sub-Advisers. The Independent Trustees considered the costs of the services provided by the Adviser and Sub-Advisers and the expense ratios of the Funds more generally. The Independent Trustees considered the Adviser’s profitability and costs, including by means of an analysis provided by the Adviser of its estimated profitability. The Independent Trustees also considered the contractual advisory fees under the Advisory Contracts and compared those fees to the fees of similar funds, which had been compiled and provided by Lipper. The Independent Trustees determined that the Funds had advisory fees competitive with those of similar funds, noting the resources, expertise and experience provided to the Funds.
The Independent Trustees also compared the advisory fees under the Advisory Contracts with those of other accounts managed by the Adviser, and evaluated information provided as to why advisory fees may differ between mutual funds and other advisory relationships, including increased shareholder activity. In this regard, the Independent Trustees concluded that differences in advisory fees assessed between the Funds and other accounts managed by the Adviser did not preclude approval of the Advisory Contracts.
With respect to the administrative support services provided by the Adviser, the Independent Trustees considered the fees charged for such services and evaluated the fees payable to the Adviser and those payable to other providers of administrative services to the Funds. At the request of the Independent Trustees, the Adviser provided information regarding the pricing differential between the retail and institutional shares’ respective Operational Support Services Agreements. The Independent Trustees determined that the differences are in-line with industry standards and recognize the different services provided to retail as compared to institutional shareholders. The Independent Trustees also considered the relative split of the administration fee between the Adviser and Citi Fund Services Ohio, Inc., as sub-administrator and other factors relevant to their consideration of these arrangements.
The Independent Trustees also considered the costs of the services provided by the Sub-Advisers, as applicable; the relative portions of the total advisory fees paid to the Sub-Advisers and retained by the Adviser in its capacity as the Funds’ investment adviser; and the services provided by the Adviser and Sub-Advisers. In the context of the HSBC Growth Portfolio, the Independent Trustees considered the sub-advisory fee breakpoint structure. The Independent Trustees also considered information on profitability where provided by the Sub-Advisers.
The Independent Trustees concluded that the advisory fees payable to the Adviser and the Funds’ Sub-Advisers were fair and reasonable in light of the factors set forth above.
Other Relevant Considerations. The Independent Trustees also considered the extent to which the Adviser and Sub-Advisers had achieved economies of scale, whether the Funds’ expense structure permits economies of scale to be shared with the Funds’ shareholders and, if so, the extent to which the Funds’ shareholders may benefit from these economies of scale. The Independent Trustees also noted the contractual caps on certain Fund expenses provided by the Adviser with respect to many of the Funds in order to reduce or control the overall operating expenses of those Funds. The Independent Trustees also considered certain information provided by the Adviser and Sub-Advisers with respect to the benefits they may derive from their relationships with the Funds, including the fact that certain Sub-Advisers have “soft dollar” arrangements with respect to Fund brokerage and therefore may have access to research and other permissible services.
In light of the above considerations and such other factors and information it considered relevant, the Board by a unanimous vote of those present in person at the meeting (including a separate unanimous vote of the Independent Trustees present in person at the meeting) approved the continuation of each Agreement.
JOB TITLE HSBC Money Market SAR REVISION 9 SERIAL <12345678> DATE Friday, June 28, 2013 JOB NUMBER 251995 TYPE PAGE NO. 39 OPERATOR PM3
40 HSBC FAMILY OF FUNDS
HSBC FAM ILY OF FUNDSHSBC FAM ILY OF FUNDS
Table of Shareholder Expenses—as of April 30, 2013 (Unaudited)
As a shareholder of the Funds, you incur two types of costs: (1) transaction costs, including sales charges (loads) on purchases, redemption fees and exchange fees; and (2) ongoing costs, including management fees, distribution fees and other Fund expenses. These examples are intended to help you understand your ongoing costs (in dollars) of investing in the Funds and to compare the cost with the ongoing costs of investing in other mutual funds.
These examples are based on an investment of $1,000 invested at the beginning of the period and held for the entire period from November 1, 2012 through April 30, 2013.
Actual Example
The table below provides information about actual account values and actual expenses. You may use the information below, together with the amount you invested, to estimate the expenses that you paid over the period. Simply divide your account value by $1,000 (for example, an $8,600 account value divided by $1,000 = 8.6), then multiply the result by the number in the table under the heading entitled “Expenses Paid During Period” to estimate the expenses you paid on your account during this period.
Beginning Account Value
11/1/12
Ending Account Value
4/30/13
Expenses Paid During Period*
11/1/12 - 4/30/13
Annualized Expense Ratio During Period
11/1/12 - 4/30/13
Prime Money Market Fund Class A Shares 1,000.00 1,000.10 1.29 0.26% Class B Shares 1,000.00 1,000.10 1.29 0.26% Class C Shares 1,000.00 1,000.10 1.19 0.24% Class D Shares 1,000.00 1,000.10 1.29 0.26% Class I Shares 1,000.00 1,000.50 0.84 0.17% Class Y Shares 1,000.00 1,000.10 1.29 0.26% U.S. Government Money Market Fund Class A Shares 1,000.00 1,000.10 0.84 0.17% Class B Shares 1,000.00 1,000.00 0.84 0.17% Class D Shares 1,000.00 1,000.10 0.84 0.17% Class I Shares 1,000.00 1,000.10 0.79 0.16% Class Y Shares 1,000.00 1,000.10 0.84 0.17% U.S. Treasury Money Market Fund Class A Shares 1,000.00 1,000.00 0.64 0.13% Class B Shares 1,000.00 1,000.00 0.20 0.04% Class D Shares 1,000.00 1,000.00 0.55 0.11% Class I Shares 1,000.00 1,000.00 0.55 0.11% Class Y Shares 1,000.00 1,000.00 0.55 0.11%
* Expenses are equal to the average account value over the period, multiplied by the Fund’s annualized expense ratio, multiplied by 181/365 (to reflect the one half year period).
JOB TITLE HSBC Money Market SAR REVISION 9 SERIAL <12345678> DATE Friday, June 28, 2013 JOB NUMBER 251995 TYPE PAGE NO. 40 OPERATOR PM3
HSBC FAMILY OF FUNDS 41
HSBC FAM ILY OF FUNDS
Table of Shareholder Expenses—as of April 30, 2013 (Unaudited) (continued)
Hypothetical Example for Comparison Purposes
The table below provides information about hypothetical account values and hypothetical expenses based on each Fund’s actual expense ratio and an assumed rate of return of 5% per year before expenses, which is not the Fund’s actual return. The hypothetical account values and expenses may not be used to estimate the actual ending account balance or expenses you paid for the period. You may use this information to compare this 5% hypothetical example with the 5% hypothetical examples that appear in the shareholder reports of other funds.
Please note that the expenses shown in the table are meant to highlight your ongoing costs only and do not reflect any transactional costs, such as sales charges (loads), redemption fees, or exchange fees. Therefore, the table is useful in comparing ongoing costs only, and will not help you determine the relative total costs of owning different funds. In addition, if these transactional costs were included, your costs would have been higher.
Beginning Account Value
11/1/12
Ending Account Value
4/30/13
Expenses Paid During Period*
11/1/12 - 4/30/13
Annualized Expense Ratio During Period
11/1/12 - 4/30/13
Prime Money Market Fund Class A Shares 1,000.00 1,023.51 1.30 0.26% Class B Shares 1,000.00 1,023.51 1.30 0.26% Class C Shares 1,000.00 1,023.60 1.20 0.24% Class D Shares 1,000.00 1,023.51 1.30 0.26% Class I Shares 1,000.00 1,023.95 0.85 0.17% Class Y Shares 1,000.00 1,023.51 1.30 0.26% U.S. Government Money Market Fund Class A Shares 1,000.00 1,023.95 0.85 0.17% Class B Shares 1,000.00 1,023.95 0.85 0.17% Class D Shares 1,000.00 1,023.95 0.85 0.17% Class I Shares 1,000.00 1,024.00 0.80 0.16%
Class Y Shares 1,000.00 1,023.95 0.85 0.17% U.S. Treasury Money Market Fund Class A Shares 1,000.00 1,024.15 0.65 0.13% Class B Shares 1,000.00 1,024.60 0.20 0.04% Class D Shares 1,000.00 1,024.25 0.55 0.11% Class I Shares 1,000.00 1,024.25 0.55 0.11% Class Y Shares 1,000.00 1,024.25 0.55 0.11%
* Expenses are equal to the average account value over the period, multiplied by the Fund’s annualized expense ratio, multiplied by 181/365 (to reflect the one half year period).
JOB TITLE HSBC Money Market SAR REVISION 9 SERIAL <12345678> DATE Friday, June 28, 2013 JOB NUMBER 251995 TYPE PAGE NO. 41 OPERATOR PM3
42 HSBC FAMILY OF FUNDS
HSBC FAM ILY OF FUNDS
Other Information (Unaudited):
Information regarding how the Funds voted proxies relating to portfolio securities during the most recent 12-month period ended June 30th is available (i) without charge, upon request, by calling 1-800-525-5757 for HSBC Bank USA and HSBC Brokerage (USA) Inc. clients and 1-800-782-8183 for all other shareholders; (ii) on the Funds’ website at www.investorfunds.us.hsbc.com; and (iii) on the Security and Exchange Commission’s (“Commission”) website at http://www.sec.gov.
The Funds file their complete schedules of portfolio holdings with the Commission for the first and third quarters of each fiscal year on Form N-Q. The Funds’ Forms N-Q are available on the Commission’s website at http://www.sec.gov. The Funds’ Forms N-Q may be reviewed and copied at the Commission’s Public Reference Room in Washington, D.C. and information on the operation of the Public Reference Room may be obtained by calling 1-800-SEC-0330. The Funds’ Schedules of Investments will be available no later than 60 days after each period end, without charge, on the Funds’ website at www.investorfunds.us.hsbc.com.
Each Fund will disclose on its website at www.investorfunds.us.hsbc.com, within five business days after the end of each month, a complete schedule of portfolio holdings and information regarding the weighted average maturity of the Fund. In addition, each Fund will file with the Commission on Form N-MFP, within five business days after the end of each month, more detailed portfolio holdings information. The Funds’ Forms N-MFP will be available on the Commission’s website at http://www.sec.gov, on a delayed basis, and the Funds’ website will also contain a link to these filings.
An investment in a Fund is not a deposit of HSBC Bank USA, National Association, and is not insured or guaranteed by the Federal Deposit Insurance Corporation or any other government agency.
JOB TITLE HSBC Money Market SAR REVISION 9 SERIAL <12345678> DATE Friday, June 28, 2013 JOB NUMBER 251995 TYPE PAGE NO. 42 OPERATOR PM3
[This Page Intentionally Left Blank]
JOB TITLE HSBC Money Market SAR REVISION 9 SERIAL <12345678> DATE Friday, June 28, 2013 JOB NUMBER 251995 TYPE PAGE NO. 43 OPERATOR PM3
[This Page Intentionally Left Blank]
JOB TITLE HSBC Money Market SAR REVISION 9 SERIAL <12345678> DATE Friday, June 28, 2013 JOB NUMBER 251995 TYPE PAGE NO. 44 OPERATOR PM3
JOB TITLE HSBC Money Market SAR REVISION 9 SERIAL <12345678> DATE Friday, June 28, 2013 JOB NUMBER 251995 TYPE PAGE NO. 45 OPERATOR PM3
The HSBC Family of Funds are distributed by Foreside Distribution Services, L.P. This document must be preceded or accompanied by a current prospectus for the HSBC Funds, which you should read carefully before you invest or send money.
— NOT FDIC INSURED — NO BANK GUARANTEE — MAY LOSE VALUE
HSB-SAR-MMF-0613 6/13
HSBC FAMILY OF FUNDS:
INVESTMENT ADVISER AND ADMINISTRATOR
HSBC Global Asset Management (USA) Inc. 452 Fifth Avenue New York, NY 10018
SHAREHOLDER SERVICING AGENTS
For HSBC Bank USA, N.A. and HSBC Securities (USA) Inc. Clients: HSBC Bank USA, N.A. 452 Fifth Avenue New York, NY 10018 1-888-525-5757