44
EQUITY FUNDS Class A Class B Class C Class I HSBC Opportunity Fund HSOAX HOPBX HOPCX RESCX HSBC Global Asset Management (USA) Inc. HSBC Funds Annual Report October 31, 2017
EQUITY FUNDS Class A Class B Class C Class IHSBC Opportunity Fund HSOAX HOPBX HOPCX RESCX
HSBC Global Asset Management (USA) Inc.
HSBC FundsAnnual ReportOctober 31, 2017
JOB TITLE HSBC Equity AR REVISION 14 SERIAL <12345678> DATE Friday, 22 December 2017
JOB NUMBER 334373(1) TYPE PAGE NO. i OPERATOR JOSHUAM

JOB TITLE HSBC Equity AR REVISION 14 SERIAL <12345678> DATE Friday, 22 December 2017
JOB NUMBER 334373(1) TYPE PAGE NO. ii OPERATOR JOSHUAM
HSBC Family of FundsAnnual Report - October 31, 2017
Glossary of Terms .................................................................................................................................................................................................. 2Commentary From the Investment Manager........................................................................................................................................................ 3Portfolio Reviews ................................................................................................................................................................................................... 4Statements of Assets and Liabilities ..................................................................................................................................................................... 6Statements of Operations ..................................................................................................................................................................................... 7Statements of Changes in Net Assets .................................................................................................................................................................. 8Financial Highlights ................................................................................................................................................................................................ 10Notes to Financial Statements .............................................................................................................................................................................. 12Report of Independent Registered Public Accounting Firm .................................................................................................................................. 19Other Federal Income Tax Information .................................................................................................................................................................. 20Table of Shareholder Expenses ............................................................................................................................................................................. 21
HSBC Portfolio
Portfolio Composition ............................................................................................................................................................................................ 23Schedules of Portfolio Investments HSBC Opportunity Portfolio .............................................................................................................................................................................. 24Statement of Assets and Liabilities ....................................................................................................................................................................... 26Statement of Operations ....................................................................................................................................................................................... 27Statements of Changes in Net Assets .................................................................................................................................................................. 28Financial Highlights ................................................................................................................................................................................................ 29Notes to Financial Statements .............................................................................................................................................................................. 30Report of Independent Registered Public Accounting Firm ................................................................................................................................. 35Table of Shareholder Expenses ............................................................................................................................................................................. 36Board of Trustees and Officers ............................................................................................................................................................................. 37Other Information .................................................................................................................................................................................................. 39
Table of Contents
JOB TITLE HSBC Equity AR REVISION 14 SERIAL <12345678> DATE Friday, 22 December 2017
JOB NUMBER 334373(1) TYPE PAGE NO. 1 OPERATOR JOSHUAM

HSBC FAMILY OF FUNDS2
Bloomberg Barclays Global Aggregate Bond Index is an index that is a measure of global investment-grade debt from 24 local currency markets, which include treasury, government-related, corporate, and securitized fixed-rate bonds from both developed and emerging markets issuers.
Gross Domestic Product (“GDP”) is the value of goods and services produced in a given country in a given year.
ISM Manufacturing Index is based on surveys of more than 300 manufacturing firms by the Institute of Supply Management. The ISM Manufacturing Index monitors employment, production, inventories, new orders, and supplier deliveries. A composite diffusion index monitors conditions in national manufacturing and is based on the data from these surveys.
J.P. Morgan Emerging Markets Bond Index Global tracks returns for USD-denominated debt instruments issued by emerging market sovereign and quasi-sovereign entities, Brady bonds, loans, Eurobonds, and local market instruments.
Lipper Mid-Cap Growth Funds Average is an equally weighted average of mutual funds that, by portfolio practice, invest at least 75% of their equity assets in companies with market capitalizations (on a three-year weighted basis) below Lipper’s large-cap floor. Mid-cap growth funds typically have an above-average price-to-earnings ratio, price-to-book ratio, and three-year sales-per-share growth value, compared to the S&P MidCap 400 Index.
MSCI Emerging Markets (“MSCI EM”) Index is an index that captures the large- and mid-cap representation across 24 emerging markets countries: Brazil, Chile, China, Colombia, Czech Republic, Egypt, Greece, Hungary, India, Indonesia, Korea, Malaysia, Mexico, Pakistan, Peru, Philippines, Poland, Qatar, Russia, South Africa, Taiwan, Thailand, Turkey and United Arab Emirates.
MSCI Europe Australasia and Far East (“MSCI EAFE”) Index is an equity index which captures the large- and mid-cap representation across developed markets countries: Australia, Austria, Belgium, Denmark, Finland, France, Germany, Hong Kong, Ireland, Israel, Italy, Japan, the Netherlands, New Zealand, Norway, Portugal, Singapore, Spain, Sweden, Switzerland and the UK.
Russell 2500TM Growth Index is an index that measures the performance of the small- to mid-cap growth segment of the U.S. equity universe. It includes those Russell 2500 companies with higher price-to-book ratios and higher forecasted growth values.
Standard & Poor’s Mid Cap 400 Index is an unmanaged index that is the most widely used index for mid-sized companies. The S&P MidCap 400 covers 7% of the U.S. equities market, and is part of a series of S&P U.S. indices that can be used as building blocks for portfolio composition.
Standard & Poor’s 500 (“S&P 500”) Index is an index that is widely regarded as a gauge of the U.S. equities market. This index includes 500 leading companies in leading industries of the U.S. economy. The S&P 500 Index focuses on the large-cap segment of the market, with approximately 80% coverage of U.S. equities.
Lipper is an independent mutual fund performance monitor whose results are based on total return and do not reflect a sales charge.
Securities indices are unmanaged and assume reinvestment of all distributions and interest payments and do not take in account brokerage fees or expenses. Securities in the Funds do not match those in the indices and performance of the Funds will differ. Investors cannot invest directly in an index.
Glossary of Terms
JOB TITLE HSBC Equity AR REVISION 14 SERIAL <12345678> DATE Friday, 22 December 2017
JOB NUMBER 334373(1) TYPE PAGE NO. 2 OPERATOR JOSHUAM
HSBC FAMILY OF FUNDS 3
Commentary From the Investment Manager
HSBC Global Asset Management (USA) Inc.
Global Economic Review
The global economy experienced broad growth over the 12-month period from November 1, 2016, through October 31, 2017. Although there was much geopolitical turmoil and uncertainty, investor sentiment was buoyed by healthy corporate profits, supportive monetary policy, tightening labor markets and other positive economic data. Major economies experienced improvements to credit and labor conditions and major central banks continued to normalize monetary policy at a gradual pace. A synchronized economic expansion in both developed and emerging economies helped lift major market indices around the world to near record highs by the end of the period.
Early in the period, global markets were shocked by the surprise results of the November U.S. presidential elections. Positive economic data had already been pushing markets along a positive trajectory in the final months of the previous period, but the election outcome triggered an intense rally as investors grew increasingly optimistic that the new administration would follow through on campaign promises perceived as accommodative for business. The prospect of tax reform, reduced regulations and streamlined fossil fuel energy production continued to drive significant market gains throughout the period.
A rising tide of nationalist populism throughout the U.S. and Europe raised concerns among global investors. The prospect of a new era of protectionist trade policies and political unpredictability remained top-of-mind for investors throughout the period. These concerns eased somewhat after the electoral victories of centrist candidates, including the May election victory of Emmanuel Macron in the French presidential elections and the September reelection of Chancellor Angela Merkel in Germany. Even so, the changing political dynamics remained as President Trump moved forward with policies that rattled global trade and mobility, including withdrawing the U.S. from the Trans-Pacific Partnership, renegotiating the terms of the North American Free Trade Agreement and restricting immigration.
Geopolitical developments were also a source of investor uncertainty during the period and a drag on certain economies and sectors. Among the most notable events were tensions over North Korea’s continued efforts to develop its nuclear weapons capabilities, political turmoil in Turkey in April and an attempt by Catalans to declare independence from Spain in October.
The U.S. Federal Reserve (the Fed) increased its federal funds rate three times during the 12-month period, increasing its target range from 0.50% to 1.25%. The Fed also initiated its plan to scale back its monetary stimulus efforts adopted during the financial crisis in 2008.
Growth in the U.S. gross domestic product (GDP1) slowed modestly in the first two quarters of the period but then picked up significantly near the end. Preliminary estimates suggest that faster growth continued through the third quarter of 2017. Economic data in the U.S. was generally strong during the period, showing robust corporate earnings, a healthy labor market and an increase in consumer discretionary spending. The domestic unemployment rate dropped to a 16-year low and the Institute of Supply Management Manufacturing Index1 climbed to a 13-year high.
Contributors to economic growth in many economies, including in the U.S., were increases in manufacturing activity and exports. This was partly driven by an uptick in demand for imports from China.
China’s economy continued to grow at a relatively slow pace in comparison to previous years. The meeting of China’s National Congress indicated that the government was shifting from an emphasis on short-term growth objectives to a goal of sustainable economic development facilitated by political and economic reforms.
Eurozone economies also experienced solid growth as they continued to benefit from improving credit conditions and easing fiscal austerity by many of its component governments. The European Central Bank announced it would extend its quantitative easing program and implied that rates would remain low in the near term.
The Bank of Japan continued its extremely loose monetary policy and fiscal stimulus efforts with mixed results. GDP growth maintained its momentum, but declining exports and slow wage growth were among the signs indicating the Japanese economy continued to improve at a relatively sluggish pace.
Energy and metal prices climbed significantly during the period, while agricultural commodities generally slumped. Crude oil prices hit a two-year high late in the period, driven by declining global inventories and slower growth of U.S. production.
Global inflation increased very slightly during the period. The U.S. dollar weakened during the first several months of 2017 and ended the period lower than it had started. The weakening of the dollar provided a boost to U.S. exports and offered relief to countries such as Mexico, Turkey, and Indonesia that hold high levels of U.S. dollar-denominated debt.
Market Review
Global equity markets delivered strong returns during the period while showing exceptionally low volatility. Stocks rallied immediately after the election of President Trump and continued to rise somewhat steadily throughout 2017 with positive economic data adding to the momentum. Geopolitical tension and a lack of momentum in U.S. domestic policy initiatives eventually weighed on investor sentiment, but improving economic fundamentals in the Eurozone helped offset those growing concerns. The Fed’s commitment to gradually scaling back its monetary stimulus, along with new proposals for tax reform legislation, also supported gains for stocks.
Emerging markets equities began the period with a selloff triggered by concerns over U.S. trade protectionism and a strengthening U.S. dollar. The tide turned in 2017, however, as the U.S. dollar weakened and fears about the impact of changing trade policy subsided. Moreover, demand for emerging markets equities was supported through the period by relatively cheap valuations compared to developed market stocks.
The MSCI Emerging Markets Index1 (MSCI EM) hit a three-year high in September. However, emerging markets equities pulled back somewhat late in the period due to concerns that the proposed tax reform in the U.S. would repatriate dollars and draw capital out of developing countries. The MSCI EM Index returned 26.91% during the fiscal year compared to a 24.01% gain for the MSCI EAFE Index1 of international stocks in developed markets, for the same period.
U.S. equities posted strong gains similar to those of other developed economies during the period. The S&P 500 Index1 of large-cap stocks returned 23.63%.
Global fixed income markets posted modest gains during the period as investors favored equities in an environment of global economic expansion, perceived risk of inflation and gradual monetary policy normalization. Yields and credit spreads across bond sectors remained low relative to history. The Bloomberg Barclay’s Global Aggregate Bond Index1, which tracks investment-grade debt in 24 local currency markets, returned 1.18% during the period while the J.P. Morgan Emerging Market Bond Index Global1 returned 5.89%. Yields on U.S. government debt rose during the period.
1 For additional information, please refer to the Glossary of Terms.
JOB TITLE HSBC Equity AR REVISION 14 SERIAL <12345678> DATE Friday, 22 December 2017
JOB NUMBER 334373(1) TYPE PAGE NO. 3 OPERATOR JOSHUAM
HSBC FAMILY OF FUNDS4
Portfolio Reviews (Unaudited)
HSBC Opportunity Fund(Class A Shares, Class B Shares, Class C Shares and Class I Shares)
by William A. Muggia, Committee Lead/Portfolio ManagerEthan J. Myers, CFA, Portfolio ManagerJohn M. Montgomery, Portfolio ManagerHamlen Thompson, Portfolio ManagerBruce N. Jacobs, CFA, Portfolio ManagerWestfield Capital Management Company, L.P.
The HSBC Opportunity Fund (the “Fund”) seeks long-term growth of capital by investing, under normal market conditions, primarily in equity securities of small- and mid-cap companies. Small- and mid-cap companies generally are defined as those that have market capitalizations within the range of market capitalizations represented in the Russell 2500TM Growth Index1. The Fund may also invest in equity securities of larger, more established companies and may invest up to 20% of its assets in securities of foreign companies. The Fund employs a two-tier structure, commonly referred to as a “master-feeder” structure, in which the Fund invests all of its investable assets in the HSBC Opportunity Portfolio (the “Portfolio”). The Portfolio employs Westfield Capital Management Company, L.P. as its subadviser.
Investment Concerns
There is no assurance that a portfolio will achieve its investment objective or will work under all market conditions. The value of investments may go down as well as up and you may not get back the amount originally invested. Portfolios may be subject to certain additional risks, which should be considered carefully along with their investment objectives and fees. Equity investments fluctuate in value based on changes to an individual company’s financial condition and overall market conditions. Investments in foreign markets entail special risks such as currency, political, economic, and market risks. Investing in smaller companies is more risky and volatile than investing in large companies. Growth investment style may fall out of favor in the marketplace and result in significant declines in the value of the Portfolio’s securities. Securities of companies considered growth investments may have rapid price swings in the event of earnings disappointments or during periods of market, political, regulatory, and economic uncertainty.
For a complete description of these and other risks associated with investment in a mutual fund, please refer to the Fund’s prospectus.
Market Commentary
For the year ended October 31, 2017, the Class I Shares of the HSBC Opportunity Fund produced a 29.53%* total return, and the Class A Shares of the Fund produced a 29.00%* total return (without sales charge). The Russell 2500™ Growth Index1, the Fund’s primary performance benchmark, and the Lipper Mid-Cap Growth Funds Average1 returned 30.07% and 26.29%, respectively, for the same period.
Portfolio Performance
Domestic equity markets posted broad gains during the period ended October 31, 2017. The rally began shortly after the U.S. presidential election in November 2016 and carried over into 2017 with positive economic data adding to the momentum. By the end of the summer of 2017, the domestic unemployment rate had dropped to a 16-year low and the Institute of Supply Management Manufacturing Index1 climbed to a level last seen in 2004, signaling economic strength. Declining unemployment and GDP1 growth in the Eurozone and improvements in emerging economies helped overshadow investor concerns over geopolitical tensions and a lack of momentum in U.S. policy initiatives. The Federal Reserve’s commitment to unwinding some of the monetary stimulus, along with the White House’s tax reform proposals, also supported gains among risk assets.
In this environment, the Fund benefited from positive performance across all economic sectors, with the largest contributions stemming from the information technology, health care, and industrials, which account for more than 50% of the Fund’s assets.†
However, the Fund underperformed its primary benchmark. The health care and industrials sectors were the largest detractors from the Fund’s relative results, particularly stock selection in the health care equipment and health care facilities sub-industries. Shares of a manufacturer of glucose monitoring systems declined sharply in late September after an industry competitor released details about its own device, inciting investor fears of increased competition. The negative impact of holding residual cash also dragged on relative results.†
The consumer discretionary sector was the greatest contributor to relative returns mostly due to stock selection. The Fund’s investments in movies and entertainment, leisure facilities and education services were among the top relative outperformers. Moreover, despite economic indicators that implied renewed discretionary spending by consumers, the consumer discretionary sector as a whole underperformed during the period. As a result, the Fund’s underweight allocation to the sector also contributed to returns. Stock selection within the real estate sector was another significant contributor, along with a strategic underweight allocation to the consumer staples segment, which was the market’s second-worst performing sector during the period.† * The recent appreciation in the stock market has helped to produce short-term
returns that are not typical and may not continue in the future. Because of ongoing market volatility, fund performance may be subject to substantial short-term changes.
† Portfolio composition is subject to change. 1 For additional information, please refer to the Glossary of Terms.
Past performance does not guarantee future results. The performance data quoted represents past performance and current returns may be lower or higher. Total return figures include change in share price, reinvestment of dividends and capital gains and do not reflect taxes that a shareholder would pay on Fund distributions or on the redemption of Fund shares. Investment return and principal value will fluctuate so that an investor’s shares, when redeemed may be worth more or less than the original cost. To obtain performance information current to the most recent month end, please call 1-800-782-8183.
JOB TITLE HSBC Equity AR REVISION 14 SERIAL <12345678> DATE Friday, 22 December 2017
JOB NUMBER 334373(1) TYPE PAGE NO. 4 OPERATOR JOSHUAM
HSBC FAMILY OF FUNDS 5
Portfolio Reviews (Unaudited)
HSBC Opportunity Fund
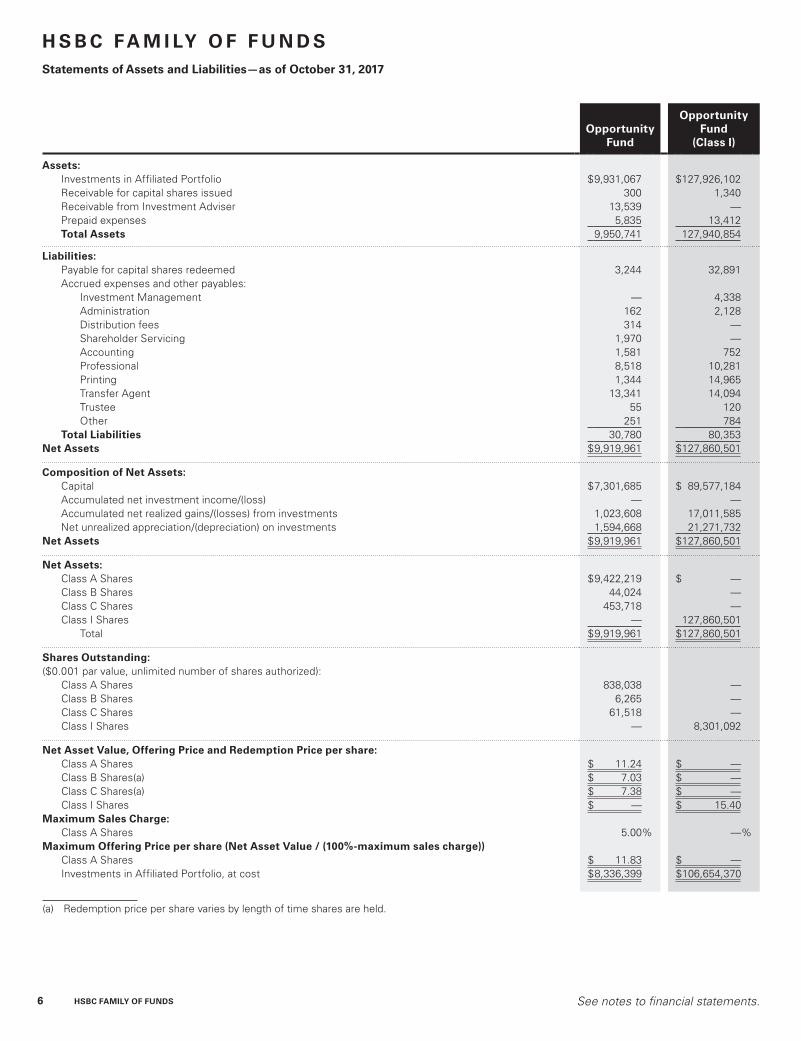
HSBC Opportunity Fund Class A1
Russell 2500™ Growth Index
$22,738$20,310
$4,000
$10,000
$16,000
$22,000
$28,000
$34,000
10/1712/1612/1512/1412/1312/1212/1112/1012/0912/0812/0710/07
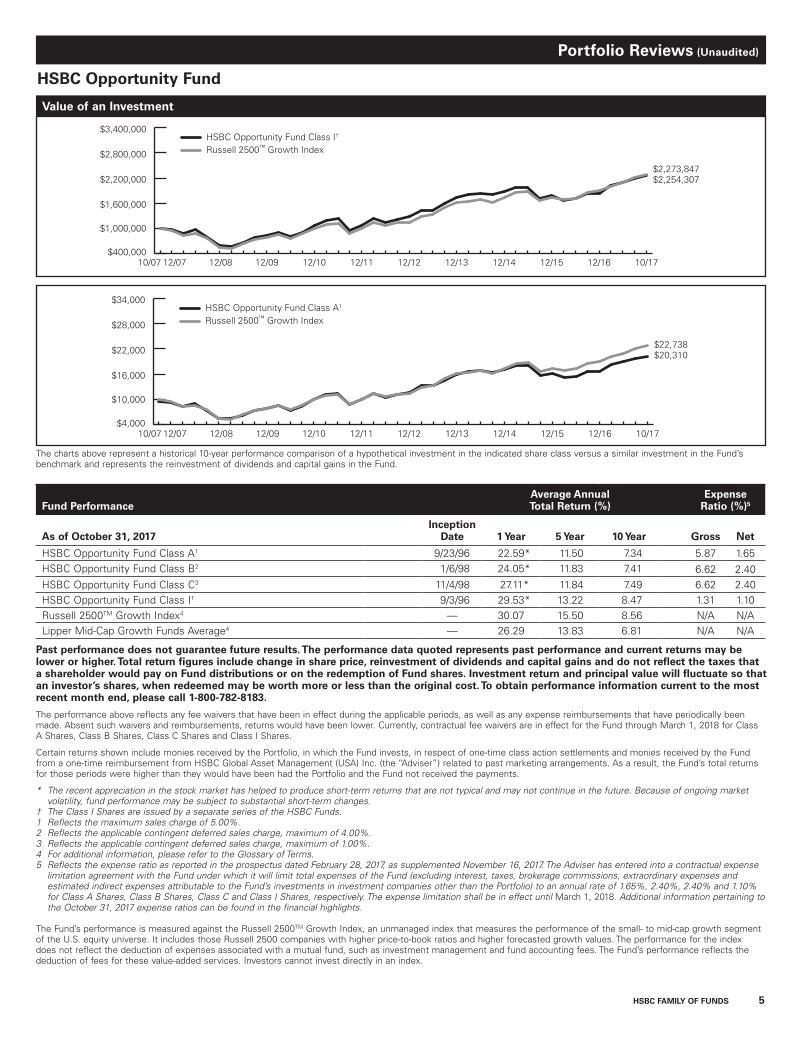
HSBC Opportunity Fund Class I†
Russell 2500™ Growth Index
$2,273,847$2,254,307
$400,000
$1,000,000
$1,600,000
$2,200,000
$2,800,000
$3,400,000
10/1712/1612/1512/1412/1312/1212/1112/1012/0912/0812/0710/07
The charts above represent a historical 10-year performance comparison of a hypothetical investment in the indicated share class versus a similar investment in the Fund’s benchmark and represents the reinvestment of dividends and capital gains in the Fund.
Value of an Investment
Fund PerformanceAverage Annual Total Return (%)
Expense Ratio (%)5
As of October 31, 2017 Inception
Date 1 Year 5 Year 10 Year Gross Net
HSBC Opportunity Fund Class A1 9/23/96 22.59* 11.50 7.34 5.87 1.65HSBC Opportunity Fund Class B2 1/6/98 24.05* 11.83 7.41 6.62 2.40HSBC Opportunity Fund Class C3 11/4/98 27.11* 11.84 7.49 6.62 2.40HSBC Opportunity Fund Class I† 9/3/96 29.53* 13.22 8.47 1.31 1.10Russell 2500TM Growth Index4 — 30.07 15.50 8.56 N/A N/ALipper Mid-Cap Growth Funds Average4 — 26.29 13.83 6.81 N/A N/A
Past performance does not guarantee future results. The performance data quoted represents past performance and current returns may be lower or higher. Total return figures include change in share price, reinvestment of dividends and capital gains and do not reflect the taxes that a shareholder would pay on Fund distributions or on the redemption of Fund shares. Investment return and principal value will fluctuate so that an investor’s shares, when redeemed may be worth more or less than the original cost. To obtain performance information current to the most recent month end, please call 1-800-782-8183.
The performance above reflects any fee waivers that have been in effect during the applicable periods, as well as any expense reimbursements that have periodically been made. Absent such waivers and reimbursements, returns would have been lower. Currently, contractual fee waivers are in effect for the Fund through March 1, 2018 for Class A Shares, Class B Shares, Class C Shares and Class I Shares.
Certain returns shown include monies received by the Portfolio, in which the Fund invests, in respect of one-time class action settlements and monies received by the Fund from a one-time reimbursement from HSBC Global Asset Management (USA) Inc. (the “Adviser”) related to past marketing arrangements. As a result, the Fund’s total returns for those periods were higher than they would have been had the Portfolio and the Fund not received the payments.
* The recent appreciation in the stock market has helped to produce short-term returns that are not typical and may not continue in the future. Because of ongoing market volatility, fund performance may be subject to substantial short-term changes.
† The Class I Shares are issued by a separate series of the HSBC Funds.1 Reflects the maximum sales charge of 5.00%.2 Reflects the applicable contingent deferred sales charge, maximum of 4.00%.3 Reflects the applicable contingent deferred sales charge, maximum of 1.00%.4 For additional information, please refer to the Glossary of Terms. 5 Reflects the expense ratio as reported in the prospectus dated February 28, 2017, as supplemented November 16, 2017. The Adviser has entered into a contractual expense
limitation agreement with the Fund under which it will limit total expenses of the Fund (excluding interest, taxes, brokerage commissions, extraordinary expenses and estimated indirect expenses attributable to the Fund’s investments in investment companies other than the Portfolio) to an annual rate of 1.65%, 2.40%, 2.40% and 1.10% for Class A Shares, Class B Shares, Class C and Class I Shares, respectively. The expense limitation shall be in effect until March 1, 2018. Additional information pertaining to the October 31, 2017 expense ratios can be found in the financial highlights.
The Fund’s performance is measured against the Russell 2500TM Growth Index, an unmanaged index that measures the performance of the small- to mid-cap growth segment of the U.S. equity universe. It includes those Russell 2500 companies with higher price-to-book ratios and higher forecasted growth values. The performance for the index does not reflect the deduction of expenses associated with a mutual fund, such as investment management and fund accounting fees. The Fund’s performance reflects the deduction of fees for these value-added services. Investors cannot invest directly in an index.
JOB TITLE HSBC Equity AR REVISION 14 SERIAL <12345678> DATE Friday, 22 December 2017
JOB NUMBER 334373(1) TYPE PAGE NO. 5 OPERATOR JOSHUAM
6 HSBC FAMILY OF FUNDS See notes to financial statements.
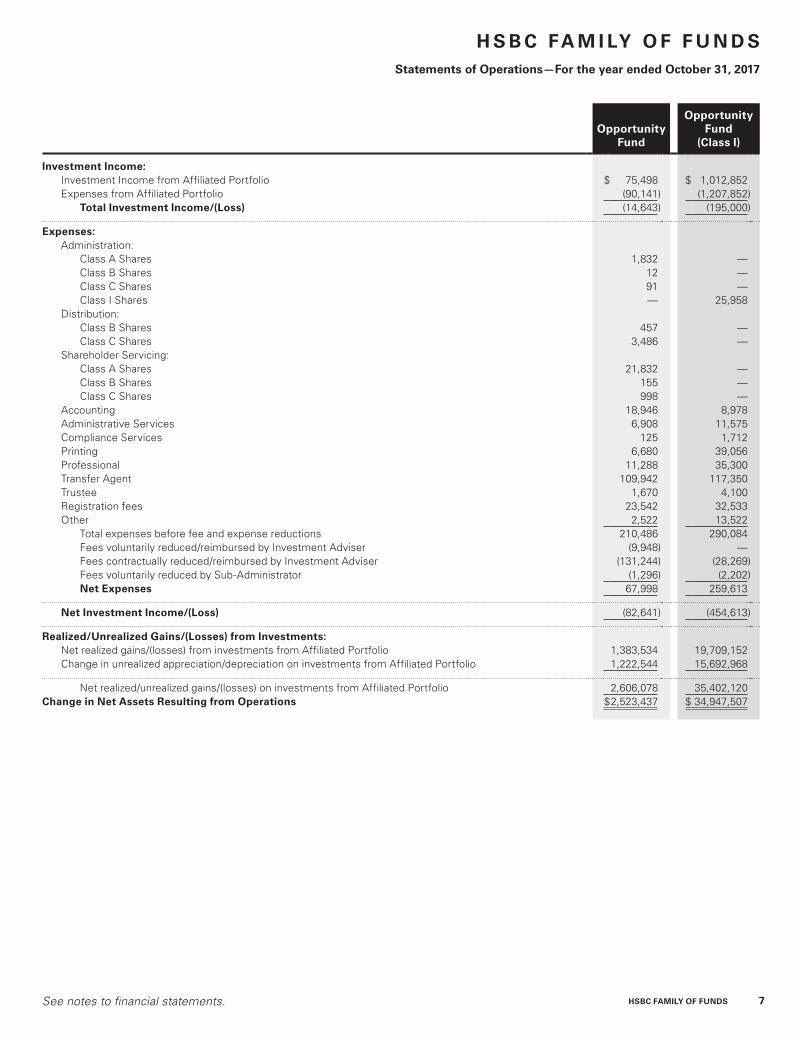
H S B C FA M I LY O F F U N D SStatements of Assets and Liabilities—as of October 31, 2017
Opportunity Fund
Opportunity Fund
(Class I)
Assets:Investments in Affiliated Portfolio $9,931,067 $127,926,102Receivable for capital shares issued 300 1,340Receivable from Investment Adviser 13,539 —Prepaid expenses 5,835 13,412Total Assets 9,950,741 127,940,854
Liabilities:Payable for capital shares redeemed 3,244 32,891Accrued expenses and other payables:
Investment Management — 4,338Administration 162 2,128Distribution fees 314 —Shareholder Servicing 1,970 —Accounting 1,581 752Professional 8,518 10,281Printing 1,344 14,965Transfer Agent 13,341 14,094Trustee 55 120Other 251 784
Total Liabilities 30,780 80,353Net Assets $9,919,961 $127,860,501
Composition of Net Assets:Capital $7,301,685 $ 89,577,184 Accumulated net investment income/(loss) — —Accumulated net realized gains/(losses) from investments 1,023,608 17,011,585Net unrealized appreciation/(depreciation) on investments 1,594,668 21,271,732
Net Assets $9,919,961 $127,860,501
Net Assets:Class A Shares $9,422,219 $ —Class B Shares 44,024 —Class C Shares 453,718 —Class I Shares — 127,860,501
Total $9,919,961 $127,860,501
Shares Outstanding:($0.001 par value, unlimited number of shares authorized):
Class A Shares 838,038 —Class B Shares 6,265 —Class C Shares 61,518 —Class I Shares — 8,301,092
Net Asset Value, Offering Price and Redemption Price per share:Class A Shares $ 11.24 $ —Class B Shares(a) $ 7.03 $ —Class C Shares(a) $ 7.38 $ —Class I Shares $ — $ 15.40
Maximum Sales Charge:Class A Shares 5.00% —%
Maximum Offering Price per share (Net Asset Value / (100%-maximum sales charge))Class A Shares $ 11.83 $ —Investments in Affiliated Portfolio, at cost $8,336,399 $106,654,370
(a) Redemption price per share varies by length of time shares are held.
JOB TITLE HSBC Equity AR REVISION 15 SERIAL <12345678> DATE Saturday, December 23, 2017
JOB NUMBER 334373(1) TYPE PAGE NO. 6 OPERATOR ABIGAELS
See notes to financial statements. HSBC FAMILY OF FUNDS 7
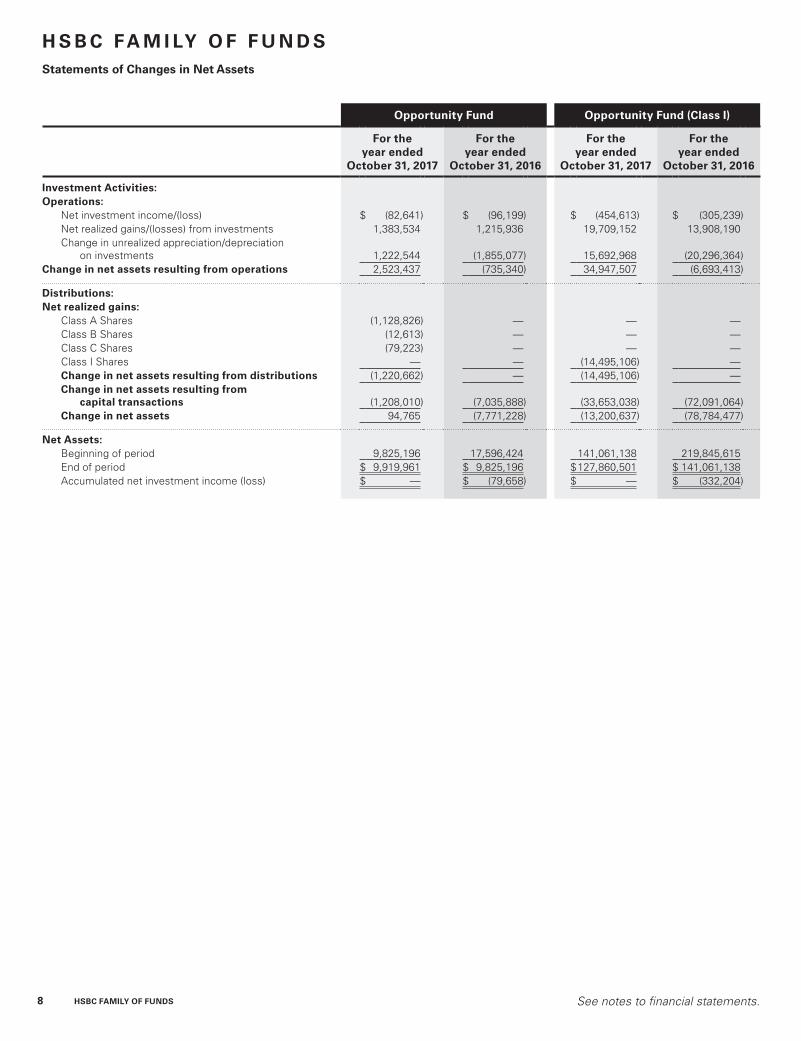
H S B C FA M I LY O F F U N D SStatements of Operations—For the year ended October 31, 2017
Opportunity Fund
Opportunity Fund
(Class I)
Investment Income:Investment Income from Affiliated Portfolio $ 75,498 $ 1,012,852Expenses from Affiliated Portfolio (90,141) (1,207,852)
Total Investment Income/(Loss) (14,643) (195,000)
Expenses:Administration:
Class A Shares 1,832 —Class B Shares 12 —Class C Shares 91 —Class I Shares — 25,958
Distribution:Class B Shares 457 —Class C Shares 3,486 —
Shareholder Servicing:Class A Shares 21,832 —Class B Shares 155 —Class C Shares 998 —
Accounting 18,946 8,978Administrative Services 6,908 11,575Compliance Services 125 1,712Printing 6,680 39,056Professional 11,288 35,300Transfer Agent 109,942 117,350Trustee 1,670 4,100Registration fees 23,542 32,533Other 2,522 13,522
Total expenses before fee and expense reductions 210,486 290,084Fees voluntarily reduced/reimbursed by Investment Adviser (9,948) —Fees contractually reduced/reimbursed by Investment Adviser (131,244) (28,269)Fees voluntarily reduced by Sub-Administrator (1,296) (2,202)Net Expenses 67,998 259,613
Net Investment Income/(Loss) (82,641) (454,613)
Realized/Unrealized Gains/(Losses) from Investments:Net realized gains/(losses) from investments from Affiliated Portfolio 1,383,534 19,709,152Change in unrealized appreciation/depreciation on investments from Affiliated Portfolio 1,222,544 15,692,968
Net realized/unrealized gains/(losses) on investments from Affiliated Portfolio 2,606,078 35,402,120Change in Net Assets Resulting from Operations $2,523,437 $ 34,947,507
JOB TITLE HSBC Equity AR REVISION 15 SERIAL <12345678> DATE Saturday, December 23, 2017
JOB NUMBER 334373(1) TYPE PAGE NO. 7 OPERATOR ABIGAELS
8 HSBC FAMILY OF FUNDS See notes to financial statements.
H S B C FA M I LY O F F U N D SStatements of Changes in Net Assets
Opportunity Fund Opportunity Fund (Class I)
For the year ended
October 31, 2017
For the year ended
October 31, 2016
For the year ended
October 31, 2017
For the year ended
October 31, 2016
Investment Activities:Operations:
Net investment income/(loss) $ (82,641) $ (96,199) $ (454,613) $ (305,239)Net realized gains/(losses) from investments 1,383,534 1,215,936 19,709,152 13,908,190Change in unrealized appreciation/depreciation
on investments 1,222,544 (1,855,077) 15,692,968 (20,296,364)Change in net assets resulting from operations 2,523,437 (735,340) 34,947,507 (6,693,413)
Distributions:Net realized gains:
Class A Shares (1,128,826) — — —Class B Shares (12,613) — — —Class C Shares (79,223) — — —Class I Shares — — (14,495,106) —Change in net assets resulting from distributions (1,220,662) — (14,495,106) —Change in net assets resulting from
capital transactions (1,208,010) (7,035,888) (33,653,038) (72,091,064)Change in net assets 94,765 (7,771,228) (13,200,637) (78,784,477)
Net Assets:Beginning of period 9,825,196 17,596,424 141,061,138 219,845,615End of period $ 9,919,961 $ 9,825,196 $127,860,501 $ 141,061,138Accumulated net investment income (loss) $ — $ (79,658) $ — $ (332,204)
JOB TITLE HSBC Equity AR REVISION 15 SERIAL <12345678> DATE Saturday, December 23, 2017
JOB NUMBER 334373(1) TYPE PAGE NO. 8 OPERATOR ABIGAELS
See notes to financial statements. HSBC FAMILY OF FUNDS 9
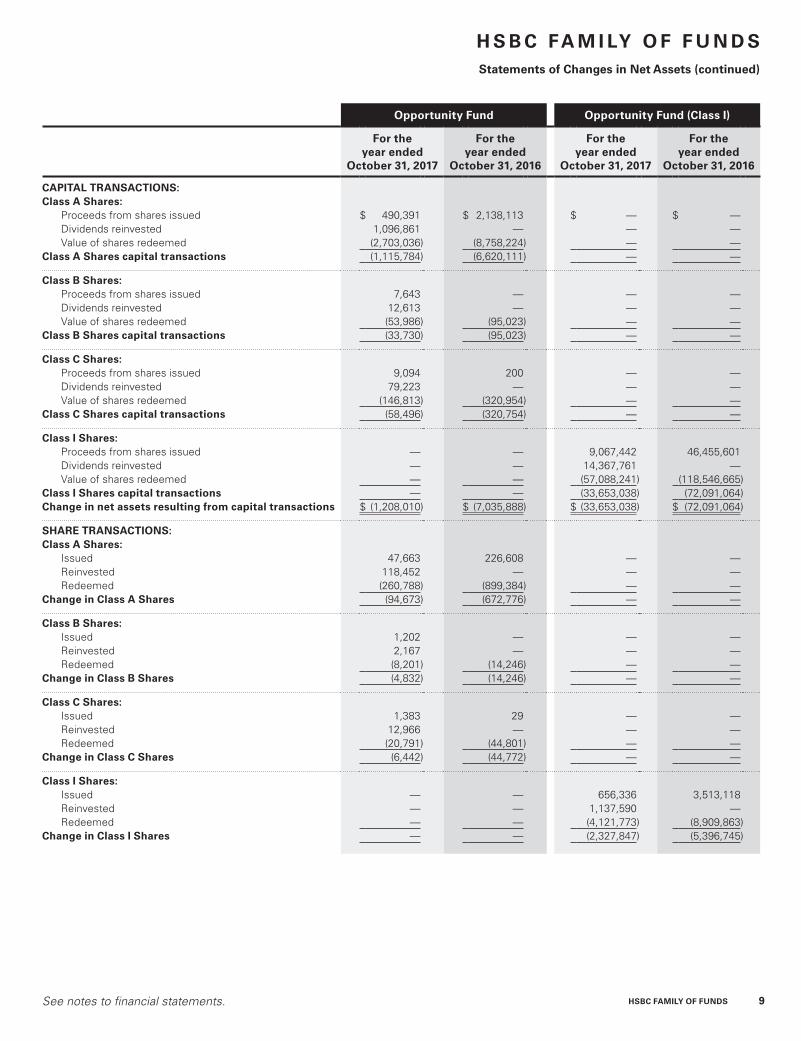
H S B C FA M I LY O F F U N D SStatements of Changes in Net Assets (continued)
Opportunity Fund Opportunity Fund (Class I)
For the year ended
October 31, 2017
For the year ended
October 31, 2016
For the year ended
October 31, 2017
For the year ended
October 31, 2016
CAPITAL TRANSACTIONS:Class A Shares:
Proceeds from shares issued $ 490,391 $ 2,138,113 $ — $ —Dividends reinvested 1,096,861 — — —Value of shares redeemed (2,703,036) (8,758,224) — —
Class A Shares capital transactions (1,115,784) (6,620,111) — —
Class B Shares:Proceeds from shares issued 7,643 — — —Dividends reinvested 12,613 — — —Value of shares redeemed (53,986) (95,023) — —
Class B Shares capital transactions (33,730) (95,023) — —
Class C Shares:Proceeds from shares issued 9,094 200 — —Dividends reinvested 79,223 — — —Value of shares redeemed (146,813) (320,954) — —
Class C Shares capital transactions (58,496) (320,754) — —
Class I Shares:Proceeds from shares issued — — 9,067,442 46,455,601Dividends reinvested — — 14,367,761 —Value of shares redeemed — — (57,088,241) (118,546,665)
Class I Shares capital transactions — — (33,653,038) (72,091,064)Change in net assets resulting from capital transactions $ (1,208,010) $ (7,035,888) $ (33,653,038) $ (72,091,064)
SHARE TRANSACTIONS:Class A Shares:
Issued 47,663 226,608 — —Reinvested 118,452 — — —Redeemed (260,788) (899,384) — —
Change in Class A Shares (94,673) (672,776) — —
Class B Shares:Issued 1,202 — — —Reinvested 2,167 — — —Redeemed (8,201) (14,246) — —
Change in Class B Shares (4,832) (14,246) — —
Class C Shares:Issued 1,383 29 — —Reinvested 12,966 — — —Redeemed (20,791) (44,801) — —
Change in Class C Shares (6,442) (44,772) — —
Class I Shares:Issued — — 656,336 3,513,118Reinvested — — 1,137,590 —Redeemed — — (4,121,773) (8,909,863)
Change in Class I Shares — — (2,327,847) (5,396,745)
JOB TITLE HSBC Equity AR REVISION 15 SERIAL <12345678> DATE Saturday, December 23, 2017
JOB NUMBER 334373(1) TYPE PAGE NO. 9 OPERATOR ABIGAELS
HS
BC
OP
PO
RT
UN
ITY
FU
ND
10 HSBC FAMILY OF FUNDS See notes to financial statements.
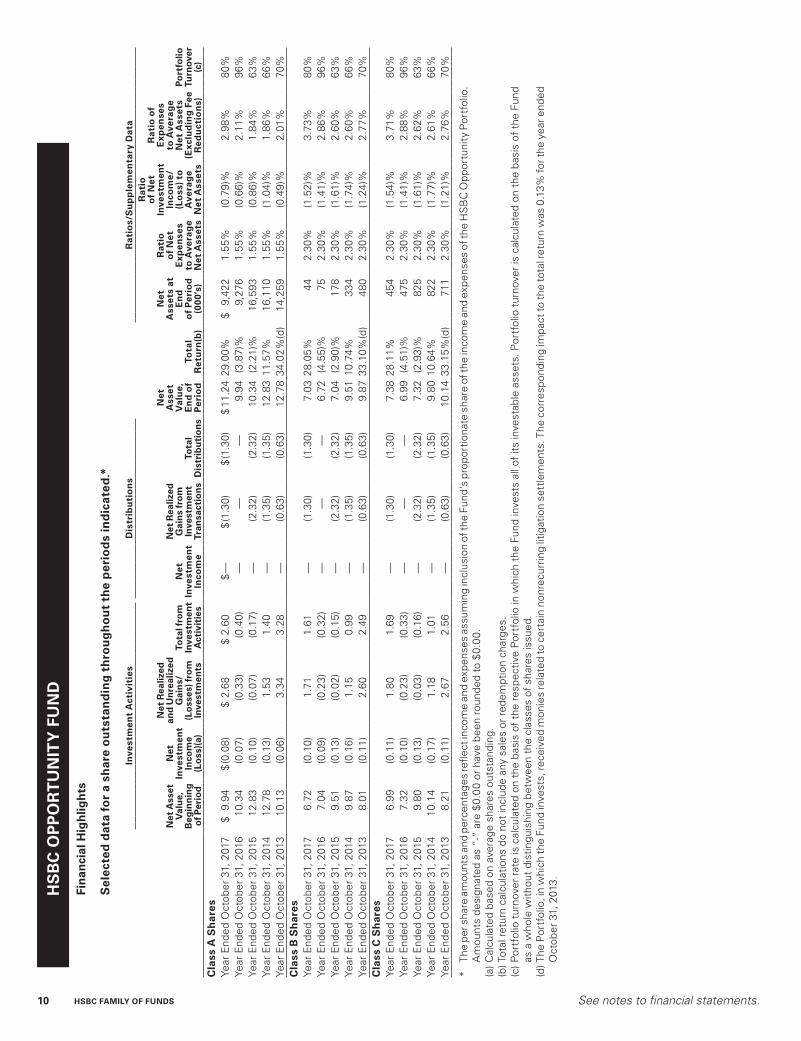
Fin
anci
al H
igh
ligh
ts
Sel
ecte
d d
ata
for
a sh
are
ou
tsta
nd
ing
th
rou
gh
ou
t th
e p
erio
ds
ind
icat
ed.*
Inve
stm
ent
Act
ivit
ies
Dis
trib
uti
on
sR
atio
s/S
up
ple
men
tary
Dat
a
Net
Ass
et
Val
ue,
B
egin
nin
g
of P
erio
d
Net
In
vest
men
t In
com
e (L
oss
)(a)
Net
Rea
lized
an
d U
nre
aliz
ed
Gai
ns/
(L
oss
es) f
rom
In
vest
men
ts
Tota
l fro
m
Inve
stm
ent
Act
ivit
ies
Net
In
vest
men
t In
com
e
Net
Rea
lized
G
ain
s fr
om
In
vest
men
t Tr
ansa
ctio
ns
Tota
l D
istr
ibu
tio
ns
Net
A
sset
V
alu
e,
En
d o
f P
erio
dTo
tal
Ret
urn
(b)
Net
A
sset
s at
E
nd
o
f P
erio
d
(000
’s)
Rat
io
of
Net
E
xpen
ses
to A
vera
ge
Net
Ass
ets
Rat
io
of
Net
In
vest
men
t In
com
e/
(Lo
ss)
to
Ave
rag
e N
et A
sset
s
Rat
io o
f E
xpen
ses
to A
vera
ge
Net
Ass
ets
(Exc
lud
ing
Fee
R
edu
ctio
ns)
Po
rtfo
lio
Turn
ove
r (c
)
Cla
ss A
Sh
ares
Year
End
ed O
ctob
er 3
1, 2
017
$9.
94$
(0.0
8)$
2.68
$2.
60$
—$
(1.3
0)$
(1.3
0)$
11.2
429
.00%
$9,
422
1.55
%(0
.79)
%2.
98%
80%
Year
End
ed O
ctob
er 3
1, 2
016
10.3
4(0
.07)
(0.3
3)(0
.40)
——
—9.
94(3
.87)
%9,
276
1.55
%(0
.66)
%2.
11%
96%
Year
End
ed O
ctob
er 3
1, 2
015
12.8
3(0
.10)
(0.0
7)(0
.17)
—(2
.32)
(2.3
2)10
.34
(2.2
1)%
16,5
931.
55%
(0.8
6)%
1.84
%63
%Ye
ar E
nded
Oct
ober
31,
201
412
.78
(0.1
3)1.
531.
40—
(1.3
5)(1
.35)
12.8
311
.57%
16,1
101.
55%
(1.0
4)%
1.86
%66
%Ye
ar E
nded
Oct
ober
31,
201
310
.13
(0.0
6)3.
343.
28—
(0.6
3)(0
.63)
12.7
834
.02%
(d)
14,2
591.
55%
(0.4
9)%
2.01
%70
%C
lass
B S
har
esYe
ar E
nded
Oct
ober
31,
201
76.
72(0
.10)
1.71
1.61
—(1
.30)
(1.3
0)7.
0328
.05%
442.
30%
(1.5
2)%
3.73
%80
%Ye
ar E
nded
Oct
ober
31,
201
67.
04(0
.09)
(0.2
3)(0
.32)
——
—6.
72(4
.55)
%75
2.30
%(1
.41)
%2.
86%
96%
Year
End
ed O
ctob
er 3
1, 2
015
9.51
(0.1
3)(0
.02)
(0.1
5)—
(2.3
2)(2
.32)
7.04
(2.9
0)%
178
2.30
%(1
.61)
%2.
60%
63%
Year
End
ed O
ctob
er 3
1, 2
014
9.87
(0.1
6)1.
150.
99—
(1.3
5)(1
.35)
9.51
10.7
4%33
42.
30%
(1.7
4)%
2.60
%66
%Ye
ar E
nded
Oct
ober
31,
201
38.
01(0
.11)
2.60
2.49
—(0
.63)
(0.6
3)9.
8733
.10%
(d)
480
2.30
%(1
.24)
%2.
77%
70%
Cla
ss C
Sh
ares
Year
End
ed O
ctob
er 3
1, 2
017
6.99
(0.1
1)1.
801.
69—
(1.3
0)(1
.30)
7.38
28.1
1%45
42.
30%
(1.5
4)%
3.71
%80
%Ye
ar E
nded
Oct
ober
31,
201
67.
32(0
.10)
(0.2
3)(0
.33)
——
—6.
99(4
.51)
%47
52.
30%
(1.4
1)%
2.88
%96
%Ye
ar E
nded
Oct
ober
31,
201
59.
80(0
.13)
(0.0
3)(0
.16)
—(2
.32)
(2.3
2)7.
32(2
.93)
%82
52.
30%
(1.6
1)%
2.62
%63
%Ye
ar E
nded
Oct
ober
31,
201
410
.14
(0.1
7)1.
181.
01—
(1.3
5)(1
.35)
9.80
10.6
4%82
22.
30%
(1.7
7)%
2.61
%66
%Ye
ar E
nded
Oct
ober
31,
201
38.
21(0
.11)
2.67
2.56
—(0
.63)
(0.6
3)10
.14
33.1
5%(d
)71
12.
30%
(1.2
1)%
2.76
%70
%
* Th
e pe
r sha
re a
mou
nts
and
perc
enta
ges
refle
ct in
com
e an
d ex
pens
es a
ssum
ing
incl
usio
n of
the
Fund
’s p
ropo
rtio
nate
sha
re o
f the
inco
me
and
expe
nses
of t
he H
SB
C O
ppor
tuni
ty P
ortf
olio
.
Am
ount
s de
sign
ated
as
“-“
are
$0.0
0 or
hav
e be
en r
ound
ed t
o $0
.00.
(a) C
alcu
late
d ba
sed
on a
vera
ge s
hare
s ou
tsta
ndin
g.(b
) Tot
al r
etur
n ca
lcul
atio
ns d
o no
t in
clud
e an
y sa
les
or r
edem
ptio
n ch
arge
s.(c
) Por
tfol
io t
urno
ver
rate
is c
alcu
late
d on
the
bas
is o
f th
e re
spec
tive
Por
tfol
io in
whi
ch t
he F
und
inve
sts
all o
f its
inve
stab
le a
sset
s. P
ortf
olio
tur
nove
r is
cal
cula
ted
on t
he b
asis
of
the
Fund
as
a w
hole
with
out
dist
ingu
ishi
ng b
etw
een
the
clas
ses
of s
hare
s is
sued
.(d
) The
Por
tfol
io, i
n w
hich
the
Fund
inve
sts,
rece
ived
mon
ies
rela
ted
to c
erta
in n
onre
curr
ing
litig
atio
n se
ttle
men
ts. T
he c
orre
spon
ding
impa
ct to
the
tota
l ret
urn
was
0.1
3% fo
r the
yea
r end
ed
Oct
ober
31,
201
3.
JOB TITLE HSBC Equity AR REVISION 15 SERIAL <12345678> DATE Saturday, December 23, 2017
JOB NUMBER 334373(1) TYPE PAGE NO. 10 OPERATOR ABIGAELS
HS
BC
OP
PO
RT
UN
ITY
FU
ND
(CLA
SS
I)
See notes to financial statements. HSBC FAMILY OF FUNDS 11
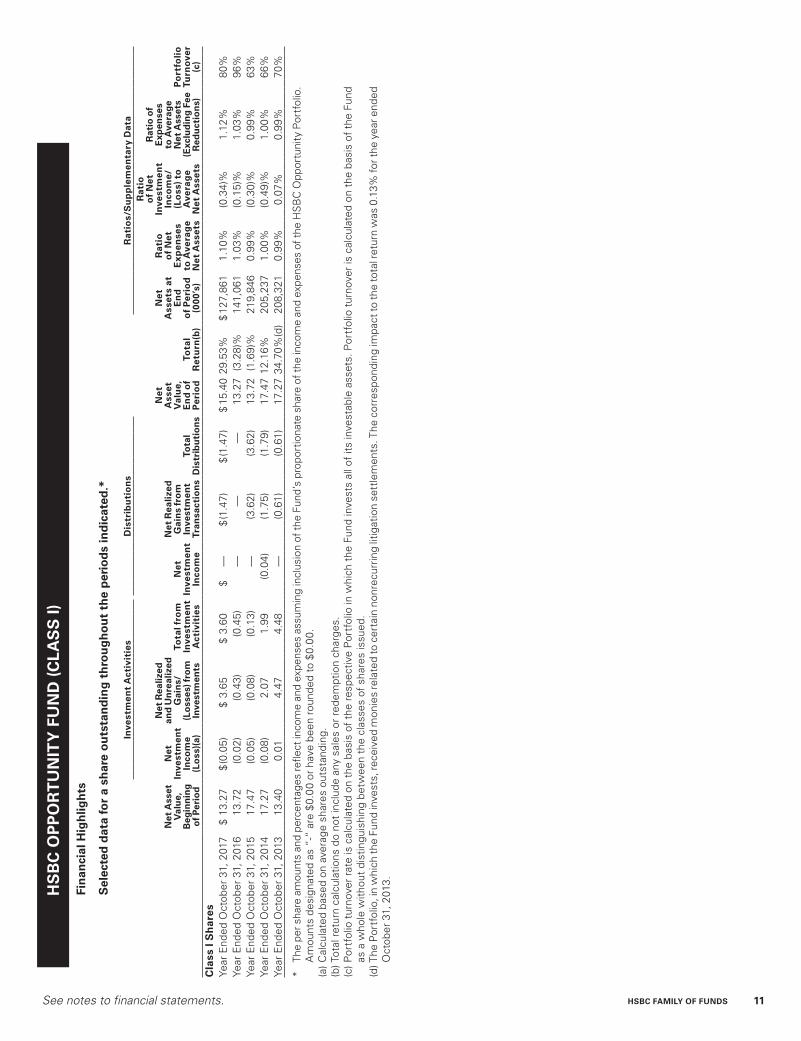
Fin
anci
al H
igh
ligh
ts
Sel
ecte
d d
ata
for
a sh
are
ou
tsta
nd
ing
th
rou
gh
ou
t th
e p
erio
ds
ind
icat
ed.*
Inve
stm
ent
Act
ivit
ies
Dis
trib
uti
on
sR
atio
s/S
up
ple
men
tary
Dat
a
Net
Ass
et
Val
ue,
B
egin
nin
g
of P
erio
d
Net
In
vest
men
t In
com
e (L
oss
)(a)
Net
Rea
lized
an
d U
nre
aliz
ed
Gai
ns/
(L
oss
es) f
rom
In
vest
men
ts
Tota
l fro
m
Inve
stm
ent
Act
ivit
ies
Net
In
vest
men
t In
com
e
Net
Rea
lized
G
ain
s fr
om
In
vest
men
t Tr
ansa
ctio
ns
Tota
l D
istr
ibu
tio
ns
Net
A
sset
V
alu
e,
En
d o
f P
erio
dTo
tal
Ret
urn
(b)
Net
A
sset
s at
E
nd
o
f P
erio
d
(000
’s)
Rat
io
of
Net
E
xpen
ses
to A
vera
ge
Net
Ass
ets
Rat
io
of
Net
In
vest
men
t In
com
e/
(Lo
ss)
to
Ave
rag
e N
et A
sset
s
Rat
io o
f E
xpen
ses
to A
vera
ge
Net
Ass
ets
(Exc
lud
ing
Fee
Red
uct
ion
s)
Po
rtfo
lio
Tu
rno
ver
(c)
Cla
ss I
Sh
ares
Year
End
ed O
ctob
er 3
1, 2
017
$13
.27
$(0
.05)
$3.
65$
3.60
$—
$(1
.47)
$(1
.47)
$15
.40
29.5
3%$
127,
861
1.10
%(0
.34)
%1.
12%
80%
Year
End
ed O
ctob
er 3
1, 2
016
13.7
2(0
.02)
(0.4
3)(0
.45)
——
—13
.27
(3.2
8)%
141,
061
1.03
%(0
.15)
%1.
03%
96%
Year
End
ed O
ctob
er 3
1, 2
015
17.4
7(0
.05)
(0.0
8)(0
.13)
—(3
.62)
(3.6
2)13
.72
(1.6
9)%
219,
846
0.99
%(0
.30)
%0.
99%
63%
Year
End
ed O
ctob
er 3
1, 2
014
17.2
7(0
.08)
2.07
1.99
(0.0
4)(1
.75)
(1.7
9)17
.47
12.1
6%20
5,23
71.
00%
(0.4
9)%
1.00
%66
%Ye
ar E
nded
Oct
ober
31,
201
313
.40
0.01
4.47
4.48
—(0
.61)
(0.6
1)17
.27
34.7
0%(d
)20
8,32
10.
99%
0.07
%0.
99%
70%
* Th
e pe
r sha
re a
mou
nts
and
perc
enta
ges
refle
ct in
com
e an
d ex
pens
es a
ssum
ing
incl
usio
n of
the
Fund
’s p
ropo
rtio
nate
sha
re o
f the
inco
me
and
expe
nses
of t
he H
SB
C O
ppor
tuni
ty P
ortf
olio
.
Am
ount
s de
sign
ated
as
“-“
are
$0.0
0 or
hav
e be
en r
ound
ed t
o $0
.00.
(a) C
alcu
late
d ba
sed
on a
vera
ge s
hare
s ou
tsta
ndin
g.(b
) Tot
al r
etur
n ca
lcul
atio
ns d
o no
t in
clud
e an
y sa
les
or r
edem
ptio
n ch
arge
s.(c
) Por
tfol
io t
urno
ver
rate
is c
alcu
late
d on
the
bas
is o
f th
e re
spec
tive
Por
tfol
io in
whi
ch t
he F
und
inve
sts
all o
f its
inve
stab
le a
sset
s. P
ortf
olio
tur
nove
r is
cal
cula
ted
on t
he b
asis
of
the
Fund
as
a w
hole
with
out
dist
ingu
ishi
ng b
etw
een
the
clas
ses
of s
hare
s is
sued
.(d
) The
Por
tfol
io, i
n w
hich
the
Fund
inve
sts,
rece
ived
mon
ies
rela
ted
to c
erta
in n
onre
curr
ing
litig
atio
n se
ttle
men
ts. T
he c
orre
spon
ding
impa
ct to
the
tota
l ret
urn
was
0.1
3% fo
r the
yea
r end
ed
Oct
ober
31,
201
3.
JOB TITLE HSBC Equity AR REVISION 15 SERIAL <12345678> DATE Saturday, December 23, 2017
JOB NUMBER 334373(1) TYPE PAGE NO. 11 OPERATOR ABIGAELS
12 HSBC FAMILY OF FUNDS
H S B C FA M I LY O F F U N D S
Notes to Financial Statements—as of October 31, 2017
1. Organization:
The HSBC Funds (the “Trust”), a Delaware statutory trust organized on March 2, 2016, is registered under the Investment Company Act of 1940, as amended (the “Act”), as an open-end management investment company. Effective June 24, 2016, the Funds (as defined below), which were series of HSBC Funds, a Massachusetts business trust, reorganized with and into corresponding series of the Trust (each, a “Reorganization”). Upon completion of each Reorganization, the respective share classes of each Fund assumed the performance, financial and other historical information of those of the corresponding predecessor series. As of October 31, 2017, the Trust is composed of 13 separate operational funds, each a series of the HSBC Family of Funds. The accompanying financial statements are presented for the following two funds (individually a “Fund”, collectively the “Funds”) of the Trust:
Fund Short Name
HSBC Opportunity Fund Opportunity FundHSBC Opportunity Fund (Class I) Opportunity Fund (Class I)
The Funds are diversified funds. Financial statements for all other funds of the Trust are published separately.
Each Fund utilizes a master-feeder fund structure and seeks to achieve its investment objectives by investing all of its investable assets in the HSBC Opportunity Portfolio (the “Portfolio”), which is a diversified series of the Trust. The Portfolio operates as a master fund in a master-feeder arrangement in which other feeder funds invest all or part of their investable assets in the Portfolio. The Funds’ proportionate ownership of the Portfolio as of October 31, 2017 was as follows:
Fund
Proportionate Ownership Interest on
October 31, 2017 (%)
Opportunity Fund . . . . . . . . . . . . . . . . . . . . . . . . . . . . . . . . . . . . . . . . . . . . . . . . . 7.2Opportunity Fund (Class I) . . . . . . . . . . . . . . . . . . . . . . . . . . . . . . . . . . . . . . . . . . . 92.8
The financial statements of the Portfolio, including the Schedules of Portfolio Investments, are included elsewhere in this report. The financial statements of the Portfolio should be read in conjunction with the financial statements of the Funds.
The Funds are authorized to issue an unlimited number of shares of beneficial interest with a par value of $ 0.001 per share. The Opportunity Fund offers three classes of shares: Class A Shares, Class B Shares, and Class C Shares. The Opportunity Fund (Class I) offers one class of shares: Class I Shares. Class A Shares of the Opportunity Fund have a maximum sales charge of 5.00% as a percentage of the offering price. Class B Shares of the Opportunity Fund are offered without any front-end sales charge but will be subject to a contingent deferred sales charge (“CDSC”) ranging from a maximum of 4.00% if redeemed less than one year after purchase to 0.00% if redeemed more than four years after purchase. Class C Shares of the Opportunity Fund are offered without any front-end sales charge but will be subject to a maximum CDSC of 1.00% if redeemed less than one year after purchase. No sales charges are assessed with respect to Class I Shares of the Opportunity Fund (Class I). Each class of shares in the Funds has identical rights and privileges, except with respect to arrangements pertaining to shareholder servicing and/or distribution, class-related expenses, voting rights on matters affecting a single class of shares, and exchange privilege of each class of shares. Class B Shares of the Opportunity Fund may no longer be purchased or acquired by any new or existing Class B shareholder, except through dividend and/or capital gains reinvestment.
Under the Trust’s organizational documents, the Trust’s officers and Trustees are indemnified against certain liabilities arising out of the performance of their duties to the Funds. In addition, in the normal course of business, the Trust enters into contracts with its service providers, which also provide for indemnifications by the Funds. The Funds’ maximum exposure under these arrangements is unknown, as this would involve future claims that may be made against the Funds. However, based on experience, the Trust believes the risk of loss to be remote.
JOB TITLE HSBC Equity AR REVISION 15 SERIAL <12345678> DATE Saturday, December 23, 2017
JOB NUMBER 334373(1) TYPE PAGE NO. 12 OPERATOR ABIGAELS
HSBC FAMILY OF FUNDS 13
H S B C FA M I LY O F F U N D S
Notes to Financial Statements—as of October 31, 2017
The Funds are investment companies and follow accounting and reporting guidance under Financial Accounting Standards Board (“FASB”) Accounting Standards Codification (“ASC”) Topic 946, “Financial Services-Investment Companies.”
2. Significant Accounting Policies:
The following is a summary of the significant accounting policies followed by the Funds in the preparation of their financial statements. The policies are in conformity with generally accepted accounting principles in the United States of America (“GAAP”). The preparation of financial statements requires management to make certain estimates and assumptions that affect the reported amounts of assets and liabilities and disclosure of contingent assets and liabilities at the date of the financial statements and the reported amounts of increases and decreases in net assets from operations during the reporting period. Actual results could differ from those estimates.
Securities Valuation:
The Funds record their investments at fair value. Fair value is defined as the price that would be received to sell an asset or paid to transfer a liability in an orderly transaction between market participants at the measurement date. The valuation techniques used to determine fair value are further described in Note 3 below.
Investment Transactions and Related Income:
The Funds record investments to the Portfolio on a trade date basis. The Funds record daily their proportionate share of income, expenses, changes in unrealized appreciation and depreciation and realized gains and losses derived from the Portfolio. In addition, the Funds accrue their own expenses daily as incurred.
Allocations:
Expenses directly attributable to a Fund are charged to that Fund. Expenses not directly attributable to a Fund are allocated among the applicable series within the Trust in relation to the net assets of each fund, equally to each fund, or another appropriate basis. Class specific expenses are charged directly to the class incurring the expense. In addition, income, expenses (other than class specific expenses), and unrealized and realized gains and losses are allocated to each class based on relative net assets on a daily basis.
Distributions to Shareholders:
Dividends to shareholders of the Funds from net investment income, if any, are declared and distributed semiannually.
The Funds’ net realized gains, if any, are declared and distributed at least annually. Additional distributions are also made to the Funds’ shareholders to the extent necessary to avoid the federal excise tax on certain undistributed income and net realized gains of regulated investment companies.
Federal Income Taxes:
Each Fund is a separate taxable entity for federal income tax purposes. Each Fund has qualified and intends to continue to qualify each year as a “regulated investment company’’ under Subchapter M of the Internal Revenue Code, as amended, and to distribute substantially all of its taxable net investment income and net realized gains, if any, to its shareholders. Accordingly, no provision for federal income or excise tax is required for the Funds, although shareholders may be taxed on distributions they receive.
Management of the Funds has reviewed tax positions taken in tax years that remain subject to examination by all major tax jurisdictions, including federal (i.e., the last four tax year ends and the interim tax period since then, as applicable). Management believes that there is no tax liability resulting from unrecognized tax benefits related to uncertain tax positions taken. Management’s conclusions may be subject to future review based on changes in, or interpretation of, accounting standards or tax laws and regulations.
JOB TITLE HSBC Equity AR REVISION 15 SERIAL <12345678> DATE Saturday, December 23, 2017
JOB NUMBER 334373(1) TYPE PAGE NO. 13 OPERATOR ABIGAELS
14 HSBC FAMILY OF FUNDS
H S B C FA M I LY O F F U N D S
Notes to Financial Statements—as of October 31, 2017
Recent Accounting Pronouncements:
In October 2016, the Securities and Exchange Commission (SEC) released its Final Rules on Investment Company Reporting Modernization (the “Rules”). The Rules introduce two new regulatory reporting forms for investment companies - Form N-PORT and Form N-CEN - and also contain amendments to Regulation S-X which require standardized, enhanced disclosures about derivatives in investment company financial statements, as well as other amendments. The amendments to Regulation S-X became effective for filings made with the SEC after August 1, 2017. The Funds’ adoption of these amendments, effective with the financial statements prepared as of October 31, 2017, required additional disclosures reflected herein, but had no effect on the Funds’ net assets or results of operations.
3. Investment Valuation Summary
The valuation techniques employed by the Funds, as described below, maximize the use of observable inputs and minimize the use of unobservable inputs in determining fair value. The Funds’ investments are classified within the fair value hierarchy based on the lowest level of input that is significant to the fair value measurement. The inputs used for valuing the Funds’ investments are summarized in the three broad levels listed below:
• Level 1—quoted prices in active markets for identical assets
• Level 2—other significant observable inputs (including quoted prices for similar securities, interest rates, prepayments speeds, credit risk, etc.)
• Level 3—significant unobservable inputs (including the Fund’s own assumptions in determining the fair value of investments)
Changes in valuation techniques may result in transfers in or out of an assigned level within the fair value hierarchy. The Trust’s policy is to disclose transfers between fair value hierarchy levels based on valuations at the end of the reporting period. The inputs or methodology used for valuing investments are not necessarily an indication of the risk associated with investing in those investments. There were no transfers during the year ended October 31, 2017.
The Funds record their investments in the Portfolio at fair value, which represents their proportionate ownership of the value of the Portfolios’ net assets. These investments are typically categorized as Level 2 in the fair value hierarchy. The underlying securities of the Portfolio are recorded at fair value, as discussed more fully in the Notes to Financial Statements of the Portfolio included elsewhere in this report.
As of October 31, 2017, all investments were categorized as Level 2 in the fair value hierarchy.
4. Related Party Transactions and Other Agreements and Plans:
Investment Management:
HSBC Global Asset Management (USA) Inc. (“HSBC” or the “Investment Adviser”), a wholly-owned subsidiary of HSBC Bank USA, N.A., a national bank organized under the laws of the United States, acts as Investment Adviser to the Portfolio pursuant to an investment management contract. As Investment Adviser, HSBC manages the investments of the Portfolio and continuously reviews, supervises, and administers the Portfolios’ investments. The Funds are not directly charged any investment management fees.
Administration:
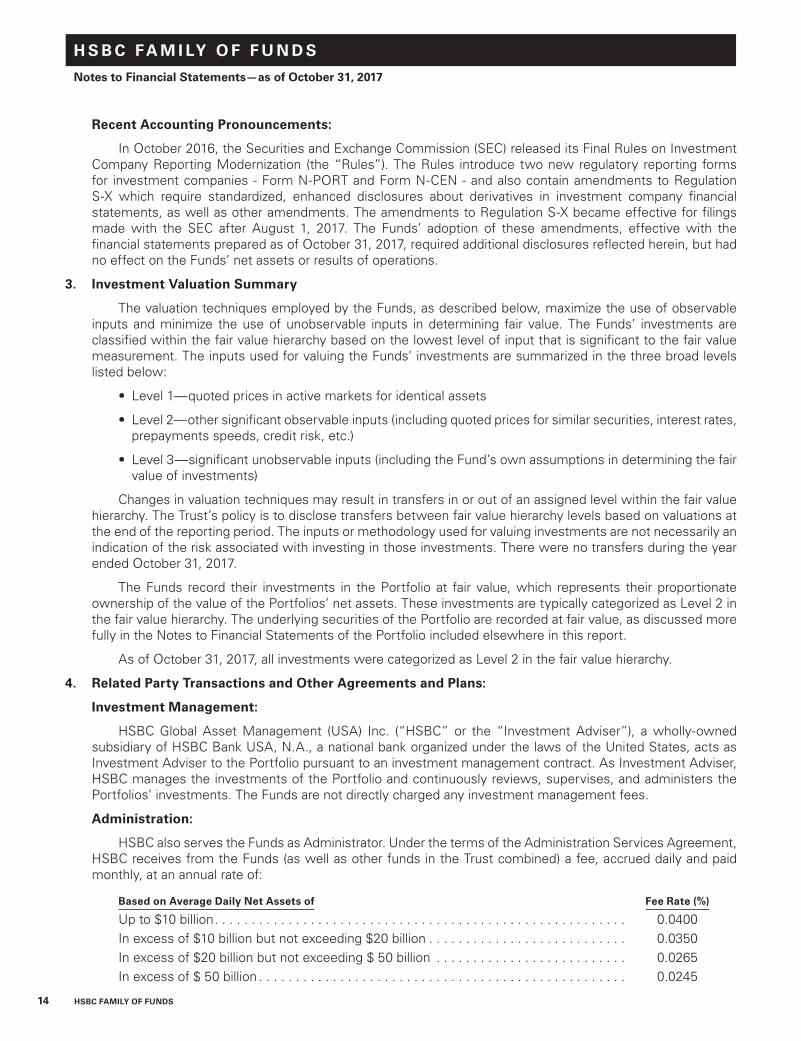
HSBC also serves the Funds as Administrator. Under the terms of the Administration Services Agreement, HSBC receives from the Funds (as well as other funds in the Trust combined) a fee, accrued daily and paid monthly, at an annual rate of:
Based on Average Daily Net Assets of Fee Rate (%)
Up to $10 billion . . . . . . . . . . . . . . . . . . . . . . . . . . . . . . . . . . . . . . . . . . . . . . . . . . . . . . . . 0.0400In excess of $10 billion but not exceeding $20 billion . . . . . . . . . . . . . . . . . . . . . . . . . . . 0.0350In excess of $20 billion but not exceeding $ 50 billion . . . . . . . . . . . . . . . . . . . . . . . . . . 0.0265In excess of $ 50 billion . . . . . . . . . . . . . . . . . . . . . . . . . . . . . . . . . . . . . . . . . . . . . . . . . . 0.0245
JOB TITLE HSBC Equity AR REVISION 15 SERIAL <12345678> DATE Saturday, December 23, 2017
JOB NUMBER 334373(1) TYPE PAGE NO. 14 OPERATOR ABIGAELS
HSBC FAMILY OF FUNDS 15
H S B C FA M I LY O F F U N D S
Notes to Financial Statements—as of October 31, 2017
The fee rates and breakpoints are determined on the basis of the aggregate average daily net assets of the Trust. For the year ended October 31, 2017, the effective annualized rate was 0.039%, prior to any fee waivers or expense reimbursements, based on the average daily net assets of the Trust. The total administration fee paid to HSBC is allocated to each series based upon its proportionate share of the aggregate net assets of the Trust. For assets invested in the Portfolio by the Funds, the Portfolio pays half of the administration fee and the Funds pay half, for a combination of the total fee rate set forth above.
Pursuant to a Sub-Administration Services Agreement with HSBC, Citi Fund Services Ohio, Inc. (“Citi”), a wholly-owned subsidiary of Citigroup, Inc., serves as the Trust’s Sub-Administrator. For these services, Citi is entitled to a fee, payable by HSBC, at an annual rate equivalent to the fee rates set forth above subject to certain reductions associated with services provided to new funds, minus 0.02% which is retained by HSBC.
Under a Compliance Services Agreement between the Trust and Citi (the “CCO Agreement”), Citi makes an employee available to serve as the Trust’s Chief Compliance Officer (the “CCO”). Under the CCO Agreement, Citi also provides infrastructure and support in implementing the written policies and procedures comprising the Trust’s compliance program, including support services to the CCO. For the services provided under the CCO Agreement, the Trust paid Citi $312,739 for the year ended October 31, 2017, plus reimbursement of certain out-of-pocket expenses. Expenses incurred by each Fund are reflected on the Statements of Operations as “Compliance Services.” Citi pays the salary and other compensation earned by individuals performing these services, as employees of Citi.
Distribution Arrangements:
On May 31, 2017, Foreside Distribution Services, L.P. (“Foreside”) announced that Lovell Minnick Partners, LLC completed its acquisition of a majority interest in Foreside Financial Group LLC, an indirect parent of Foreside. Foreside serves the Trust as Distributor (the “Distributor”). The Trust, has adopted a non-compensatory Distribution Plan and Agreement (the “Distribution Plan”) pursuant to Rule 12b-1 of the Act. The Distribution Plan provides for reimbursement of expenses incurred by the Distributor related to distribution and marketing, at a rate not to exceed 0.25%, 1.00%, and 1.00% of the average daily net assets of Class A Shares (currently not being charged), Class B Shares (currently charging 0.75%), Class C Shares (currently charging 0.75%) of the Opportunity Fund, respectively. For the year ended October 31, 2017, Foreside, as Distributor, also received $4,154 in commissions from sales of the Trust, of which $3 were reallocated to HSBC-affiliated brokers and dealers.
Shareholder Servicing:
The Trust has adopted a Shareholder Services Plan, which provides for payments to shareholder servicing agents for providing various shareholder services. For performing these services, the shareholder servicing agents receive a fee that is computed daily and paid monthly up to 0.25% of the average daily net assets of Class A Shares, Class B Shares, and Class C Shares of the Opportunity Fund. The fees paid to the Distributor pursuant to the Distribution Plan and to shareholder servicing agents pursuant to the Shareholder Services Plan may not exceed in the aggregate 0.50% annually of the average daily net assets of Class A Shares, and 1.00% of the average daily net assets of Class B Shares and Class C Shares.
The Trust has entered into shareholder services contracts with affiliated and unaffiliated financial intermediaries who provide shareholder services and other related services to their clients or customers who invest in the Funds under which the Funds will pay all or a portion of such fees earned to financial intermediaries for performing such services.
Fund Accounting and Transfer Agency:
Citi provides fund accounting services for each Fund. As fund accountant, Citi receives an annual fee per Fund and share class, subject to certain minimums, reductions associated with services provided to new funds and reimbursement of certain expenses. Citi receives additional fees paid by the Trust for regulatory administration services. Boston Financial Data Services, Inc. (“BFDS”) provides transfer agency services for each Fund. As transfer agent, BFDS receives a fee based on the number of funds and shareholder accounts, subject to certain minimums, and reimbursement of certain expenses.
JOB TITLE HSBC Equity AR REVISION 15 SERIAL <12345678> DATE Saturday, December 23, 2017
JOB NUMBER 334373(1) TYPE PAGE NO. 15 OPERATOR ABIGAELS
16 HSBC FAMILY OF FUNDS
H S B C FA M I LY O F F U N D S
Notes to Financial Statements—as of October 31, 2017
Independent Trustees:
The Trust pays an annual retainer to each Independent Trustee, plus additional annual retainers to each Committee Chair and the Chairman of the Trust’s Board of Trustees (the “Board”). The Independent Trustees also receive a fee for each regular, special in-person, and telephonic meeting of the Board attended. The aggregate amount of the fees and expenses of the Independent Trustees are allocated amongst all the funds in the Trust and are presented in the Statements of Operations.
Other:
The Funds pay fees to certain intermediaries or financial institutions for record keeping, sub-accounting services, transfer agency and other administrative services as reflected on the Statements of Operations as “Administrative Services.”
Fee Reductions:
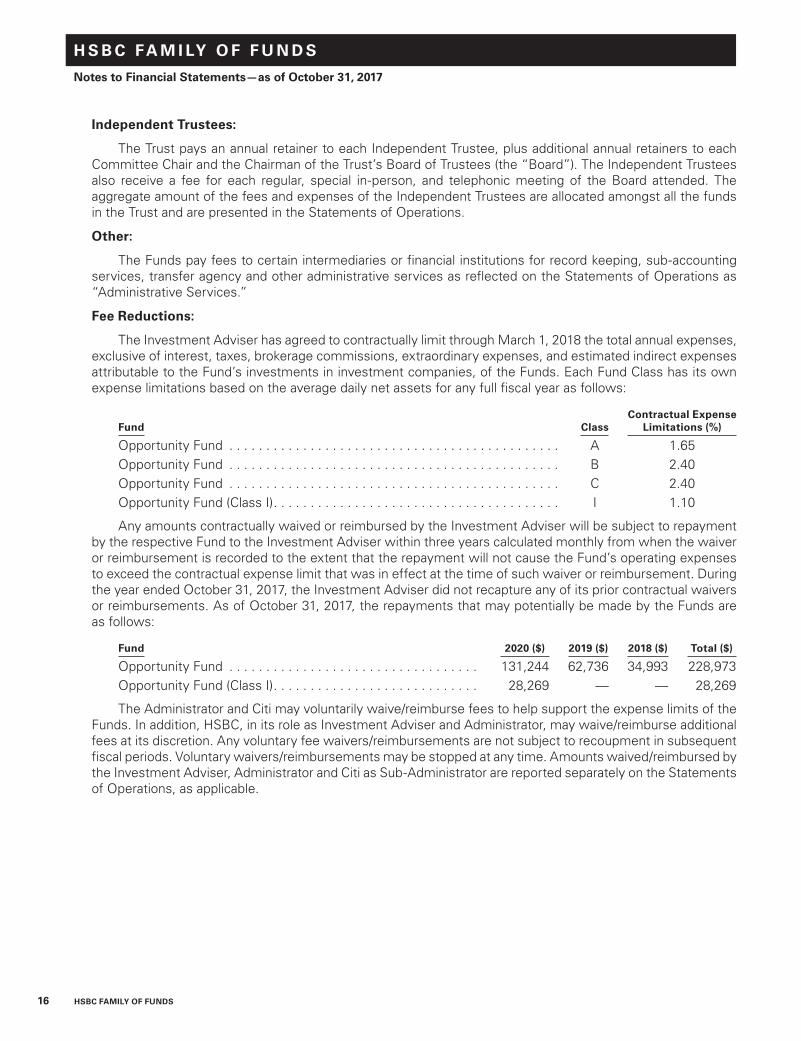
The Investment Adviser has agreed to contractually limit through March 1, 2018 the total annual expenses, exclusive of interest, taxes, brokerage commissions, extraordinary expenses, and estimated indirect expenses attributable to the Fund’s investments in investment companies, of the Funds. Each Fund Class has its own expense limitations based on the average daily net assets for any full fiscal year as follows:
Fund Class Contractual Expense
Limitations (%)
Opportunity Fund . . . . . . . . . . . . . . . . . . . . . . . . . . . . . . . . . . . . . . . . . . . . . A 1.65Opportunity Fund . . . . . . . . . . . . . . . . . . . . . . . . . . . . . . . . . . . . . . . . . . . . . B 2.40Opportunity Fund . . . . . . . . . . . . . . . . . . . . . . . . . . . . . . . . . . . . . . . . . . . . . C 2.40Opportunity Fund (Class I) . . . . . . . . . . . . . . . . . . . . . . . . . . . . . . . . . . . . . . . I 1.10
Any amounts contractually waived or reimbursed by the Investment Adviser will be subject to repayment by the respective Fund to the Investment Adviser within three years calculated monthly from when the waiver or reimbursement is recorded to the extent that the repayment will not cause the Fund’s operating expenses to exceed the contractual expense limit that was in effect at the time of such waiver or reimbursement. During the year ended October 31, 2017, the Investment Adviser did not recapture any of its prior contractual waivers or reimbursements. As of October 31, 2017, the repayments that may potentially be made by the Funds are as follows:
Fund 2020 ($) 2019 ($) 2018 ($) Total ($)
Opportunity Fund . . . . . . . . . . . . . . . . . . . . . . . . . . . . . . . . . . 131,244 62,736 34,993 228,973Opportunity Fund (Class I) . . . . . . . . . . . . . . . . . . . . . . . . . . . . 28,269 — — 28,269
The Administrator and Citi may voluntarily waive/reimburse fees to help support the expense limits of the Funds. In addition, HSBC, in its role as Investment Adviser and Administrator, may waive/reimburse additional fees at its discretion. Any voluntary fee waivers/reimbursements are not subject to recoupment in subsequent fiscal periods. Voluntary waivers/reimbursements may be stopped at any time. Amounts waived/reimbursed by the Investment Adviser, Administrator and Citi as Sub-Administrator are reported separately on the Statements of Operations, as applicable.
JOB TITLE HSBC Equity AR REVISION 15 SERIAL <12345678> DATE Saturday, December 23, 2017
JOB NUMBER 334373(1) TYPE PAGE NO. 16 OPERATOR ABIGAELS
HSBC FAMILY OF FUNDS 17
H S B C FA M I LY O F F U N D S
Notes to Financial Statements—as of October 31, 2017
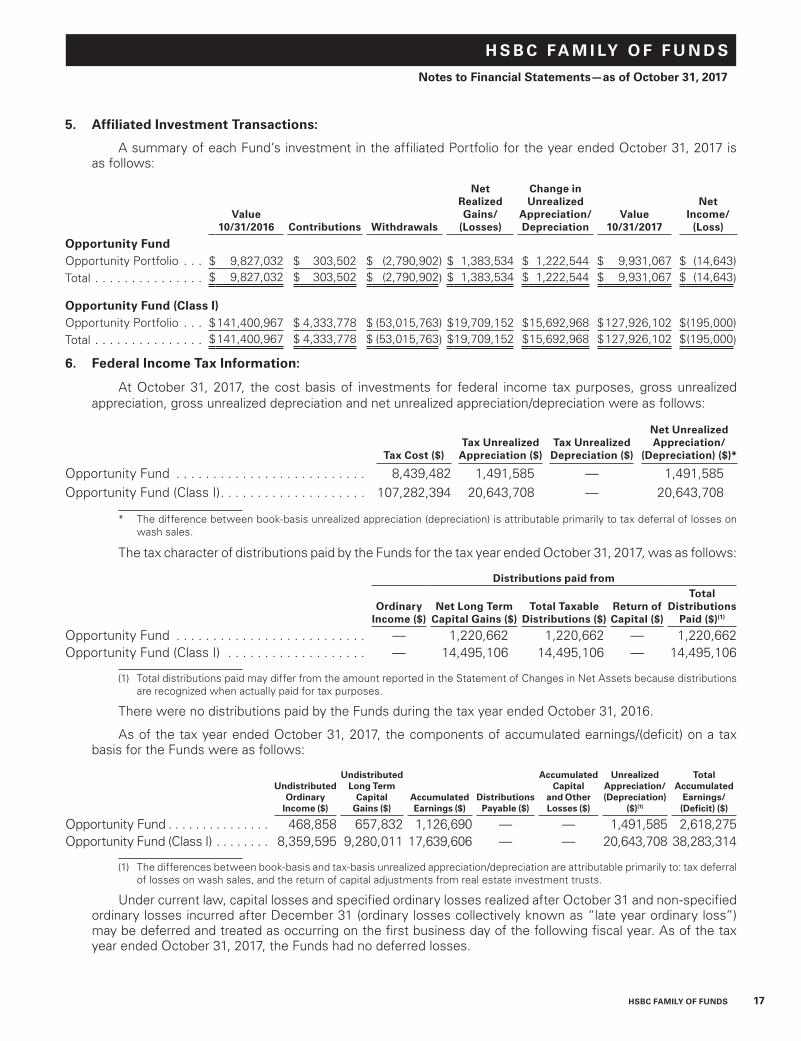
5. Affiliated Investment Transactions:
A summary of each Fund’s investment in the affiliated Portfolio for the year ended October 31, 2017 is as follows:
Value 10/31/2016 Contributions Withdrawals
Net Realized Gains/
(Losses)
Change in Unrealized
Appreciation/ Depreciation
Value 10/31/2017
Net Income/
(Loss)
Opportunity FundOpportunity Portfolio . . . $ 9,827,032 $ 303,502 $ (2,790,902) $ 1,383,534 $ 1,222,544 $ 9,931,067 $ (14,643)Total . . . . . . . . . . . . . . . $ 9,827,032 $ 303,502 $ (2,790,902) $ 1,383,534 $ 1,222,544 $ 9,931,067 $ (14,643)
Opportunity Fund (Class I)Opportunity Portfolio . . . $141,400,967 $ 4,333,778 $ (53,015,763) $19,709,152 $15,692,968 $127,926,102 $(195,000)Total . . . . . . . . . . . . . . . $141,400,967 $ 4,333,778 $ (53,015,763) $19,709,152 $15,692,968 $127,926,102 $(195,000)
6. Federal Income Tax Information:
At October 31, 2017, the cost basis of investments for federal income tax purposes, gross unrealized appreciation, gross unrealized depreciation and net unrealized appreciation/depreciation were as follows:
Tax Cost ($)Tax Unrealized
Appreciation ($)Tax Unrealized Depreciation ($)
Net Unrealized Appreciation/
(Depreciation) ($)*
Opportunity Fund . . . . . . . . . . . . . . . . . . . . . . . . . . 8,439,482 1,491,585 — 1,491,585 Opportunity Fund (Class I) . . . . . . . . . . . . . . . . . . . . 107,282,394 20,643,708 — 20,643,708
* The difference between book-basis unrealized appreciation (depreciation) is attributable primarily to tax deferral of losses on wash sales.
The tax character of distributions paid by the Funds for the tax year ended October 31, 2017, was as follows:
Distributions paid from
Ordinary Income ($)
Net Long Term Capital Gains ($)
Total Taxable Distributions ($)
Return of Capital ($)
Total Distributions
Paid ($)(1)
Opportunity Fund . . . . . . . . . . . . . . . . . . . . . . . . . . — 1,220,662 1,220,662 — 1,220,662 Opportunity Fund (Class I) . . . . . . . . . . . . . . . . . . . — 14,495,106 14,495,106 — 14,495,106
(1) Total distributions paid may differ from the amount reported in the Statement of Changes in Net Assets because distributions are recognized when actually paid for tax purposes.
There were no distributions paid by the Funds during the tax year ended October 31, 2016.
As of the tax year ended October 31, 2017, the components of accumulated earnings/(deficit) on a tax basis for the Funds were as follows:
Undistributed Ordinary
Income ($)
Undistributed Long Term
Capital Gains ($)
Accumulated Earnings ($)
Distributions Payable ($)
Accumulated Capital
and Other Losses ($)
Unrealized Appreciation/ (Depreciation)
($)(1)
Total Accumulated
Earnings/ (Deficit) ($)
Opportunity Fund . . . . . . . . . . . . . . . 468,858 657,832 1,126,690 — — 1,491,585 2,618,275Opportunity Fund (Class I) . . . . . . . . 8,359,595 9,280,011 17,639,606 — — 20,643,708 38,283,314
(1) The differences between book-basis and tax-basis unrealized appreciation/depreciation are attributable primarily to: tax deferral of losses on wash sales, and the return of capital adjustments from real estate investment trusts.
Under current law, capital losses and specified ordinary losses realized after October 31 and non-specified ordinary losses incurred after December 31 (ordinary losses collectively known as “late year ordinary loss”) may be deferred and treated as occurring on the first business day of the following fiscal year. As of the tax year ended October 31, 2017, the Funds had no deferred losses.
JOB TITLE HSBC Equity AR REVISION 15 SERIAL <12345678> DATE Saturday, December 23, 2017
JOB NUMBER 334373(1) TYPE PAGE NO. 17 OPERATOR ABIGAELS
18 HSBC FAMILY OF FUNDS
H S B C FA M I LY O F F U N D S
Notes to Financial Statements—as of October 31, 2017
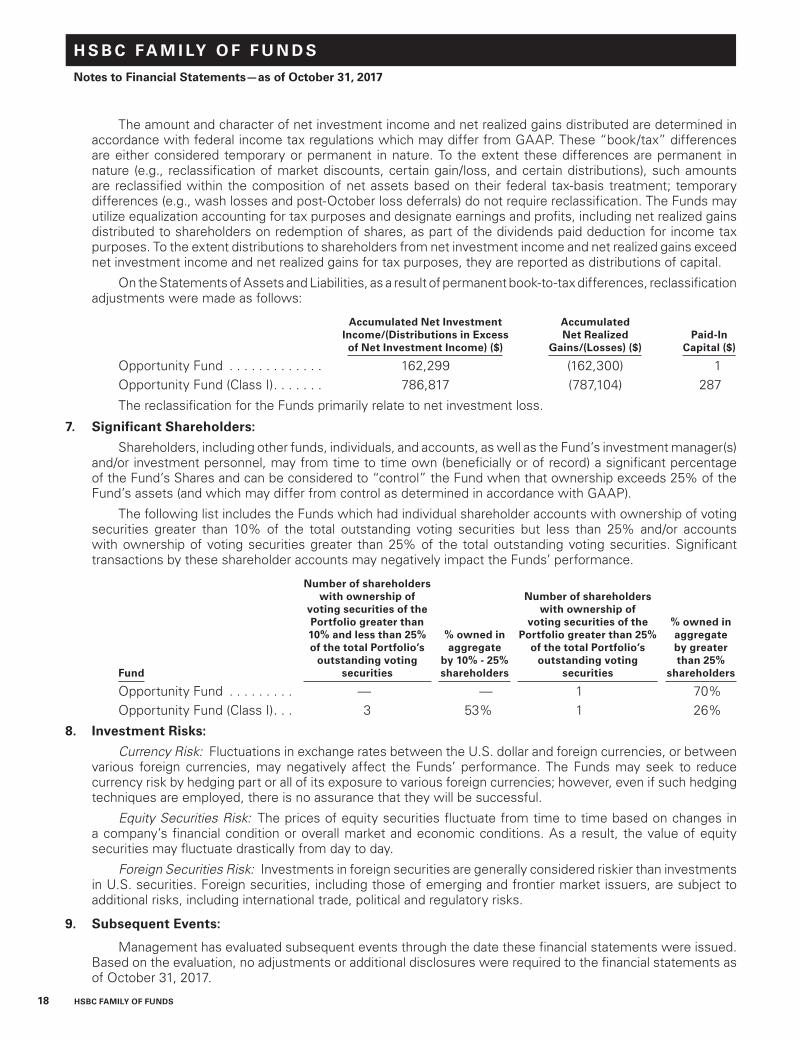
The amount and character of net investment income and net realized gains distributed are determined in accordance with federal income tax regulations which may differ from GAAP. These “book/tax” differences are either considered temporary or permanent in nature. To the extent these differences are permanent in nature (e.g., reclassification of market discounts, certain gain/loss, and certain distributions), such amounts are reclassified within the composition of net assets based on their federal tax-basis treatment; temporary differences (e.g., wash losses and post-October loss deferrals) do not require reclassification. The Funds may utilize equalization accounting for tax purposes and designate earnings and profits, including net realized gains distributed to shareholders on redemption of shares, as part of the dividends paid deduction for income tax purposes. To the extent distributions to shareholders from net investment income and net realized gains exceed net investment income and net realized gains for tax purposes, they are reported as distributions of capital.
On the Statements of Assets and Liabilities, as a result of permanent book-to-tax differences, reclassification adjustments were made as follows:
Accumulated Net Investment Income/(Distributions in Excess of Net Investment Income) ($)
Accumulated Net Realized
Gains/(Losses) ($)Paid-In
Capital ($)
Opportunity Fund . . . . . . . . . . . . . 162,299 (162,300) 1Opportunity Fund (Class I) . . . . . . . 786,817 (787,104) 287
The reclassification for the Funds primarily relate to net investment loss.
7. Significant Shareholders:
Shareholders, including other funds, individuals, and accounts, as well as the Fund’s investment manager(s) and/or investment personnel, may from time to time own (beneficially or of record) a significant percentage of the Fund’s Shares and can be considered to “control” the Fund when that ownership exceeds 25% of the Fund’s assets (and which may differ from control as determined in accordance with GAAP).
The following list includes the Funds which had individual shareholder accounts with ownership of voting securities greater than 10% of the total outstanding voting securities but less than 25% and/or accounts with ownership of voting securities greater than 25% of the total outstanding voting securities. Significant transactions by these shareholder accounts may negatively impact the Funds’ performance.
Fund
Number of shareholders with ownership of
voting securities of the Portfolio greater than 10% and less than 25% of the total Portfolio’s
outstanding voting securities
% owned in aggregate
by 10% - 25% shareholders
Number of shareholders with ownership of
voting securities of the Portfolio greater than 25%
of the total Portfolio’s outstanding voting
securities
% owned in aggregate by greater than 25%
shareholders
Opportunity Fund . . . . . . . . . — — 1 70%Opportunity Fund (Class I) . . . 3 53% 1 26%
8. Investment Risks:
Currency Risk: Fluctuations in exchange rates between the U.S. dollar and foreign currencies, or between various foreign currencies, may negatively affect the Funds’ performance. The Funds may seek to reduce currency risk by hedging part or all of its exposure to various foreign currencies; however, even if such hedging techniques are employed, there is no assurance that they will be successful.
Equity Securities Risk: The prices of equity securities fluctuate from time to time based on changes in a company’s financial condition or overall market and economic conditions. As a result, the value of equity securities may fluctuate drastically from day to day.
Foreign Securities Risk: Investments in foreign securities are generally considered riskier than investments in U.S. securities. Foreign securities, including those of emerging and frontier market issuers, are subject to additional risks, including international trade, political and regulatory risks.
9. Subsequent Events:
Management has evaluated subsequent events through the date these financial statements were issued. Based on the evaluation, no adjustments or additional disclosures were required to the financial statements as of October 31, 2017.
JOB TITLE HSBC Equity AR REVISION 15 SERIAL <12345678> DATE Saturday, December 23, 2017
JOB NUMBER 334373(1) TYPE PAGE NO. 18 OPERATOR ABIGAELS
HSBC FAMILY OF FUNDS 19
Report of Independent Registered Public Accounting Firm
To the Board of Trustees of HSBC Funds and Shareholders of HSBC Opportunity Fund and HSBC Opportunity Fund (Class I)
In our opinion, the accompanying statements of assets and liabilities and the related statements of operations and of changes in net assets and the financial highlights present fairly, in all material respects, the financial position of the HSBC Opportunity Fund and the HSBC Opportunity Fund (Class I) (two of the portfolios constituting HSBC Funds, hereafter referred to as the “Fund”) as of October 31, 2017, the results of each of their operations for the year then ended, the changes in each of their net assets for each of the two years in the period then ended and the financial highlights for each of the three years in the period then ended, in conformity with accounting principles generally accepted in the United States of America. These financial statements and financial highlights (hereafter referred to as “financial statements”) are the responsibility of the Fund’s management. Our responsibility is to express an opinion on these financial statements based on our audits. We conducted our audits of these financial statements in accordance with the standards of the Public Company Accounting Oversight Board (United States). Those standards require that we plan and perform the audit to obtain reasonable assurance about whether the financial statements are free of material misstatement. An audit includes examining, on a test basis, evidence supporting the amounts and disclosures in the financial statements, assessing the accounting principles used and significant estimates made by management, and evaluating the overall financial statement presentation. We believe that our audits, which included confirmation of securities as of October 31, 2017 by correspondence with the custodian and transfer agent, provide a reasonable basis for our opinion. The financial statements as of and for the year ended October 31, 2014 and the financial highlights for each of the periods ended on or prior to October 31, 2014 (not presented herein, other than the financial highlights) were audited by other auditors whose report dated December 23, 2014 expressed an unqualified opinion on those financial statements and financial highlights.
PricewaterhouseCoopers LLP New York, New York December 21, 2017
JOB TITLE HSBC Equity AR REVISION 15 SERIAL <12345678> DATE Saturday, December 23, 2017
JOB NUMBER 334373(1) TYPE PAGE NO. 19 OPERATOR ABIGAELS

20 HSBC FAMILY OF FUNDS
H S B C FA M I LY O F F U N D S
Other Federal Income Tax Information—as of October 31, 2017 (Unaudited)
During the year ended October 31, 2017, the following Funds declared capital gain distributions:
Short Term Capital Gain
Distributions ($)
Long Term Capital Gain
Distributions ($)
Opportunity Fund . . . . . . . . . . . . . . . . . . . . . . . . . . . . . . . . . . . . . . . . . . . . . . . — 1,220,662 Opportunity Fund (Class I) . . . . . . . . . . . . . . . . . . . . . . . . . . . . . . . . . . . . . . . . . — 14,495,106
JOB TITLE HSBC Equity AR REVISION 15 SERIAL <12345678> DATE Saturday, December 23, 2017
JOB NUMBER 334373(1) TYPE PAGE NO. 20 OPERATOR ABIGAELS
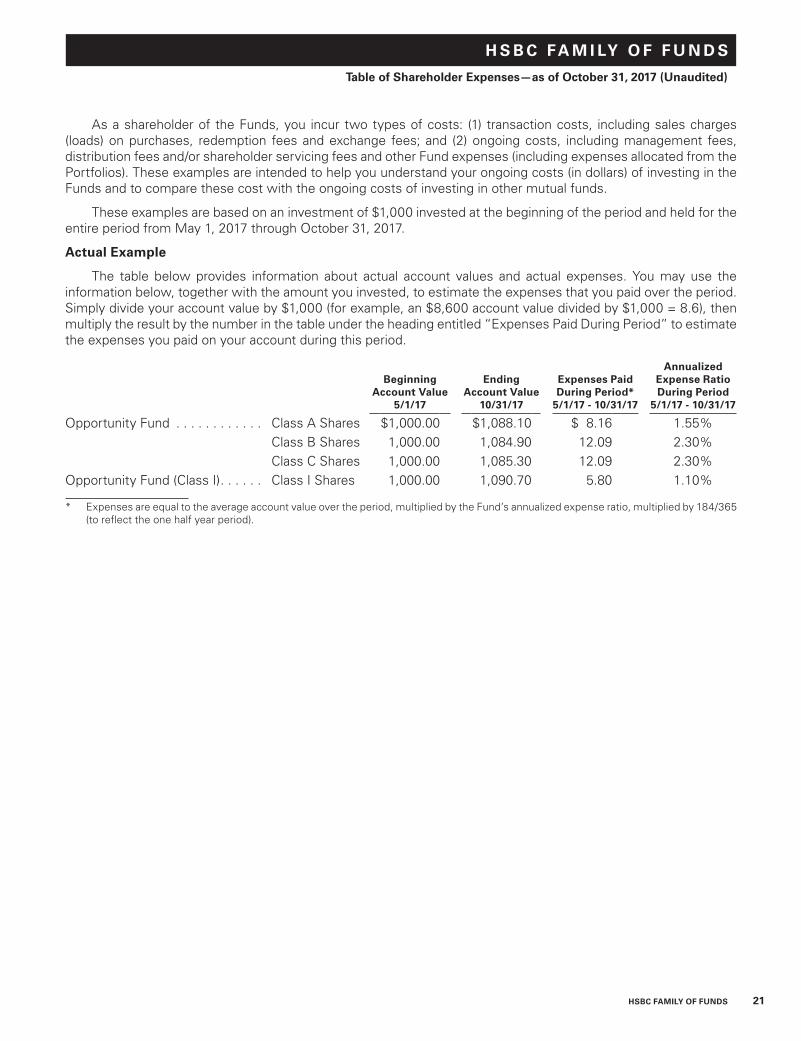
HSBC FAMILY OF FUNDS 21
H S B C FA M I LY O F F U N D S
Table of Shareholder Expenses—as of October 31, 2017 (Unaudited)
As a shareholder of the Funds, you incur two types of costs: (1) transaction costs, including sales charges (loads) on purchases, redemption fees and exchange fees; and (2) ongoing costs, including management fees, distribution fees and/or shareholder servicing fees and other Fund expenses (including expenses allocated from the Portfolios). These examples are intended to help you understand your ongoing costs (in dollars) of investing in the Funds and to compare these cost with the ongoing costs of investing in other mutual funds.
These examples are based on an investment of $1,000 invested at the beginning of the period and held for the entire period from May 1, 2017 through October 31, 2017.
Actual Example
The table below provides information about actual account values and actual expenses. You may use the information below, together with the amount you invested, to estimate the expenses that you paid over the period. Simply divide your account value by $1,000 (for example, an $8,600 account value divided by $1,000 = 8.6), then multiply the result by the number in the table under the heading entitled “Expenses Paid During Period” to estimate the expenses you paid on your account during this period.
Beginning Account Value
5/1/17
Ending Account Value
10/31/17
Expenses Paid During Period*
5/1/17 - 10/31/17
Annualized Expense Ratio During Period
5/1/17 - 10/31/17
Opportunity Fund . . . . . . . . . . . . Class A Shares $1,000.00 $1,088.10 $ 8.16 1.55%Class B Shares 1,000.00 1,084.90 12.09 2.30%Class C Shares 1,000.00 1,085.30 12.09 2.30%
Opportunity Fund (Class I) . . . . . . Class I Shares 1,000.00 1,090.70 5.80 1.10%
* Expenses are equal to the average account value over the period, multiplied by the Fund’s annualized expense ratio, multiplied by 184/365 (to reflect the one half year period).
JOB TITLE HSBC Equity AR REVISION 15 SERIAL <12345678> DATE Saturday, December 23, 2017
JOB NUMBER 334373(1) TYPE PAGE NO. 21 OPERATOR ABIGAELS
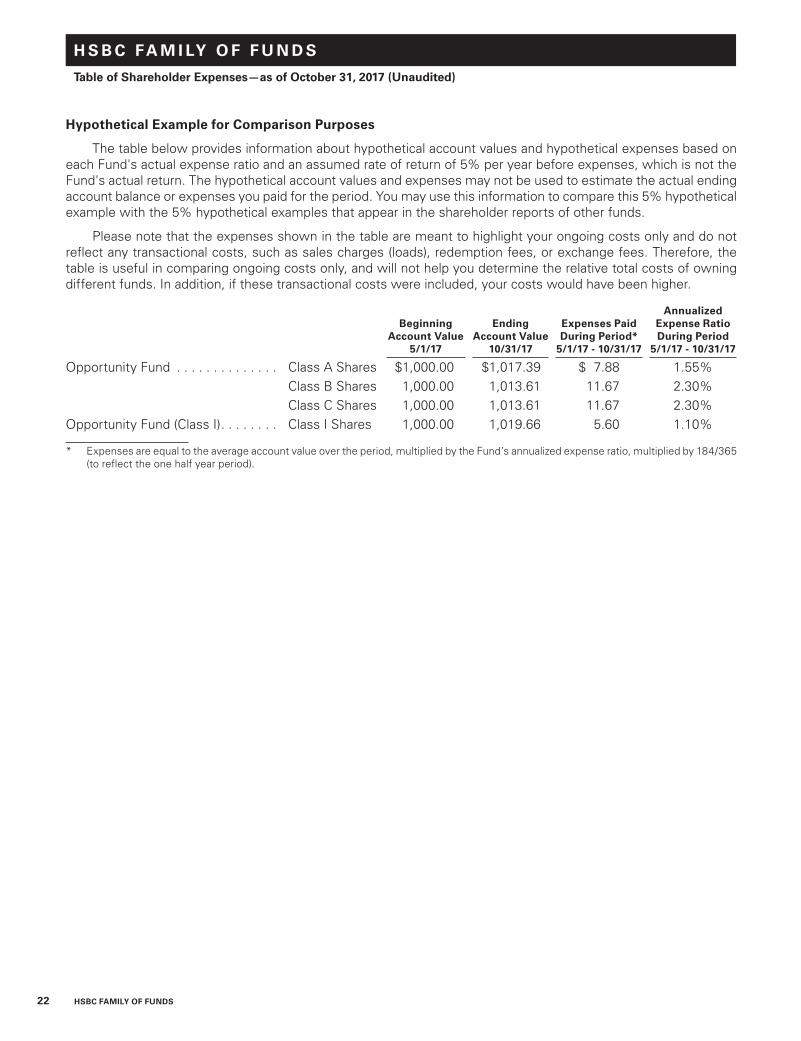
22 HSBC FAMILY OF FUNDS
H S B C FA M I LY O F F U N D S
Table of Shareholder Expenses—as of October 31, 2017 (Unaudited)
Hypothetical Example for Comparison Purposes
The table below provides information about hypothetical account values and hypothetical expenses based on each Fund's actual expense ratio and an assumed rate of return of 5% per year before expenses, which is not the Fund's actual return. The hypothetical account values and expenses may not be used to estimate the actual ending account balance or expenses you paid for the period. You may use this information to compare this 5% hypothetical example with the 5% hypothetical examples that appear in the shareholder reports of other funds.
Please note that the expenses shown in the table are meant to highlight your ongoing costs only and do not reflect any transactional costs, such as sales charges (loads), redemption fees, or exchange fees. Therefore, the table is useful in comparing ongoing costs only, and will not help you determine the relative total costs of owning different funds. In addition, if these transactional costs were included, your costs would have been higher.
Beginning Account Value
5/1/17
Ending Account Value
10/31/17
Expenses Paid During Period*
5/1/17 - 10/31/17
Annualized Expense Ratio During Period
5/1/17 - 10/31/17
Opportunity Fund . . . . . . . . . . . . . . Class A Shares $1,000.00 $1,017.39 $ 7.88 1.55%Class B Shares 1,000.00 1,013.61 11.67 2.30%Class C Shares 1,000.00 1,013.61 11.67 2.30%
Opportunity Fund (Class I) . . . . . . . . Class I Shares 1,000.00 1,019.66 5.60 1.10%
* Expenses are equal to the average account value over the period, multiplied by the Fund’s annualized expense ratio, multiplied by 184/365 (to reflect the one half year period).
JOB TITLE HSBC Equity AR REVISION 15 SERIAL <12345678> DATE Saturday, December 23, 2017
JOB NUMBER 334373(1) TYPE PAGE NO. 22 OPERATOR ABIGAELS
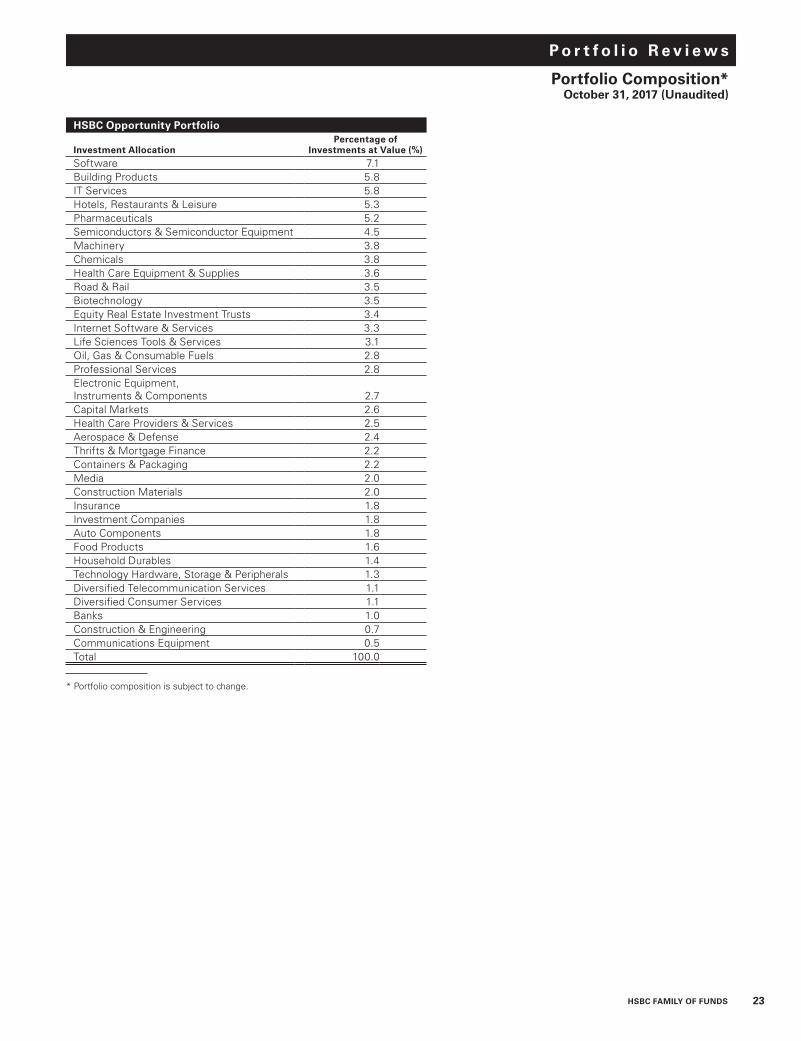
P o r t f o l i o R e v i e w s
Portfolio Composition*October 31, 2017 (Unaudited)
HSBC FAMILY OF FUNDS 23
HSBC Opportunity Portfolio
Investment AllocationPercentage of
Investments at Value (%)Software 7.1Building Products 5.8IT Services 5.8Hotels, Restaurants & Leisure 5.3Pharmaceuticals 5.2Semiconductors & Semiconductor Equipment 4.5Machinery 3.8Chemicals 3.8Health Care Equipment & Supplies 3.6Road & Rail 3.5Biotechnology 3.5Equity Real Estate Investment Trusts 3.4Internet Software & Services 3.3Life Sciences Tools & Services 3.1Oil, Gas & Consumable Fuels 2.8Professional Services 2.8Electronic Equipment, Instruments & Components 2.7Capital Markets 2.6Health Care Providers & Services 2.5Aerospace & Defense 2.4Thrifts & Mortgage Finance 2.2Containers & Packaging 2.2Media 2.0Construction Materials 2.0Insurance 1.8Investment Companies 1.8Auto Components 1.8Food Products 1.6Household Durables 1.4Technology Hardware, Storage & Peripherals 1.3Diversified Telecommunication Services 1.1Diversified Consumer Services 1.1Banks 1.0Construction & Engineering 0.7Communications Equipment 0.5Total 100.0
* Portfolio composition is subject to change.
JOB TITLE HSBC Equity AR REVISION 15 SERIAL <12345678> DATE Saturday, December 23, 2017
JOB NUMBER 334373(1) TYPE PAGE NO. 23 OPERATOR ABIGAELS
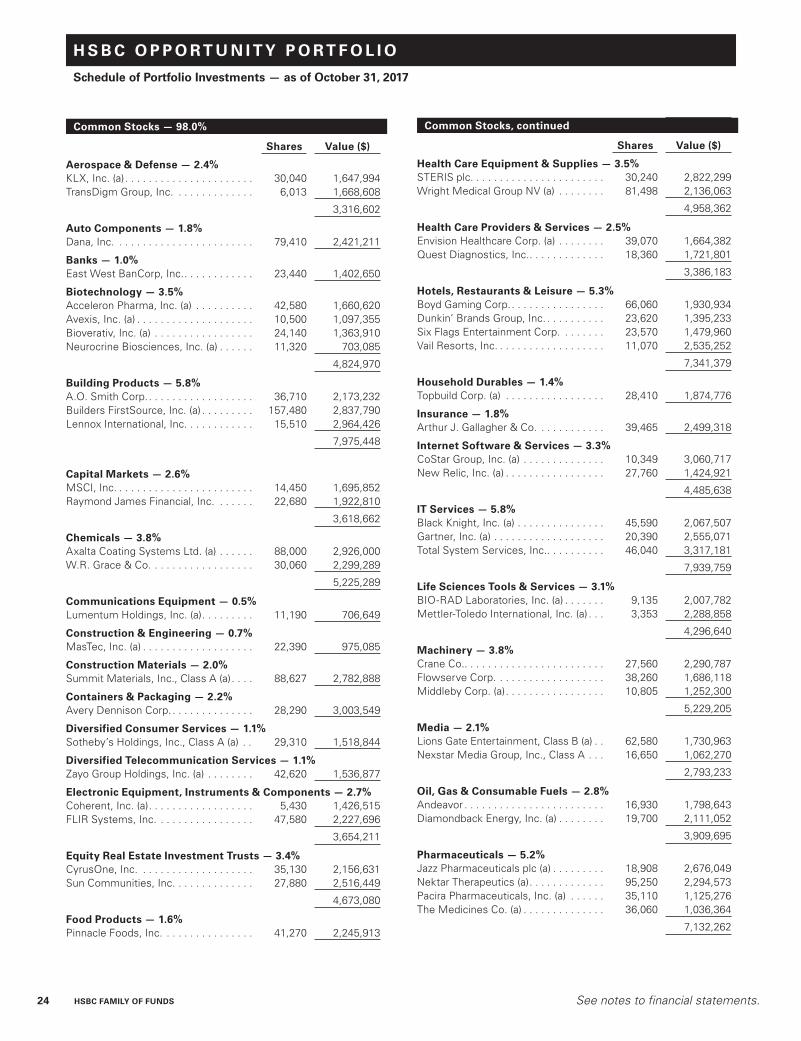
H S B C O P P O R T U N I T Y P O R T F O L I O
Schedule of Portfolio Investments — as of October 31, 2017
24 HSBC FAMILY OF FUNDS See notes to financial statements.
Common Stocks — 98.0%
Shares Value ($)
Aerospace & Defense — 2.4%KLX, Inc. (a) . . . . . . . . . . . . . . . . . . . . . . 30,040 1,647,994TransDigm Group, Inc. . . . . . . . . . . . . . 6,013 1,668,608
3,316,602
Auto Components — 1.8%Dana, Inc. . . . . . . . . . . . . . . . . . . . . . . . 79,410 2,421,211
Banks — 1.0%East West BanCorp, Inc. . . . . . . . . . . . . 23,440 1,402,650
Biotechnology — 3.5%Acceleron Pharma, Inc. (a) . . . . . . . . . . 42,580 1,660,620Avexis, Inc. (a) . . . . . . . . . . . . . . . . . . . . 10,500 1,097,355Bioverativ, Inc. (a) . . . . . . . . . . . . . . . . . 24,140 1,363,910Neurocrine Biosciences, Inc. (a) . . . . . . 11,320 703,085
4,824,970
Building Products — 5.8%A.O. Smith Corp. . . . . . . . . . . . . . . . . . . 36,710 2,173,232Builders FirstSource, Inc. (a) . . . . . . . . . 157,480 2,837,790Lennox International, Inc. . . . . . . . . . . . 15,510 2,964,426
7,975,448
Capital Markets — 2.6%MSCI, Inc. . . . . . . . . . . . . . . . . . . . . . . . 14,450 1,695,852Raymond James Financial, Inc. . . . . . . 22,680 1,922,810
3,618,662
Chemicals — 3.8%Axalta Coating Systems Ltd. (a) . . . . . . 88,000 2,926,000W.R. Grace & Co. . . . . . . . . . . . . . . . . . 30,060 2,299,289
5,225,289
Communications Equipment — 0.5%Lumentum Holdings, Inc. (a) . . . . . . . . . 11,190 706,649
Construction & Engineering — 0.7%MasTec, Inc. (a) . . . . . . . . . . . . . . . . . . . 22,390 975,085
Construction Materials — 2.0%Summit Materials, Inc., Class A (a) . . . . 88,627 2,782,888
Containers & Packaging — 2.2%Avery Dennison Corp. . . . . . . . . . . . . . . 28,290 3,003,549
Diversified Consumer Services — 1.1%Sotheby’s Holdings, Inc., Class A (a) . . 29,310 1,518,844
Diversified Telecommunication Services — 1.1%Zayo Group Holdings, Inc. (a) . . . . . . . . 42,620 1,536,877
Electronic Equipment, Instruments & Components — 2.7%Coherent, Inc. (a) . . . . . . . . . . . . . . . . . . 5,430 1,426,515FLIR Systems, Inc. . . . . . . . . . . . . . . . . 47,580 2,227,696
3,654,211
Equity Real Estate Investment Trusts — 3.4%CyrusOne, Inc. . . . . . . . . . . . . . . . . . . . 35,130 2,156,631Sun Communities, Inc. . . . . . . . . . . . . . 27,880 2,516,449
4,673,080
Food Products — 1.6%Pinnacle Foods, Inc. . . . . . . . . . . . . . . . 41,270 2,245,913
Common Stocks, continued
Shares Value ($)
Health Care Equipment & Supplies — 3.5%STERIS plc. . . . . . . . . . . . . . . . . . . . . . . 30,240 2,822,299Wright Medical Group NV (a) . . . . . . . . 81,498 2,136,063
4,958,362
Health Care Providers & Services — 2.5%Envision Healthcare Corp. (a) . . . . . . . . 39,070 1,664,382Quest Diagnostics, Inc. . . . . . . . . . . . . . 18,360 1,721,801
3,386,183
Hotels, Restaurants & Leisure — 5.3%Boyd Gaming Corp. . . . . . . . . . . . . . . . . 66,060 1,930,934Dunkin’ Brands Group, Inc. . . . . . . . . . . 23,620 1,395,233Six Flags Entertainment Corp. . . . . . . . 23,570 1,479,960Vail Resorts, Inc. . . . . . . . . . . . . . . . . . . 11,070 2,535,252
7,341,379
Household Durables — 1.4%Topbuild Corp. (a) . . . . . . . . . . . . . . . . . 28,410 1,874,776
Insurance — 1.8%Arthur J. Gallagher & Co. . . . . . . . . . . . 39,465 2,499,318
Internet Software & Services — 3.3%CoStar Group, Inc. (a) . . . . . . . . . . . . . . 10,349 3,060,717New Relic, Inc. (a) . . . . . . . . . . . . . . . . . 27,760 1,424,921
4,485,638
IT Services — 5.8%Black Knight, Inc. (a) . . . . . . . . . . . . . . . 45,590 2,067,507Gartner, Inc. (a) . . . . . . . . . . . . . . . . . . . 20,390 2,555,071Total System Services, Inc. . . . . . . . . . . 46,040 3,317,181
7,939,759
Life Sciences Tools & Services — 3.1%BIO-RAD Laboratories, Inc. (a) . . . . . . . 9,135 2,007,782Mettler-Toledo International, Inc. (a) . . . 3,353 2,288,858
4,296,640
Machinery — 3.8%Crane Co.. . . . . . . . . . . . . . . . . . . . . . . . 27,560 2,290,787Flowserve Corp. . . . . . . . . . . . . . . . . . . 38,260 1,686,118Middleby Corp. (a) . . . . . . . . . . . . . . . . . 10,805 1,252,300
5,229,205
Media — 2.1%Lions Gate Entertainment, Class B (a) . . 62,580 1,730,963Nexstar Media Group, Inc., Class A . . . 16,650 1,062,270
2,793,233
Oil, Gas & Consumable Fuels — 2.8%Andeavor . . . . . . . . . . . . . . . . . . . . . . . . 16,930 1,798,643Diamondback Energy, Inc. (a) . . . . . . . . 19,700 2,111,052
3,909,695
Pharmaceuticals — 5.2%Jazz Pharmaceuticals plc (a) . . . . . . . . . 18,908 2,676,049Nektar Therapeutics (a) . . . . . . . . . . . . . 95,250 2,294,573Pacira Pharmaceuticals, Inc. (a) . . . . . . 35,110 1,125,276The Medicines Co. (a) . . . . . . . . . . . . . . 36,060 1,036,364
7,132,262
JOB TITLE HSBC Equity AR REVISION 15 SERIAL <12345678> DATE Saturday, December 23, 2017
JOB NUMBER 334373(1) TYPE PAGE NO. 24 OPERATOR ABIGAELS
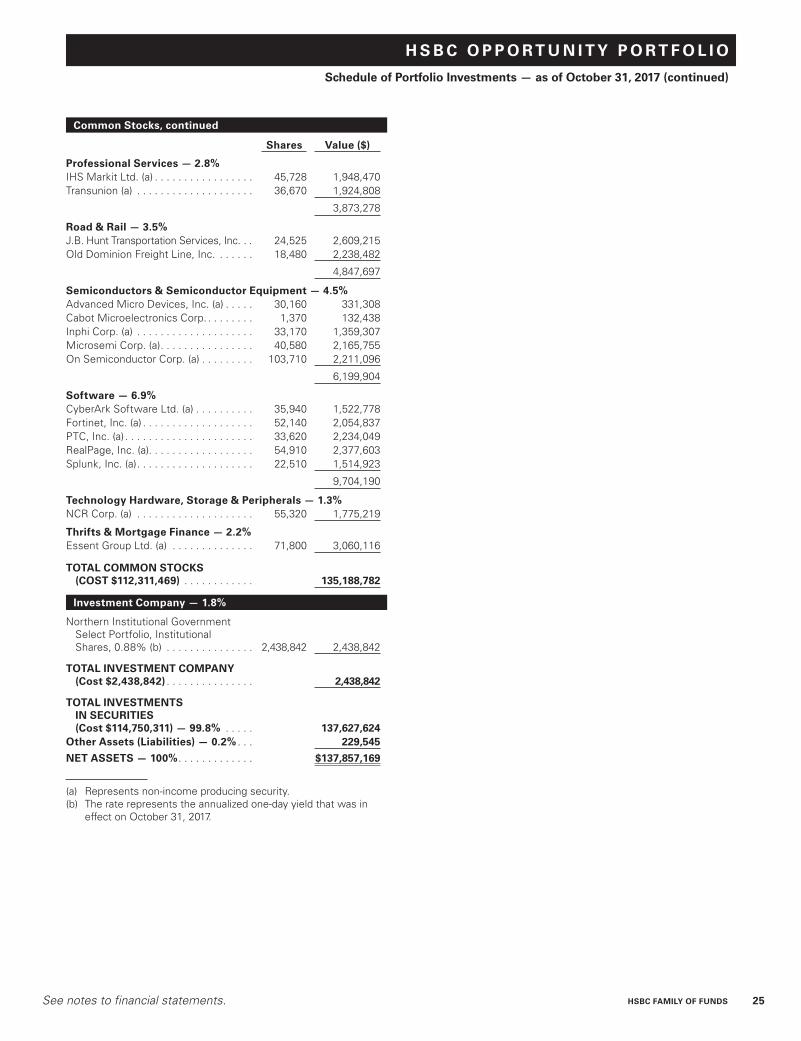
H S B C O P P O R T U N I T Y P O R T F O L I O
Schedule of Portfolio Investments — as of October 31, 2017 (continued)
See notes to financial statements. HSBC FAMILY OF FUNDS 25
Common Stocks, continued
Shares Value ($)
Professional Services — 2.8%IHS Markit Ltd. (a) . . . . . . . . . . . . . . . . . 45,728 1,948,470Transunion (a) . . . . . . . . . . . . . . . . . . . . 36,670 1,924,808
3,873,278
Road & Rail — 3.5%J.B. Hunt Transportation Services, Inc. . . 24,525 2,609,215Old Dominion Freight Line, Inc. . . . . . . 18,480 2,238,482
4,847,697
Semiconductors & Semiconductor Equipment — 4.5%Advanced Micro Devices, Inc. (a) . . . . . 30,160 331,308Cabot Microelectronics Corp. . . . . . . . . 1,370 132,438Inphi Corp. (a) . . . . . . . . . . . . . . . . . . . . 33,170 1,359,307Microsemi Corp. (a) . . . . . . . . . . . . . . . . 40,580 2,165,755On Semiconductor Corp. (a) . . . . . . . . . 103,710 2,211,096
6,199,904
Software — 6.9%CyberArk Software Ltd. (a) . . . . . . . . . . 35,940 1,522,778Fortinet, Inc. (a) . . . . . . . . . . . . . . . . . . . 52,140 2,054,837PTC, Inc. (a) . . . . . . . . . . . . . . . . . . . . . . 33,620 2,234,049RealPage, Inc. (a). . . . . . . . . . . . . . . . . . 54,910 2,377,603Splunk, Inc. (a) . . . . . . . . . . . . . . . . . . . . 22,510 1,514,923
9,704,190
Technology Hardware, Storage & Peripherals — 1.3%NCR Corp. (a) . . . . . . . . . . . . . . . . . . . . 55,320 1,775,219
Thrifts & Mortgage Finance — 2.2%Essent Group Ltd. (a) . . . . . . . . . . . . . . 71,800 3,060,116
TOTAL COMMON STOCKS (COST $112,311,469) . . . . . . . . . . . . 135,188,782
Investment Company — 1.8%
Northern Institutional Government Select Portfolio, Institutional Shares, 0.88% (b) . . . . . . . . . . . . . . . 2,438,842 2,438,842
TOTAL INVESTMENT COMPANY (Cost $2,438,842) . . . . . . . . . . . . . . . 2,438,842
TOTAL INVESTMENTS IN SECURITIES (Cost $114,750,311) — 99.8% . . . . . 137,627,624
Other Assets (Liabilities) — 0.2% . . . 229,545
NET ASSETS — 100% . . . . . . . . . . . . . $137,857,169
(a) Represents non-income producing security. (b) The rate represents the annualized one-day yield that was in
effect on October 31, 2017.
JOB TITLE HSBC Equity AR REVISION 15 SERIAL <12345678> DATE Saturday, December 23, 2017
JOB NUMBER 334373(1) TYPE PAGE NO. 25 OPERATOR ABIGAELS
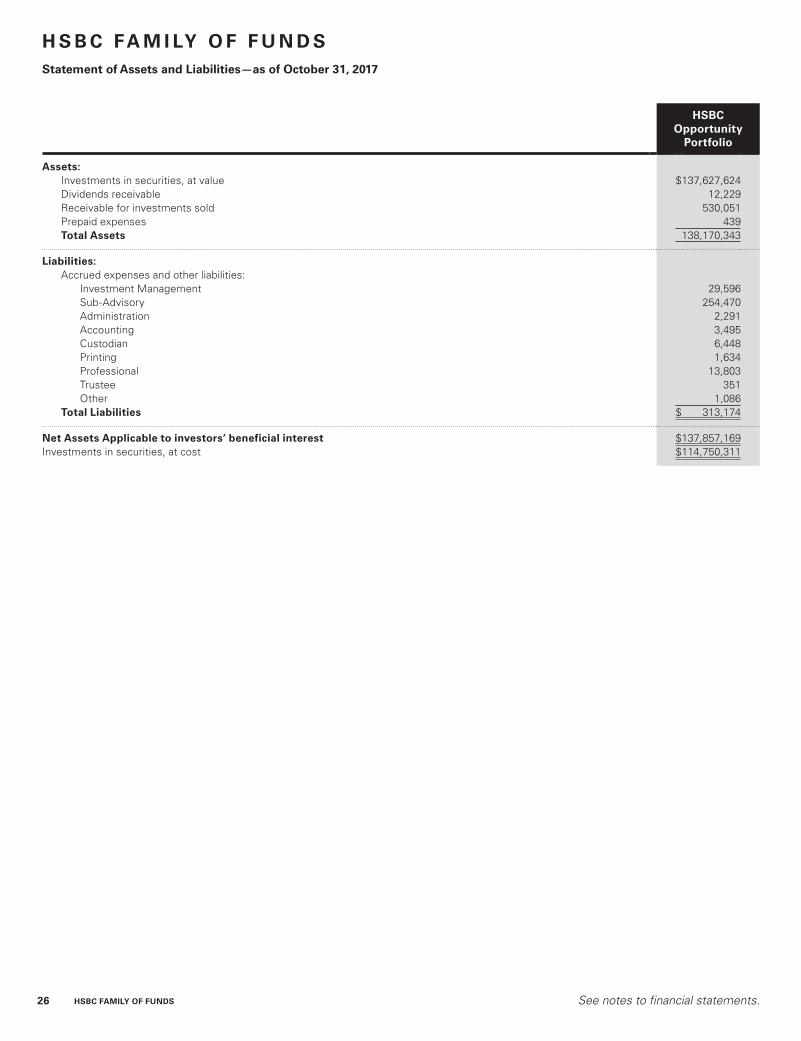
26 HSBC FAMILY OF FUNDS See notes to financial statements.
H S B C FA M I LY O F F U N D SStatement of Assets and Liabilities—as of October 31, 2017
HSBC Opportunity
Portfolio
Assets:Investments in securities, at value $137,627,624Dividends receivable 12,229Receivable for investments sold 530,051Prepaid expenses 439Total Assets 138,170,343
Liabilities:Accrued expenses and other liabilities:
Investment Management 29,596Sub-Advisory 254,470Administration 2,291Accounting 3,495Custodian 6,448Printing 1,634Professional 13,803Trustee 351Other 1,086
Total Liabilities $ 313,174
Net Assets Applicable to investors’ beneficial interest $137,857,169Investments in securities, at cost $114,750,311
JOB TITLE HSBC Equity AR REVISION 15 SERIAL <12345678> DATE Saturday, December 23, 2017
JOB NUMBER 334373(1) TYPE PAGE NO. 26 OPERATOR ABIGAELS
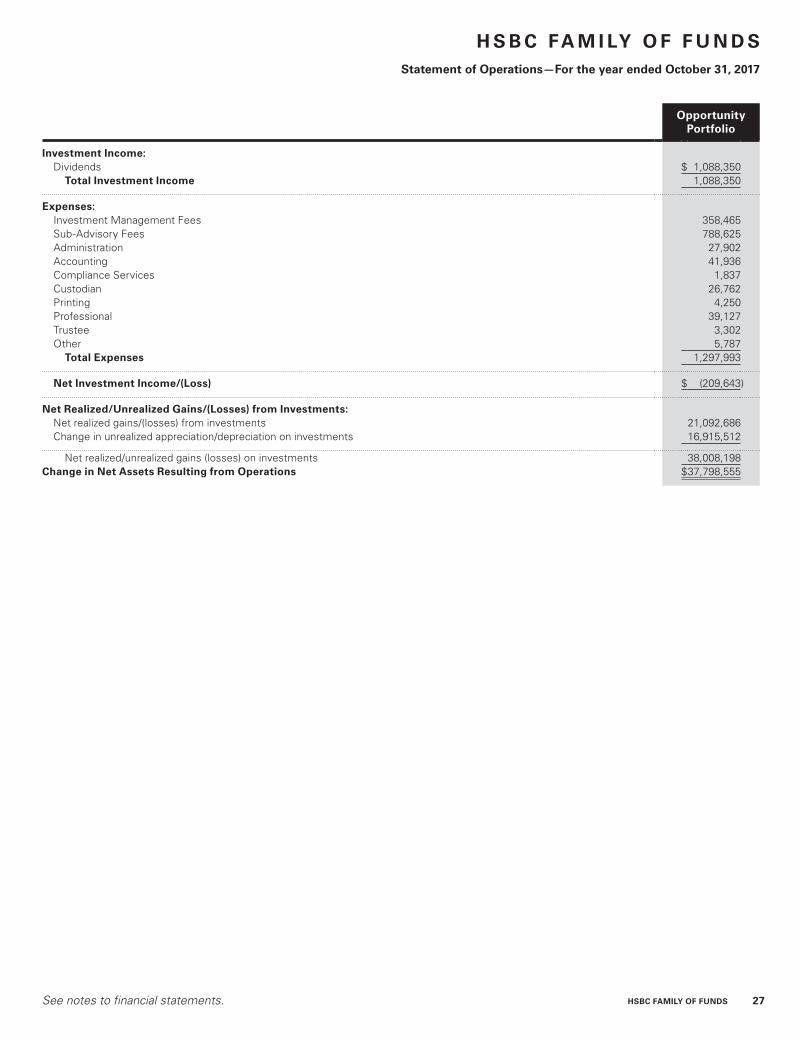
See notes to financial statements. HSBC FAMILY OF FUNDS 27
H S B C FA M I LY O F F U N D SStatement of Operations—For the year ended October 31, 2017
Opportunity Portfolio
Investment Income:Dividends $ 1,088,350
Total Investment Income 1,088,350
Expenses:Investment Management Fees 358,465Sub-Advisory Fees 788,625Administration 27,902Accounting 41,936Compliance Services 1,837Custodian 26,762Printing 4,250Professional 39,127Trustee 3,302Other 5,787
Total Expenses 1,297,993
Net Investment Income/(Loss) $ (209,643)
Net Realized/Unrealized Gains/(Losses) from Investments:Net realized gains/(losses) from investments 21,092,686Change in unrealized appreciation/depreciation on investments 16,915,512
Net realized/unrealized gains (losses) on investments 38,008,198Change in Net Assets Resulting from Operations $37,798,555
JOB TITLE HSBC Equity AR REVISION 15 SERIAL <12345678> DATE Saturday, December 23, 2017
JOB NUMBER 334373(1) TYPE PAGE NO. 27 OPERATOR ABIGAELS
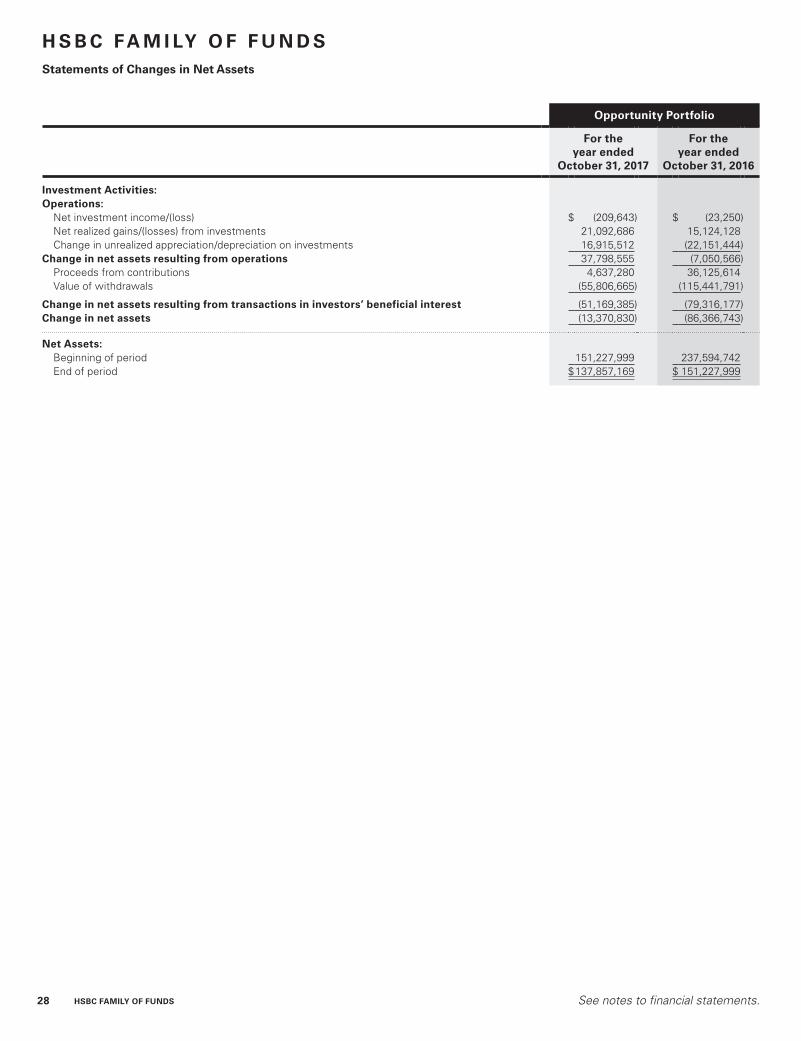
28 HSBC FAMILY OF FUNDS See notes to financial statements.
H S B C FA M I LY O F F U N D SStatements of Changes in Net Assets
Opportunity Portfolio
For the year ended
October 31, 2017
For the year ended
October 31, 2016
Investment Activities:Operations:
Net investment income/(loss) $ (209,643) $ (23,250)Net realized gains/(losses) from investments 21,092,686 15,124,128Change in unrealized appreciation/depreciation on investments 16,915,512 (22,151,444)
Change in net assets resulting from operations 37,798,555 (7,050,566)Proceeds from contributions 4,637,280 36,125,614Value of withdrawals (55,806,665) (115,441,791)
Change in net assets resulting from transactions in investors’ beneficial interest (51,169,385) (79,316,177)Change in net assets (13,370,830) (86,366,743)
Net Assets:Beginning of period 151,227,999 237,594,742End of period $137,857,169 $ 151,227,999
JOB TITLE HSBC Equity AR REVISION 15 SERIAL <12345678> DATE Saturday, December 23, 2017
JOB NUMBER 334373(1) TYPE PAGE NO. 28 OPERATOR ABIGAELS
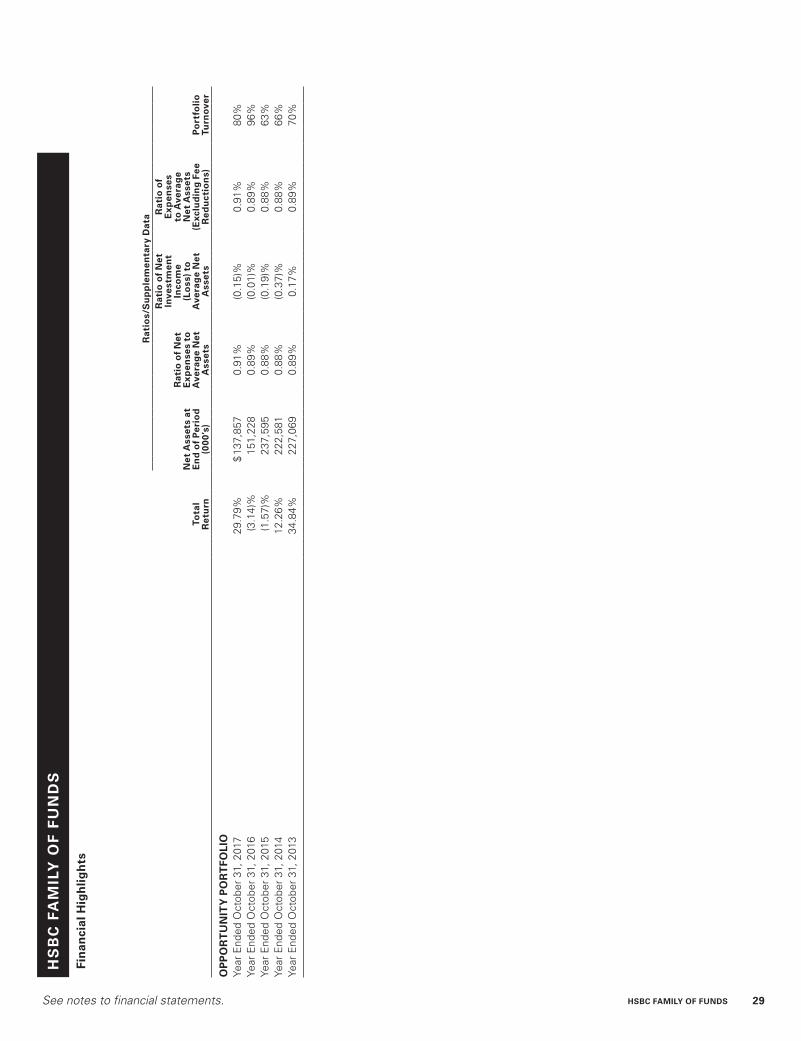
See notes to financial statements. HSBC FAMILY OF FUNDS 29
HS
BC
FA
MIL
Y O
F F
UN
DS
Fin
anci
al H
igh
ligh
ts
Rat
ios/
Su
pp
lem
enta
ry D
ata
Tota
l R
etu
rn
Net
Ass
ets
at
En
d o
f P
erio
d
(000
’s)
Rat
io o
f N
et
Exp
ense
s to
A
vera
ge
Net
A
sset
s
Rat
io o
f N
et
Inve
stm
ent
Inco
me
(Lo
ss)
to
Ave
rag
e N
et
Ass
ets
Rat
io o
f E
xpen
ses
to A
vera
ge
Net
Ass
ets
(Exc
lud
ing
Fee
R
edu
ctio
ns)
Po
rtfo
lio
Tu
rno
ver
OP
PO
RT
UN
ITY
PO
RT
FOLI
OYe
ar E
nded
Oct
ober
31,
201
729
.79%
$13
7,85
70.
91%
(0.1
5)%
0.91
%80
%Ye
ar E
nded
Oct
ober
31,
201
6(3
.14)
%15
1,22
80.
89%
(0.0
1)%
0.89
%96
%Ye
ar E
nded
Oct
ober
31,
201
5(1
.57)
%23
7,59
50.
88%
(0.1
9)%
0.88
%63
%Ye
ar E
nded
Oct
ober
31,
201
412
.26%
222,
581
0.88
%(0
.37)
%0.
88%
66%
Year
End
ed O
ctob
er 3
1, 2
013
34.8
4%22
7,06
90.
89%
0.17
%0.
89%
70%
JOB TITLE HSBC Equity AR REVISION 15 SERIAL <12345678> DATE Saturday, December 23, 2017
JOB NUMBER 334373(1) TYPE PAGE NO. 29 OPERATOR ABIGAELS
30 HSBC FAMILY OF FUNDS
Notes to Financial Statements—as of October 31, 2017
HSBC FAM ILY OF FUNDS
1. Organization:
The HSBC Funds (the “Trust”), a Delaware statutory trust organized on March 2, 2016, is registered under the Investment Company Act of 1940, as amended (the “Act”), as an open-end management investment company. Effective June 24, 2016, the Portfolio (as defined below), which was a series of HSBC Portfolios, a trust organized under the laws of the State of New York, reorganized with and into a corresponding series of the Trust (the “Reorganization”). The series of the Trust into which the Portfolio reorganized had no assets, liabilities, or operations prior to the Reorganization. Upon completion of the Reorganization, the Portfolio assumed the performance, financial and other historical information of its corresponding predecessor series. As of October 31, 2017, the Trust is composed of 13 separate operational funds, each a series of the HSBC Family of Funds. The accompanying financial statements are presented for the HSBC Opportunity Portfolio (the “Portfolio”).
The Portfolio operates as a master fund in master-feeder arrangements, in which - the Funds invest all or part of their investable assets in the Portfolio. The Agreement and Declaration of Trust permits the Board of Trustees (the “Board”) to issue an unlimited number of beneficial interests in the Portfolio.
The Portfolio is a diversified series of the Trust. Financial statements for all other funds of the Trust are published separately.
The following represents each feeder fund’s proportionate ownership interest in the Portfolio:
Fund
Proportionate Ownership Interest on
October 31, 2017 (%)
Opportunity Fund . . . . . . . . . . . . . . . . . . . . . . . . . . . . . . . . . . . . . . . . . . . . . . . . 7.2Opportunity Fund (Class I) . . . . . . . . . . . . . . . . . . . . . . . . . . . . . . . . . . . . . . . . . . 92.8
Under the Trust’s organizational documents, the Trust’s officers and Trustees are indemnified against certain liabilities arising out of the performance of their duties to the Portfolio. In addition, in the normal course of business, the Trust enters into contracts with its service providers, which also provide for indemnifications by the Portfolio. The Portfolio’s maximum exposure under these arrangements is unknown as this would involve future claims that may be made against the Portfolio. However, based on experience, the Trust believes the risk of loss to be remote.
The Portfolio is an investment company and follows accounting and reporting guidance under Financial Accounting Standards Board (“FASB”) Accounting Standards Codification (“ASC”) Topic 946, “Financial Services-Investment Companies.”
2. Significant Accounting Policies:
The following is a summary of the significant accounting policies followed by the Portfolio in the preparation of its financial statements. The policies are in conformity with generally accepted accounting principles (“GAAP”) in the United States of America. The preparation of financial statements requires management to make certain estimates and assumptions that affect the reported amounts of assets and liabilities and disclosure of contingent assets and liabilities at the date of the financial statements and the reported amounts of increases and decreases in net assets from operations during the reporting period. Actual results could differ from those estimates.
Securities Valuation:
The Portfolio records its investments at fair value. Fair value is defined as the price that would be received to sell an asset or paid to transfer a liability in an orderly transaction between market participants at the measurement date. The valuation techniques used to determine fair value are further described in Note 3 below.
JOB TITLE HSBC Equity AR REVISION 15 SERIAL <12345678> DATE Saturday, December 23, 2017
JOB NUMBER 334373(1) TYPE PAGE NO. 30 OPERATOR ABIGAELS
HSBC FAMILY OF FUNDS 31
Notes to Financial Statements—as of October 31, 2017 (continued)
HSBC FAM ILY OF FUNDS
Investment Transactions and Related Income:
Investment transactions are accounted for no later than one business day after trade date. However, for financial reporting purposes, investment transactions are accounted for on trade date. Investment gains and losses are calculated on the identified cost basis. Interest income is recognized on the accrual basis and includes, where applicable, the amortization or accretion of premium or discount based on effective yield. Dividend income is recorded on the ex-dividend date.
The Portfolio makes an allocation of its investment income, expenses and realized gains and losses from securities transactions to its investors in proportion to their investment in the Portfolio on the date of such accrual or gain/loss.
Restricted Securities and Illiquid Securities:
The Portfolio may invest in restricted securities. A restricted security is a security which has been purchased through a private offering and cannot be resold to the general public without prior registration under the Securities Act of 1933 (the “1933 Act”) or pursuant to the resale limitations provided by Rule 144 under the 1933 Act, or another exemption from the registration requirements of the 1933 Act. Certain restricted securities may be resold in transactions exempt from registration, normally to qualified institutional buyers, and may be deemed liquid by the Investment Adviser (as defined in Note 4) based on procedures established by the Board. Therefore, not all restricted securities are considered illiquid. To the extent that the Portfolio purchases securities that are restricted as to resale or for which current market quotations are not available, such securities will be valued based upon all relevant factors as outlined in Securities and Exchange Commission (SEC) Financial Reporting Release No. 1. Disposal of restricted securities may involve time consuming negotiations and expense. Prompt sale at the current valuation may be difficult and could adversely affect the net assets of the Portfolio.
Allocations:
Expenses directly attributable to the Portfolio are charged to the Portfolio. Expenses not directly attributable to the Portfolio are allocated among the Portfolio and applicable series within the Trust in relation to the net assets of each fund, equally to each fund, or another appropriate basis.
Federal Income Taxes:
The Portfolio is treated as a partnership for U.S. federal income tax purposes. Accordingly, the Portfolio passes through all of its net investment income and gains and losses to its feeder funds, and is therefore not subject to U.S. federal income tax. As such, investors in the Portfolio are allocated for tax purposes their respective share of the Portfolio’s ordinary income and realized gains or losses. It is intended that the Portfolio will be managed in such a way that an investor will be able to satisfy the requirements of the Internal Revenue Code, as amended, applicable to regulated investment companies.
Management of the Portfolio has reviewed tax positions taken in tax years that remain subject to examination by all major tax jurisdictions, including federal (i.e., the last four tax year ends and the interim tax period since then, as applicable). Management believes that there is no tax liability resulting from unrecognized tax benefits related to uncertain tax positions taken. Management’s conclusions may be subject to future review based on changes in, or interpretation of, accounting standards or tax laws and regulations.
Recent Accounting Pronouncements:
In October 2016, the SEC released its Final Rules on Investment Company Reporting Modernization (the “Rules”). The Rules introduce two new regulatory reporting forms for investment companies - Form N-PORT and Form N-CEN – and also contain amendments to Regulation S-X which require standardized, enhanced disclosures about derivatives in investment company financial statements, as well as other amendments. The amendments to Regulation S-X became effective for filings made with the SEC after August 1, 2017. The Portfolio’s adoption of these amendments, effective with the financial statements prepared as of October 31, 2017, required additional disclosures reflected herein, but had no effect on the Portfolio’s net assets or results of operations.
JOB TITLE HSBC Equity AR REVISION 15 SERIAL <12345678> DATE Saturday, December 23, 2017
JOB NUMBER 334373(1) TYPE PAGE NO. 31 OPERATOR ABIGAELS
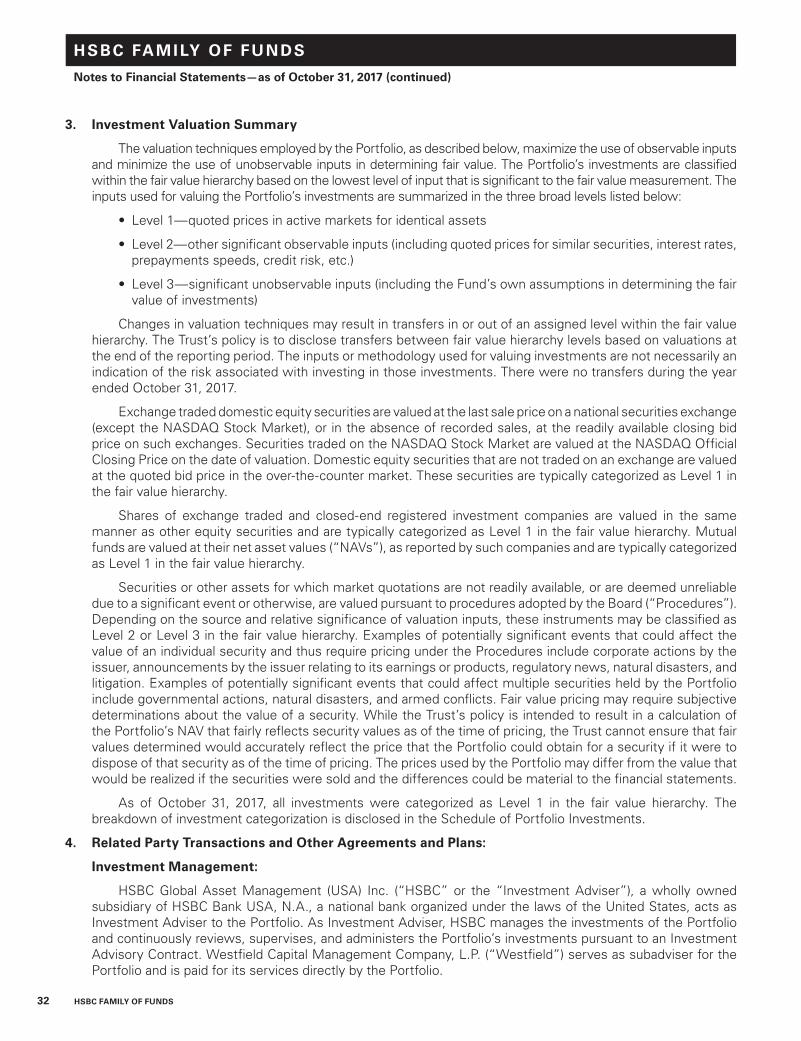
32 HSBC FAMILY OF FUNDS
Notes to Financial Statements—as of October 31, 2017 (continued)
HSBC FAM ILY OF FUNDS
3. Investment Valuation Summary
The valuation techniques employed by the Portfolio, as described below, maximize the use of observable inputs and minimize the use of unobservable inputs in determining fair value. The Portfolio’s investments are classified within the fair value hierarchy based on the lowest level of input that is significant to the fair value measurement. The inputs used for valuing the Portfolio’s investments are summarized in the three broad levels listed below:
• Level 1—quoted prices in active markets for identical assets
• Level 2—other significant observable inputs (including quoted prices for similar securities, interest rates, prepayments speeds, credit risk, etc.)
• Level 3—significant unobservable inputs (including the Fund’s own assumptions in determining the fair value of investments)
Changes in valuation techniques may result in transfers in or out of an assigned level within the fair value hierarchy. The Trust’s policy is to disclose transfers between fair value hierarchy levels based on valuations at the end of the reporting period. The inputs or methodology used for valuing investments are not necessarily an indication of the risk associated with investing in those investments. There were no transfers during the year ended October 31, 2017.
Exchange traded domestic equity securities are valued at the last sale price on a national securities exchange (except the NASDAQ Stock Market), or in the absence of recorded sales, at the readily available closing bid price on such exchanges. Securities traded on the NASDAQ Stock Market are valued at the NASDAQ Official Closing Price on the date of valuation. Domestic equity securities that are not traded on an exchange are valued at the quoted bid price in the over-the-counter market. These securities are typically categorized as Level 1 in the fair value hierarchy.
Shares of exchange traded and closed-end registered investment companies are valued in the same manner as other equity securities and are typically categorized as Level 1 in the fair value hierarchy. Mutual funds are valued at their net asset values (“NAVs”), as reported by such companies and are typically categorized as Level 1 in the fair value hierarchy.
Securities or other assets for which market quotations are not readily available, or are deemed unreliable due to a significant event or otherwise, are valued pursuant to procedures adopted by the Board (“Procedures”). Depending on the source and relative significance of valuation inputs, these instruments may be classified as Level 2 or Level 3 in the fair value hierarchy. Examples of potentially significant events that could affect the value of an individual security and thus require pricing under the Procedures include corporate actions by the issuer, announcements by the issuer relating to its earnings or products, regulatory news, natural disasters, and litigation. Examples of potentially significant events that could affect multiple securities held by the Portfolio include governmental actions, natural disasters, and armed conflicts. Fair value pricing may require subjective determinations about the value of a security. While the Trust’s policy is intended to result in a calculation of the Portfolio’s NAV that fairly reflects security values as of the time of pricing, the Trust cannot ensure that fair values determined would accurately reflect the price that the Portfolio could obtain for a security if it were to dispose of that security as of the time of pricing. The prices used by the Portfolio may differ from the value that would be realized if the securities were sold and the differences could be material to the financial statements.
As of October 31, 2017, all investments were categorized as Level 1 in the fair value hierarchy. The breakdown of investment categorization is disclosed in the Schedule of Portfolio Investments.
4. Related Party Transactions and Other Agreements and Plans:
Investment Management:
HSBC Global Asset Management (USA) Inc. (“HSBC” or the “Investment Adviser”), a wholly owned subsidiary of HSBC Bank USA, N.A., a national bank organized under the laws of the United States, acts as Investment Adviser to the Portfolio. As Investment Adviser, HSBC manages the investments of the Portfolio and continuously reviews, supervises, and administers the Portfolio’s investments pursuant to an Investment Advisory Contract. Westfield Capital Management Company, L.P. (“Westfield”) serves as subadviser for the Portfolio and is paid for its services directly by the Portfolio.
JOB TITLE HSBC Equity AR REVISION 15 SERIAL <12345678> DATE Saturday, December 23, 2017
JOB NUMBER 334373(1) TYPE PAGE NO. 32 OPERATOR ABIGAELS
HSBC FAMILY OF FUNDS 33
Notes to Financial Statements—as of October 31, 2017 (continued)
HSBC FAM ILY OF FUNDS
For their services, the Investment Adviser and Westfield receive in aggregate, a fee, accrued daily and paid monthly, at an annual rate of 0.80% of the Portfolio’s average daily net assets. Currently, the Investment Adviser’s contractual fee is 0.25% and Westfield’s contractual fee is 0.55%.
Administration:
HSBC also serves the Portfolio as Administrator. Under the terms of the Administration Services Agreement, HSBC receives from the Portfolio (as well as other funds in the Trust combined) a fee, accrued daily and paid monthly, at an annual rate of:
Based on Average Daily Net Assets of Fee Rate (%)
Up to $10 billion . . . . . . . . . . . . . . . . . . . . . . . . . . . . . . . . . . . . . . . . . . . . . . . . . . . . . . . . 0.0400In excess of $10 billion but not exceeding $20 billion . . . . . . . . . . . . . . . . . . . . . . . . . . . 0.0350In excess of $20 billion but not exceeding $ 50 billion . . . . . . . . . . . . . . . . . . . . . . . . . . 0.0265In excess of $ 50 billion . . . . . . . . . . . . . . . . . . . . . . . . . . . . . . . . . . . . . . . . . . . . . . . . . . 0.0245
The fee rates and breakpoints are determined on the basis of the aggregate average daily net assets of the Trust, however, the assets of the funds of the HSBC Funds that invest in the Portfolio are not double-counted. For the year ended October 31, 2017, the effective annualized rate was 0.039%, prior to any fee waivers or expense reimbursements, based on the average daily net assets of the Trust. The total administration fee paid to HSBC is allocated to each series based upon its proportionate share of the aggregate net assets of the Trust. For assets invested in the Portfolio by the HSBC Funds, the Portfolio pays half of the administration fee and the feeder funds pay half of the administration fee, for a combination of the total fee rate set forth above.
Pursuant to a Sub-Administration Services Agreement with HSBC, Citi Fund Services Ohio, Inc. (“Citi”), a wholly-owned subsidiary of Citigroup, Inc., serves as the Trust’s Sub-Administrator. For these services, Citi is entitled to a fee, payable by HSBC, at an annual rate equivalent to the fee rates set forth above subject to certain reductions associated with services provided to new funds, minus 0.02% which is retained by HSBC.
Under a Compliance Services Agreement between the Trust and Citi (the “CCO Agreement”), Citi makes an employee available to serve as the Trust’s Chief Compliance Officer (the “CCO”). Under the CCO Agreement, Citi also provides infrastructure and support in implementing the written policies and procedures comprising the Trust’s compliance program, including support services to the CCO. For the services provided under the CCO Agreement, the Trust paid Citi $312,739 for the year ended October 31, 2017, plus reimbursement of certain out-of-pocket expenses. Expenses incurred by the Portfolio are reflected on the Statements of Operations as “Compliance Services.” Citi pays the salary and other compensation earned by individuals performing these services, as employees of Citi.
Fund Accounting:
Citi provides fund accounting services for the Portfolio. For its services to the Portfolio, Citi receives an annual fee per portfolio, including reimbursement of certain expenses that, is accrued daily and paid monthly. Citi receives additional fees paid by the Trust for regulatory administration services.
Independent Trustees:
The Trust pays an annual retainer to each Independent Trustee, plus additional annual retainers to each Committee Chair and the Chairman of the Board. The Independent Trustees also receive a fee for each regular, special in-person, and telephonic meeting of the Board of Trustees attended. The aggregate amount of the fees and expenses of the Independent Trustees are allocated amongst all the funds in the Trust and are presented in the Statements of Operations.
JOB TITLE HSBC Equity AR REVISION 15 SERIAL <12345678> DATE Saturday, December 23, 2017
JOB NUMBER 334373(1) TYPE PAGE NO. 33 OPERATOR ABIGAELS
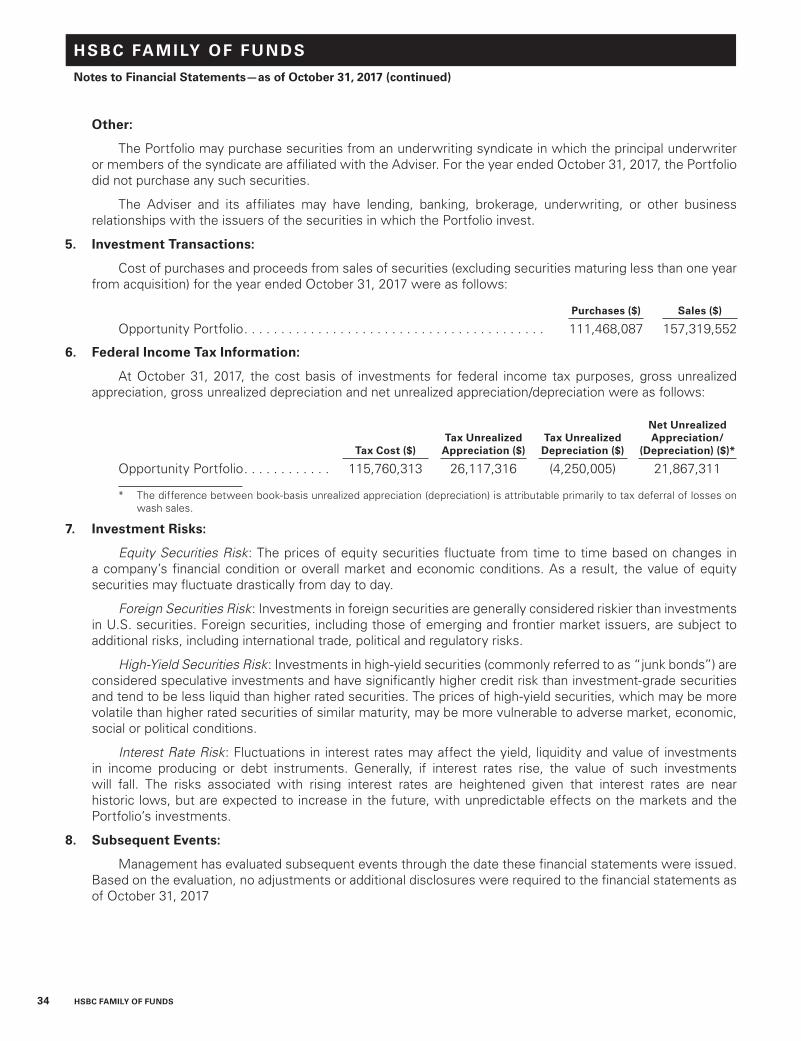
34 HSBC FAMILY OF FUNDS
Notes to Financial Statements—as of October 31, 2017 (continued)
HSBC FAM ILY OF FUNDS
Other:
The Portfolio may purchase securities from an underwriting syndicate in which the principal underwriter or members of the syndicate are affiliated with the Adviser. For the year ended October 31, 2017, the Portfolio did not purchase any such securities.
The Adviser and its affiliates may have lending, banking, brokerage, underwriting, or other business relationships with the issuers of the securities in which the Portfolio invest.
5. Investment Transactions:
Cost of purchases and proceeds from sales of securities (excluding securities maturing less than one year from acquisition) for the year ended October 31, 2017 were as follows:
Purchases ($) Sales ($)
Opportunity Portfolio . . . . . . . . . . . . . . . . . . . . . . . . . . . . . . . . . . . . . . . . . 111,468,087 157,319,552
6. Federal Income Tax Information:
At October 31, 2017, the cost basis of investments for federal income tax purposes, gross unrealized appreciation, gross unrealized depreciation and net unrealized appreciation/depreciation were as follows:
Tax Cost ($)Tax Unrealized
Appreciation ($)Tax Unrealized Depreciation ($)
Net Unrealized Appreciation/
(Depreciation) ($)*
Opportunity Portfolio . . . . . . . . . . . . 115,760,313 26,117,316 (4,250,005) 21,867,311
* The difference between book-basis unrealized appreciation (depreciation) is attributable primarily to tax deferral of losses on wash sales.
7. Investment Risks:
Equity Securities Risk: The prices of equity securities fluctuate from time to time based on changes in a company’s financial condition or overall market and economic conditions. As a result, the value of equity securities may fluctuate drastically from day to day.
Foreign Securities Risk: Investments in foreign securities are generally considered riskier than investments in U.S. securities. Foreign securities, including those of emerging and frontier market issuers, are subject to additional risks, including international trade, political and regulatory risks.
High-Yield Securities Risk: Investments in high-yield securities (commonly referred to as “junk bonds”) are considered speculative investments and have significantly higher credit risk than investment-grade securities and tend to be less liquid than higher rated securities. The prices of high-yield securities, which may be more volatile than higher rated securities of similar maturity, may be more vulnerable to adverse market, economic, social or political conditions.
Interest Rate Risk: Fluctuations in interest rates may affect the yield, liquidity and value of investments in income producing or debt instruments. Generally, if interest rates rise, the value of such investments will fall. The risks associated with rising interest rates are heightened given that interest rates are near historic lows, but are expected to increase in the future, with unpredictable effects on the markets and the Portfolio’s investments.
8. Subsequent Events:
Management has evaluated subsequent events through the date these financial statements were issued. Based on the evaluation, no adjustments or additional disclosures were required to the financial statements as of October 31, 2017
JOB TITLE HSBC Equity AR REVISION 15 SERIAL <12345678> DATE Saturday, December 23, 2017
JOB NUMBER 334373(1) TYPE PAGE NO. 34 OPERATOR ABIGAELS
HSBC FAMILY OF FUNDS 35
Report of Independent Registered Public Accounting Firm
To the Board of Trustees of HSBC Funds and Shareholders of HSBC Opportunity Portfolio
In our opinion, the accompanying statement of assets and liabilities, including the schedule of portfolio investments, and the related statements of operations and of changes in net assets and the financial highlights present fairly, in all material respects, the financial position of the HSBC Opportunity Portfolio (one of the portfolios constituting HSBC Funds, hereafter referred to as the “Fund”) as of October 31, 2017, the results of its operations for the year then ended, the changes in its net assets for each of the two years in the period then ended and the financial highlights for each of the three years in the period then ended, in conformity with accounting principles generally accepted in the United States of America. These financial statements and financial highlights (hereafter referred to as “financial statements”) are the responsibility of the Fund’s management. Our responsibility is to express an opinion on these financial statements based on our audits. We conducted our audits of these financial statements in accordance with the standards of the Public Company Accounting Oversight Board (United States). Those standards require that we plan and perform the audit to obtain reasonable assurance about whether the financial statements are free of material misstatement. An audit includes examining, on a test basis, evidence supporting the amounts and disclosures in the financial statements, assessing the accounting principles used and significant estimates made by management, and evaluating the overall financial statement presentation. We believe that our audits, which included confirmation of securities as of October 31, 2017 by correspondence with the custodian and brokers, provide a reasonable basis for our opinion. The financial statements as of and for the year ended October 31, 2014 and the financial highlights for each of the periods ended on or prior to October 31, 2014 (not presented herein, other than the financial highlights) were audited by other auditors whose report dated December 23, 2014 expressed an unqualified opinion on those financial statements and financial highlights.
PricewaterhouseCoopers LLP New York, New York December 21, 2017
JOB TITLE HSBC Equity AR REVISION 15 SERIAL <12345678> DATE Saturday, December 23, 2017
JOB NUMBER 334373(1) TYPE PAGE NO. 35 OPERATOR ABIGAELS
36 HSBC FAMILY OF FUNDS
HSBC FAM ILY OF FUNDS
Table of Shareholder Expenses—as of October 31, 2017 (Unaudited)
As a shareholder of the Portfolio, you incur ongoing costs, including management fees and other Fund expenses.
These examples are intended to help you understand your ongoing costs (in dollars) of investing in the Portfolio and to compare these costs with the ongoing costs of investing in other mutual funds.
These examples are based on an investment of $1,000 invested at the beginning of the period and held for the entire period from May 1, 2017 through October 31, 2017.
Actual Example
The table below provides information about actual account values and actual expenses. You may use the information below, together with the amount you invested, to estimate the expenses that you paid over the period. Simply divide your account value by $1,000 (for example, an $8,600 account value divided by $1,000 = 8.6), then multiply the result by the number in the table under the heading entitled “Expenses Paid During Period” to estimate the expenses you paid on your account during this period.
Beginning Account Value
5/1/17
Ending Account Value
10/31/17
Expenses Paid During Period*
5/1/17 - 10/31/17
Annualized Expense Ratio During Period
5/1/17 - 10/31/17
Opportunity Portfolio . . . . . . . . . . . . . . . . . . . . . . . . . $1,000.00 $1,096.10 $4.75 0.90%
* Expenses are equal to the average account value over the period, multiplied by the Portfolio’s annualized expense ratio, multiplied by 184/365 (to reflect the one half year period).
Hypothetical Example for Comparison Purposes
The table below provides information about hypothetical account values and hypothetical expenses based on each Portfolio’s actual expense ratio and an assumed rate of return of 5% per year before expenses, which is not the Portfolio’s actual return. The hypothetical account values and expenses may not be used to estimate the actual ending account balance or expenses you paid for the period. You may use this information to compare this 5% hypothetical example with the 5% hypothetical examples that appear in the shareholder reports of other funds.
Please note that the expenses shown in the table are meant to highlight your ongoing costs only and do not reflect any transactional costs, such as sales charges (loads), redemption fees, or exchange fees. Therefore, the table is useful in comparing ongoing costs only, and will not help you determine the relative total costs of owning different funds. In addition, if these transactional costs were included, your costs would have been higher.
Beginning Account Value
5/1/17
Ending Account Value
10/31/17
Expenses Paid During Period*
5/1/17 - 10/31/17
Annualized Expense Ratio During Period
5/1/17 - 10/31/17
Opportunity Portfolio . . . . . . . . . . . . . . . . . . . . . . . . . $1,000.00 $1,020.67 $4.58 0.90%
* Expenses are equal to the average account value over the period, multiplied by the Portfolio’s annualized expense ratio, multiplied by 184/365 (to reflect the one half year period).
JOB TITLE HSBC Equity AR REVISION 15 SERIAL <12345678> DATE Saturday, December 23, 2017
JOB NUMBER 334373(1) TYPE PAGE NO. 36 OPERATOR ABIGAELS
HSBC FAMILY OF FUNDS 37
HSBC FAM ILY OF FUNDS
Board of Trustees and Officers (Unaudited)
MANAGEMENT OF THE TRUST
The following table contains information regarding the HSBC Family of Funds’ Board of Trustees (“Trustees”). The HSBC Family of Funds’ Statement of Additional Information includes additional information about the Trustees and is available, without charge, upon request by calling (888) 525-5757.
Name, Address, Age
Position(s) Held with
Funds
Term of Office and Length of Time Served
Principal Occupation(s) During Past 5 Years
Portfolios in Fund Complex Overseen By
Trustee*
Other Directorships
Held by Trustee During Past 5 Years
NON-INTERESTED TRUSTEES
MARCIA L. BECK P.O. Box 182845 Columbus, OH 43218-3035 Age: 62
Trustee Indefinite; 2008 to present
Private Investor (1999 – present) 13 None
SUSAN C. GAUSE P.O. Box 182845 Columbus, OH 43218-3035 Age: 65
Trustee Indefinite; 2013 to present
Private Investor (2003 - present) 13 Metropolitan Series Fund (2012 – present); and Met Investors Series Trust (2008 – present)
SUSAN S. HUANG P.O. Box 182845 Columbus, OH 43218-3035 Age: 63
Trustee Indefinite; 2008 to present
Private Investor (2000 - present) 13 None
THOMAS F. ROBARDS P.O. Box 182845 Columbus, OH 43218-3035 Age: 71
Chairman and Trustee
Indefinite; 2005 to present
Private Investor (2003 - present) 13 Ellington Residential Mortgage REIT (NYSE
listed real estate investment trust) (2013 – present);
Ellington Financial LLC (NYSE listed financial services company)
(2007 – present); and Overseas Shipholding
Group (OSG) (NYSE listed company)
(2005 – 2014)
INTERESTED TRUSTEE
DEBORAH HAZELL 452 Fifth Avenue New York NY 10018 Age: 54
Trustee Indefinite; 2011 to present
Director and Chief Executive Officer, HSBC Global Asset Management (USA) Inc. (2011 - present); President and Chief Executive Officer, Fisher Francis Trees & Watts (“FFTW”) (investment adviser) (2008 - 2011)
13 None
* Includes all series of the HSBC Funds.
JOB TITLE HSBC Equity AR REVISION 15 SERIAL <12345678> DATE Saturday, December 23, 2017
JOB NUMBER 334373(1) TYPE PAGE NO. 37 OPERATOR ABIGAELS

38 HSBC FAMILY OF FUNDS
HSBC FAM ILY OF FUNDS
Board of Trustees and Officers (Unaudited) (continued)
Name, Address, AgePosition(s) Held
FundsTerm of Office and
Length of Time ServedPrincipal Occupation(s)
During Past 5 Years
OFFICERS
RICHARD A. FABIETTI 452 Fifth Avenue New York, NY 10018 Age: 59
President One year; 2004 to present
Senior Vice President, HSBC Global Asset Management (USA) Inc. (1998 - present)
JAMES D. LEVY 452 Fifth Avenue New York, NY 10018 Age: 54
Vice President One year; 2014 to present
Vice President, Product Management, HSBC Global Asset Management (USA) Inc. (2014 – present); Vice President, Mutual Funds Product Development, GE Asset Management Inc. (2007 – 2014)
ALLAN SHAER* Prudential Center 800 Boylston Street, 24th Floor Boston, MA 02199 Age: 52
Treasurer One year; 2017 to present
Senior Vice President, Citi Investor Services (2016 - present); Vice President, Mutual Fund Administration, JP Morgan Chase (2011 - 2016)
IOANNIS TZOUGANATOS* Prudential Center 800 Boylston Street, 24th Floor Boston, MA 02199 Age: 41
Secretary One Year; 2015 to present
Vice President, Regulatory Administration, Citi Fund Services (2008 - present)
CHARLES BOOTH* 4400 Easton Commons, Suite 200 Columbus, OH 43219-3035 Age: 57
Chief Compliance Officer
One year; 2015 to present
Director and Compliance Officer, CCO Services, Citi Fund Services (1988 - present)
* Mr. Shaer, Mr. Tzouganatos, and Mr. Booth also are officers of other investment companies of which Citi (or an affiliate) is the administrator or sub-administrator.
JOB TITLE HSBC Equity AR REVISION 15 SERIAL <12345678> DATE Saturday, December 23, 2017
JOB NUMBER 334373(1) TYPE PAGE NO. 38 OPERATOR ABIGAELS
HSBC FAMILY OF FUNDS 39
HSBC FAM ILY OF FUNDS
Other Information (Unaudited)
Other Information (Unaudited):
Information regarding how the Funds voted proxies relating to portfolio securities during the most recent 12-month period ended June 30th is available (i) without charge, upon request, by calling 1-800-525-5757 for HSBC Bank USA and HSBC Brokerage (USA) Inc. clients and 1-800-782-8183 for all other shareholders; (ii) on the Funds’ website at www.investorfunds.us.hsbc.com; and (iii) on the Security and Exchange Commission’s (“Commission”) website at http://www.sec.gov.
The Funds file their complete schedules of portfolio holdings with the Commission for the first and third quarters of each fiscal year on Form N-Q. The Funds’ Forms N-Q are available on the Commission’s website at http://www.sec.gov. The Funds’ Forms N-Q may be reviewed and copied at the Commission’s Public Reference Room in Washington, D.C. and information on the operation of the Public Reference Room may be obtained by calling 1-800-SEC-0330. The Funds’ Schedules of Investments will be available no later than 60 days after each period end, without charge, on the Funds’ website at www.investorfunds.us.hsbc.com.
An investment in a Fund is not a deposit of HSBC Bank USA, National Association, and is not insured or guaranteed by the Federal Deposit Insurance Corporation or any other government agency.
JOB TITLE HSBC Equity AR REVISION 15 SERIAL <12345678> DATE Saturday, December 23, 2017
JOB NUMBER 334373(1) TYPE PAGE NO. 39 OPERATOR ABIGAELS

This page intentionally left blank.
JOB TITLE HSBC Equity AR REVISION 15 SERIAL <12345678> DATE Saturday, December 23, 2017
JOB NUMBER 334373(1) TYPE PAGE NO. 40 OPERATOR ABIGAELS

JOB TITLE HSBC Equity AR REVISION 15 SERIAL <12345678> DATE Saturday, December 23, 2017
JOB NUMBER 334373(1) TYPE PAGE NO. 41 OPERATOR ABIGAELS
HSBC FAMILY OF FUNDS:
INVESTMENT ADVISER AND ADMINISTRATOR
HSBC Global Asset Management (USA) Inc. 452 Fifth Avenue New York, NY 10018
SUB-ADVISER
HSBC Opportunity PortfolioWestfield Capital Management Company, L.P. One Financial Center Boston, MA 02111
SHAREHOLDER SERVICING AGENTS
For HSBC Bank USA, N.A. and HSBC Securities (USA) Inc. Clients
HSBC Bank USA, N.A. 452 Fifth Avenue New York, NY 10018 1-888-525-5757
For All Other Shareholders
HSBC Funds P.O. Box 8106 Boston, MA 02266-8106 1-800-782-8183
TRANSFER AGENT
Boston Financial Data Services, Inc. 2000 Crown Colony Drive Quincy, MA 02169
DISTRIBUTOR
Foreside Distribution Services, L.P. Three Canal Plaza, Suite 100 Portland, ME 04101
CUSTODIAN
The Northern Trust Company 50 South LaSalle Street Chicago, IL 60603
INDEPENDENT REGISTERED PUBLIC ACCOUNTING FIRM
PricewaterhouseCoopers LLP 300 Madison Avenue New York, NY 10017
LEGAL COUNSEL
Dechert LLP 1900 K Street, N.W. Washington, D.C. 20006
Investment products are offered by HSBC Securities (USA) Inc. (HSI), member NYSE/FINRA/SIPC. HSI is an affiliate of HSBC Bank USA, N.A. Investment products: Are not a deposit or other obligation of the bank or any of its affiliates; Not FDIC insured or insured by any federal government agency of the United States; Not guaranteed by the bank or any of its affiliates; and are subject to investment risk, including possible loss of principal invested.
Investors should consider the investment objectives, risks, charges, and expenses of the investment company carefully before investing. The prospectus contains this and other important information about the investment company. For clients of HSBC Securities (USA) Inc., please call 1-888-525-5757 for more information. For other investors and prospective investors, please call the Funds directly at 1-800-782-8183 or visit our website at www.investorfunds.us.hsbc.com. Investors should read the prospectus carefully before investing or sending money.
HSB-AR-RTL-1217 12/17
Investment products:
ARE NOT A BANK DEPOSIT OR OBLIGATION OF THE BANK OR ANY OF ITS AFFILIATES
ARE NOT FDIC INSURED
ARE NOT INSURED BY ANY FEDERAL GOVERNMENT AGENCY
ARE NOT GUARANTEED BY THE BANK OR ANY OF ITS AFFILIATES
MAY LOSE VALUE
JOB TITLE HSBC Equity AR REVISION 15 SERIAL <12345678> DATE Saturday, December 23, 2017
JOB NUMBER 334373(1) TYPE PAGE NO. 42 OPERATOR ABIGAELS


