14
1 Morgan Stanley, European Financials Conference HSBC Holdings plc
| Date post: | 23-Jun-2018 |
| Category: |
Documents |
| Upload: | hoangthuan |
| View: | 222 times |
| Download: | 0 times |
1Morgan Stanley, European Financials Conference
HSBC Holdings plc

2
HSBC is a leading universal and global bank
Our global footprint
70markets
90%Our network covers
countries accounting
for more than 90% of
global GDP, trade and
capital flows
> 45%
Our international
network supports
more than 45% of our
client revenue
4Inter-
connected
global
businesses
share balance sheets
and liquidity in
addition to strong
commercial links
Diversified global businesses and regions1
$5.6bn
$115bn $276bn $300bn
$18.9bn $12.9bn $14.9bn
$591bn $342bn $256bn
$306bn $282bn $226bn
$5.3bn $6.1bn
$15bn
$36bn
$70bn
$1.7bn
$0.3bn
Adjusted revenue
RWAs
Customer advances
Customer deposits
Adjusted PBT
$50.2bn
$857bn
$862bn
$1,272bn
$19.3bn
$334bn
$17.3bn $23.3bn
$447bn $632bn
$337bn $365bn
$298bn
Adjusted revenue2
RWAs
Customer advances
Customer deposits
$50.2bn
$857bn
$862bn
$1,272bn
GB&MCMBRBWM GPB
NAM LAMMENAAsiaEurope
2016: by global business
By region
PBT by region Europe Asia
Middle
East and
North
Africa
North
America
Latin
America
RBWM, CMB, GB&M
and GPB$4.1bn $10.6bn $1.0bn $1.1bn $0.5bn
Corporate Centre $(2.5)bn $3.6bn $0.6bn $0.3bn $0.0bn
Total $1.6bn $14.2bn $1.6bn $1.3bn $0.6bn
$17.3bn
$2.0bn
$19.3bn
1. Metrics relate to 2016 and are on an adjusted basis unless otherwise stated, totals provided are for the Group and include Corporate Centre.
Details of reported results and a reconciliation of reported to adjusted results are included in the Appendix.
2. Amounts are non-additive across regions due to intra-HSBC items
NetworkPriority Rep office
3
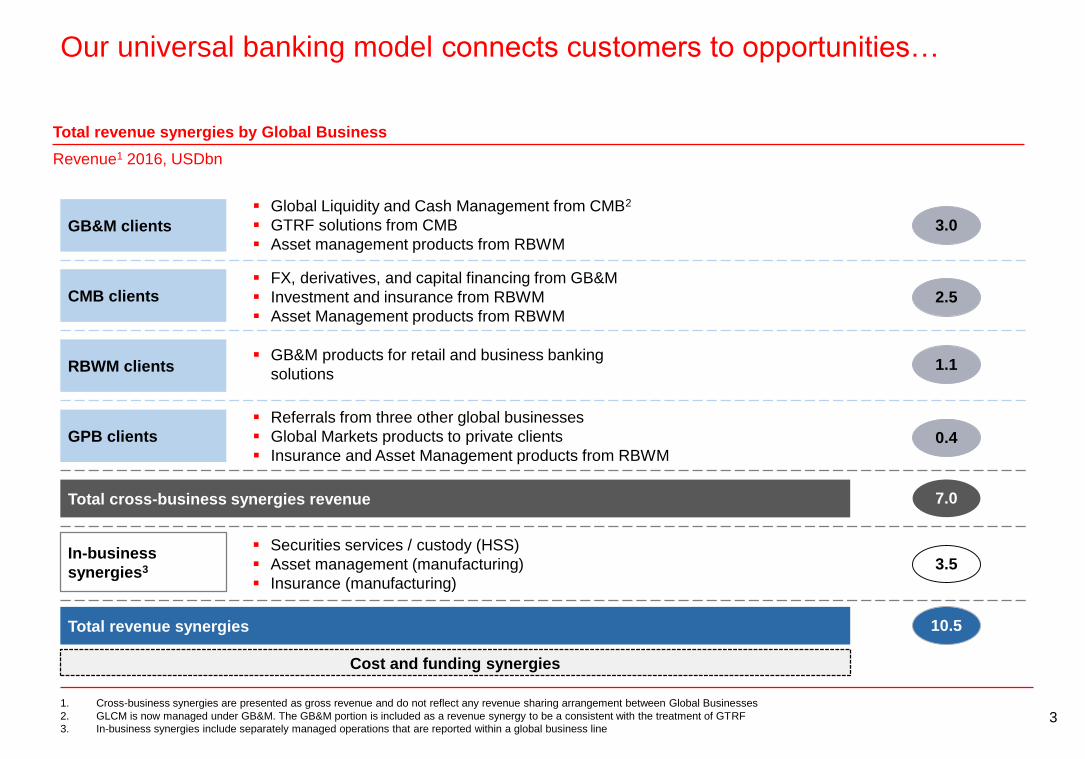
Our universal banking model connects customers to opportunities…
1. Cross-business synergies are presented as gross revenue and do not reflect any revenue sharing arrangement between Global Businesses
2. GLCM is now managed under GB&M. The GB&M portion is included as a revenue synergy to be a consistent with the treatment of GTRF
3. In-business synergies include separately managed operations that are reported within a global business line
GB&M clients
CMB clients
RBWM clients
In-business
synergies3
3.0
Global Liquidity and Cash Management from CMB2
GTRF solutions from CMB
Asset management products from RBWM
FX, derivatives, and capital financing from GB&M
Investment and insurance from RBWM
Asset Management products from RBWM
GB&M products for retail and business banking
solutions
2.5
1.1
7.0
Securities services / custody (HSS)
Asset management (manufacturing)
Insurance (manufacturing)
GPB clients
Referrals from three other global businesses
Global Markets products to private clients
Insurance and Asset Management products from RBWM0.4
Total cross-business synergies revenue
3.5
Total revenue synergies 10.5
Cost and funding synergies
Total revenue synergies by Global Business
Revenue1 2016, USDbn
4
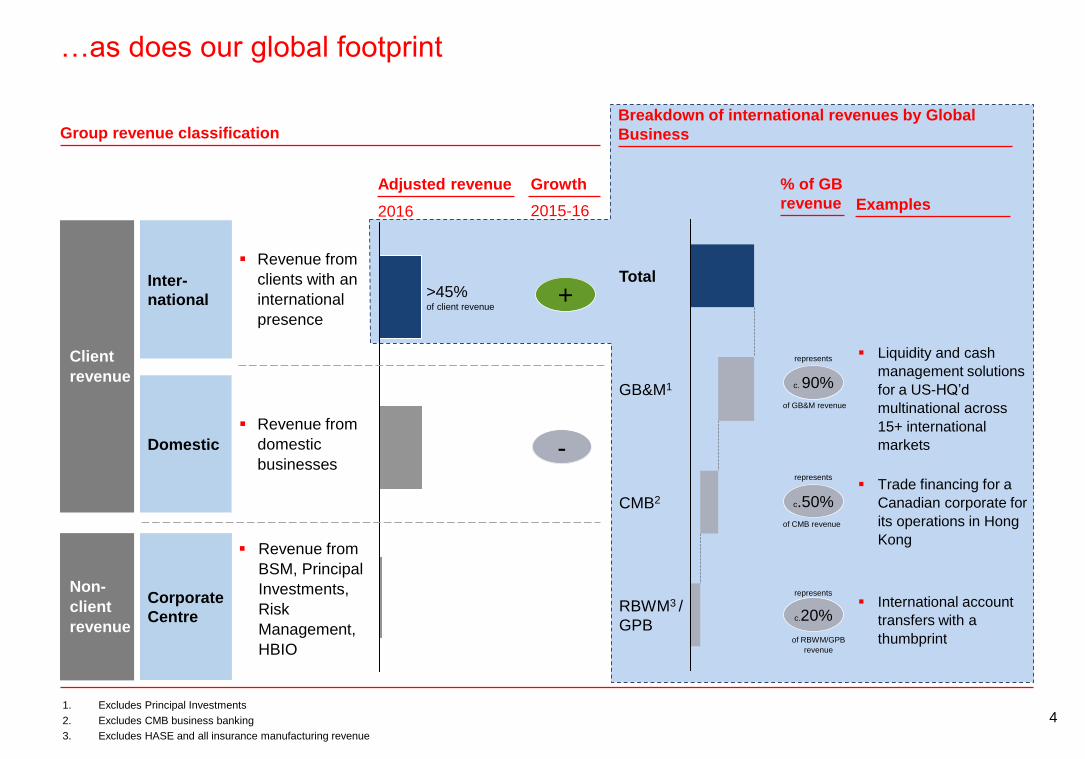
>45% of client revenue
…as does our global footprint
1. Excludes Principal Investments
2. Excludes CMB business banking
3. Excludes HASE and all insurance manufacturing revenue
Inter-
national
Domestic
Revenue from
clients with an
international
presence
Revenue from
domestic
businesses
Examples
Liquidity and cash
management solutions
for a US-HQ’d
multinational across
15+ international
markets
Trade financing for a
Canadian corporate for
its operations in Hong
Kong
Corporate
Centre
Revenue from
BSM, Principal
Investments,
Risk
Management,
HBIO
Client
revenue
Non-
client
revenue
Group revenue classification
2016
Breakdown of international revenues by Global
Business
International account
transfers with a
thumbprint
% of GB
revenue
c. 90%
c.50%
c.20%
Adjusted revenue
RBWM3 /
GPB
CMB2
Total
GB&M1
+
-
Growth
2015-16
represents
of GB&M revenue
represents
of CMB revenue
represents
of RBWM/GPB
revenue

5
Gained market share
Improving
market shares
in key market
sectors
RBWM
GB&M
CMB
Dec-16
34.1%
Dec-15
33.5%
Dec-16
8.2%
Dec-15
7.3%
Hong Kong
mortgages6
UK
mortgages7
RBWM market shares
Hong Kong
personal
lending8
Dec-16
28.8%
Dec-15
27.7%
Mexico
personal
lending9
Aug-16
10.8%
Aug-15
7.2%
CMB and GB&M market shares
Hong Kong
deposit
share10
Dec-16
30.8%
Dec-15
30.7%
Global FICC
market
share1
Aug-16
6.5%
Dec-15
6.2%
Hong Kong
Trade
Finance2
Dec-16
13.0%
Dec-15
10.8%
Singapore
Trade
Finance3
Dec-16
12.9%
Dec-15
8.6%
Global
Cross
border M&A4
Dec-16
6.4%
Dec-15
4.2%
Offshore
RMB
bonds5 15.1%
2015 2016
18.8%
1. Source: Citi Research
2. Source: Hong Kong Monetary Authority
3. Source: Monetary Authority of Singapore (MAS) Monthly Statistical bulletin
4. Source: Dealogic
5. Source: Bloomberg
6. Market share of counts; source: mReferral Mortgage Brokerage Services
7. Market share of approvals; source: Council of Mortgage Lenders, UK
8. Source: Transunion report, Hong Kong
9. Source: National Commission of Banking and Securities and based on 6 major banks in Mexico
10. Source: Hong Kong Monetary Authority; represents HSBC Group

6
Revenue growth
Adjusted revenue by global business 2014-16
USDm
2,079
1,757
1,6653,899
2016
50,153
46,731
2014
51,129
45,151
RBWM, CMB and GB&MGPBCorporate Centre
3%
(15)%
(57)%
GPB restructuring
Momentum in GB&M
and CMB; RBWM
broadly unchanged
5% lending growth
10% growth in
customer deposits
Corporate Centre
USDbn
During 2016, we established the Corporate Centre,
to better reflect the way we manage our businesses.
Corporate centre includes Central Treasury (which
includes Balance Sheet Management) and our
legacy businesses.
Industrial Bank
dividend(0.1)
Intra-group financing
transaction(0.2)
2014
(0.9)US run-off
(0.5)Central
treasury
(0.1)
2016 1.7
Other
movements
3.9
Property
revaluations
(0.4)
Mainly valuation
differences on long-
term debt and
associated swaps and
increased interest
expense from TLAC /
MREL; BSM revenues
up during the period
7
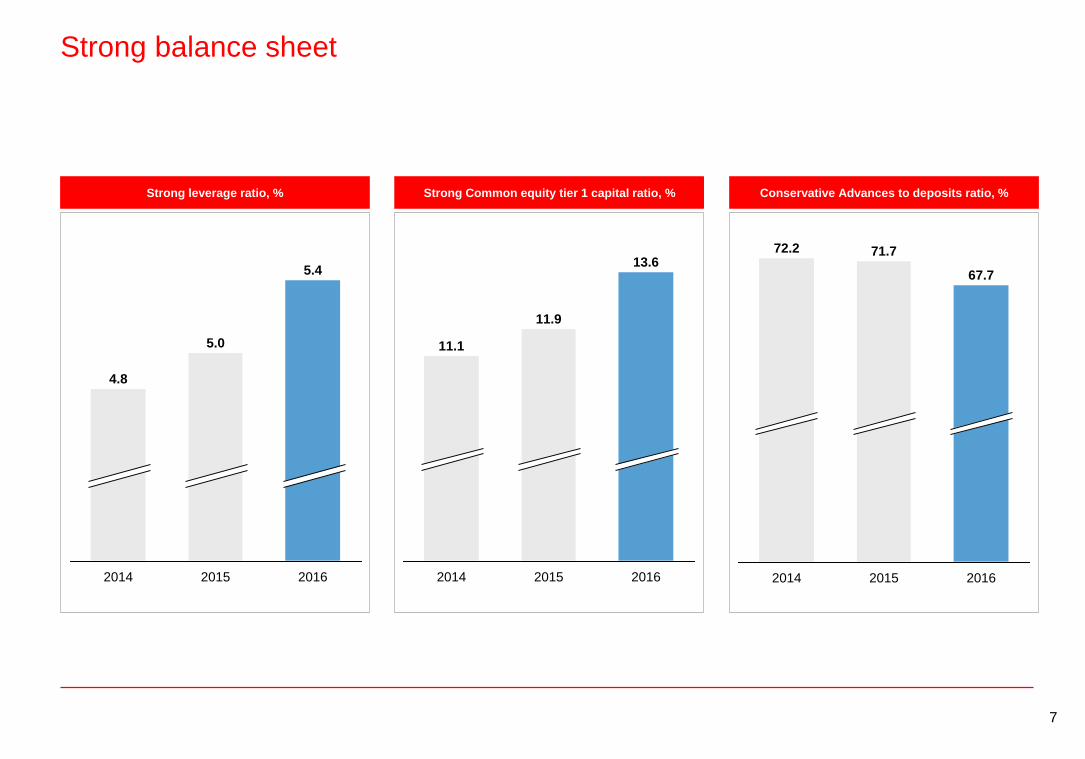
Strong balance sheet
2016
5.4
2015
5.0
2014
4.8
2016
13.6
2015
11.9
2014
11.1
2016
67.7
2015
71.7
2014
72.2
Strong leverage ratio, % Strong Common equity tier 1 capital ratio, % Conservative Advances to deposits ratio, %

8
Delivered consistent earnings and a stable dividend
European peers
28%
North American peers
43%
HSBC
65%
38%
European peers
32%
North American peersHSBC
80%
Consistency of profitability, 2007 to 2016 Consistency of dividends, 2007 to 2016
Source: Individual company reports
1. Consistency defined as 1-10yr standard deviation / 10yr average, with a floor of zero. Profitability = reported PBT. Dividends = aggregate
dividends declared. North American peers: Bank of America, Citi, JPM, RBC, Wells Fargo. European peers: Barclays, BNP, CS, Deutsche,
Lloyds, Santander, Soc Gen, Standard Chartered, UBS, Unicredit
In addition we completed $2.5bn share
repurchases in the second half of 2016
and announced a further repurchase of
up to $1.0bn to be completed in the first
half of 2017
9
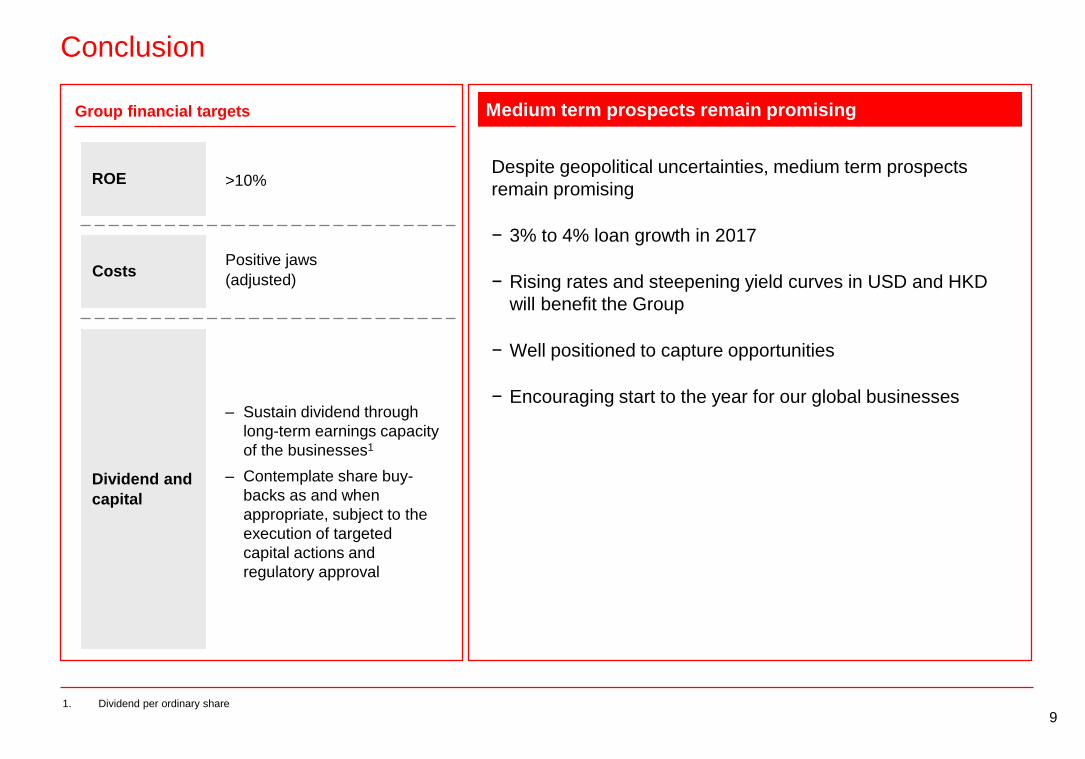
Conclusion
CostsPositive jaws
(adjusted)
Dividend and
capital
ROE >10%
Group financial targets
‒ Sustain dividend through
long-term earnings capacity
of the businesses1
‒ Contemplate share buy-
backs as and when
appropriate, subject to the
execution of targeted
capital actions and
regulatory approval
Despite geopolitical uncertainties, medium term prospects
remain promising
− 3% to 4% loan growth in 2017
− Rising rates and steepening yield curves in USD and HKD
will benefit the Group
− Well positioned to capture opportunities
− Encouraging start to the year for our global businesses
Medium term prospects remain promising
1. Dividend per ordinary share

1010
Appendix

11
Appendix: 2016 Key financial metrics
Return on average ordinary shareholders’ equity
Return on average tangible equity
Jaws (adjusted)
Dividends per ordinary share in respect of the period
Key financial metrics
7.2% 0.8%
8.1% 2.6%
(3.7)% 1.2%
$0.51 $0.51
2015 2016
Advances to deposits ratio
Net asset value per ordinary share (NAV)
Tangible net asset value per ordinary share (TNAV)
71.7% 67.7%
$8.73 $7.91
$7.48 $6.92
Earnings per share
Common equity tier 1 ratio
Leverage ratio
$0.65 $0.07
11.9% 13.6%
5.0% 5.4%
Revenue 8,984 (24)% 47,966 (20)%
LICs (468) 72% (3,400) 9%
Costs (12,459) (8)% (39,808) 0%
Associates 498 (10)% 2,354 (8)%
(Loss) / Profit before tax (3,445) <(200)% 7,112 (62)%
Revenue 11,000 (3)% 50,153 (2)%
LICs (468) 64% (2,652) (2)%
Costs (8,411) 3% (30,556) 4%
Associates 498 (6)% 2,355 (4)%
Profit before tax 2,619 39% 19,300 (1)%
Adjusted Income Statement, $m
4Q16 vs. 4Q15 2016 vs. 2015
Reported Income Statement, $m
4Q16 vs. 4Q15 2016 vs. 2015
12
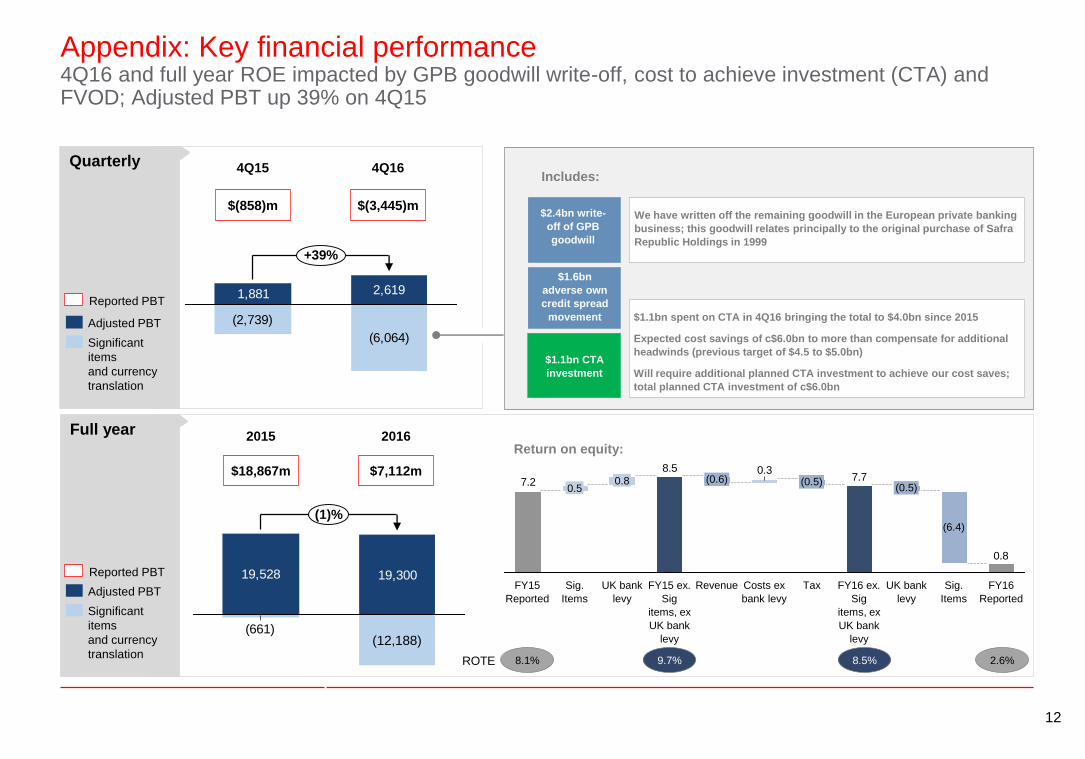
Appendix: Key financial performance4Q16 and full year ROE impacted by GPB goodwill write-off, cost to achieve investment (CTA) and FVOD; Adjusted PBT up 39% on 4Q15
Quarterly
Full year
(2,739)
(6,064)
2,6191,881
+39%
$(858)m $(3,445)m
4Q15 4Q16
19,528 19,300
(661)
(1)%
(12,188)
$18,867m $7,112m
2015 2016
Significant
items
and currency
translation
Adjusted PBT
Significant
items
and currency
translation
Adjusted PBT
Reported PBT
Reported PBT
$1.6bn
adverse own
credit spread
movement
$2.4bn write-
off of GPB
goodwill
$1.1bn CTA
investment
Includes:
We have written off the remaining goodwill in the European private banking
business; this goodwill relates principally to the original purchase of Safra
Republic Holdings in 1999
$1.1bn spent on CTA in 4Q16 bringing the total to $4.0bn since 2015
Expected cost savings of c$6.0bn to more than compensate for additional
headwinds (previous target of $4.5 to $5.0bn)
Will require additional planned CTA investment to achieve our cost saves;
total planned CTA investment of c$6.0bn
Return on equity:
0.8
7.70.38.5
7.2 (0.6)
FY15 ex.
Sig
items, ex
UK bank
levy
UK bank
levy
0.8
Sig.
Items
0.5
FY15
Reported
FY16
Reported
Sig.
Items
(6.4)
UK bank
levy
(0.5)
FY16 ex.
Sig
items, ex
UK bank
levy
Tax
(0.5)
Costs ex
bank levy
Revenue
8.1% 2.6%ROTE 9.7% 8.5%
13
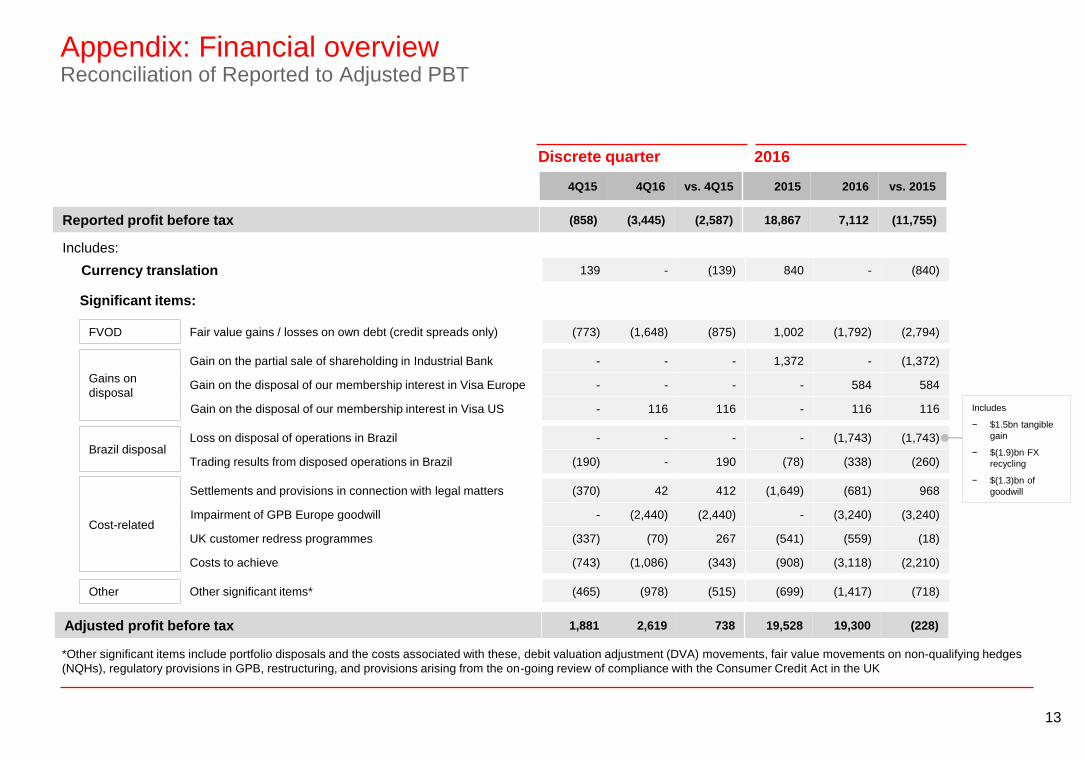
Appendix: Financial overviewReconciliation of Reported to Adjusted PBT
2016Discrete quarter
FVOD
Gains on
disposal
Brazil disposal
Cost-related
Other
Loss on disposal of operations in Brazil - - - - (1,743) (1,743)
Trading results from disposed operations in Brazil (190) - 190 (78) (338) (260)
Gain on the partial sale of shareholding in Industrial Bank - - - 1,372 - (1,372)
Gain on the disposal of our membership interest in Visa Europe - - - - 584 584
Gain on the disposal of our membership interest in Visa US - 116 116 - 116 116
Fair value gains / losses on own debt (credit spreads only) (773) (1,648) (875) 1,002 (1,792) (2,794)
Settlements and provisions in connection with legal matters (370) 42 412 (1,649) (681) 968
Impairment of GPB Europe goodwill - (2,440) (2,440) - (3,240) (3,240)
UK customer redress programmes (337) (70) 267 (541) (559) (18)
Costs to achieve (743) (1,086) (343) (908) (3,118) (2,210)
Significant items:
Currency translation 139 - (139) 840 - (840)
Other significant items* (465) (978) (515) (699) (1,417) (718)
Reported profit before tax (858) (3,445) (2,587) 18,867 7,112 (11,755)
Adjusted profit before tax 1,881 2,619 738 19,528 19,300 (228)
Includes:
4Q15 4Q16 vs. 4Q15 2015 2016 vs. 2015
*Other significant items include portfolio disposals and the costs associated with these, debit valuation adjustment (DVA) movements, fair value movements on non-qualifying hedges
(NQHs), regulatory provisions in GPB, restructuring, and provisions arising from the on-going review of compliance with the Consumer Credit Act in the UK
Includes
− $1.5bn tangible
gain
− $(1.9)bn FX
recycling
− $(1.3)bn of
goodwill
14
AppendixImportant notice and forward-looking statements
Important notice
The information set out in this presentation and subsequent discussion does not constitute a public offer for the purposes of any applicable law or an offer to sell or solicitation of any offer to purchase any securities or other financial instruments or any recommendation in respect of such securities or instruments.
Forward-looking statements
This presentation and subsequent discussion may contain projections, estimates, forecasts, targets, opinions, prospects, results, returns and forward-looking statements with respect to the financial condition, results of operations, capital position and business of the Group (together, “forward-looking statements”). Any such forward-looking statements are not a reliable indicator of future performance, as they may involve significant assumptions and subjective judgements which may or may not prove to be correct and there can be no assurance that any of the matters set out in forward-looking statements are attainable, will actually occur or will be realised or are complete or accurate. Forward-looking statements are statements about the future and are inherently uncertain and generally based on stated or implied assumptions. The assumptions may prove to be incorrect and involve known and unknown risks, uncertainties, contingencies and other important factors, many of which are outside the control of the Group. Actual achievements, results, performance or other future events or conditions may differ materially from those stated, implied and/or reflected in any forward-looking statements due to a variety of risks, uncertainties and other factors (including without limitation those which are referable to general market conditions or regulatory changes). Any such forward-looking statements are based on the beliefs, expectations and opinions of the Group at the date the statements are made, and the Group does not assume, and hereby disclaims, any obligation or duty to update them if circumstances or management’s beliefs, expectations or opinions should change. For these reasons, recipients should not place reliance on, and are cautioned about relying on, any forward-looking statements. Additional detailed information concerning important factors that could cause actual results to differ materially is available in our 2016 Annual Report and Accounts.
This presentation contains non-GAAP financial information. The primary non-GAAP financial measure we use is ‘adjusted performance’ which is computed by adjusting reported results for the period-on-period effects of foreign currency translation differences and significant items which distort period-on-period comparisons. Significant items are those items which management and investors would ordinarily identify and consider separately when assessing performance in order to better understand the underlying trends in the business. Reconciliations between non-GAAP financial measurements and the most directly comparable measures under GAAP are provided in the 2016 Annual Report and Accounts and the Reconciliations of Non-GAAP Financial Measures document which are both available at www.hsbc.com.


