48
HUGO BOSS ©
HSBC's 8th Luxury Goods Conference
2May 21-22, 2015HSBC's 8th Luxury Goods Conference // Paris
HUGO BOSS Company Handout
Paris, May 21-22, 2015
HUGO BOSS ©
Agenda
3May 21-22, 2015HSBC's 8th Luxury Goods Conference // Paris
Financial Review First Quarter 2015
Strategic Outlook 2015
Financial Outlook 2015
HUGO BOSS ©
Agenda
4May 21-22, 2015HSBC's 8th Luxury Goods Conference // Paris
Financial Review First Quarter 2015
Strategic Outlook 2015
Financial Outlook 2015
HUGO BOSS ©
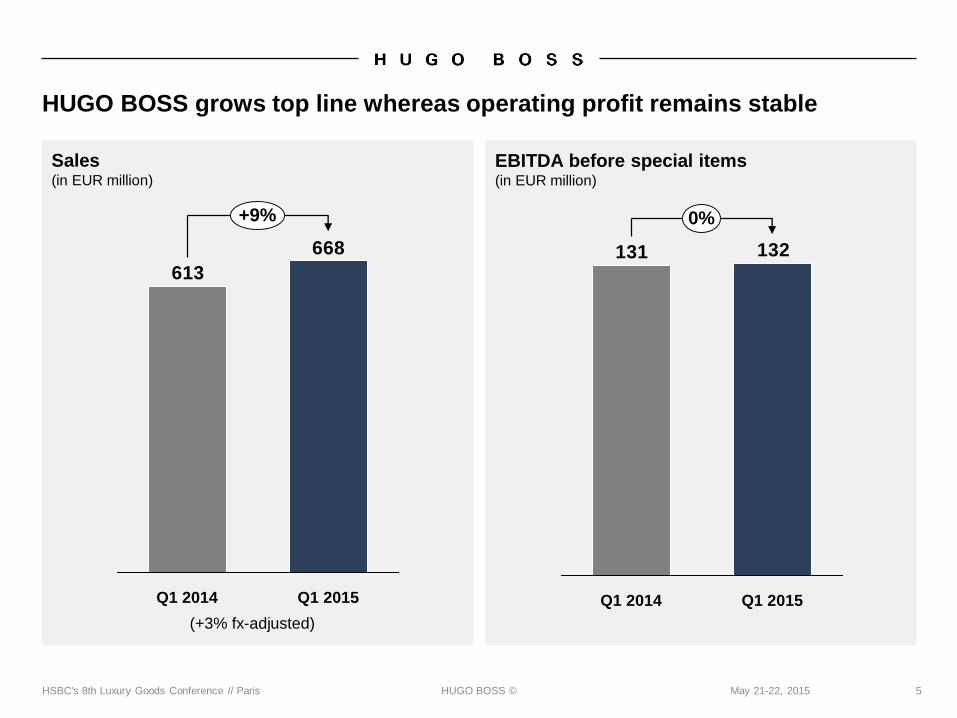
Sales(in EUR million)
EBITDA before special items(in EUR million)
5May 21-22, 2015HSBC's 8th Luxury Goods Conference // Paris
HUGO BOSS grows top line whereas operating profit remains stable
668
613
Q1 2015Q1 2014
+9%
132131
Q1 2014 Q1 2015
0%
(+3% fx-adjusted)
HUGO BOSS ©
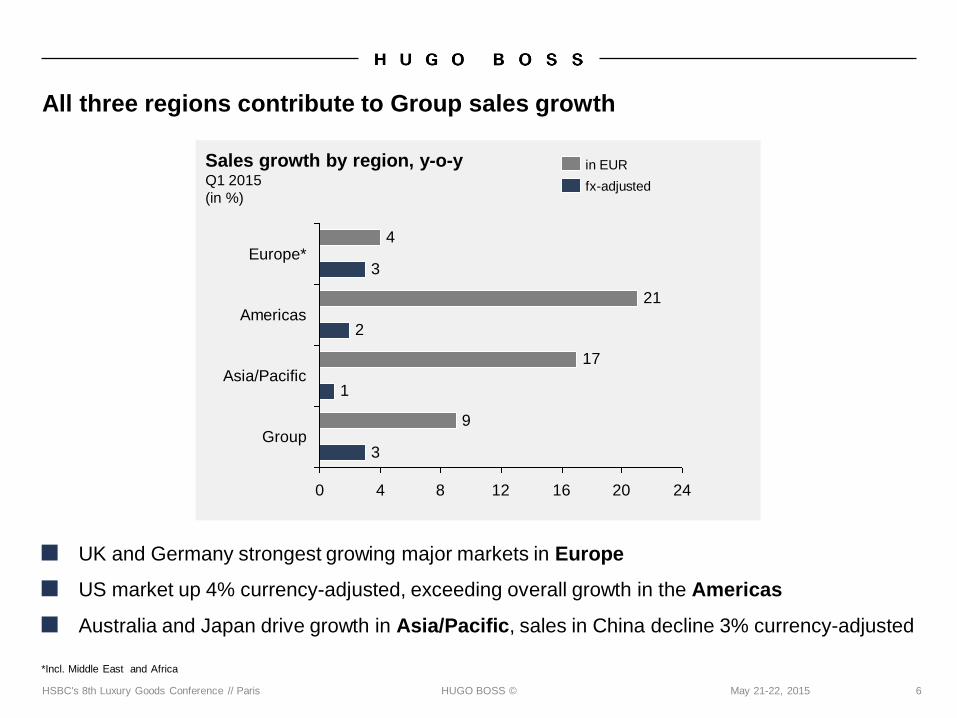
Sales growth by region, y-o-yQ1 2015
(in %)
6May 21-22, 2015HSBC's 8th Luxury Goods Conference // Paris
All three regions contribute to Group sales growth
9
17
21
4
3
1
2
3
0 4 8 12 16 20 24
Asia/Pacific
Group
Europe*
Americas
in EUR
fx-adjusted
*Incl. Middle East and Africa
■ UK and Germany strongest growing major markets in Europe
■ US market up 4% currency-adjusted, exceeding overall growth in the Americas
■ Australia and Japan drive growth in Asia/Pacific, sales in China decline 3% currency-adjusted
HUGO BOSS ©
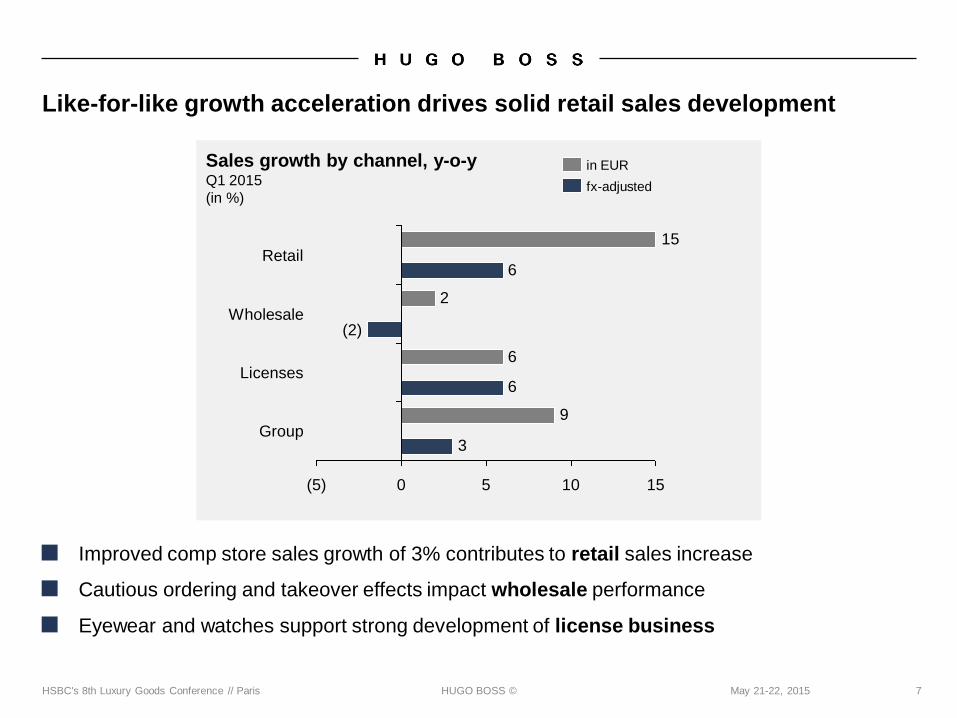
Sales growth by channel, y-o-yQ1 2015
(in %)
7May 21-22, 2015HSBC's 8th Luxury Goods Conference // Paris
Like-for-like growth acceleration drives solid retail sales development
6
9
2
15
3
6
6
151050(5)
(2)Wholesale
Licenses
Retail
Group
fx-adjusted
in EUR
■ Improved comp store sales growth of 3% contributes to retail sales increase
■ Cautious ordering and takeover effects impact wholesale performance
■ Eyewear and watches support strong development of license business
HUGO BOSS ©
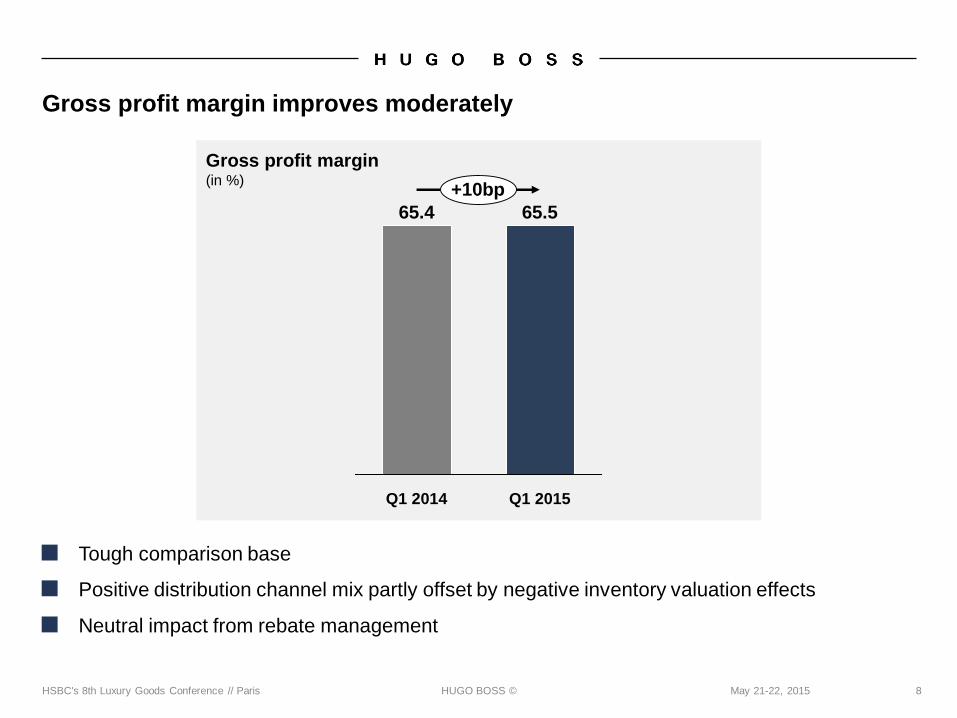
Gross profit margin(in %)
8May 21-22, 2015HSBC's 8th Luxury Goods Conference // Paris
Gross profit margin improves moderately
Q1 2014 Q1 2015
65.565.4
+10bp
■ Tough comparison base
■ Positive distribution channel mix partly offset by negative inventory valuation effects
■ Neutral impact from rebate management
HUGO BOSS © 9May 21-22, 2015HSBC's 8th Luxury Goods Conference // Paris
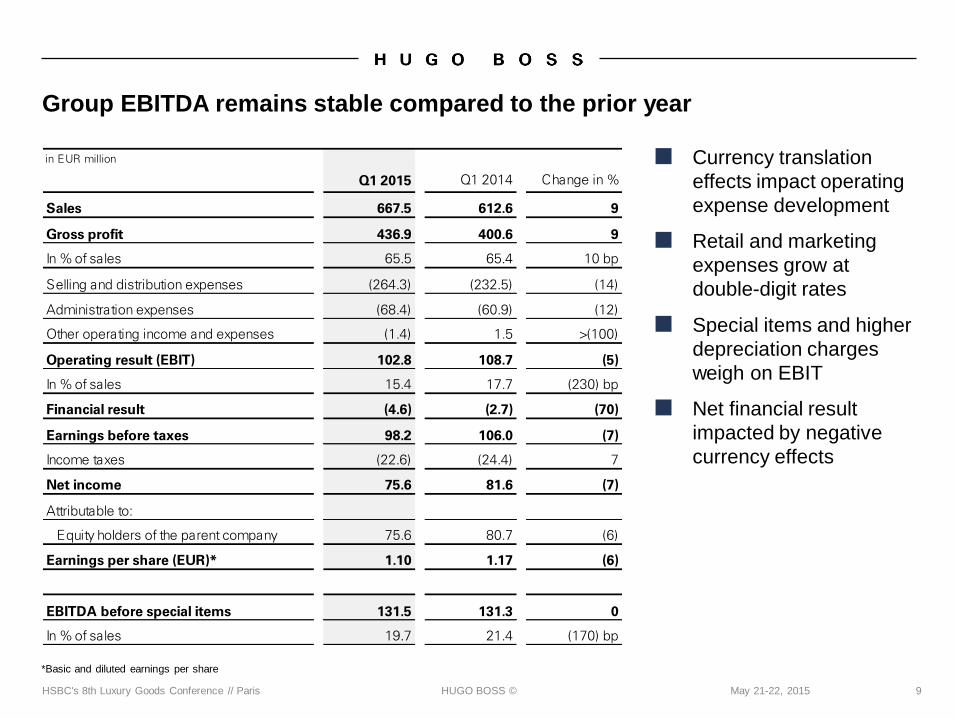
Group EBITDA remains stable compared to the prior year
■ Currency translation
effects impact operating
expense development
■ Retail and marketing
expenses grow at
double-digit rates
■ Special items and higher
depreciation charges
weigh on EBIT
■ Net financial result
impacted by negative
currency effects
*Basic and diluted earnings per share
in EUR million
Q1 2015 Q1 2014 Change in %
Sales 667.5 612.6 9
Gross profit 436.9 400.6 9
In % of sales 65.5 65.4 10 bp
Selling and distribution expenses (264.3) (232.5) (14)
Administration expenses (68.4) (60.9) (12)
Other operating income and expenses (1.4) 1.5 >(100)
Operating result (EBIT) 102.8 108.7 (5)
In % of sales 15.4 17.7 (230) bp
Financial result (4.6) (2.7) (70)
Earnings before taxes 98.2 106.0 (7)
Income taxes (22.6) (24.4) 7
Net income 75.6 81.6 (7)
Attributable to:
Equity holders of the parent company 75.6 80.7 (6)
Earnings per share (EUR)* 1.10 1.17 (6)
EBITDA before special items 131.5 131.3 0
In % of sales 19.7 21.4 (170) bp
HUGO BOSS © 10May 21-22, 2015HSBC's 8th Luxury Goods Conference // Paris
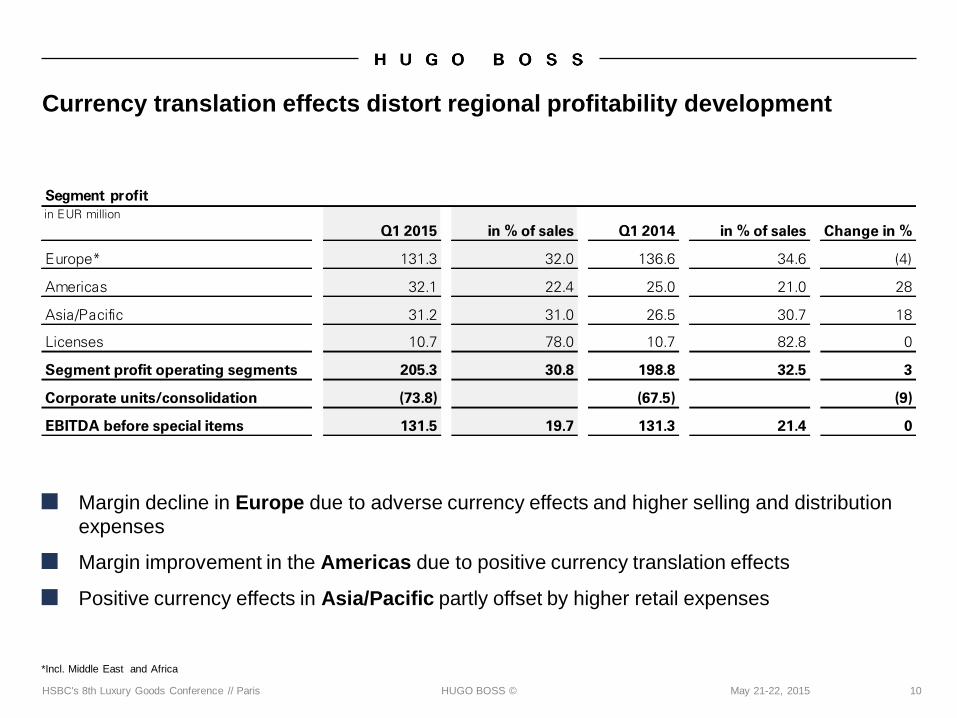
Currency translation effects distort regional profitability development
■ Margin decline in Europe due to adverse currency effects and higher selling and distribution
expenses
■ Margin improvement in the Americas due to positive currency translation effects
■ Positive currency effects in Asia/Pacific partly offset by higher retail expenses
Segment profitin EUR million
Q1 2015 in % of sales Q1 2014 in % of sales Change in %
Europe* 131.3 32.0 136.6 34.6 (4)
Americas 32.1 22.4 25.0 21.0 28
Asia/Pacific 31.2 31.0 26.5 30.7 18
Licenses 10.7 78.0 10.7 82.8 0
Segment profit operating segments 205.3 30.8 198.8 32.5 3
Corporate units/consolidation (73.8) (67.5) (9)
EBITDA before special items 131.5 19.7 131.3 21.4 0
*Incl. Middle East and Africa
HUGO BOSS © 11May 21-22, 2015HSBC's 8th Luxury Goods Conference // Paris
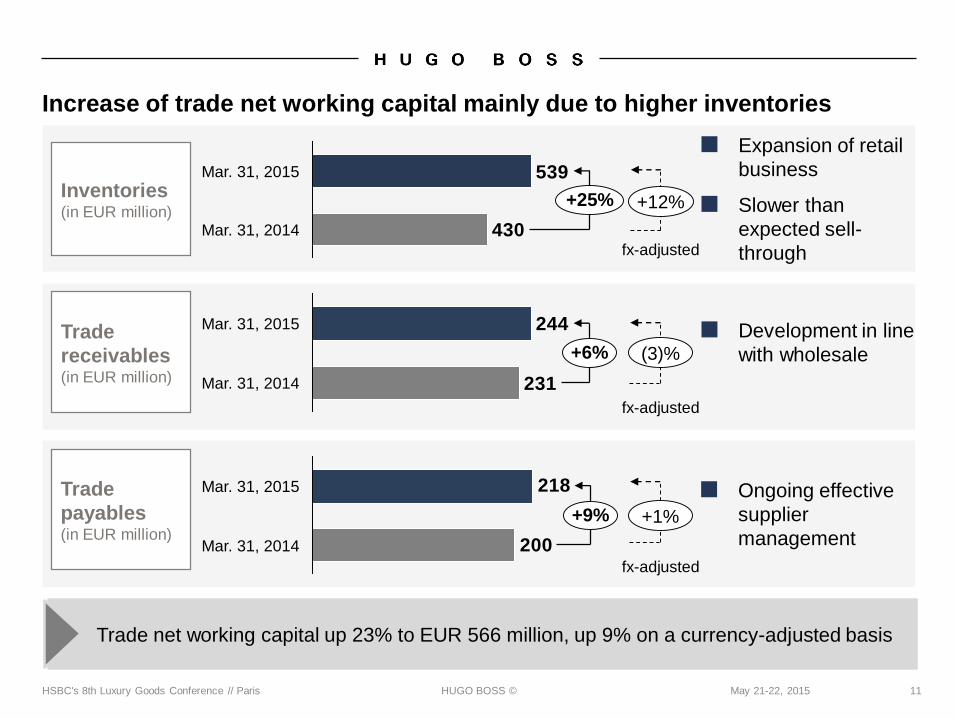
Increase of trade net working capital mainly due to higher inventories
fx-adjusted
fx-adjusted
fx-adjusted
■ Expansion of retail
business
■ Slower than
expected sell-
through
■ Development in line
with wholesale
■ Ongoing effective
supplier
management
Inventories(in EUR million)
Trade
receivables(in EUR million)
Trade
payables(in EUR million)
430
539
Mar. 31, 2014
+25%
Mar. 31, 2015
231
244Mar. 31, 2015
+6%
Mar. 31, 2014
+12%
(3)%
+1%
Trade net working capital up 23% to EUR 566 million, up 9% on a currency-adjusted basis
200
218
Mar. 31, 2014
Mar. 31, 2015
+9%
HUGO BOSS © 12May 21-22, 2015HSBC's 8th Luxury Goods Conference // Paris
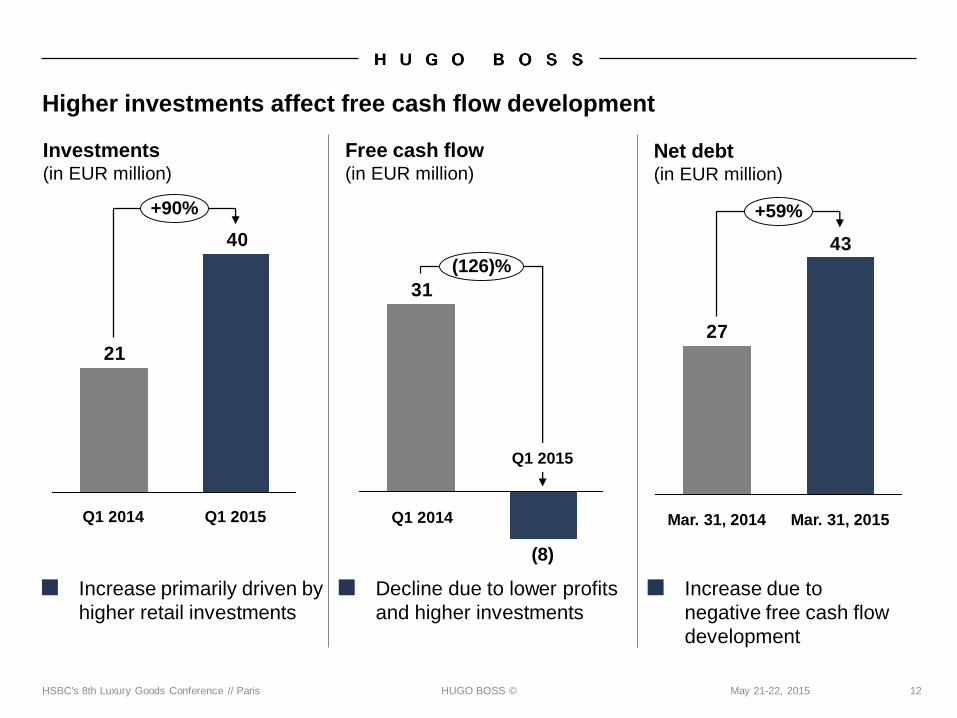
Higher investments affect free cash flow development
■ Increase primarily driven by
higher retail investments
Investments (in EUR million)
■ Increase due to
negative free cash flow
development
Net debt (in EUR million)
40
21
Q1 2014
+90%
Q1 2015
43
27
+59%
Mar. 31, 2015Mar. 31, 2014
31
(8)
(126)%
Free cash flow(in EUR million)
Q1 2014
Q1 2015
■ Decline due to lower profits
and higher investments
HUGO BOSS ©
Agenda
13May 21-22, 2015HSBC's 8th Luxury Goods Conference // Paris
Financial Review First Quarter 2015
Strategic Outlook 2015
Financial Outlook 2015
HUGO BOSS © 14May 21-22, 2015HSBC's 8th Luxury Goods Conference // Paris
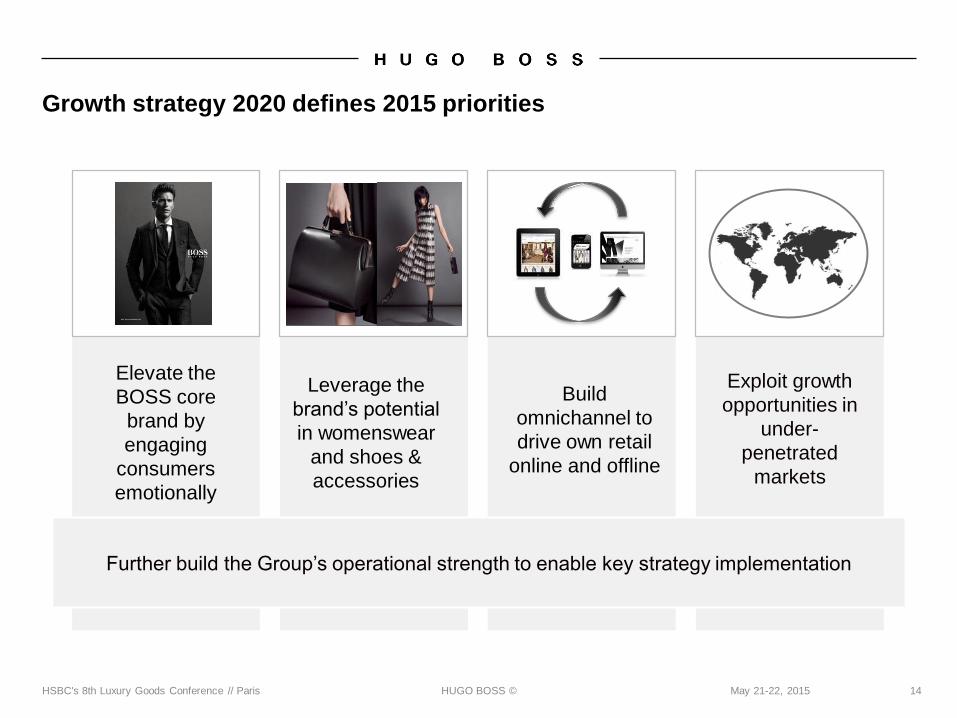
Growth strategy 2020 defines 2015 priorities
Further build the Group’s operational strength to enable key strategy implementation
Elevate the
BOSS core
brand by
engaging
consumers
emotionally
Leverage the
brand’s potential
in womenswear
and shoes &
accessories
Build
omnichannel to
drive own retail
online and offline
Exploit growth
opportunities in
under-
penetrated
markets
HUGO BOSS © 15May 21-22, 2015HSBC's 8th Luxury Goods Conference // Paris
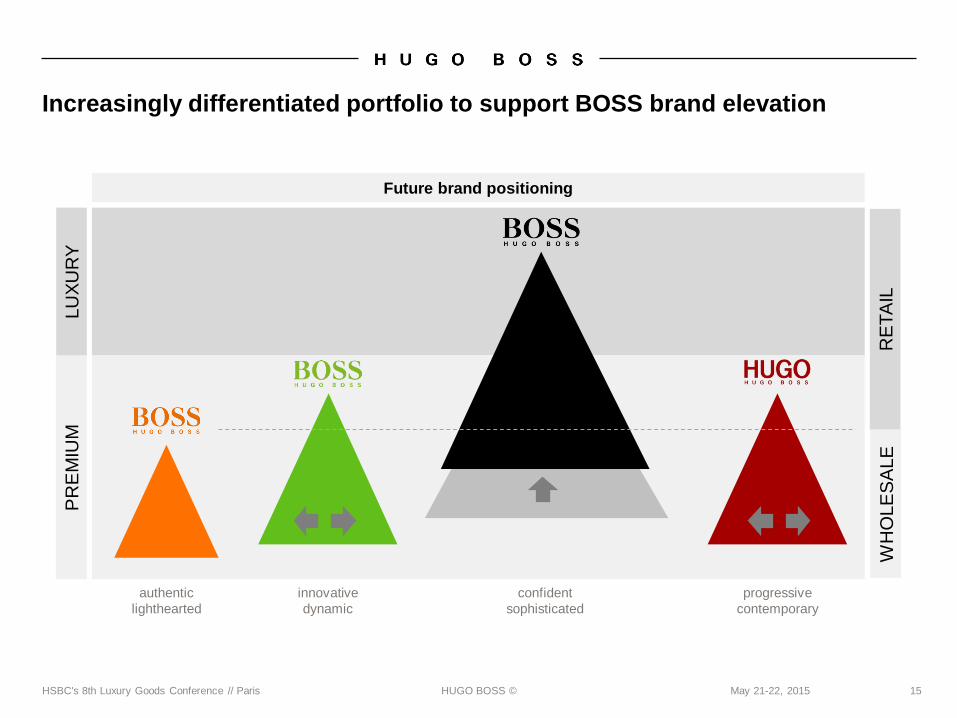
Increasingly differentiated portfolio to support BOSS brand elevation
PR
EM
IUM
LU
XU
RY
authentic
lighthearted
confident
sophisticated
progressive
contemporary
innovative
dynamic
Future brand positioning
WH
OLE
SA
LE
RE
TA
IL
HUGO BOSS © 16May 21-22, 2015HSBC's 8th Luxury Goods Conference // Paris
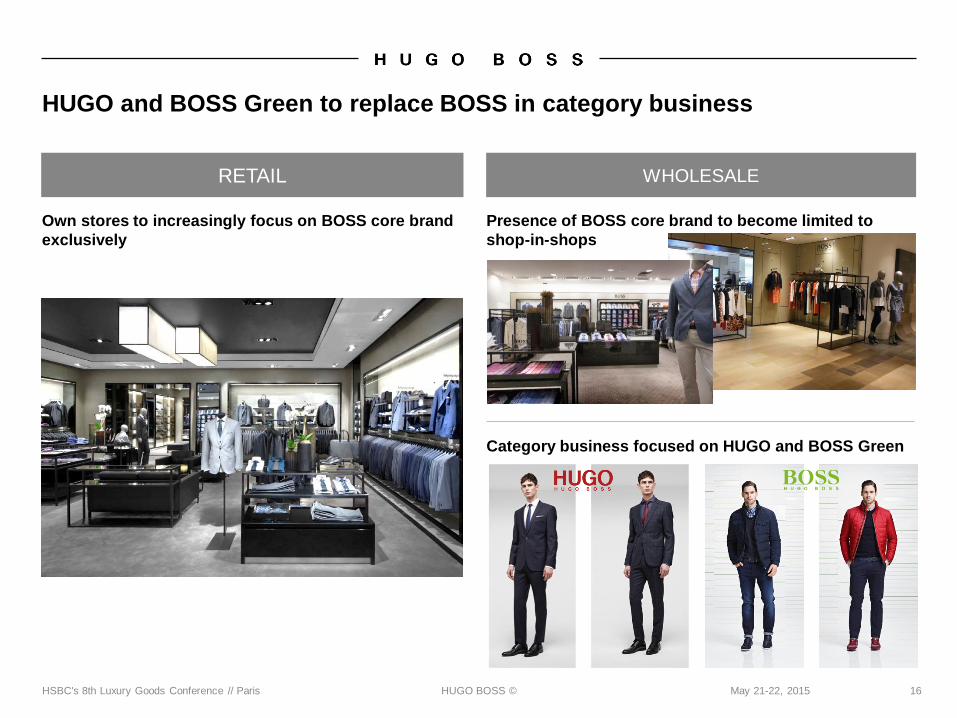
HUGO and BOSS Green to replace BOSS in category business
WHOLESALE
Category business focused on HUGO and BOSS Green
RETAIL
Presence of BOSS core brand to become limited to
shop-in-shops
Own stores to increasingly focus on BOSS core brand
exclusively
HUGO BOSS © 17May 21-22, 2015HSBC's 8th Luxury Goods Conference // Paris
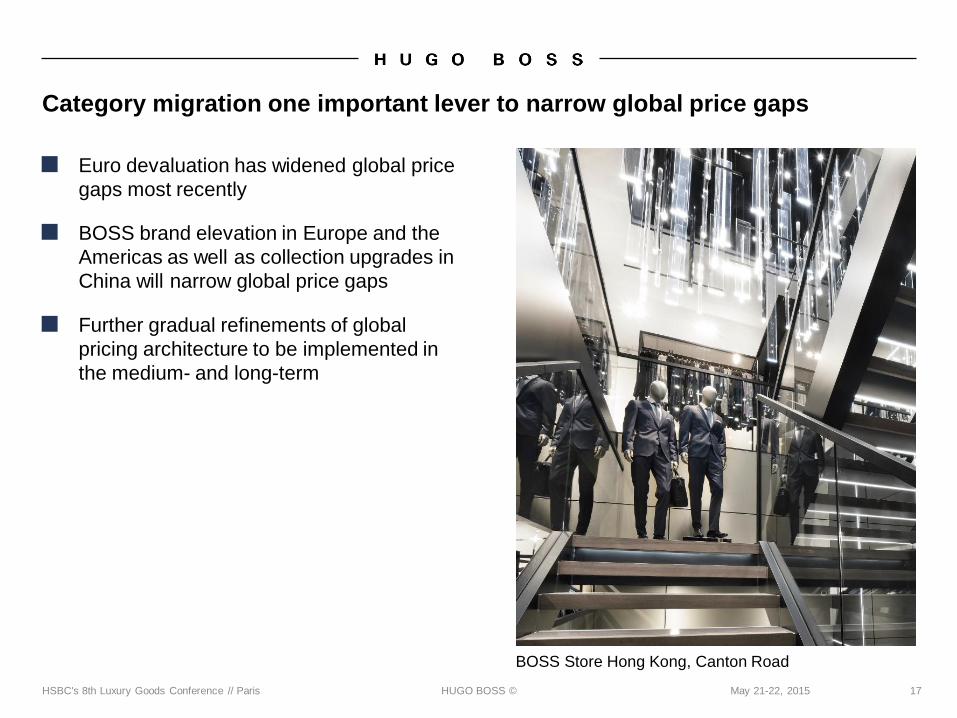
Category migration one important lever to narrow global price gaps
■ Euro devaluation has widened global price
gaps most recently
■ BOSS brand elevation in Europe and the
Americas as well as collection upgrades in
China will narrow global price gaps
■ Further gradual refinements of global
pricing architecture to be implemented in
the medium- and long-term
BOSS Store Hong Kong, Canton Road
HUGO BOSS © 18May 21-22, 2015HSBC's 8th Luxury Goods Conference // Paris
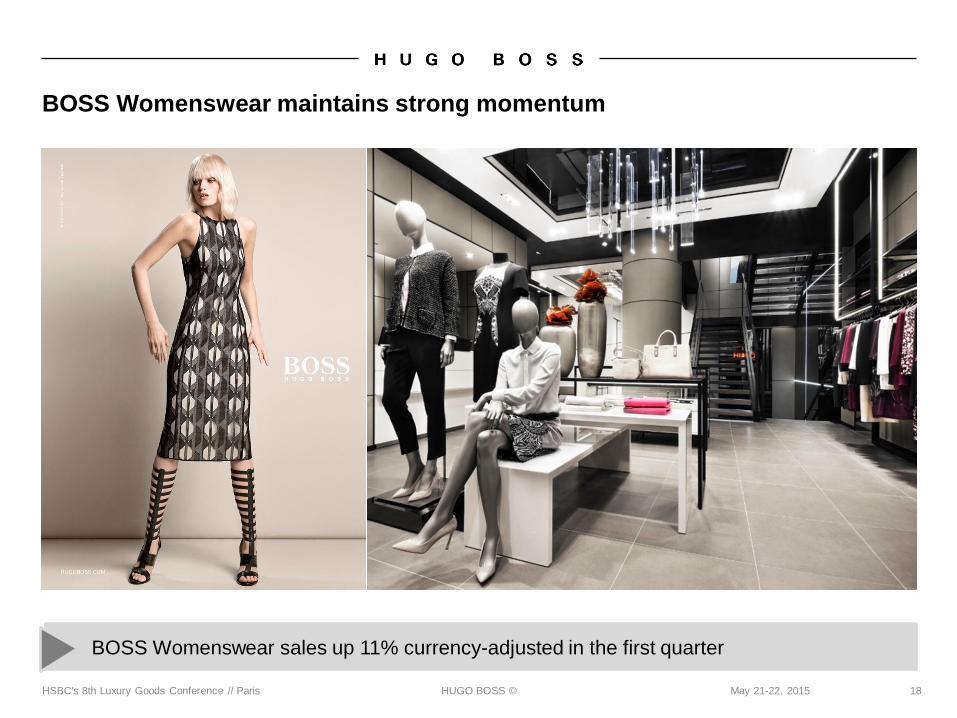
BOSS Womenswear maintains strong momentum
BOSS Womenswear sales up 11% currency-adjusted in the first quarter
HUGO BOSS © 19May 21-22, 2015HSBC's 8th Luxury Goods Conference // Paris
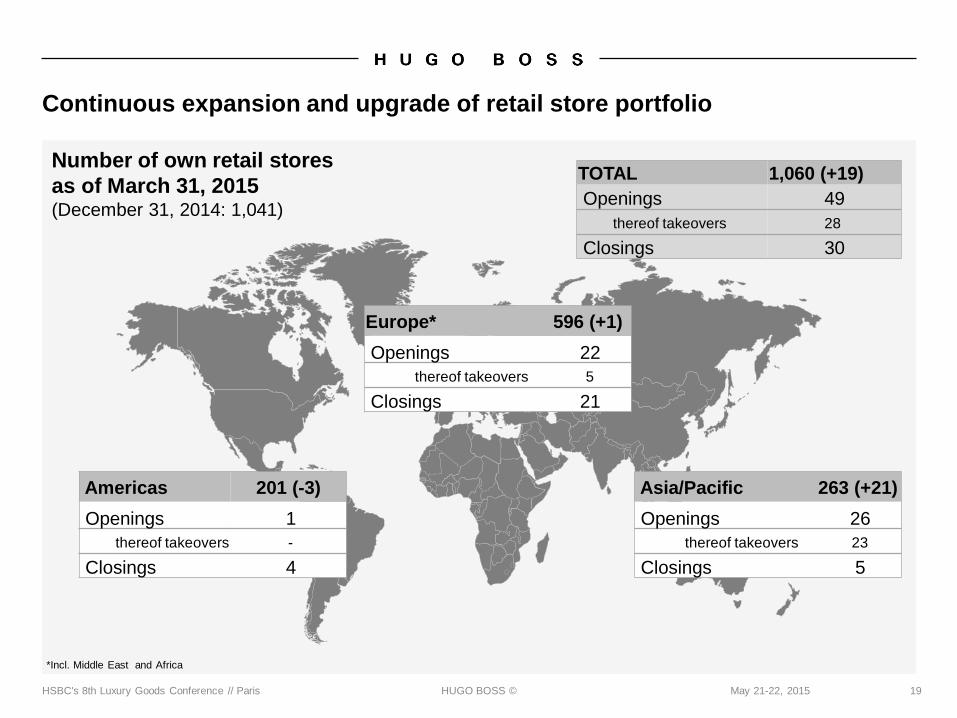
Continuous expansion and upgrade of retail store portfolio
Number of own retail stores
as of March 31, 2015(December 31, 2014: 1,041)
Americas 201 (-3)
Openings 1
thereof takeovers -
Closings 4
Asia/Pacific 263 (+21)
Openings 26
thereof takeovers 23
Closings 5
Europe* 596 (+1)
Openings 22
thereof takeovers 5
Closings 21
TOTAL 1,060 (+19)
Openings 49
thereof takeovers 28
Closings 30
*Incl. Middle East and Africa
HUGO BOSS © 20May 21-22, 2015HSBC's 8th Luxury Goods Conference // Paris
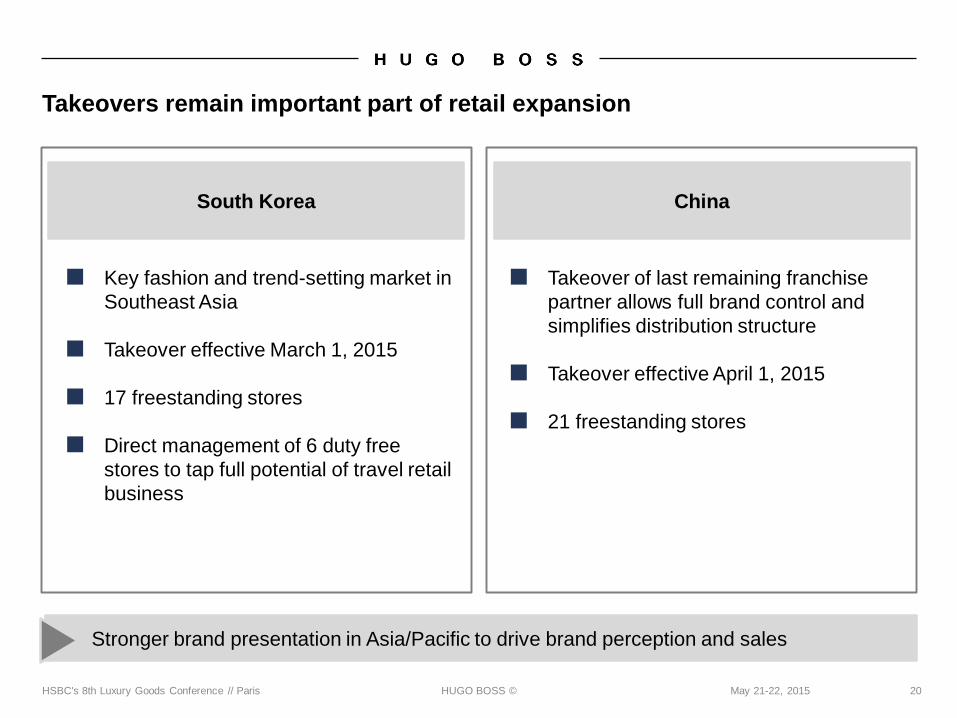
Takeovers remain important part of retail expansion
South Korea China
■ Key fashion and trend-setting market in
Southeast Asia
■ Takeover effective March 1, 2015
■ 17 freestanding stores
■ Direct management of 6 duty free
stores to tap full potential of travel retail
business
■ Takeover of last remaining franchise
partner allows full brand control and
simplifies distribution structure
■ Takeover effective April 1, 2015
■ 21 freestanding stores
Stronger brand presentation in Asia/Pacific to drive brand perception and sales
HUGO BOSS © 21May 21-22, 2015HSBC's 8th Luxury Goods Conference // Paris
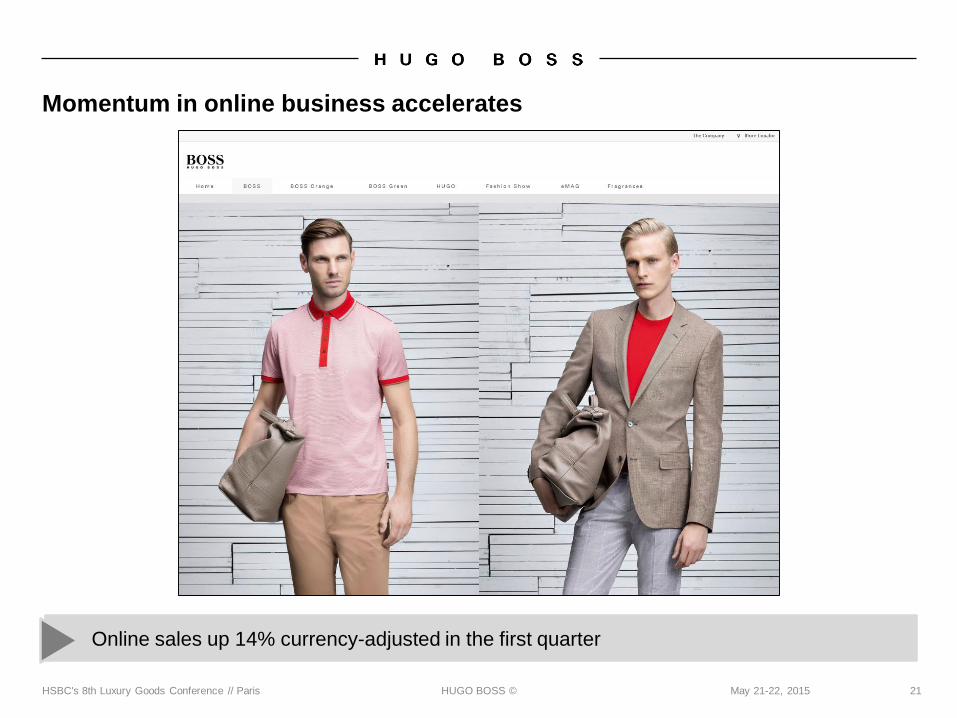
Momentum in online business accelerates
Online sales up 14% currency-adjusted in the first quarter
HUGO BOSS © 22May 21-22, 2015HSBC's 8th Luxury Goods Conference // Paris
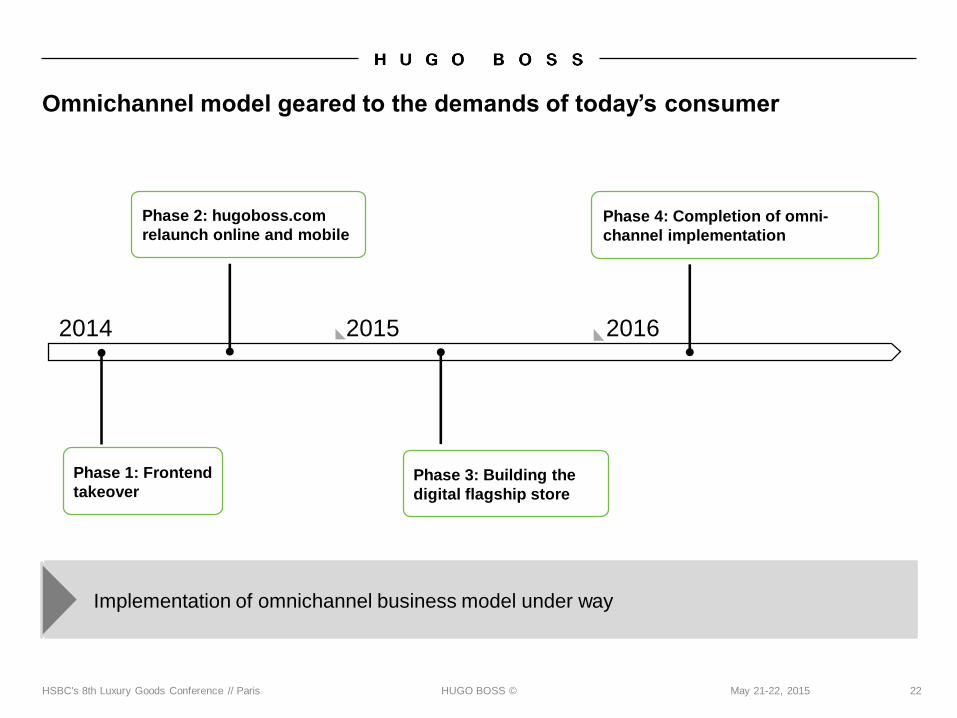
Omnichannel model geared to the demands of today’s consumer
2014 2015 2016
Phase 1: Frontend
takeover
Phase 2: hugoboss.com
relaunch online and mobile
Phase 3: Building the
digital flagship store
Phase 4: Completion of omni-
channel implementation
Implementation of omnichannel business model under way
HUGO BOSS © 23May 21-22, 2015HSBC's 8th Luxury Goods Conference // Paris
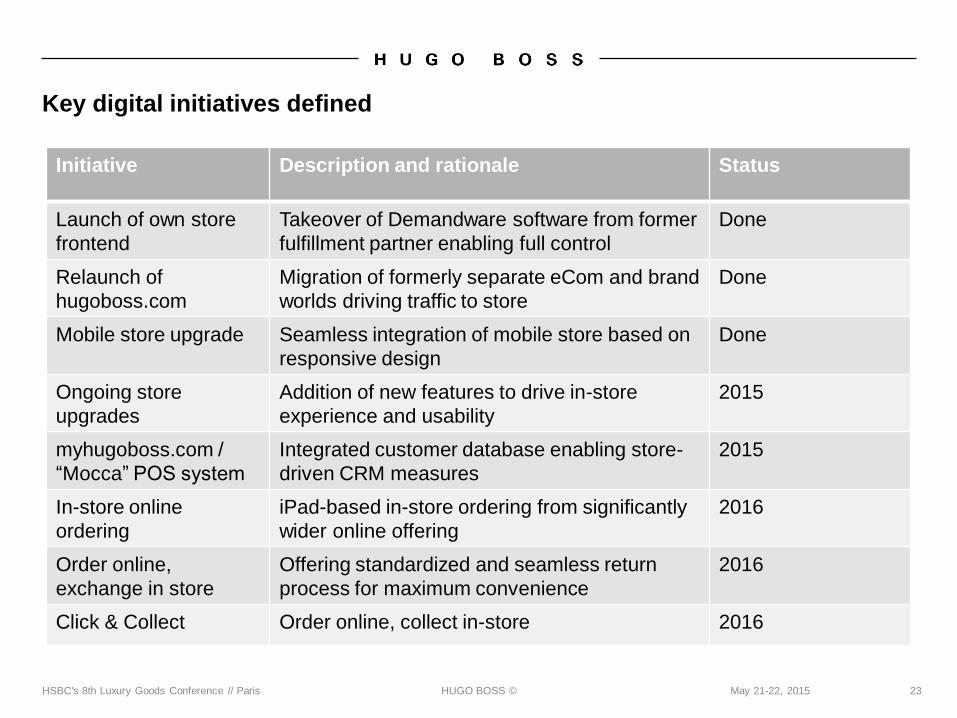
Key digital initiatives defined
Initiative Description and rationale Status
Launch of own store
frontend
Takeover of Demandware software from former
fulfillment partner enabling full control
Done
Relaunch of
hugoboss.com
Migration of formerly separate eCom and brand
worlds driving traffic to store
Done
Mobile store upgrade Seamless integration of mobile store based on
responsive design
Done
Ongoing store
upgrades
Addition of new features to drive in-store
experience and usability
2015
myhugoboss.com /
“Mocca” POS system
Integrated customer database enabling store-
driven CRM measures
2015
In-store online
ordering
iPad-based in-store ordering from significantly
wider online offering
2016
Order online,
exchange in store
Offering standardized and seamless return
process for maximum convenience
2016
Click & Collect Order online, collect in-store 2016
HUGO BOSS © 24May 21-22, 2015HSBC's 8th Luxury Goods Conference // Paris
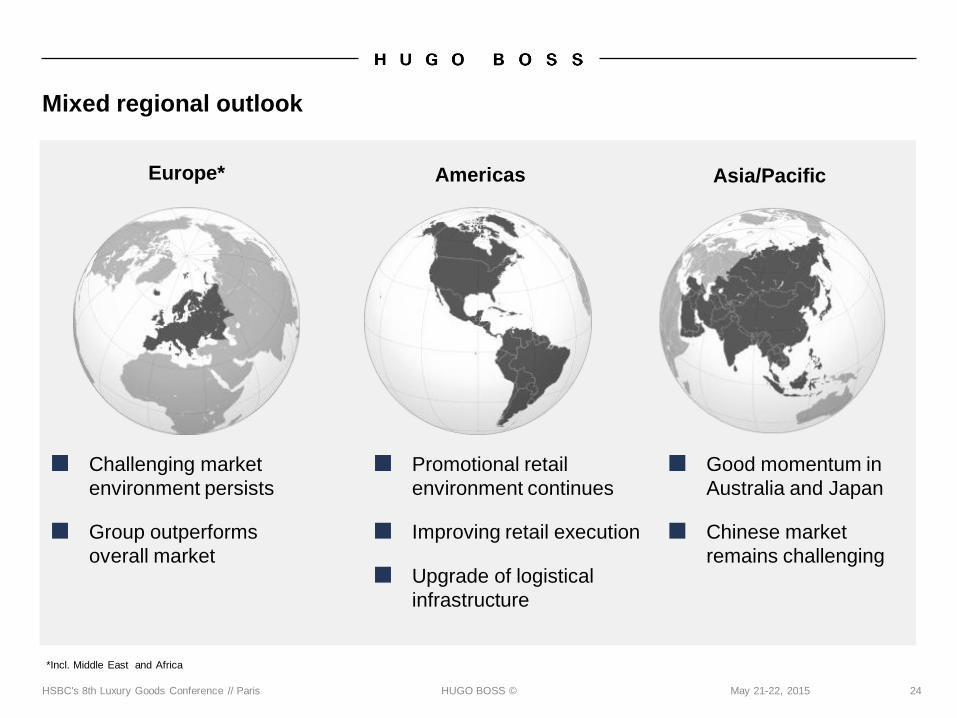
Mixed regional outlook
AmericasEurope* Asia/Pacific
*Incl. Middle East and Africa
■ Challenging market
environment persists
■ Group outperforms
overall market
■ Promotional retail
environment continues
■ Improving retail execution
■ Upgrade of logistical
infrastructure
■ Good momentum in
Australia and Japan
■ Chinese market
remains challenging
HUGO BOSS © 25May 21-22, 2015HSBC's 8th Luxury Goods Conference // Paris
New flat-packed goods distribution center operational since July 2014
HUGO BOSS © 26May 21-22, 2015HSBC's 8th Luxury Goods Conference // Paris
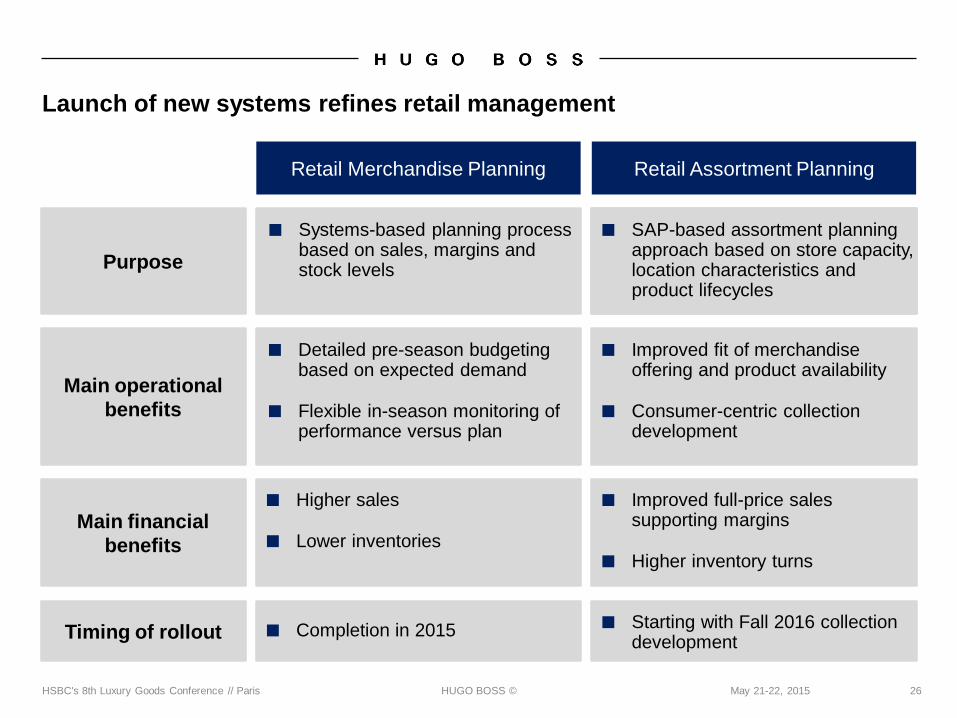
Launch of new systems refines retail management
Purpose
Main operational
benefits
Timing of rollout
Main financial
benefits
Retail Merchandise Planning Retail Assortment Planning
■ Systems-based planning process based on sales, margins and stock levels
■ SAP-based assortment planning approach based on store capacity, location characteristics and product lifecycles
■ Detailed pre-season budgeting based on expected demand
■ Flexible in-season monitoring of performance versus plan
■ Improved fit of merchandise offering and product availability
■ Consumer-centric collection development
■ Higher sales
■ Lower inventories
■ Improved full-price sales supporting margins
■ Higher inventory turns
■ Completion in 2015 ■ Starting with Fall 2016 collection development
HUGO BOSS ©
Agenda
27May 21-22, 2015HSBC's 8th Luxury Goods Conference // Paris
Financial Review First Quarter 2015
Strategic Outlook 2015
Financial Outlook 2015
HUGO BOSS © 28May 21-22, 2015HSBC's 8th Luxury Goods Conference // Paris
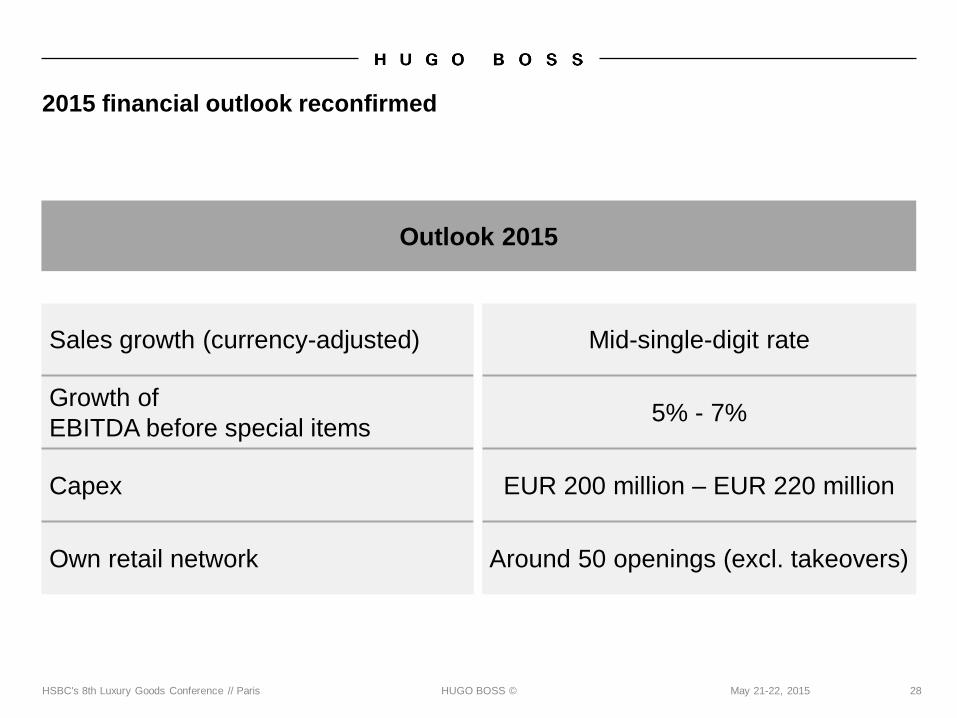
2015 financial outlook reconfirmed
Outlook 2015
Sales growth (currency-adjusted) Mid-single-digit rate
Growth of
EBITDA before special items5% - 7%
Capex EUR 200 million – EUR 220 million
Own retail network Around 50 openings (excl. takeovers)
HUGO BOSS © 29May 21-22, 2015HSBC's 8th Luxury Goods Conference // Paris
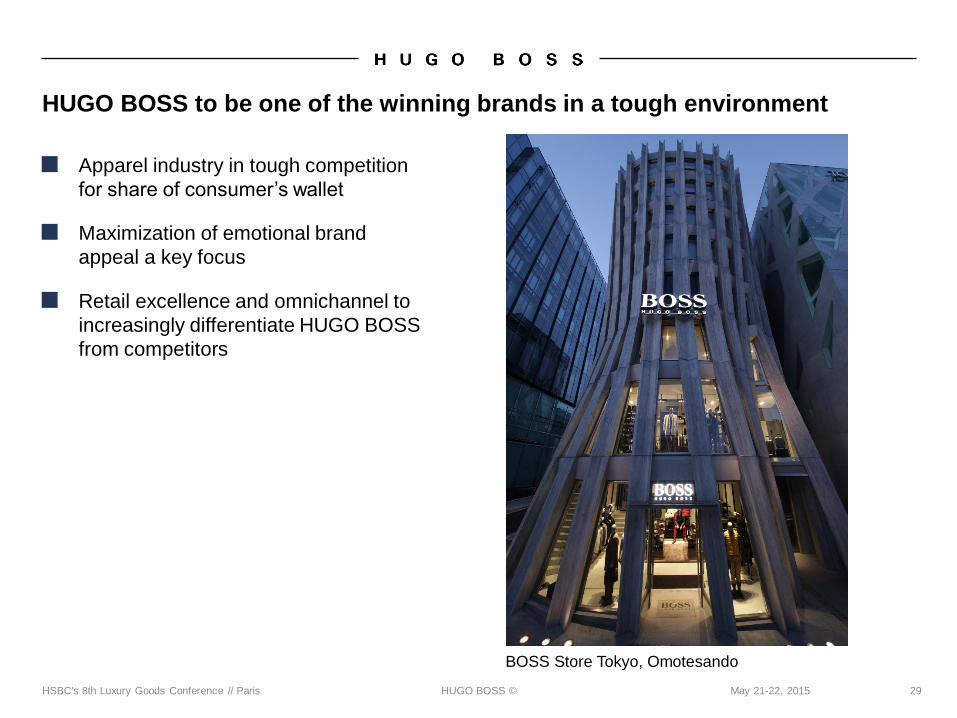
HUGO BOSS to be one of the winning brands in a tough environment
BOSS Store Tokyo, Omotesando
■ Apparel industry in tough competition
for share of consumer’s wallet
■ Maximization of emotional brand
appeal a key focus
■ Retail excellence and omnichannel to
increasingly differentiate HUGO BOSS
from competitors
HUGO BOSS © 30May 21-22, 2015HSBC's 8th Luxury Goods Conference // Paris
BACKUP
HUGO BOSS © 31May 21-22, 2015HSBC's 8th Luxury Goods Conference // Paris
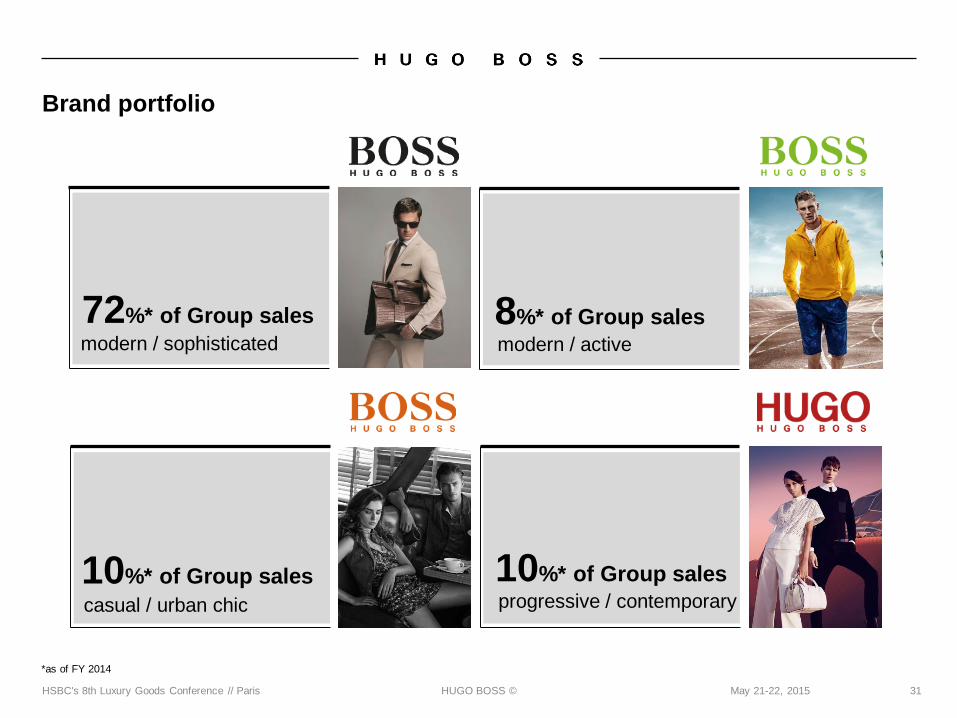
Brand portfolio
72%* of Group sales 8%* of Group sales
10%* of Group sales10%* of Group sales
modern / sophisticated
progressive / contemporary
modern / active
casual / urban chic
*as of FY 2014
HUGO BOSS © 32May 21-22, 2015HSBC's 8th Luxury Goods Conference // Paris
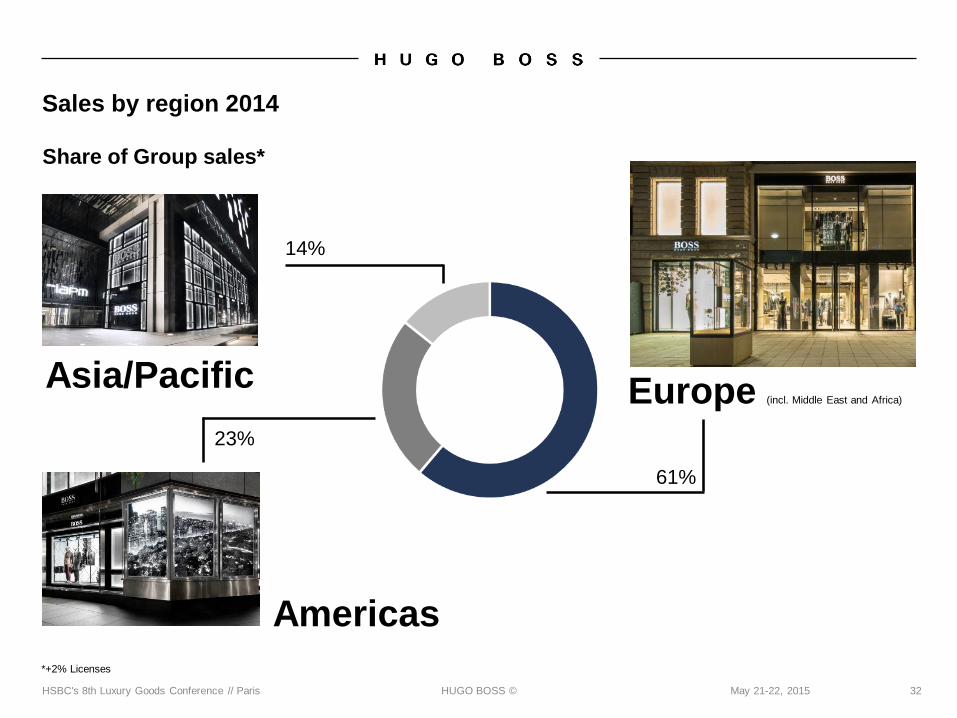
Sales by region 2014
Europe (incl. Middle East and Africa)
Asia/Pacific
Americas
Share of Group sales*
14%
23%
61%
*+2% Licenses
HUGO BOSS © 33May 21-22, 2015HSBC's 8th Luxury Goods Conference // Paris
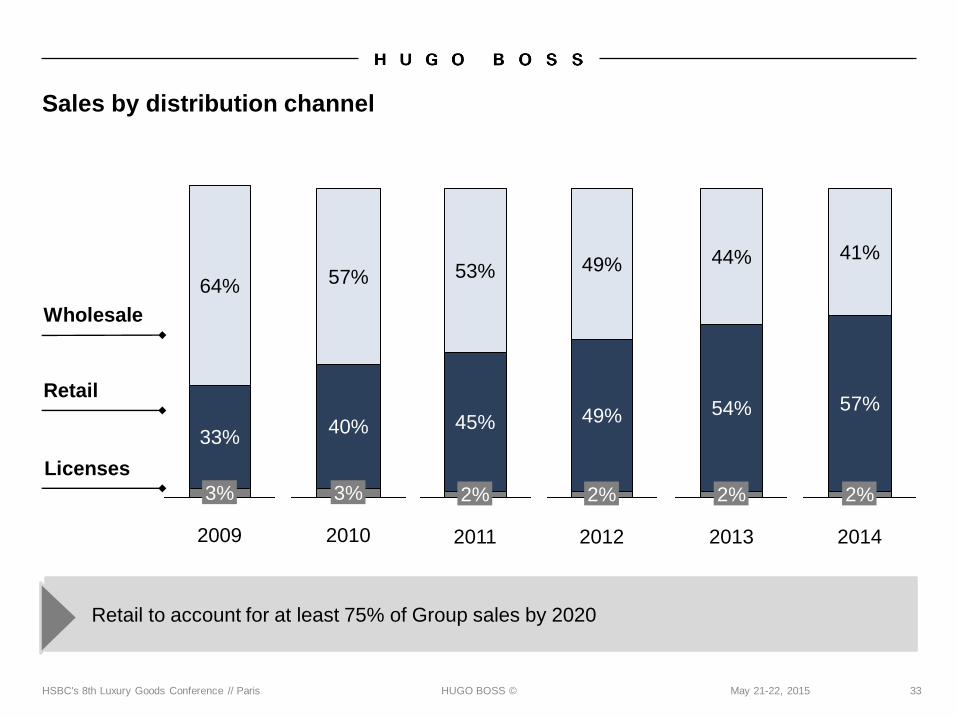
Sales by distribution channel
Wholesale
Retail
Licenses
64%
3%
2009
33%
2011
2%
45%
53%
2012
49%
49%
2% 2%
2013
44%
54%
2010
40%
3%
57%
2%
57%
2014
41%
Retail to account for at least 75% of Group sales by 2020
HUGO BOSS ©
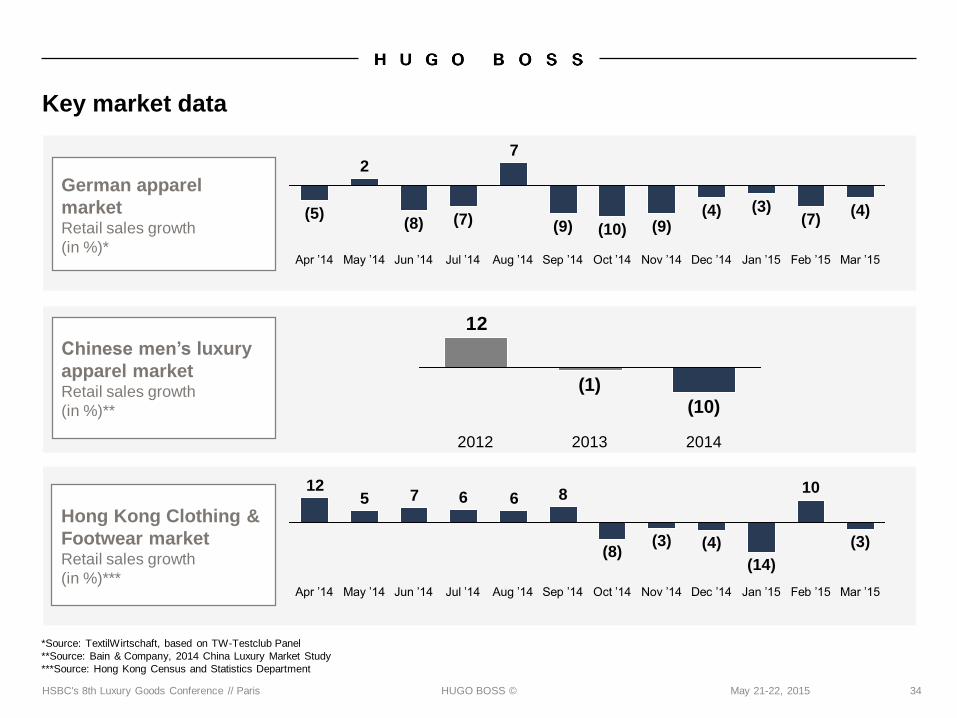
*Source: TextilWirtschaft, based on TW-Testclub Panel
**Source: Bain & Company, 2014 China Luxury Market Study
***Source: Hong Kong Census and Statistics Department
34May 21-22, 2015HSBC's 8th Luxury Goods Conference // Paris
Key market data
German apparel
marketRetail sales growth
(in %)*
Chinese men’s luxury
apparel market Retail sales growth
(in %)**
Hong Kong Clothing &
Footwear marketRetail sales growth
(in %)***
12
2014
(10)
2013
(1)
2012
8667512 10
(3)(8)
Dec ’14Nov ’14Oct ’14
(4) (3)
Feb ’15Jan ’15Sep ’14Aug ’14Jul ’14Jun ’14May ’14Apr ’14
(14)
Mar ’15
72
(9)
Jun ’14
(4)(9)(8)
May ’14 Mar ’15
(7)
Jan ’15Oct ’14Apr ’14 Nov ’14
(4)
(10)
Jul ’14 Aug ’14 Sep ’14
(3)(7)
Dec ’14 Feb ’15
(5)
HUGO BOSS © 35May 21-22, 2015HSBC's 8th Luxury Goods Conference // Paris
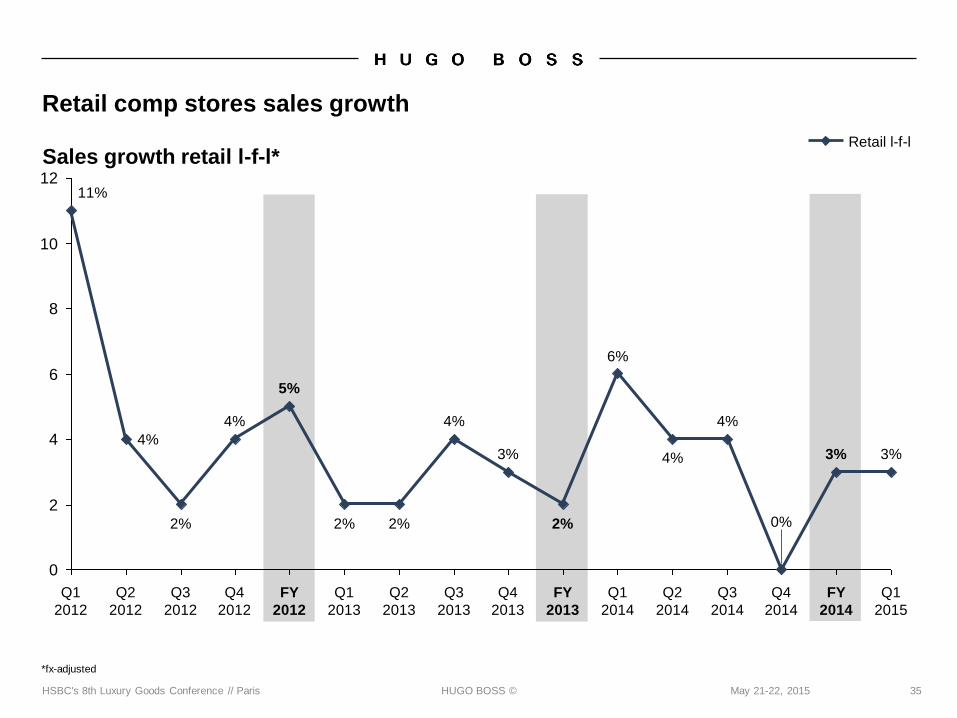
Retail comp stores sales growth
Sales growth retail l-f-l*
0
2
4
6
8
10
12
4%
Q4
2012
4%
2%
5%
3%
Q3
2013
0%
Q4
2013
FY
2012
11%
Q2
2012
Q1
2013
3%
2%
4% 4%
Q2
2014
Q1
2014
6%
3%
2%
4%
FY
2014
Q2
2013
Q3
2014
Q1
2012
2%
Q4
2014
FY
2013
Q3
2012
Q1
2015
Retail l-f-l
*fx-adjusted
HUGO BOSS © 36May 21-22, 2015HSBC's 8th Luxury Goods Conference // Paris
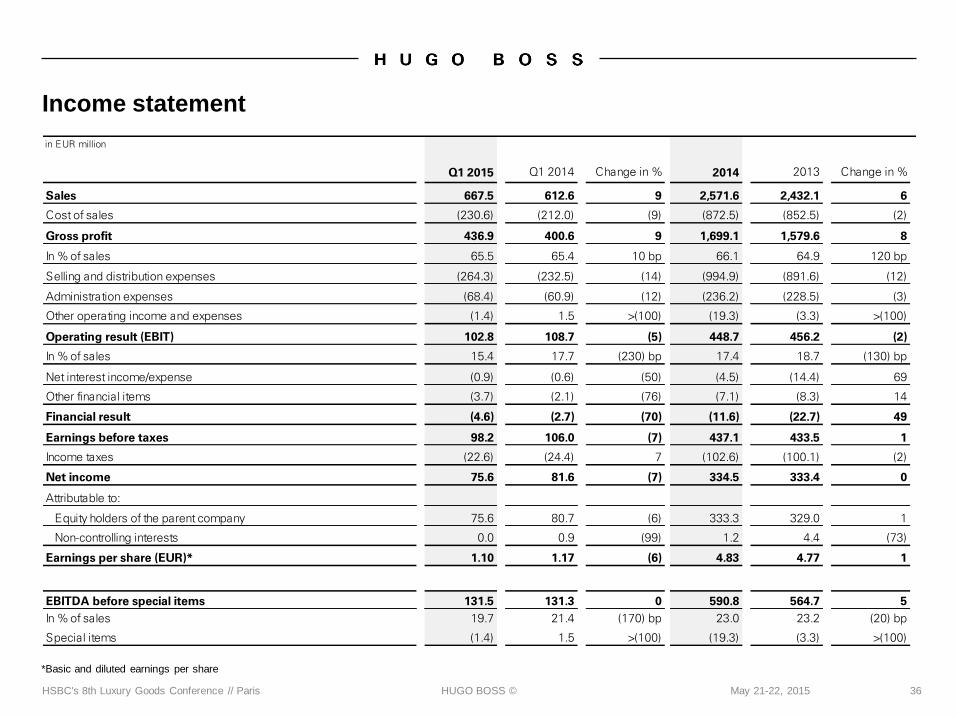
Income statement
*Basic and diluted earnings per share
in EUR million
Q1 2015 Q1 2014 Change in % 2014 2013 Change in %
Sales 667.5 612.6 9 2,571.6 2,432.1 6
Cost of sales (230.6) (212.0) (9) (872.5) (852.5) (2)
Gross profit 436.9 400.6 9 1,699.1 1,579.6 8
In % of sales 65.5 65.4 10 bp 66.1 64.9 120 bp
Selling and distribution expenses (264.3) (232.5) (14) (994.9) (891.6) (12)
Administration expenses (68.4) (60.9) (12) (236.2) (228.5) (3)
Other operating income and expenses (1.4) 1.5 >(100) (19.3) (3.3) >(100)
Operating result (EBIT) 102.8 108.7 (5) 448.7 456.2 (2)
In % of sales 15.4 17.7 (230) bp 17.4 18.7 (130) bp
Net interest income/expense (0.9) (0.6) (50) (4.5) (14.4) 69
Other financial items (3.7) (2.1) (76) (7.1) (8.3) 14
Financial result (4.6) (2.7) (70) (11.6) (22.7) 49
Earnings before taxes 98.2 106.0 (7) 437.1 433.5 1
Income taxes (22.6) (24.4) 7 (102.6) (100.1) (2)
Net income 75.6 81.6 (7) 334.5 333.4 0
Attributable to:
Equity holders of the parent company 75.6 80.7 (6) 333.3 329.0 1
Non-controlling interests 0.0 0.9 (99) 1.2 4.4 (73)
Earnings per share (EUR)* 1.10 1.17 (6) 4.83 4.77 1
EBITDA before special items 131.5 131.3 0 590.8 564.7 5
In % of sales 19.7 21.4 (170) bp 23.0 23.2 (20) bp
Special items (1.4) 1.5 >(100) (19.3) (3.3) >(100)
HUGO BOSS © 37May 21-22, 2015HSBC's 8th Luxury Goods Conference // Paris
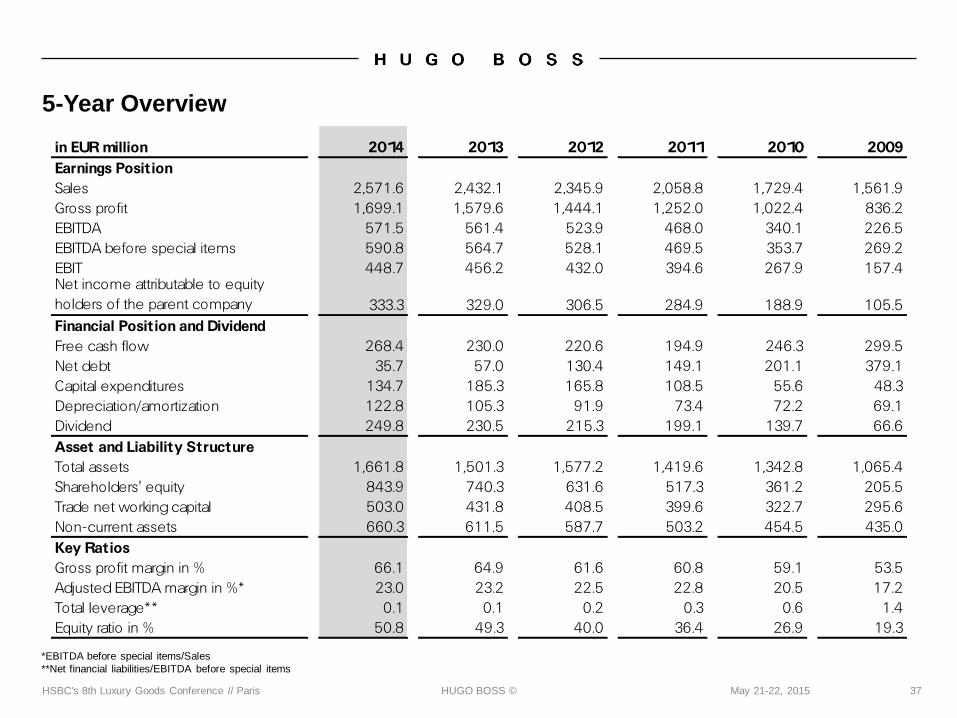
5-Year Overview
in EUR million 2014 2013 2012 2011 2010 2009Earnings PositionSales 2,571.6 2,432.1 2,345.9 2,058.8 1,729.4 1,561.9Gross profit 1,699.1 1,579.6 1,444.1 1,252.0 1,022.4 836.2EBITDA 571.5 561.4 523.9 468.0 340.1 226.5EBITDA before special items 590.8 564.7 528.1 469.5 353.7 269.2EBIT 448.7 456.2 432.0 394.6 267.9 157.4Net income attributable to equity holders of the parent company 333.3 329.0 306.5 284.9 188.9 105.5Financial Position and DividendFree cash flow 268.4 230.0 220.6 194.9 246.3 299.5Net debt 35.7 57.0 130.4 149.1 201.1 379.1Capital expenditures 134.7 185.3 165.8 108.5 55.6 48.3Depreciation/amortization 122.8 105.3 91.9 73.4 72.2 69.1Dividend 249.8 230.5 215.3 199.1 139.7 66.6Asset and Liability StructureTotal assets 1,661.8 1,501.3 1,577.2 1,419.6 1,342.8 1,065.4Shareholders' equity 843.9 740.3 631.6 517.3 361.2 205.5Trade net working capital 503.0 431.8 408.5 399.6 322.7 295.6Non-current assets 660.3 611.5 587.7 503.2 454.5 435.0Key RatiosGross profit margin in % 66.1 64.9 61.6 60.8 59.1 53.5Adjusted EBITDA margin in %* 23.0 23.2 22.5 22.8 20.5 17.2Total leverage** 0.1 0.1 0.2 0.3 0.6 1.4Equity ratio in % 50.8 49.3 40.0 36.4 26.9 19.3
*EBITDA before special items/Sales
**Net financial liabilities/EBITDA before special items
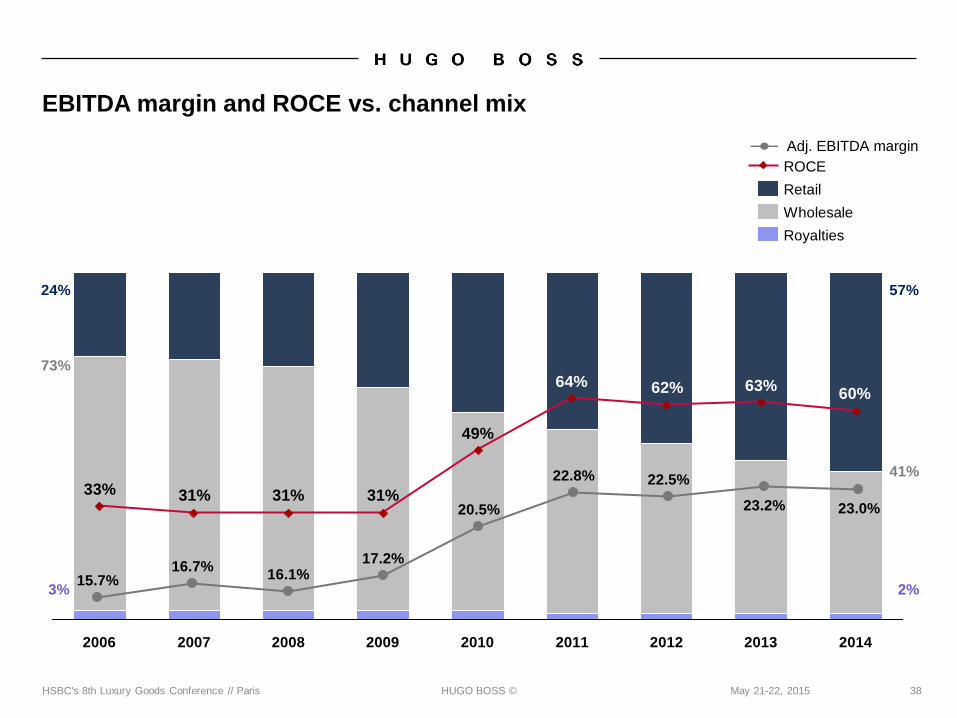
HUGO BOSS © 38May 21-22, 2015HSBC's 8th Luxury Goods Conference // Paris
EBITDA margin and ROCE vs. channel mix
49%
31%31%31%33%
60%63%62%64%
2012201120102009200820072006 20142013
ROCE
Wholesale
Royalties
Retail
24%
73%
41%
Adj. EBITDA margin
3% 2%
22.5%
17.2%16.1%
22.8%
20.5% 23.2%
16.7%
23.0%
15.7%
57%
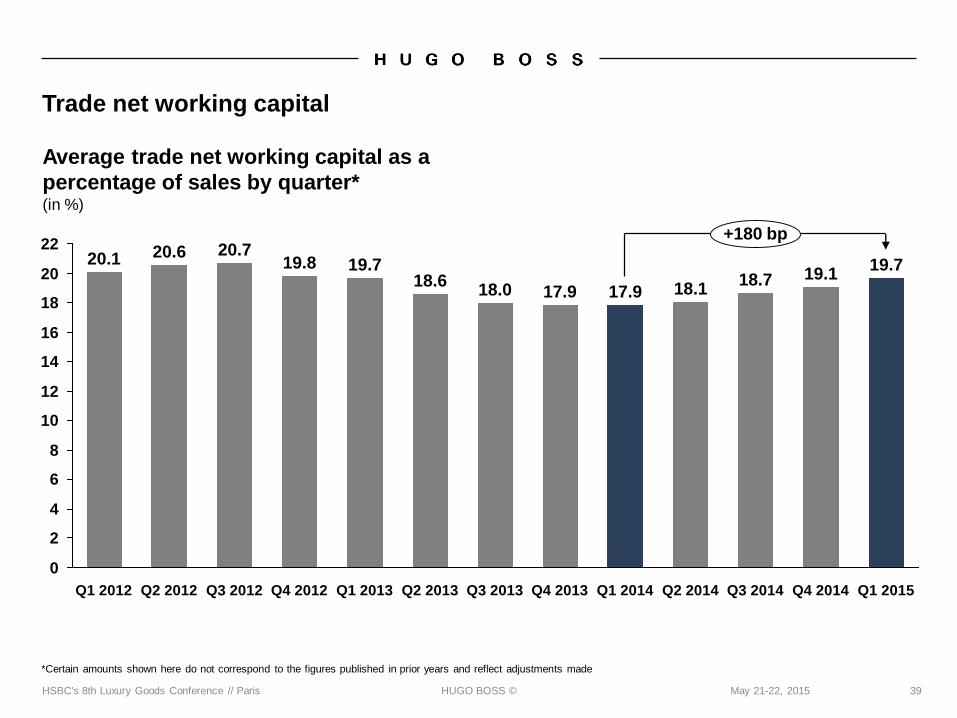
HUGO BOSS © 39May 21-22, 2015HSBC's 8th Luxury Goods Conference // Paris
Trade net working capital
Average trade net working capital as a
percentage of sales by quarter*(in %)
0
2
4
6
8
10
12
14
16
18
20
22
19.7
+180 bp
Q4 2014
19.1
Q3 2014
18.7
Q2 2014
18.1
Q1 2014
17.9
Q4 2013
17.9
Q3 2013
18.0
Q2 2013
18.6
Q1 2013
19.7
Q4 2012
19.8
Q3 2012
20.7
Q2 2012
20.6
Q1 2012
20.1
Q1 2015
*Certain amounts shown here do not correspond to the figures published in prior years and reflect adjustments made
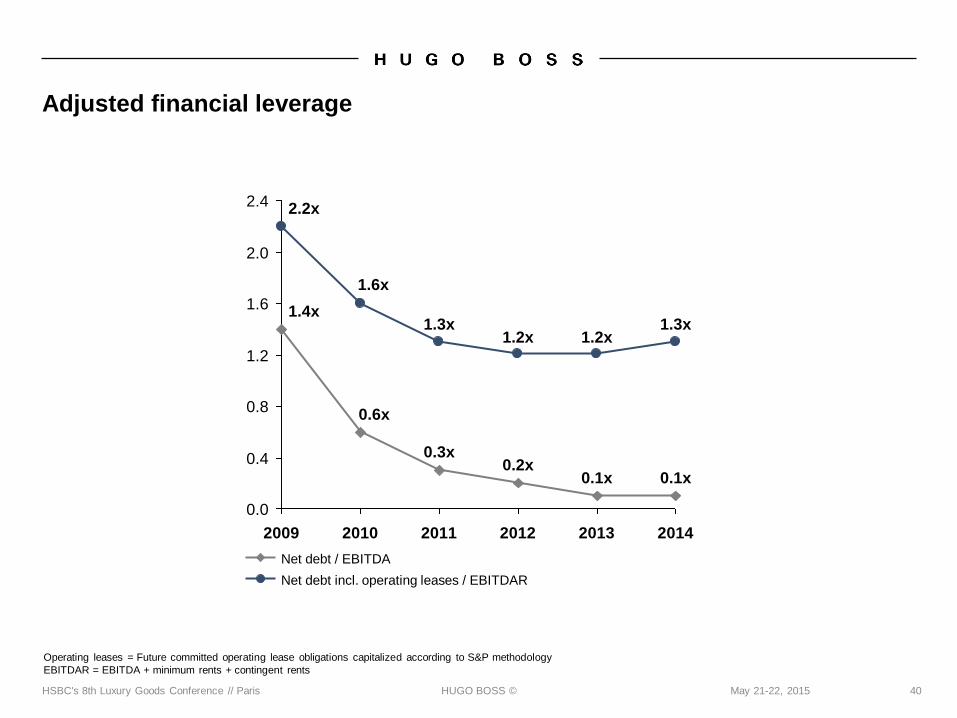
HUGO BOSS © 40May 21-22, 2015HSBC's 8th Luxury Goods Conference // Paris
Adjusted financial leverage
Operating leases = Future committed operating lease obligations capitalized according to S&P methodology
EBITDAR = EBITDA + minimum rents + contingent rents
2009 2010 2011 2012 2013 2014
2.0
0.8
1.6
2.4
1.2
0.0
0.4
1.3x
0.1x
1.2x
0.1x
1.2x
0.2x
1.3x
0.3x
1.6x
0.6x
2.2x
1.4x
Net debt / EBITDA
Net debt incl. operating leases / EBITDAR
HUGO BOSS ©
*As a percentage of net profit attributable to the shareholders of the parent company
41May 21-22, 2015HSBC's 8th Luxury Goods Conference // Paris
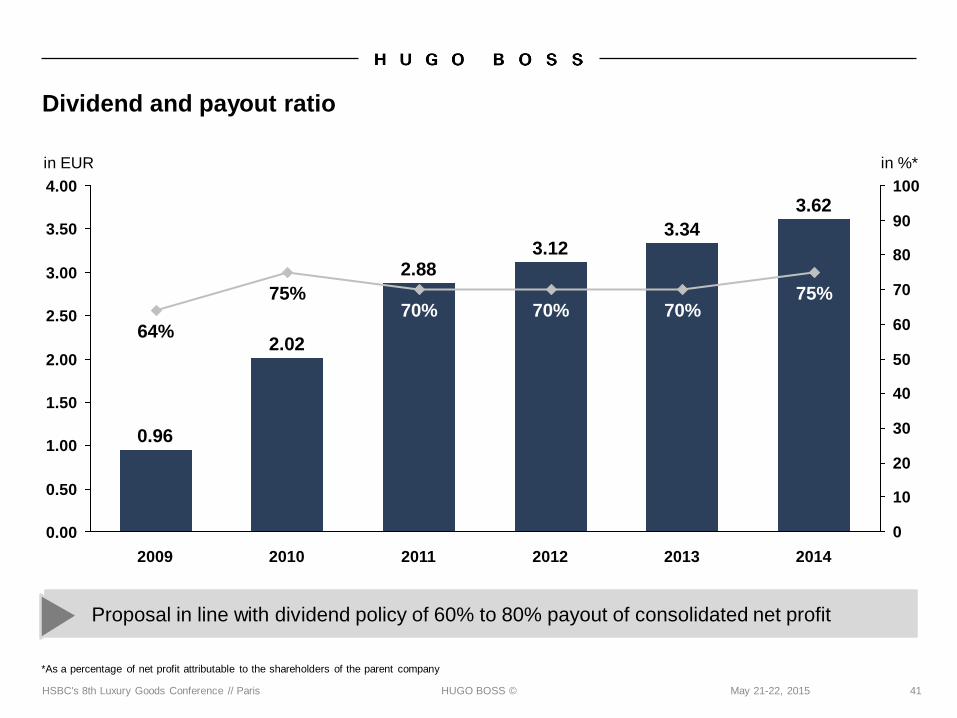
Dividend and payout ratio
0
10
20
30
40
50
60
70
80
90
100
3.50
1.50
3.00
2.50
2.00
1.00
0.50
0.00
4.00
2014
3.62
75%
2013
3.34
70%
2012
3.12
70%
2011
2.88
70%
2010
2.02
75%
2009
0.96
64%
in EUR in %*
Proposal in line with dividend policy of 60% to 80% payout of consolidated net profit
HUGO BOSS © 42May 21-22, 2015HSBC's 8th Luxury Goods Conference // Paris
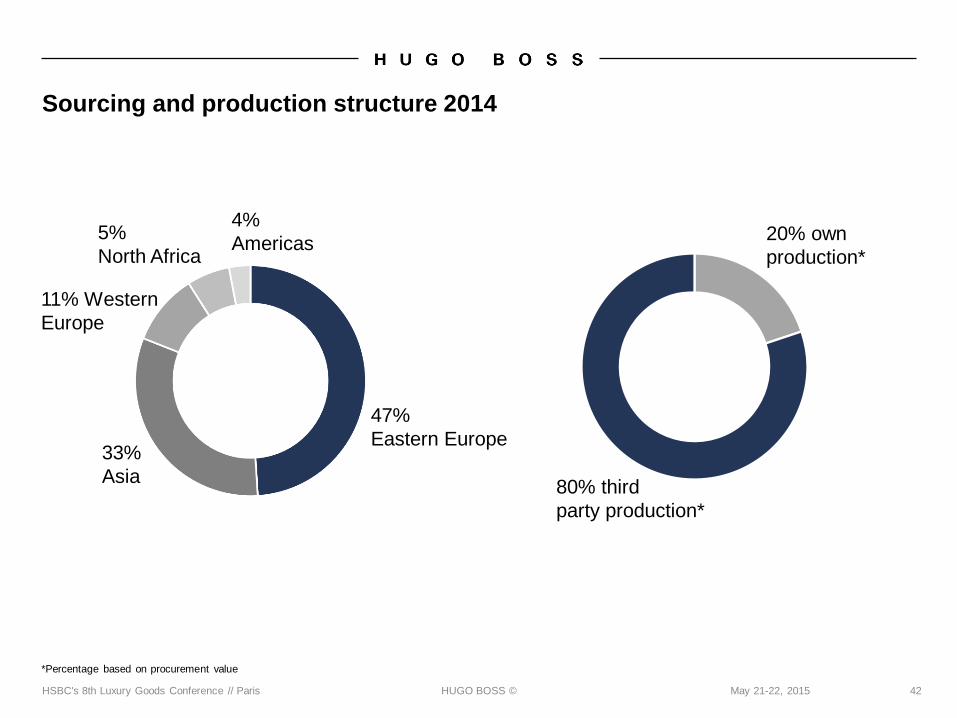
Sourcing and production structure 2014
5%
North Africa
11% Western
Europe
4%
Americas
33%
Asia
47%
Eastern Europe
80% third
party production*
20% own
production*
*Percentage based on procurement value
HUGO BOSS © 43May 21-22, 2015HSBC's 8th Luxury Goods Conference // Paris
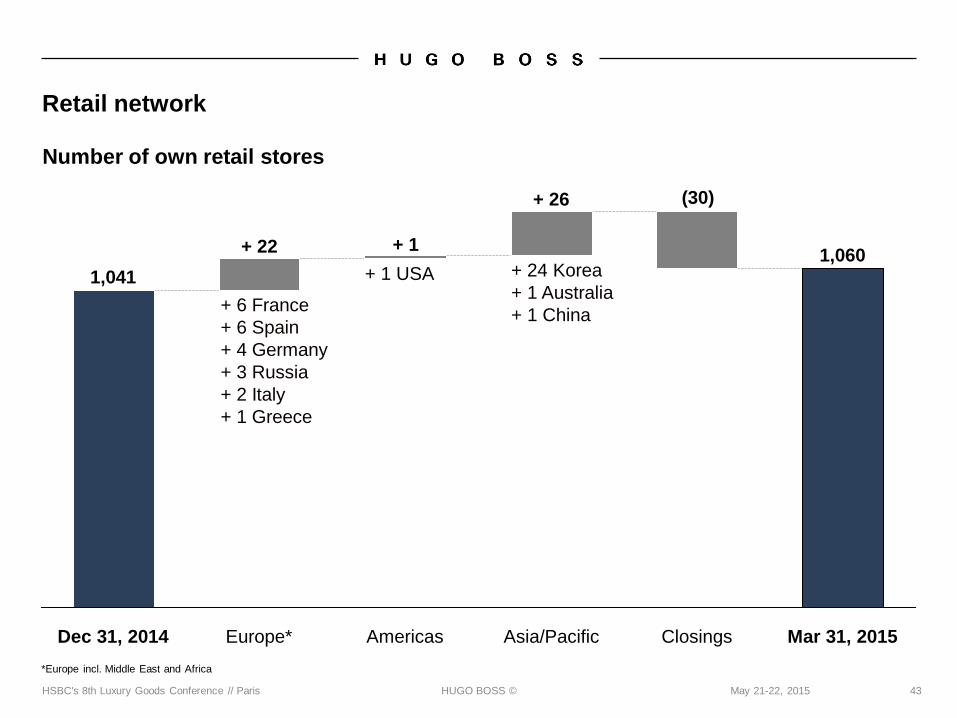
Retail network
Number of own retail stores
*Europe incl. Middle East and Africa
Mar 31, 2015
1,041
1,060
ClosingsAsia/PacificAmericasEurope*Dec 31, 2014
+ 22 + 1
+ 26 (30)
+ 6 France
+ 6 Spain
+ 4 Germany
+ 3 Russia
+ 2 Italy
+ 1 Greece
+ 1 USA + 24 Korea
+ 1 Australia
+ 1 China
HUGO BOSS © 44May 21-22, 2015HSBC's 8th Luxury Goods Conference // Paris
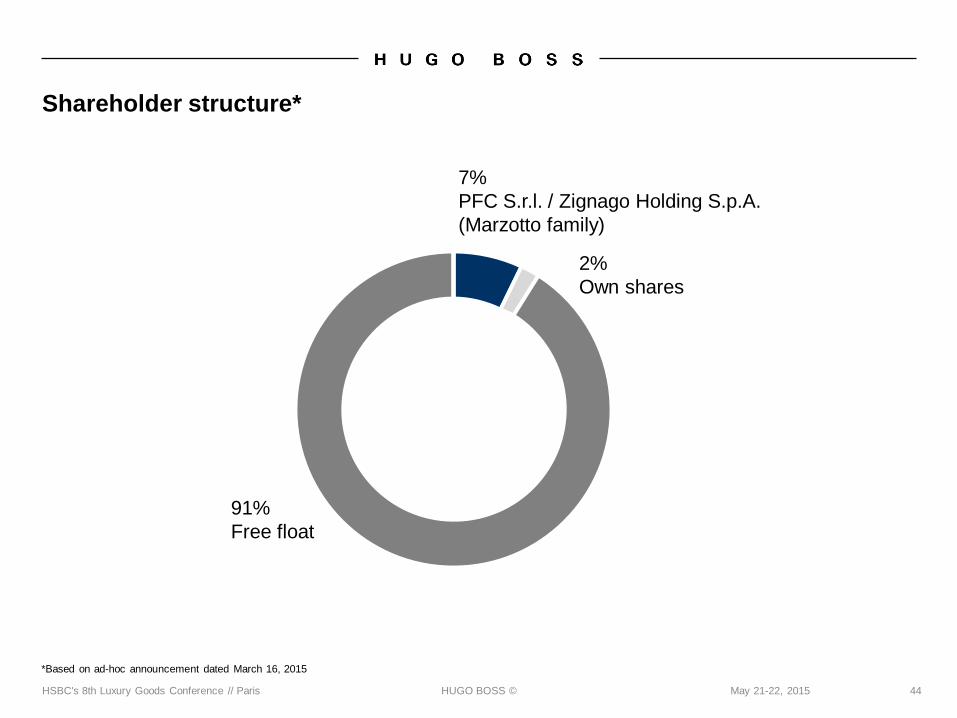
Shareholder structure*
91%
Free float
2%
Own shares
7%
PFC S.r.l. / Zignago Holding S.p.A.
(Marzotto family)
*Based on ad-hoc announcement dated March 16, 2015
HUGO BOSS © 45May 21-22, 2015HSBC's 8th Luxury Goods Conference // Paris
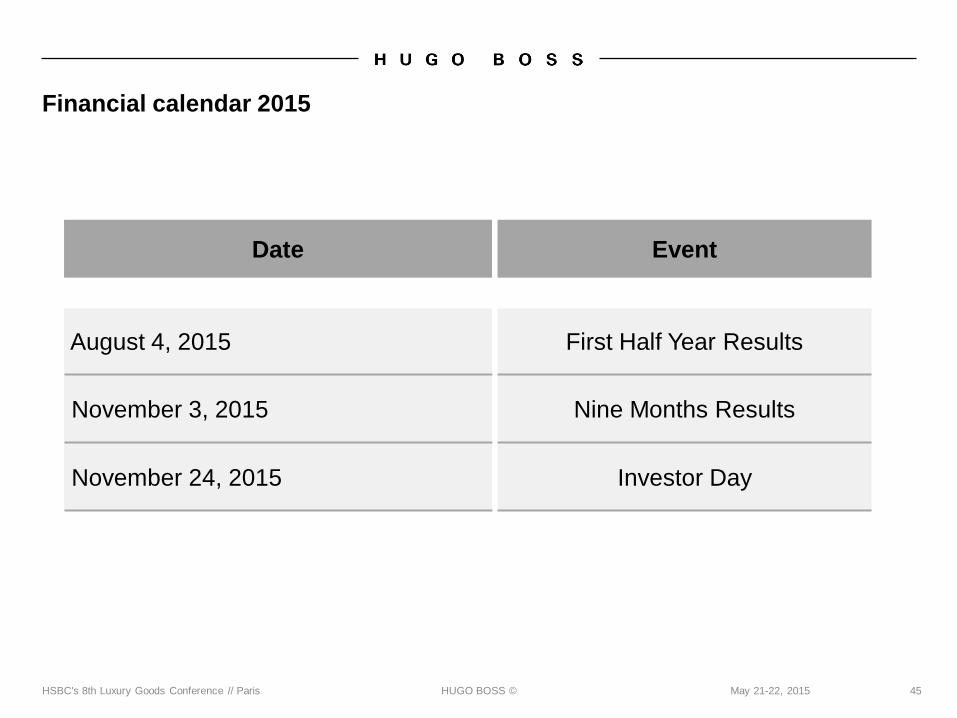
Financial calendar 2015
Date Event
August 4, 2015 First Half Year Results
November 3, 2015 Nine Months Results
November 24, 2015 Investor Day
HUGO BOSS © 46May 21-22, 2015HSBC's 8th Luxury Goods Conference // Paris
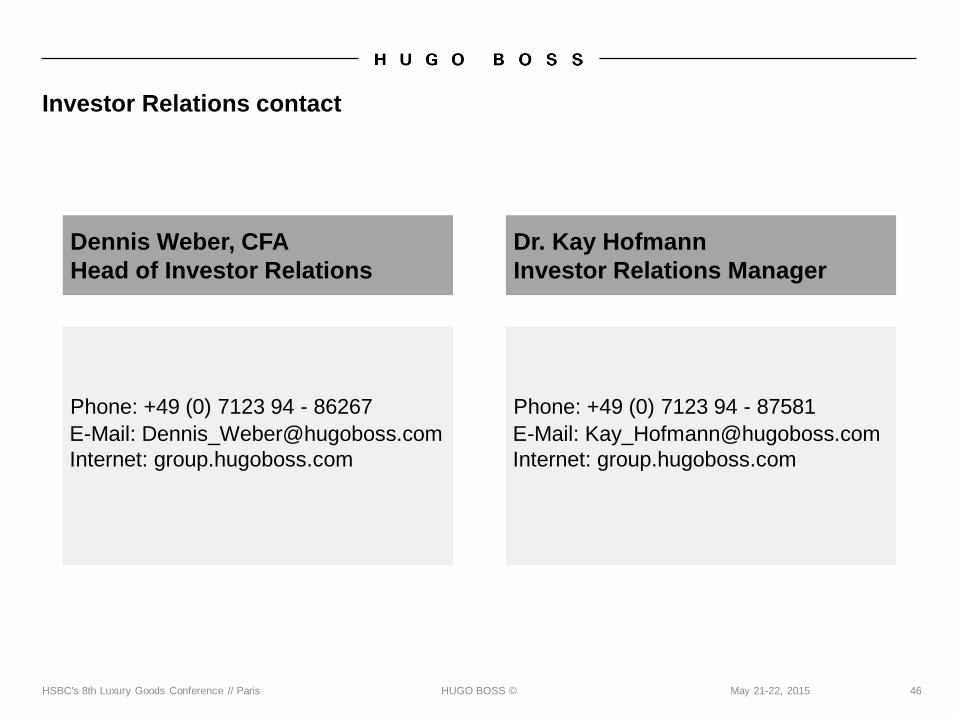
Investor Relations contact
Dennis Weber, CFA
Head of Investor Relations
Phone: +49 (0) 7123 94 - 86267
E-Mail: [email protected]
Internet: group.hugoboss.com
Dr. Kay Hofmann
Investor Relations Manager
Phone: +49 (0) 7123 94 - 87581
E-Mail: [email protected]
Internet: group.hugoboss.com
HUGO BOSS ©
Forward looking statements contain risks
47May 21-22, 2015HSBC's 8th Luxury Goods Conference // Paris
This document contains forward-looking statements that reflect management's current
views with respect to future events. The words "anticipate ", "assume ", "believe",
"estimate", "expect", "intend", "may", "plan", "project", "should", and similar expressions
identify forward-looking statements. Such statements are subject to risks and
uncertainties. If any of these or other risks and uncertainties occur, or if the assumptions
underlying any of these statements prove incorrect, then actual results may be materially
different from those expressed or implied by such statements. We do not intend or assume
any obligation to update any forward-looking statement, which speaks only as of the date
on which it is made.


