20
The Hunger Index 2009: Santa Clara & San Mateo Counties Dr. S. Andrew Starbird Cindy McCown Alana Sampson Michael Enos
| Date post: | 20-Aug-2015 |
| Category: |
Documents |
| Upload: | 2ndharvest |
| View: | 1,694 times |
| Download: | 0 times |
The Hunger Index 2009:Santa Clara & San Mateo
Counties
Dr. S. Andrew Starbird Cindy McCownAlana Sampson Michael Enos
www.scu.edu/business
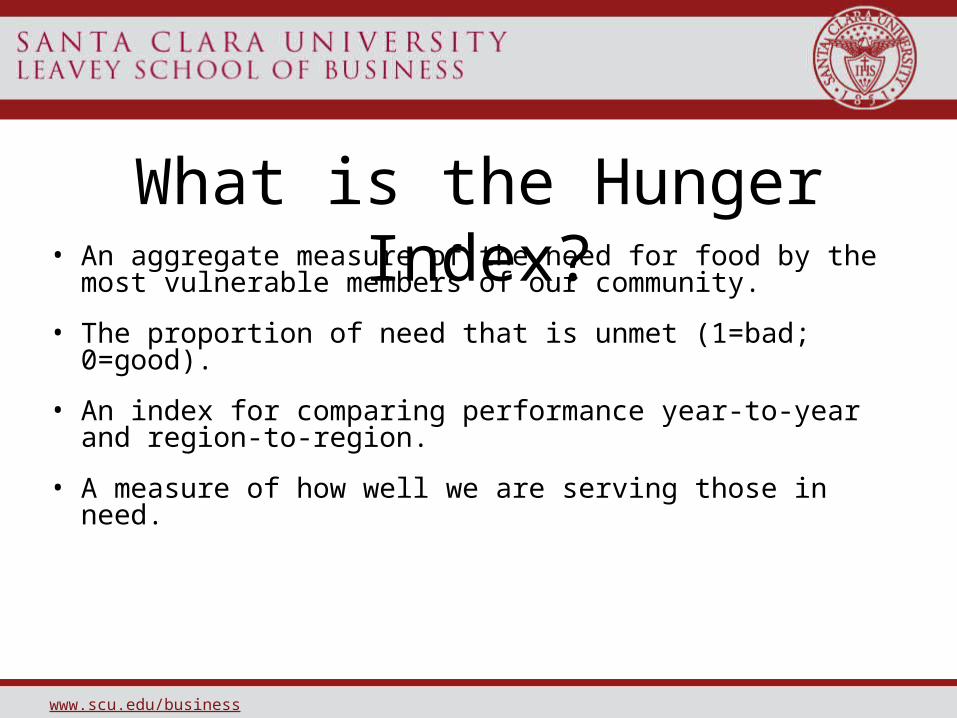
What is the Hunger Index?• An aggregate measure of the need for food by the most
vulnerable members of our community.
• The proportion of need that is unmet (1=bad; 0=good).
• An index for comparing performance year-to-year and region-to-region.
• A measure of how well we are serving those in need.

www.scu.edu/business
Why is the Hunger Index important?• It measures whether we are achieving our goals.
• It helps forecast the need for food assistance in Santa Clara and San Mateo Counties.
• It helps food assistance programs make strategic decisions about activities.
• It communicates the need in an accessible way (missing meals).
• It helps our partners (agencies, contributors, government) understand the need for food in the community.

www.scu.edu/business
Methodology• Based on data from US Department of Commerce, USDA,
CHIS, UCLA, SC County, SM County, and our partners.
• Three main components: Total meals required to be healthy, total meals purchased by households, and total food assistance provided.
• As estimates turn into actuals, we update our index to ensure consistency.
• Thank you to all the agencies that provided data!

www.scu.edu/business
Calculating Missing MealsTMR-MP-FAP=MM
TMR: Total Meals Required (By needy households per year)
MP: Meals Purchased (Meals purchased by needy households with their own funds)
FAP: Food Assistance Provided (The sum of all meals distributed by food assistance programs)
MM: Missing Meals
www.scu.edu/business
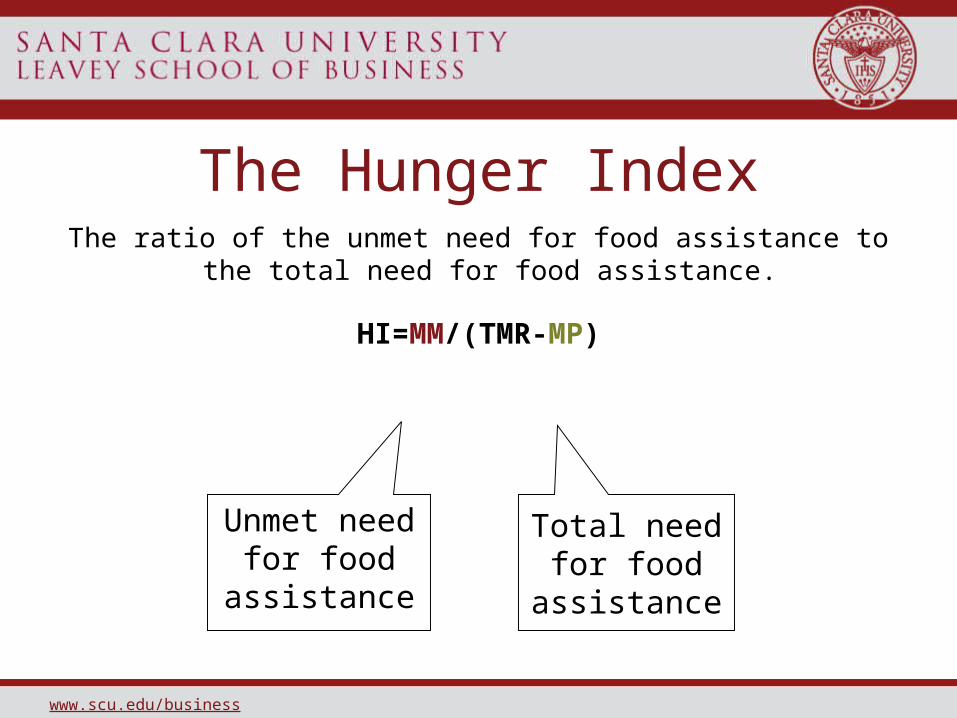
The Hunger IndexThe ratio of the unmet need for food assistance to the total need for food
assistance.
HI=MM/(TMR-MP)
Total need for
food assistance
Unmet need for food
assistance
www.scu.edu/business
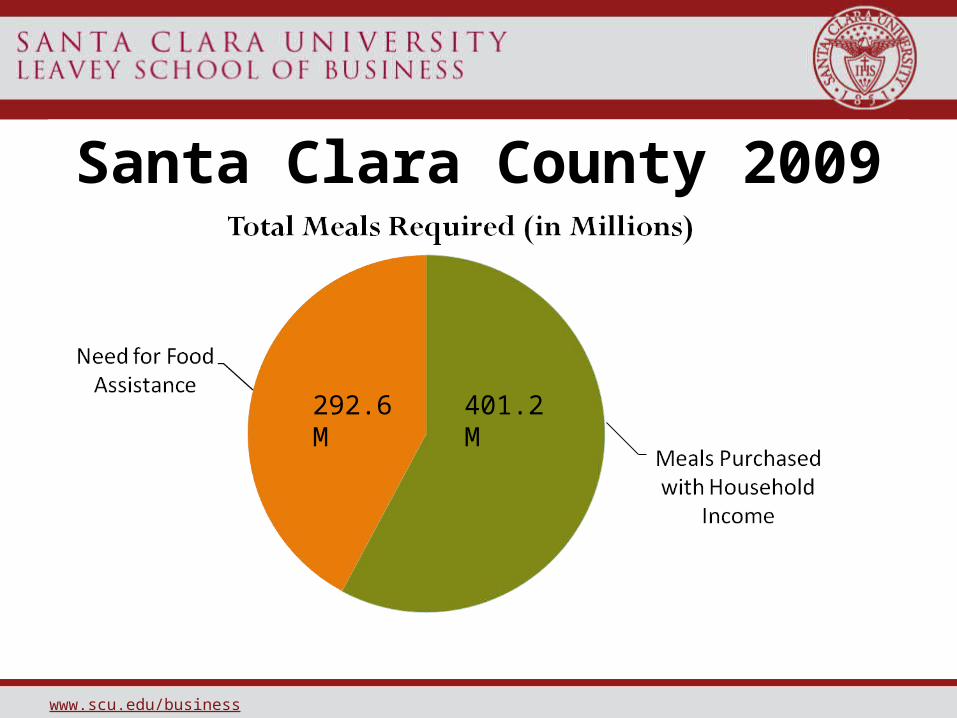
292.6 M 401.2 M
Santa Clara County 2009

www.scu.edu/business
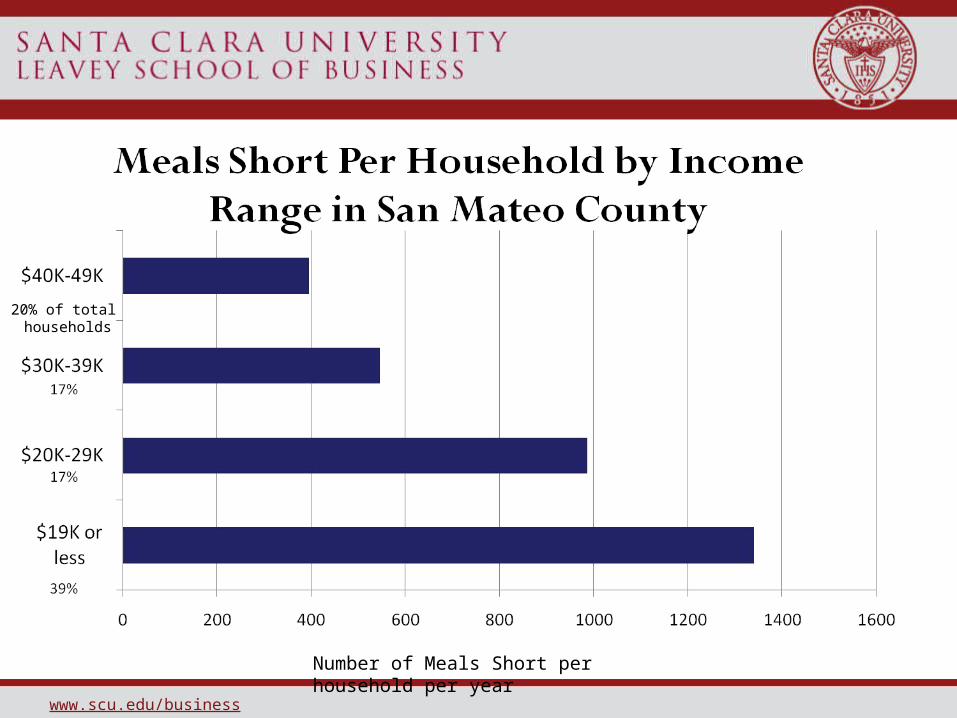
18% of total households
19%
41%
Number of Meals Short per household per year
www.scu.edu/business
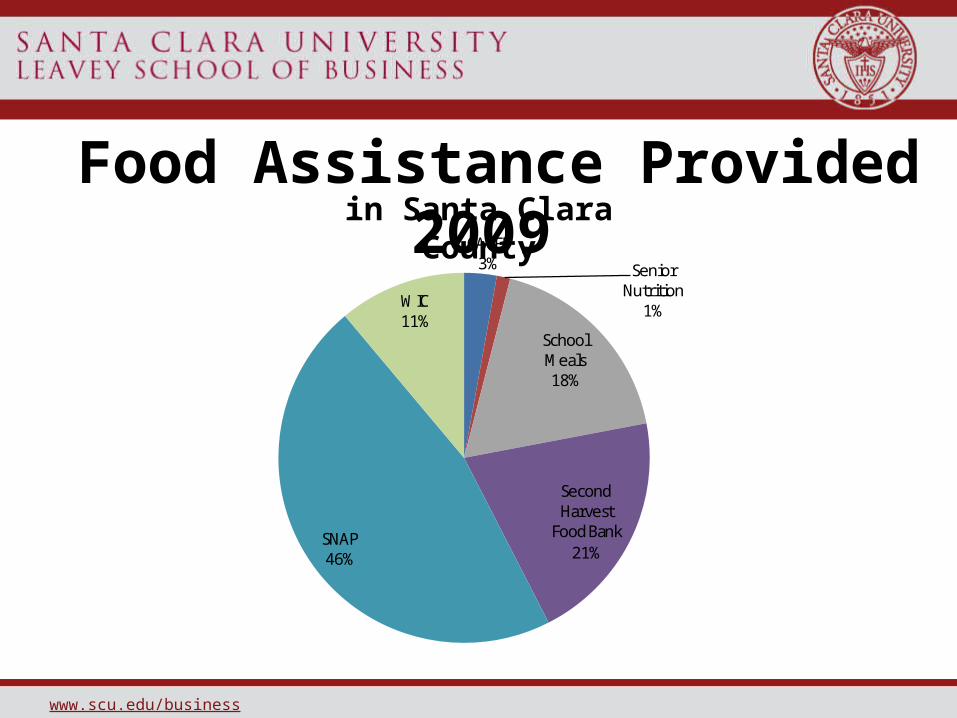
CACFP3% Senior
Nutrition1%
School Meals18%
Second Harvest
Food Bank21%
SNAP46%
WIC11%
Food Assistance Provided 2009 in Santa Clara County

www.scu.edu/business
Food Assistance: Closing the Gap
401.2M292.6M
Food Assistance Provided
Missing Meals
109.4 M183.1M63%
37%
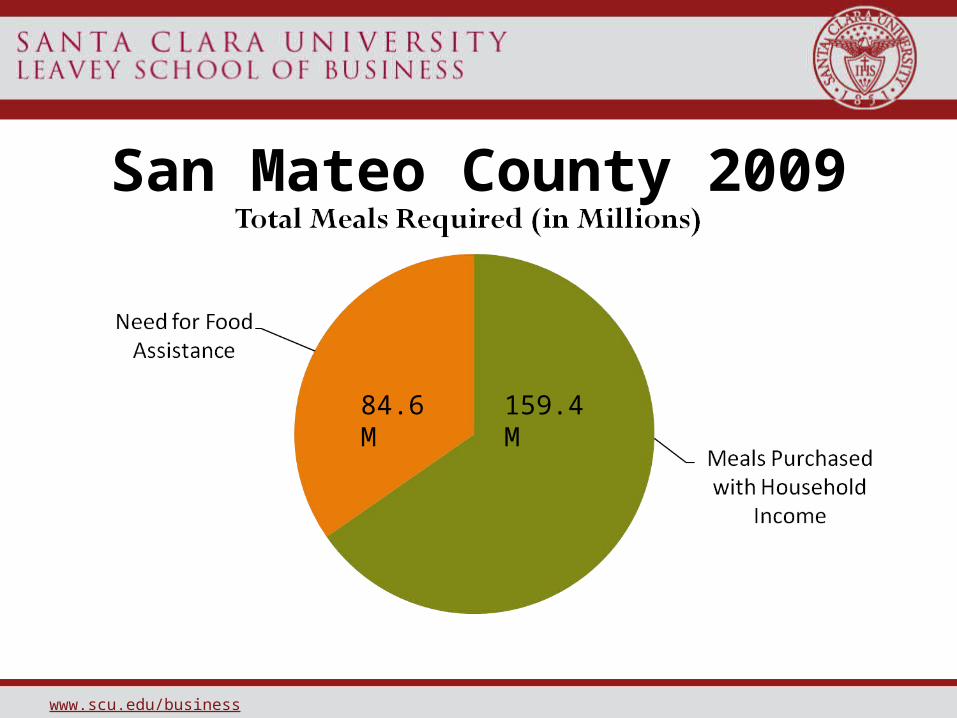
Meals Purchased with Household
Income
Need for Food Assistance
www.scu.edu/business
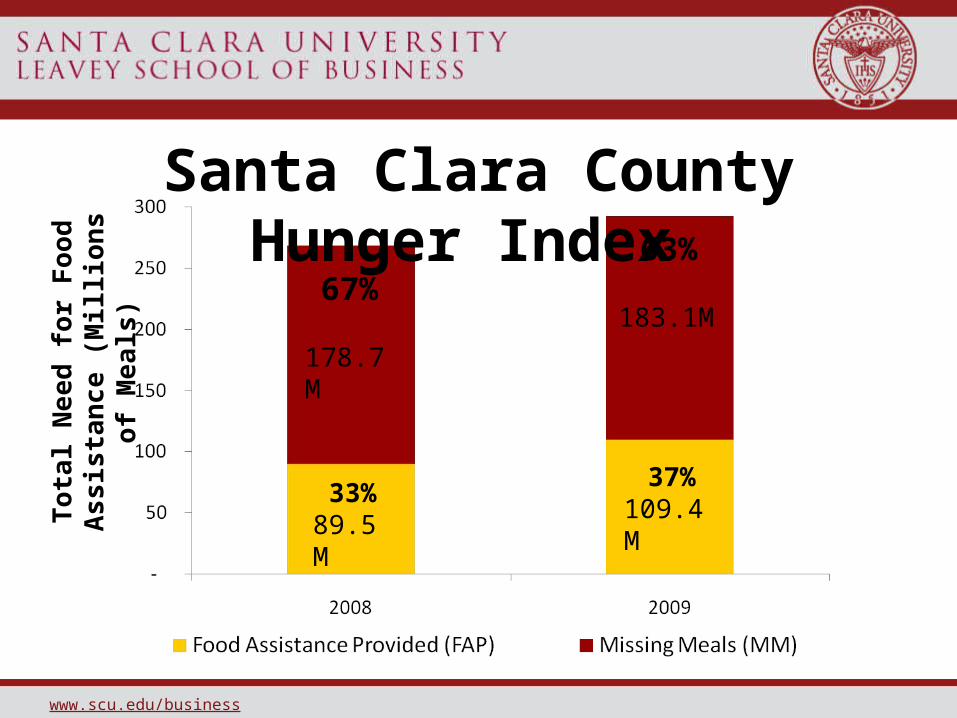
Santa Clara County Hunger Index
37%33%
63%67%
178.7M
89.5M
183.1M
109.4M
Tota
l Nee
d fo
r Foo
d As
sist
ance
(Mill
ions
of M
eals
)
www.scu.edu/business
San Mateo County 2009
84.6 M 159.4 M
www.scu.edu/business
Number of Meals Short per household per year
20% of total households
www.scu.edu/business
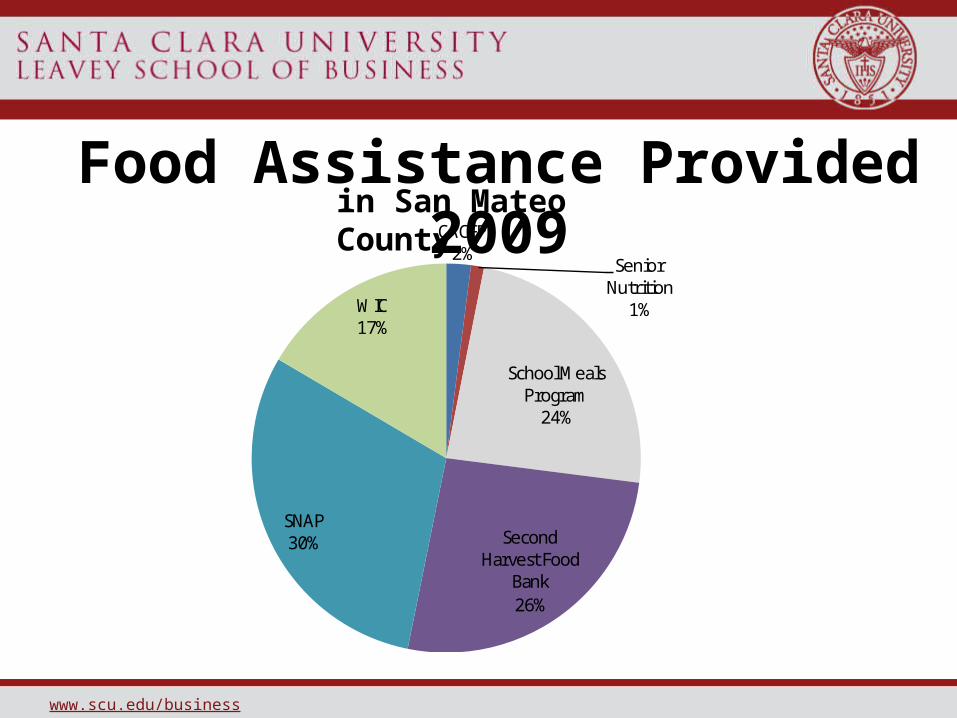
CACFP2%
Senior Nutrition
1%
School Meals Program
24%
Second Harvest Food
Bank26%
SNAP 30%
WIC17%
Food Assistance Provided 2009
in San Mateo County

www.scu.edu/business
Food Assistance: Closing the Gap
84.6 M 159.4 M
55.4M 29.2 M65%
Missing Meals
Food Assistance Provided
Meals Purchased with Household
Income
www.scu.edu/business
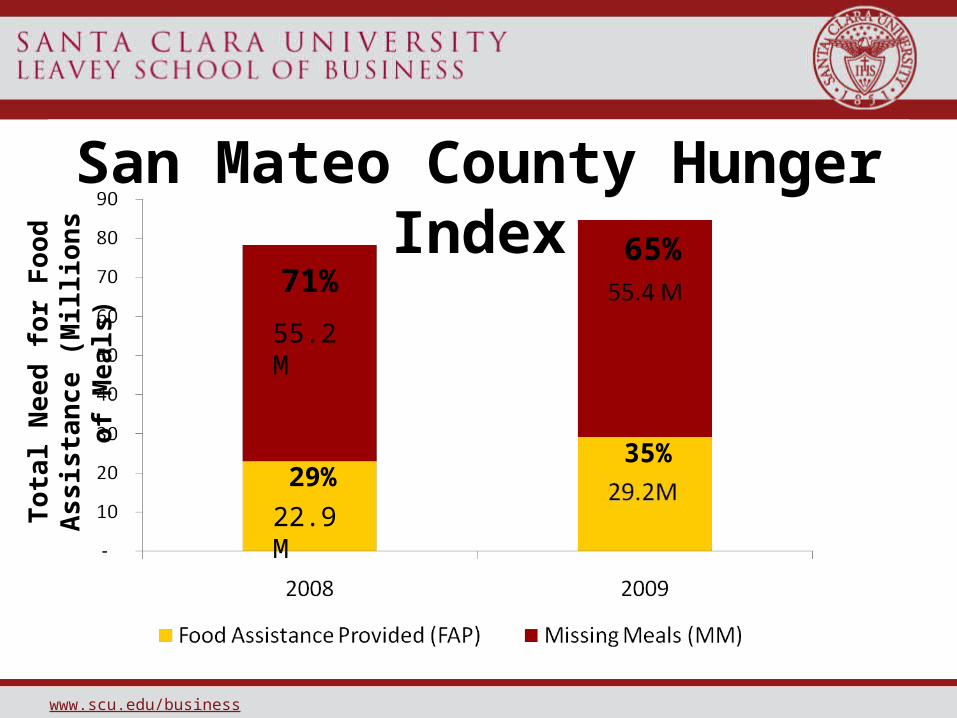
San Mateo County Hunger Index65%
71%
35%29%
55.2 M
22.9M
Tota
l Nee
d fo
r Foo
d As
sist
ance
(Mill
ions
of M
eals
)

www.scu.edu/business
Total Hunger IndexCombined Santa Clara & San Mateo Counties
63%68%
37%32%
Tota
l Nee
d fo
r Foo
d As
sist
ance
(M
illio
ns o
f Mea
ls)
233.9M
112.5M
238.5M
138.7M
www.scu.edu/business
Summary of HI 2009• We’re meeting more of the need: Hunger index down 4%!
• Population grew, purchasing power declined, total need for food assistance up 8-9%.
• Agencies step up: 23% increase in food assistance provided.
• Leading the charge: SNAP, School Meals, the Food Bank
• A long way to go: 238 million Missing Meals
• Missing meals could feed 218,000 (less than population of Marin County)
www.scu.edu/business
Turning the Corner on Hunger• The message: We can solve this problem.
• What would it take to reduce the HI by 1%?
– Less than 3 million meals in SC County
– Less than 850 thousand meals in SM County
• The community rose to the challenge in 2009.
• None of us can solve this problem on our own, but together we can make a meaningful difference.

www.scu.edu/business
Thank you!
Drew Starbird Cindy McCownAlana Sampson Michael Enos


