34
Monitoring Results of Two PBS Demonstration Vehicles in the Forestry Industry in South Africa Paul Nordengen, CSIR, South Africa

Monitoring Results of Two PBS Demonstration Vehicles in the Forestry Industry in South Africa
Paul Nordengen, CSIR, South Africa

Contents • Introduc)on • Vehicle Monitoring
– Distance travelled – Tons transported – Combina)on mass & payload – Road wear – Fuel consump)on & efficiency – Safety performance
• Way forward

Background • 7ISHVWD, Del,, June 2002: PBS workshop • Melbourne, Feb 2003: PBS seminar
• RTMS accreditaHon system iniHated in the forestry industry in 2003 – prerequisite for PBS involvement
• April 2004, Study tour to Australia with DoT and forestry industry representaHves
• PBS commiPee established in 2004
• April 2005, Study tour with Board Members of the SA Road Freight AssociaHon

Background (cont.) • LePer of support from Minister of Transport • Two global forestry & paper companies, Mondi and Sappi, indicated an interest in PBS demonstraHon projects
• ARRB and MSD in Australia appointed to carry out PBS assessments based on Level 2 of the Australian system
• Two PBS demonstraHon vehicles commissioned in Nov and Dec 2007

Forestry baseline and PBS vehicles


PBS Lane Change Manoeuvre (SAE J2179)
Source: Mechanical System Dynamics, Melbourne, 2007

Baseline cf. PBS vehicle
Source: Mechanical System Dynamics, Melbourne, 2007

Parameters to Monitor • Distance travelled per month and lead distance per trip
• CombinaHon mass and payload • Average speeds (loaded & unloaded) • Trip duraHon • Fuel consumpHon & efficiency
• Incidents/accidents • Breakdowns • Tyre life and costs • Life cycle of foundaHon brakes • Suspension life • Community reacHon

Distance Travelled per Month

Tons Transported per Month


Payload Efficiency Factor (PEF)

© CSIR 2008 www.csir.co.za
Comparison of PEF with Sample of Trucks: OECD Project

Slide# 22

Road Wear Effects

Road Wear Effects (cont)

Route Monitoring

MONDI MEREBANK MILL
DURBAN
N3
UNDERBERG
MOOIRIVER
Mondi PBS Vehicle Route
Source: Mondi

Source: Mondi
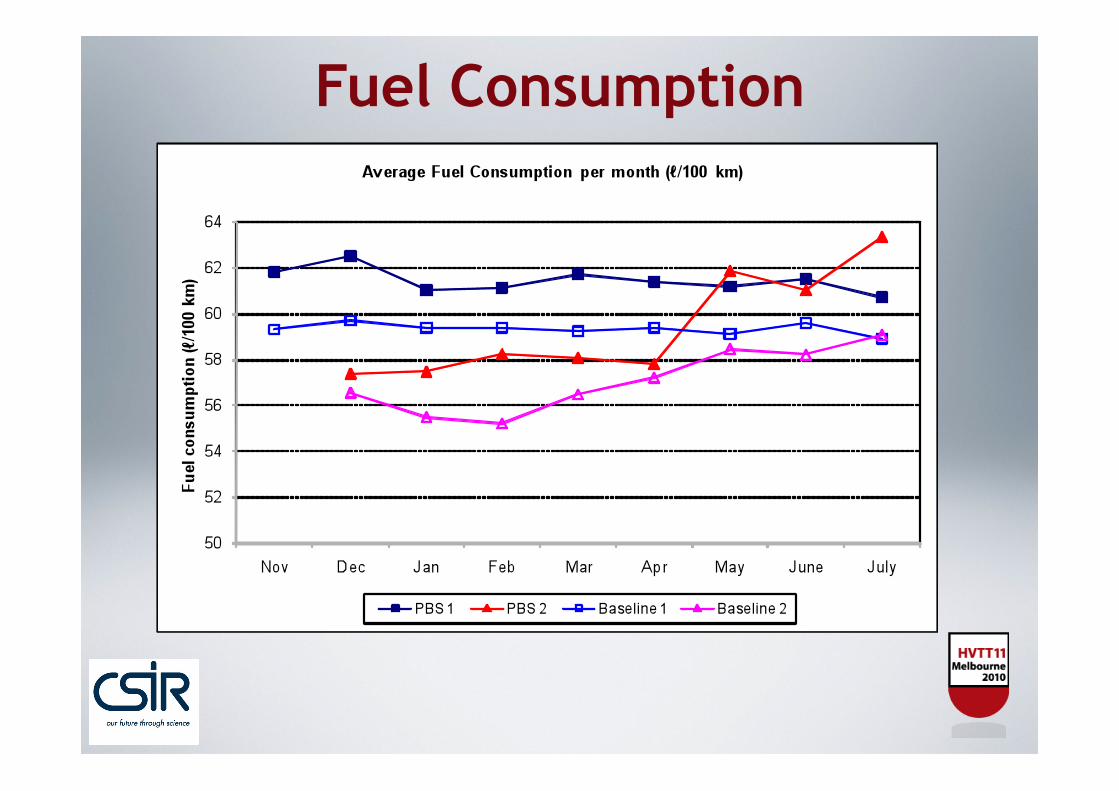
Fuel Consumption

Fuel Efficiency

Safety Performance

Slide# 31
Summary of Performance Outcomes
Performance indicator Measured result
Payload Average improvement: 19.3 %
Payload Efficiency Factor Increase from 69.3 % to 70.5 %
Tons transported per month Average increase: 19.3 %
Fuel efficiency Average savings: 12.7 %
Fuel savings (based on 700 000 tons/annum contract) 485 000 litres per annum
Fleet size Reduction of 17 %
Incident/accidents* Reduction from 3.1 to 1.1 per month
CO2 emissions (based on 700 000 tons/annum contract)
Reduction of 1 280 tons of CO2 per annum
Road wear Reduction varies from 2 to 23 %
*Based on a fleet of 45 new vehicle combinations incorporating a number of PBS design features
Two vehicles, 8 months operation

Way Forward • DoT approved 30 addiHonal permits in Feb 2009 • 15 addiHonal PBS vehicles commissioned by Dec 2009
• Others are in the design phase • Other PBS demonstraHon projects in the concept/design phase: – General freight (vehicle parts) – Mining – Steel pipes – Sugar – Car carriers
• Route classificaHon • Manage negaHve publicity from rail lobbyists and others

Acknowledgements • Department of Transport • KwaZulu-‐Natal Department of Transport
• Mondi
• Sappi • NaHonal Transport Commission
• VicRoads • Queensland Transport • RoadUser • Mechanical System Dynamics • ARRB

Thank you for your attention


