24
www.risoe.dk Hybrid System Performance Evaluation Henrik Bindner, Tom Cronin, Per Lundsager, Oliver Gehrke Risø National Laboratory, Roskilde, Denmark EWEC, 2nd March 2006, Athens
| Date post: | 02-Jan-2016 |
| Category: |
Documents |
| Upload: | derek-alexander |
| View: | 29 times |
| Download: | 0 times |

www.risoe.dk
Hybrid System Performance Evaluation
Henrik Bindner, Tom Cronin, Per Lundsager, Oliver Gehrke
Risø National Laboratory, Roskilde, Denmark
EWEC, 2nd March 2006, Athens

www.risoe.dk
Hybrid System Performance Evaluation
Hybrid Systems – the Problem
How will SYSTEM 1 perform at SITE 1?
Is SYSTEM 1 better than SYSTEM 2 at SITE 2?
Can you trust the answers?
Key Issue:
Develop method for system performance assessment
Main ingredient:
System modelling, especially supervisory controller modelling

www.risoe.dk
Hybrid System Performance Evaluation
This Work – the Questions
The presentation deals with the following issues of modelling of hybrid system:
The optimum timestep to adequately take account of the wind variability.
Sensitivity of various performance criteria to the choice of timestep. The nature of controller approximations necessary for longer
timesteps.

www.risoe.dk
Hybrid System Performance Evaluation
This Work – the Approach
• Model simple system with 2 diesel gensets, 3 wind turbines and 3 loads
• Specify performance criteria
• Investigate performance for 2 different controllers and for 3 different simulation time steps
www.risoe.dk
Hybrid System Performance Evaluation
IPSYS – an explanation
IPSYS is a flexible framework for simulation of integrated energy systems
• IPSYS is a dispatch model - modelling timesteps are in the range 10s-60min
• IPSYS explicitly models the power system and does load sharing between the frequency controlling units
• IPSYS is multi-domain – it models the electrical, mechanical, thermal, water or other domains
• IPSYS is very flexible in modelling configurations and supervisory controllers

www.risoe.dk
Hybrid System Performance Evaluation
Layout of the Simulated Hybrid System
G
Combined Load 1
Combined Load 2
Combined Load 3WTG WTG WTG
DumpLoad G

www.risoe.dk
Hybrid System Performance Evaluation
Main System Details
2 x diesel generators: 780kW
Generation voltage: 400V
Step-up transformer: 1.7MVA
Distribution voltage: 22kV
3 x 300kW wind turbines
No-load reactive power compensation: 250kVA
900kW dump load
3 x geographically dispersed loads

www.risoe.dk
Hybrid System Performance Evaluation
Load Profiles
0 2 4 6 8 10 12 14 16 18 20 22 240
100
200
300
400
500
600
Time (hours)
Act
ive
Po
wer
(kW
)
Load 1Load 2Load 3

www.risoe.dk
Hybrid System Performance Evaluation
Droop Curve for Diesel Generators and Dump Load
48
48.5
49
49.5
50
50.5
51
51.5
0 200 400 600
Power (kW)
Fre
qu
ency
(H
z)
Diesel generator
Min system load
Dump load

www.risoe.dk
Hybrid System Performance Evaluation
Diesel Generator Controls
100
200
300
400
500
600
Act
ive
Po
wer
(kW
)
100
200
300
400
500
600
Time
Rea
ctiv
e P
ow
er (
kVA
r)
ON: 75% Pr = 570kW
OFF: 25% Pr = 195kW
ON: 75% Qr = 510kVAr
OFF: 25% Qr = 170kVAr
Threshold Controller Margin Controller
Reserve Capacity =
(α × load kW) + (β × wind kW)
Controller turns on another diesel if present generator cannot meet the current load plus the Reserve Capacity.
Controller turns diesel off if it is not needed to meet the current load plus the Reserve Capacity.

www.risoe.dk
Hybrid System Performance Evaluation
Diesel Generator Fuel Curve
0 200 200 600 8000
50
100
150
200
Power (kW)
Fu
el C
on
sum
pti
on
(l/h
r)
No-load offset

www.risoe.dk
Hybrid System Performance Evaluation
Graphical Output from IPSYS
0 5 10 15 20 25 30-1500
-1000
-500
0
500
1000
1500
Time (days)
Po
wer
(kW
)

www.risoe.dk
Hybrid System Performance Evaluation
Running of the Diesel Generators
0.5 1 1.5 2 2.5 3 3.5 4
x 104
0
500
DG
1
5 10 15 20 25 300
500
DG
2
500 1000 1500 2000 2500 3000 3500 40000
500
DG
1
5 10 15 20 25 300
500
DG
2
100 200 300 400 500 600 7000
500
DG
1
0 5 10 15 20 25 300
500
Time (days)
DG
2
1 min
10 min
60 min
Act
ive
Pow
er (
kW)
www.risoe.dk
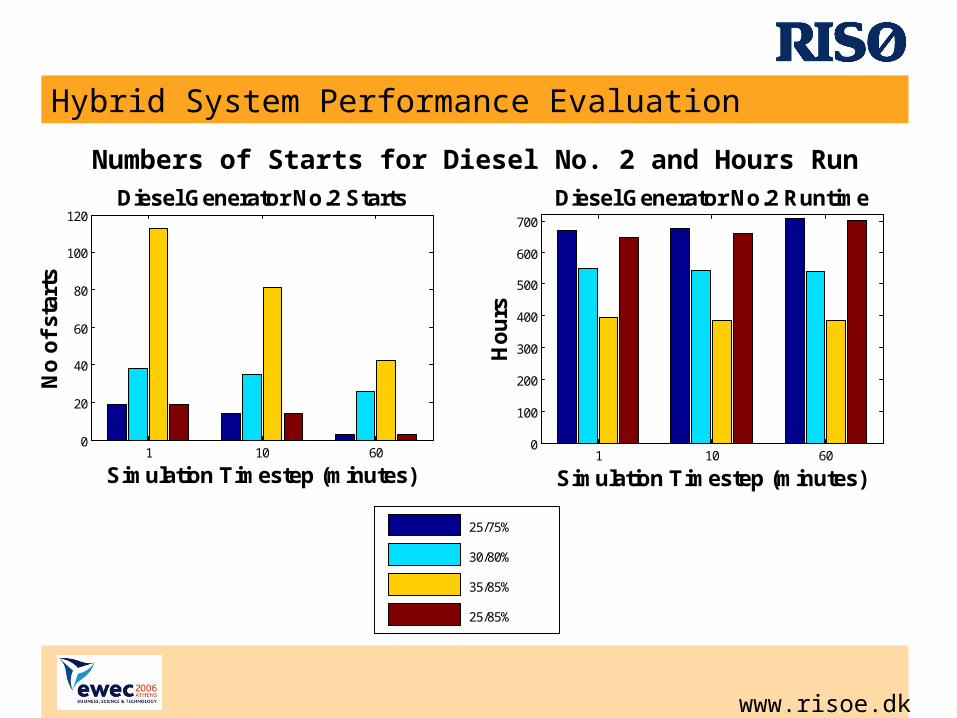
1 10 600
20
40
60
80
100
120
Simulation Timestep (minutes)
No
of
star
tsDiesel Generator No.2 Starts
25/75%
30/80%
35/85%
25/85%
1 10 600
100
200
300
400
500
600
700
Simulation Timestep (minutes)
Ho
urs
Diesel Generator No.2 Runtime
Hybrid System Performance Evaluation
Numbers of Starts for Diesel No. 2 and Hours Run
1 10 600
20
40
60
80
100
120
Simulation Timestep (minutes)
No
of
star
ts
Diesel Generator No.2 Starts
25/75%
30/80%
35/85%
25/85%
1 10 600
100
200
300
400
500
600
700
Simulation Timestep (minutes)H
ou
rs
Diesel Generator No.2 Runtime
www.risoe.dk
Hybrid System Performance Evaluation
IPSYS Outputs for this Assessment
• Total energy generated during the simulation
• Wind energy generated
• Wind usage
• Wind share
• Dump load share
• Diesel generator starts
• Diesel generator run time
• Total diesel fuel used

www.risoe.dk
Hybrid System Performance Evaluation
Simulation Cases Investigated
Base Case
Threshold Controller & Raw Wind Input
Threshold Controller with min runtime adjustments
& Raw Wind Input
Threshold Controller & Filtered Wind Input
All simulations run with 1, 10 & 60 minute timesteps
Margin Controller & Raw Wind Input
www.risoe.dk
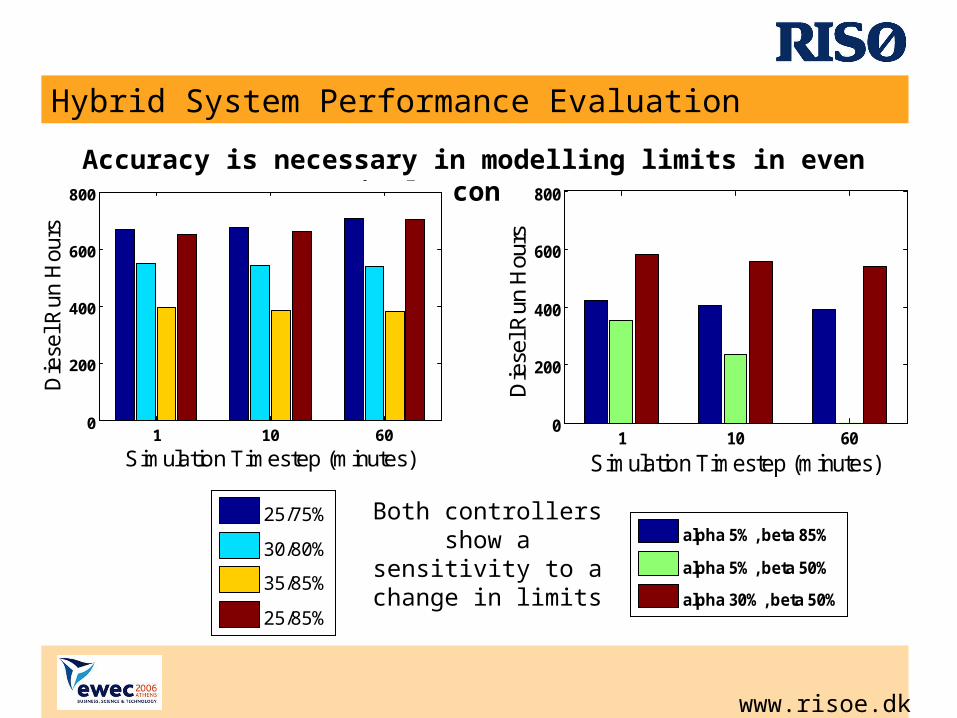
Hybrid System Performance Evaluation
Accuracy is necessary in modelling limits in even simple controllers.
1 10 600
200
400
600
800
Simulation Timestep (minutes)
Die
sel R
un H
ours
1 10 600
100
200
300
400
500
600
700
Diesel Generator No.2 Runtime
Simulation Timestep (minutes)
Hou
rs
1 10 600.8
0.85
0.9
0.95
1
1.05
1.1
1.15
1.2x 10
5 Total Fuel Used
Simulation Timestep (minutes)
Litr
es
alpha 5%, beta 85%
alpha 5%, beta 50%
alpha 30%, beta 50%
1 10 600
50
100
150
200
Simulation Timestep (minutes)
No
of s
tart
s
Diesel Generator No.2 Starts
1 10 600
200
400
600
800
Simulation Timestep (minutes)
Die
sel R
un H
ours
1 10 600.8
0.85
0.9
0.95
1
1.05
1.1
1.15
1.2x 10
5 Total Fuel Used
Simulation Timestep (minutes)
Litr
es
25/75%
30/80%
35/85%
25/85%
Both controllers show a sensitivity to a change
in limits

www.risoe.dk
Hybrid System Performance Evaluation
….but the timestep can influence the effect.
1 10 600
50
100
150
Simulation Timestep (minutes)
Die
sel N
o. o
f Sta
rts
1 10 600
100
200
300
400
500
600
Simulation Timestep (minutes)
Die
sel R
un H
ours
1 minute minimum run
30 minute minimum run
60 minute minimum run
The effect of changing the minimum run time is reduced as the timestep is increased.

www.risoe.dk
Hybrid System Performance Evaluation
Timestep impact on long-term performance indicators is relatively small
1 10 600
50
100
150
200Diesel Generator No.2 Starts
Simulation Timestep (minutes)
No
of s
tart
s
1 10 608
8.5
9
9.5
10
10.5
11x 10
4
Simulation Timestep (minutes)F
uel C
onsu
mpt
ion
(litr
es)
1 minute minimum run
30 minute minimum run
60 minute minimum run
1 10 600
100
200
300
400
500
600
700
Diesel Generator No.1 Runtime
Simulation Timestep (minutes)
Hou
rs
1 10 600
500
1000
1500Total Diesel Generator Runtime
Simulation Timestep (minutes)
Hou
rs
1 10 608
8.5
9
9.5
10
10.5
11x 10
4
Simulation Timestep (minutes)
Fue
l Con
sum
ptio
n (li
tres
)
alpha 5%, beta 85%
alpha 5%, beta 50%
alpha 30%, beta 50%

www.risoe.dk
Hybrid System Performance Evaluation
Major impact of timestep is on diesel start/stops
1 10 600
50
100
150
200
Simulation Timestep (minutes)
No.
of s
tart
s
1 10 600
50
100
150
Simulation Timestep (minutes)N
o of
sta
rts
25/75%
30/80%
35/85%
25/85%
1 10 600
100
200
300
400
500
600
700
Diesel Generator No.1 Runtime
Simulation Timestep (minutes)
Hou
rs
1 10 600
500
1000
1500Total Diesel Generator Runtime
Simulation Timestep (minutes)
Hou
rs
1 10 608
8.5
9
9.5
10
10.5
11x 10
4
Simulation Timestep (minutes)
Fue
l Con
sum
ptio
n (li
tres
)
alpha 5%, beta 85%
alpha 5%, beta 50%
alpha 30%, beta 50%
www.risoe.dk
Hybrid System Performance Evaluation
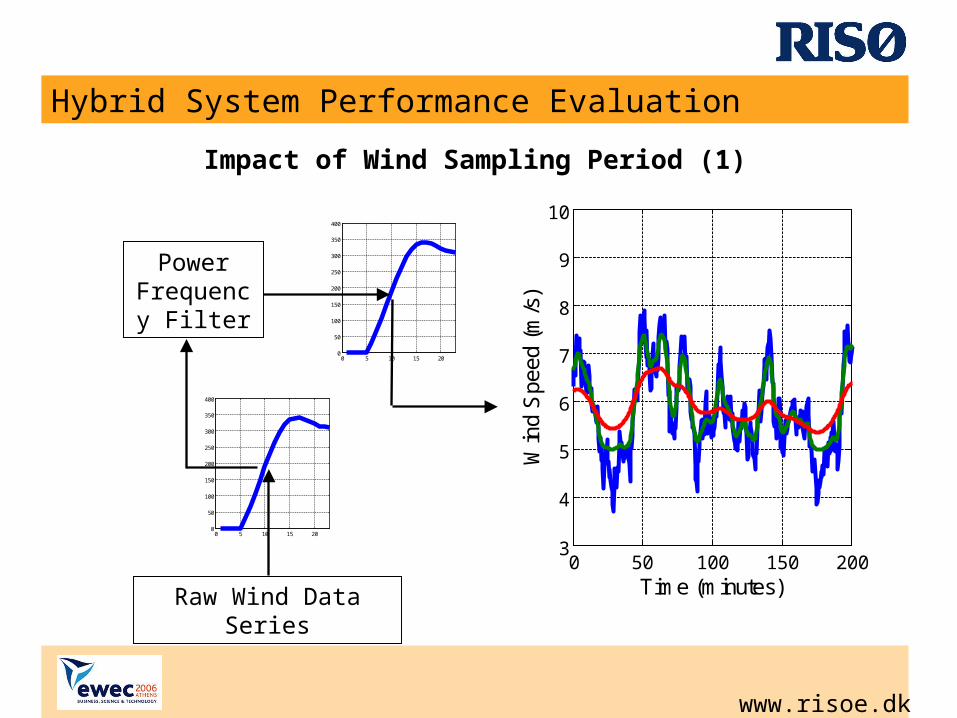
Impact of Wind Sampling Period (1)
0 50 100 150 2003
4
5
6
7
8
9
10
Time (minutes)
Win
d S
peed
(m
/s)
1 minute timeseries
10 minute filtered
60 minute filtered
Raw Wind Data Series
0 5 10 15 200
50
100
150
200
250
300
350
400
0 5 10 15 200
50
100
150
200
250
300
350
400
Power Frequency
Filter

www.risoe.dk
Hybrid System Performance Evaluation
Impact of Wind Sampling Period (2)
1 10 600.8
0.85
0.9
0.95
1
1.05
1.1
1.15
1.2x 10
5
Timestep (mins)
Fue
l Con
sum
ptio
n (li
tres
)
Raw 25/75Raw 30/80Raw 35/85Raw 25/85Filt 25/75Filt 30/80Filt 35/85Filt 25/85

www.risoe.dk
Hybrid System Performance Evaluation
Conclusions
• Simulation timestep has only a limited impact on overall system performance in terms of fuel consumption and wind usage
• Simulation timestep has a significant impact on operating conditions of components e.g. number of start/stops of genset
• Wind filtering has only minimal impact on fuel consumption
• For feasibility studies long timesteps (1h) give results of adequate accuracy
• Short timesteps (1min) are necessary for study of controllers and interaction between components, component operating conditions and wear and tear
• It is important to model reactive power aspect of controllers, as this has a considerable impact on the system operation and simulation results.
• Short time steps will allow real controllers to be implemented in simulation tool – IPSYS is designed for that

www.risoe.dk
Hybrid System Performance Evaluation
Limitations on Results
• Only one hybrid system configuration has been simulated.
• No storage included in studied configuration.
• Only simple controllers investigated.
• System parameters were adjusted to ensure all runs at all timesteps would run – this could hide the full of impact of timestep changes.
• Only a short step towards system testing – Lots of work required


![Review of Database Systems Concepts Chapters 1,2,3,4,5,8,9 in [R] [R] = Ramakrishnan & Gehrke: Database Management Systems, Third Edition.](https://static.documents.pub/doc/80x56/5a4d1b587f8b9ab0599aa3c1/review-of-database-systems-concepts-chapters-1234589-in-r-r-ramakrishnan.jpg)


