14
HYDROGEN AND A JUST TRANSITION BUSINESS ACTION FOR SUSTAINABLE GROWTH

HYDROGEN AND A JUST TRANSITION
BUSINESS ACTION FOR SUSTAINABLE GROWTH
!
BUSINESS ACTION FOR SUSTAINABLE GROWTH2
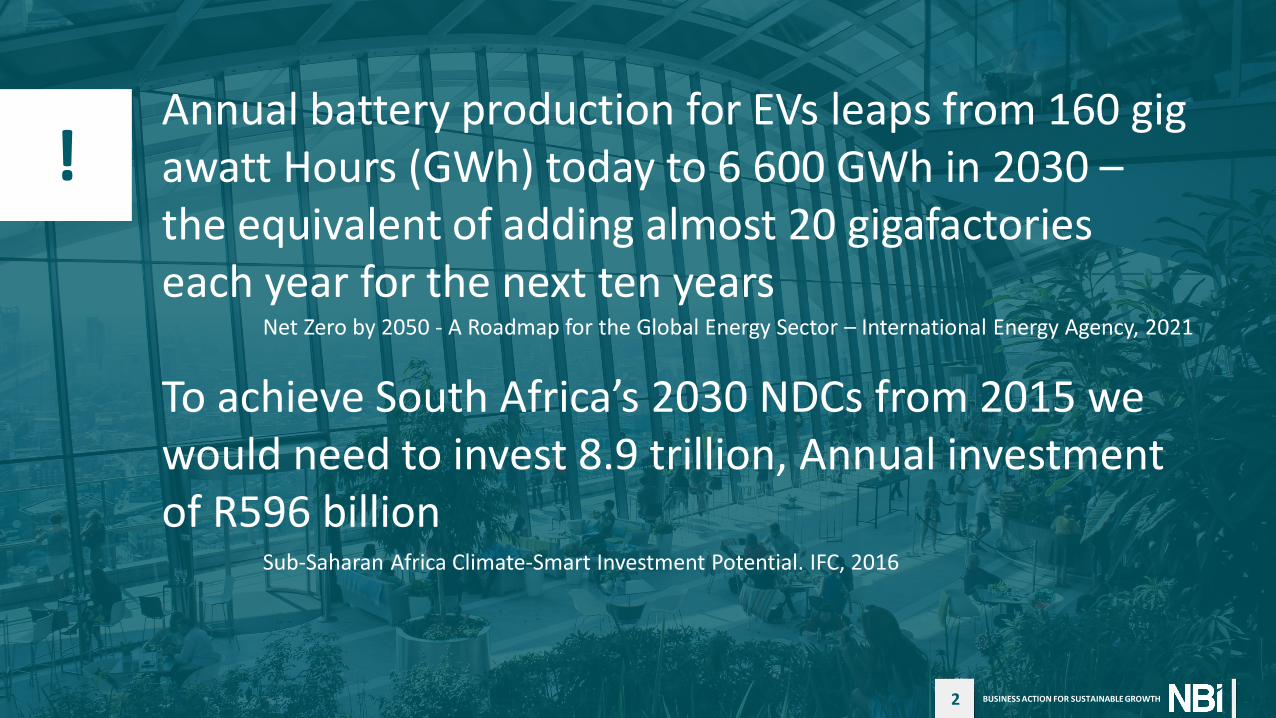
Annual battery production for EVs leaps from 160 gigawatt Hours (GWh) today to 6 600 GWh in 2030 –the equivalent of adding almost 20 gigafactorieseach year for the next ten years
To achieve South Africa’s 2030 NDCs from 2015 we would need to invest 8.9 trillion, Annual investment of R596 billion
Net Zero by 2050 - A Roadmap for the Global Energy Sector – International Energy Agency, 2021
Sub-Saharan Africa Climate-Smart Investment Potential. IFC, 2016

BUSINESS ACTION FOR SUSTAINABLE GROWTH3
SOUTH AFRICA IS EXPOSED TO SIGNIFICANT TRANSITION RISKR
and
100B
-100B
50B
-50B
0
Source: NBI and BCG analysis of DTIC data
The commodities that are our biggest export earners are all extremely vulnerable to changes in global demand change, threateningour ability to service national debt and import liquid fuels in the medium term and food security. Managing the transition of these sectors could lead to significant opportunity.
Platinum Group Metals
Coal
Iron Ores
GoldFerro-alloys
Motor vehicles and parts
Manganese ores
Chromium ores
Citrus fruit
Diamonds
Centrifuges
Unwrought aluminium
Chemical wood pulp, dissolving
grades
Flat-rolled products of
stainless steel
Wine
Electrical energy
Petroleum oils and oils obtained from bituminous minerals
Petroleum oils and oils obtained from bituminous minerals, crude
Commodities not elsewhere specified
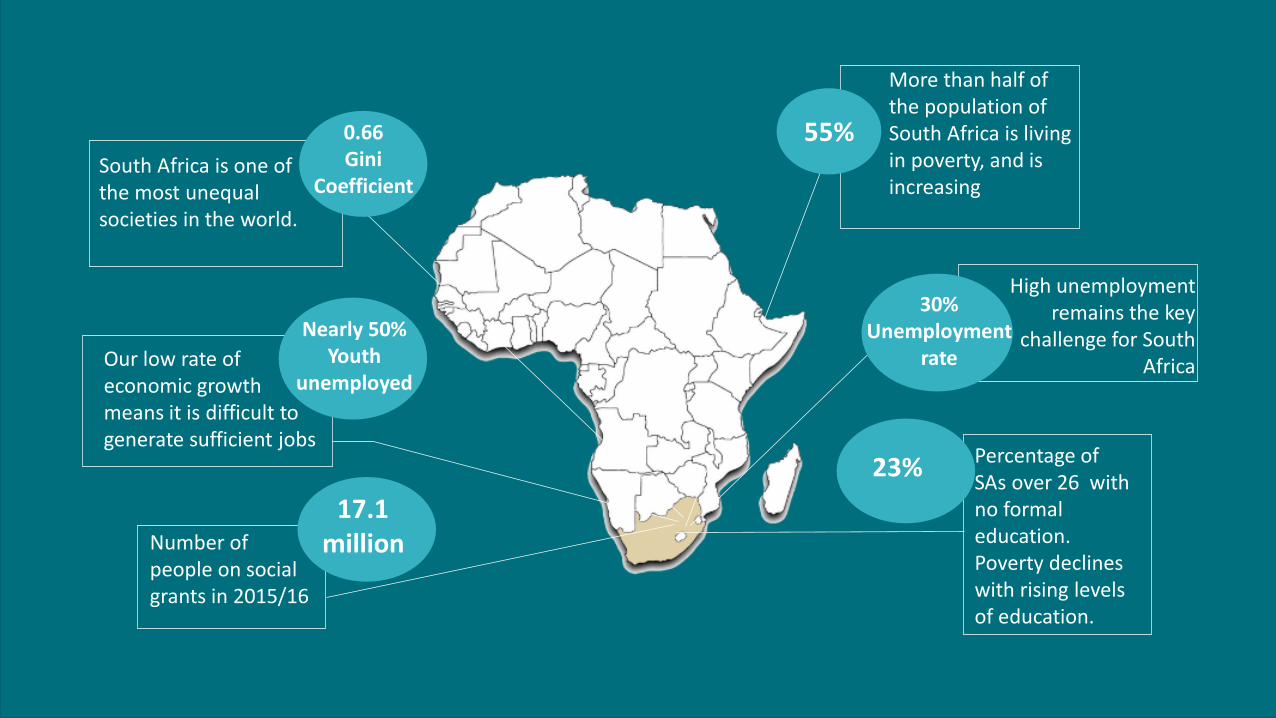
More than half of the population of South Africa is living in poverty, and is increasing
High unemployment remains the key
challenge for South AfricaOur low rate of
economic growth means it is difficult to generate sufficient jobs
South Africa is one of the most unequalsocieties in the world.
55%0.66Gini
Coefficient
30%Unemployment
rate
Nearly 50% Youth
unemployed
Percentage of SAs over 26 with no formal education. Poverty declines with rising levels of education.
23%
Number of people on social grants in 2015/16
17.1 million

BUSINESS ACTION FOR SUSTAINABLE GROWTH5
SA HAS EXPERTISE IN SYNFUELS AND CHEMICALS PRODUCTION, AND A COMPETITIVE ADVANTAGE IN GREEN H2 PRODUCTION
• Chemicals production assets and expertise
• Access to green H2
• Access to net-zero carbon feedstock (e.g., via biomass, DAC, CCU)
• Optimal RE resources
• Abundant land for RE deployment
• Sufficient water supply
• Large-scale air separation plants to provide nitrogen
• Access to green H2
• Large scale FT plants and expertise
• Access to green H2
• Access to net-zero carbon feedstock (e.g., via biomass, DAC, CCU)
• Affordable, sustainable biomass to be available at scale
• 2nd generation biomass1
as key feedstock Pro
du
ctio
n R
equ
irem
ents
Green chemicals
Green H2 Green ammonia
Green aviation fuel
Biofuels
SA well positioned to produce
1. Wood & related wastes, sawdust residues, forestry & agricultural residues3, invasive alien plants4, municipal organic waste
6
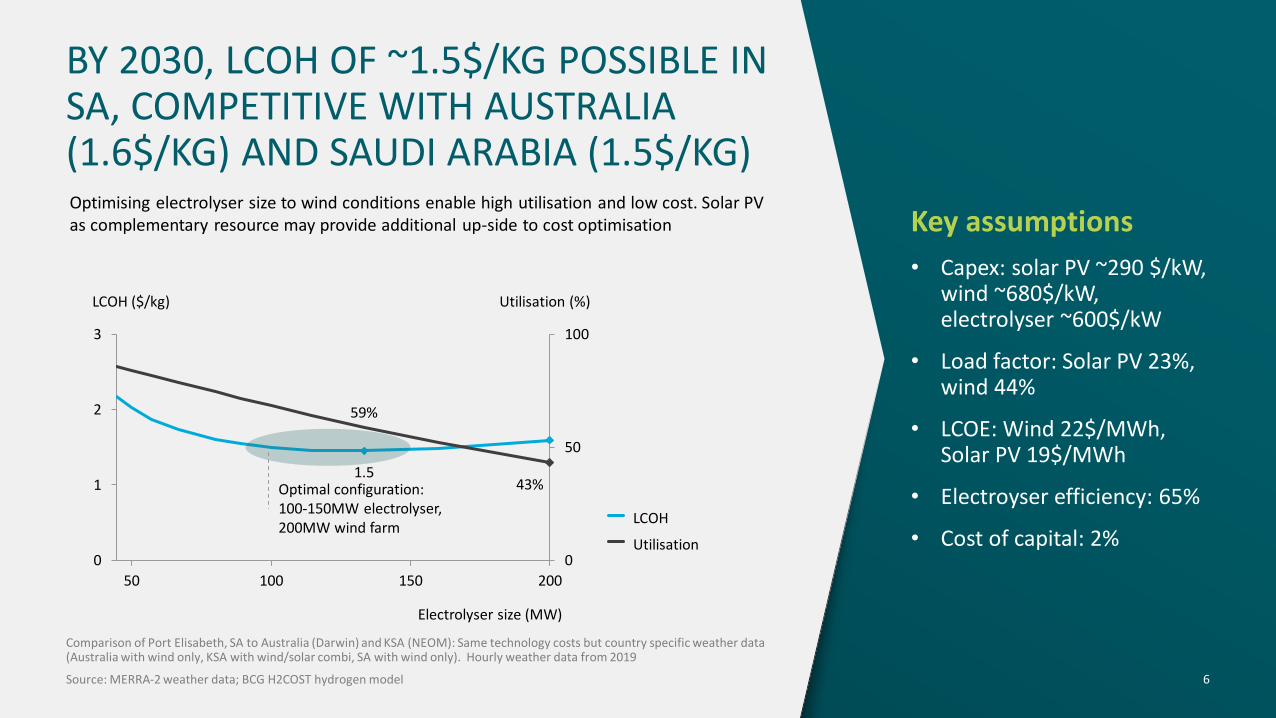
BY 2030, LCOH OF ~1.5$/KG POSSIBLE IN SA, COMPETITIVE WITH AUSTRALIA (1.6$/KG) AND SAUDI ARABIA (1.5$/KG)Optimising electrolyser size to wind conditions enable high utilisation and low cost. Solar PV as complementary resource may provide additional up-side to cost optimisation
Comparison of Port Elisabeth, SA to Australia (Darwin) and KSA (NEOM): Same technology costs but country specific weather data (Australia with wind only, KSA with wind/solar combi, SA with wind only). Hourly weather data from 2019
Source: MERRA-2 weather data; BCG H2COST hydrogen model
Key assumptions
• Capex: solar PV ~290 $/kW, wind ~680$/kW, electrolyser ~600$/kW
• Load factor: Solar PV 23%, wind 44%
• LCOE: Wind 22$/MWh, Solar PV 19$/MWh
• Electroyser efficiency: 65%
• Cost of capital: 2%0
50
100
0
1
2
3
15050 100 200
LCOH ($/kg)
Electrolyser size (MW)
Utilisation (%)
59%
43%1.5
LCOH
Utilisation
Optimal configuration: 100-150MW electrolyser, 200MW wind farm
7
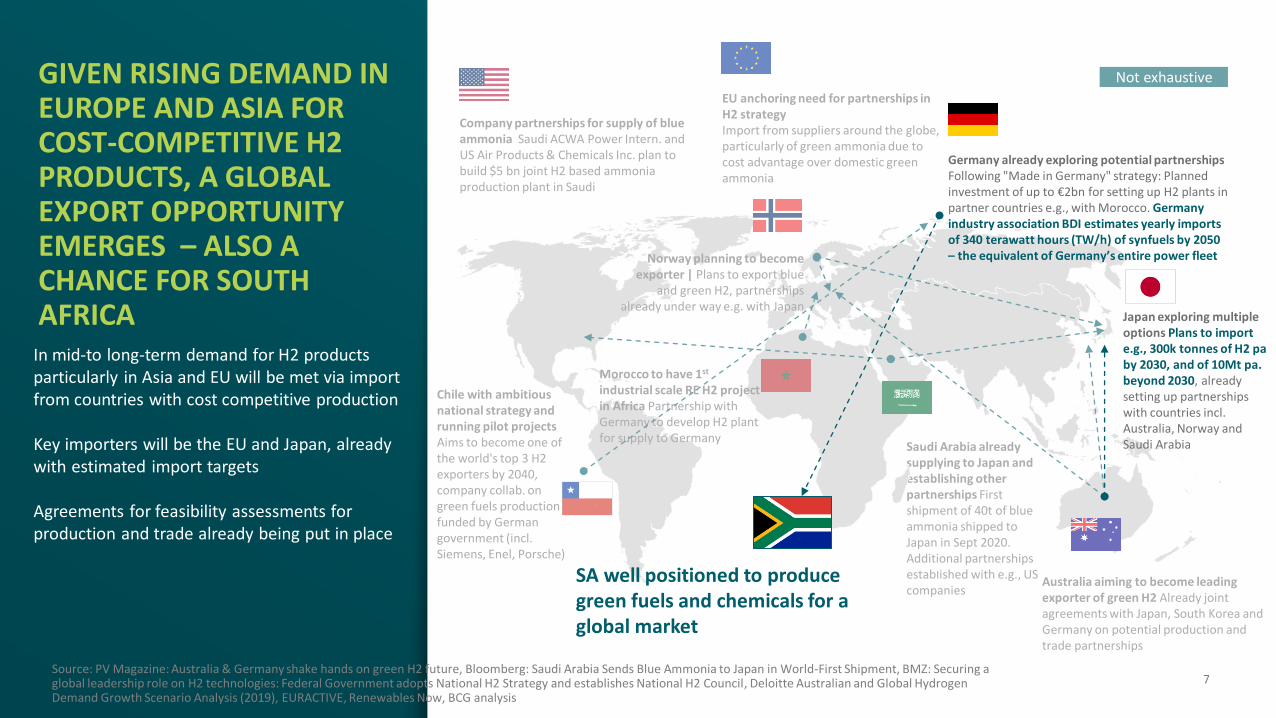
Saudi Arabia already supplying to Japan and establishing other partnerships First shipment of 40t of blue ammonia shipped to Japan in Sept 2020. Additional partnerships established with e.g., US companies
Company partnerships for supply of blue ammonia Saudi ACWA Power Intern. and US Air Products & Chemicals Inc. plan to build $5 bn joint H2 based ammonia production plant in Saudi
Chile with ambitious national strategy and running pilot projects Aims to become one of the world's top 3 H2 exporters by 2040, company collab. on green fuels production funded by German government (incl. Siemens, Enel, Porsche)
Australia aiming to become leading exporter of green H2 Already joint agreements with Japan, South Korea and Germany on potential production and trade partnerships
Morocco to have 1st
industrial scale RE H2 project in Africa Partnership with Germany to develop H2 plant for supply to Germany
Norway planning to become exporter | Plans to export blue
and green H2, partnerships already under way e.g. with Japan
GIVEN RISING DEMAND IN EUROPE AND ASIA FOR COST-COMPETITIVE H2 PRODUCTS, A GLOBAL EXPORT OPPORTUNITY EMERGES – ALSO A CHANCE FOR SOUTH AFRICA
In mid-to long-term demand for H2 products particularly in Asia and EU will be met via import from countries with cost competitive production
Key importers will be the EU and Japan, already with estimated import targets
Agreements for feasibility assessments for production and trade already being put in place
Not exhaustive
EU anchoring need for partnerships in H2 strategy Import from suppliers around the globe, particularly of green ammonia due to cost advantage over domestic green ammonia
Germany already exploring potential partnershipsFollowing "Made in Germany" strategy: Planned investment of up to €2bn for setting up H2 plants in partner countries e.g., with Morocco. Germany industry association BDI estimates yearly imports of 340 terawatt hours (TW/h) of synfuels by 2050 – the equivalent of Germany’s entire power fleet
SA well positioned to produce green fuels and chemicals for a global market
Source: PV Magazine: Australia & Germany shake hands on green H2 future, Bloomberg: Saudi Arabia Sends Blue Ammonia to Japan in World-First Shipment, BMZ: Securing a global leadership role on H2 technologies: Federal Government adopts National H2 Strategy and establishes National H2 Council, Deloitte Australian and Global Hydrogen Demand Growth Scenario Analysis (2019), EURACTIVE, Renewables Now, BCG analysis
Japan exploring multiple options Plans to import e.g., 300k tonnes of H2 pa by 2030, and of 10Mt pa. beyond 2030, already setting up partnerships with countries incl. Australia, Norway and Saudi Arabia

The global average trajectory is based on nine published global scenarios which are compatible
with the goals of the Paris Agreement. These numbers are much higher than the current
effective cost of around $2/t CO2 (that is a headline rate of $8/t CO2 less allowances).
CARBON PRICES ARE LIKELY TO BE HIGHER THAN EXPECTED
BUSINESS ACTION FOR SUSTAINABLE GROWTH8
South Africa’s carbon price is estimated to be ~70% of the global price

Net-zero by 2050 in the electricity sector is possible at relatively low prices, initially no carbon price is needed
75
9085
10
80
75 80 95 1000
5
Gas and DAC
System cost [cent/kWh]
Emissions [Mt CO2]
Starting point
RE overbuild
H2 via curtailment
[75 c/kWh; 76 Mt]
[83 c/kWh; 12 Mt; CO2 cost = R670/ton]
[90 c/kWh; 0 Mt; CO2 cost = R2100/ton]
[91 c/kWh; 0 Mt; CO2 cost = R2400/ton]
In a parallel NBI study, a fully decarbonized
electricity price of 90 c/kWh is projected.
At $1.00 = R15.00 this is $60/MWh.
Electricity supply 2050 = 366 TWh
Source NBI-BCG-BUSA Just Transitions Pathways Project, 2021 BUSINESS ACTION FOR SUSTAINABLE GROWTH9
Provisional numbers,
under review

2050
Scenario 1
• Existing BF-BOF replaced by DRI-EAF-hydrogen
• Existing DRI-EAF switches from coal to hydrogen
• Mitigation cost $250-300/t CO2 *
Scenario 2
• Existing BF-BOF 50% replaced by DRI-EAF-hydrogen, then 100% in 2065
• Existing DRI-EAF switches 50% from coal to hydrogen, then 100% in 2065
• Residual emissions handled by CCU, CCS or offsets
* Cost is for switch from BF-BOF: cost from DRI-EAF-coal will be lower.Based on ArcelorMittal Europe estimates
Assumptions
Production growth rate 2021 - 2050 % p.a. 1.0%
Scrap growth rate, 2021 - 2025 % p.a. 1.0%
Reduction in emissions from energy efficiency 2021 - 2025 % p.a. 2.0%
No waste or biomass available
Net-zero carbon emissions in the steel sector is feasible at high prices that incentivize a switch to hydrogen
BUSINESS ACTION FOR SUSTAINABLE GROWTH10

TOGETHER SWITCHING PRICES, SOCIAL COSTS AND SUBSTITUTION PRICES WOULD PROVIDE THE INFORMATION NEEDED TO ASSESS DECARBONISATION POTENTIAL AND COMPETITIVENESS IMPACTS
Pro
ject
ed
Car
bo
n P
rice
Sectoral switching price
Set carbon price
2020 2040 20602030 2050
Substitution price
BUSINESS ACTION FOR SUSTAINABLE GROWTH11

POLICY PRICING STRATEGIES INCLUDE ADOPT A MEDIAN PRICE WITH COMPLEMENTARY POLICY OR ADOPT DIFFERING PRICES PER SECTOR VIA ALLOWANCES
Pro
ject
ed
Sw
itch
ing
Pri
ce
R2100; Steel
2020 20402030 2050
R3000; Cement
R760; Electricity
R1800; Set Carbon Price
Decarbonizing technology becomes available 2030
BUSINESS ACTION FOR SUSTAINABLE GROWTH12
If the EU’s 2050 net-zero target is to be met then the EU-ETS pricing paradigm will need to shift at some point from one based onfuel-switching in the power sector to one based on fuel-switching in industry, whereby the cost of switching from grey hydrogen to green hydrogen becomes the key pricing parameter.Specifically 73 to103 EURO by 2030– Roughly R1500Source: Green H 9et zero EU-ETS BNP P.pdf

QUESTIONS AND DISCUSSION
BUSINESS ACTION FOR SUSTAINABLE GROWTH13
NBI MEMBERSHIP
BUSINESS ACTION FOR SUSTAINABLE GROWTH14
Contact:Steve Nicholls
[email protected] 786 5058


![EE 477 Final Report · Web viewThe manufacturing process of the PCB makes use of many harmful substances such as Copper, Hydrogen Sulfate (H2SO4) and Hydrogen Peroxide [18]. The PCB](https://static.documents.pub/doc/80x56/5aae7e5e7f8b9aa8438c2b70/ee-477-final-report-viewthe-manufacturing-process-of-the-pcb-makes-use-of-many-harmful.jpg)


