Page 1
Hydrogen Production through Gasification and Dark Fermentation I
HYDROGEN PRODUCTION
THROUGH GASIFICATION AND
DARK FERMENTATION
Carlos Andrés García Velásquez
Universidad Nacional de Colombia Sede Manizales
Facultad de Ingeniería y Arquitectura, Departamento de Ingeniería Química
Manizales, Colombia
2016
Page 2
II Hydrogen Production through Gasification and Dark Fermentation
Hydrogen production through
gasification and dark fermentation
Carlos Andrés García Velásquez
Thesis submitted in partial fullfilment of the requirements for the degree of:
Master of Science in Engineering - Chemical Engineering
Advisor:
Ph.D., M. Sc, Chemical Engineering Carlos Ariel Cardona Alzate
Research line:
Chemical and Biotechnological Process Engineering
Research group:
Chemical, Catalytic and Biotechnological Processes
Universidad Nacional de Colombia Sede Manizales
Facultad de Ingeniería y Arquitectura, Departamento de Ingeniería Química
Manizales, Colombia
2016
Page 3
Producción de hidrógeno por medio de
gasificación y fermentación oscura
Carlos Andrés García Velásquez
Tesis presentada como requisito parcial para optar al título de:
Magister en Ingeniería Química
Director:
Ph.D., M. Sc, Ingeniero Químico Carlos Ariel Cardona Alzate
Línea de Investigación:
Ingenieria de Procesos Químicos y Biotecnológicos
Grupo de Investigación:
Procesos Químicos, Catalíticos y Biotecnológicos
Universidad Nacional de Colombia Sede Manizales
Facultad de Ingeniería y Arquitectura, Departamento de Ingeniería Química
Manizales, Colombia
2016
Page 4
IV Hydrogen Production through Gasification and Dark Fermentation
Este es el comienzo del viaje al cual estoy
destinado…
“… traveling for a living…”
“ … Sí, amigos mios, creo que el agua se usará un día
como combustible, que el hidrógeno y el oxígeno que la
constituyen, utilizados aislada y simultáneamente,
producirán una fuente de calor y de luz inagotable y de
una intensidad mucho mayor que la de la hulla…”
La Isla Misteriosa, Julio Verne, 1874
Page 5
Acknowledgements
First, I would like to thank to my parents and my brother who have always supported me in my
decisions and also for their patience, especially in this chapter of my life. This is for them. There is
one person that always encourange me to do the things that I have done and despite my bad
temper, she has always been by my side. This is for her too. I want to thank also to the people with
whom I have shared these two years of hard work: Valentina A., Valentina H., Milo, La Coste,
Hector, Migue, Edu, Serna, Mancho, Yessica, Cristian, Manuel, Ashley, Daniela. To the IBA’s
crew, I am very grateful for their patience, especially when I used the gasifier, for their support and
daily help. To my tutor Carlos A. Cardona who has led me down this path, has supported me in the
difficulties and from which I have learned a lot in these years of hard work by his side.
Finally, I want to acknowledge to the National University of Colombia at Manizales, to the
Dirección de Investigación (DIMA), the Sistema de Información de la Investigación de la
Universidad Nacional de Colombia (HERMES) and the Facultad de Ingeniería y Arquitectura
(FIA) for their financial support to develop this thesis. To Professor Ashwany Gupta for giving me
the opportunity to do my internship in his combustion laboratory.
Page 6
VI Hydrogen Production through Gasification and Dark Fermentation
Abstract
New efforts in the search of alternative clean and renewable energy to replace the current energy
precursors have been assessed in order to reduce emissions to the environment. Lignocellulosic
Biomass (LB) can be used to produce bioenergy due to its high energy potential and availability.
The main objective of this thesis is to evaluate the production of hydrogen through air gasification
and dark fermentation using lignocellulosic biomass as feedstock. For this purpose, the
methodology was divided in two sections: experimental and simulation procedures. The
experimental procedure involves the production of a hydrogen-rich synthesis gas through
gasification and the use of the commercial strain T. Thermosaccharolyticum ATCC 7956 to
produce hydrogen though dark fermentation. Two different gasification configurations were tested:
first, using only lignocellulosic biomass as feedstock and then, mixtures between the raw material
and an adsorbent (in this case, quicklime) were fed in the gasifier. For the dark fermentation
procedure, a previous pretreatment stage of the raw material was included. Subsequently, pure
sugars and hydrolysates (from the pretreatment stage) were tested as carbon source for the
hydrogen production using the commercial strain. In the simulation approach, six (6) scenarios for
hydrogen production were assessed from the techno-economic, energetic and environmental point
of view, considering the biorefinery and stand-alone pathways. As a consequence, the use of low
cost and high available adsorbents in the gasification procedure increased the hydrogen selectivity.
Hydrogen content was not detected in the dark fermentation procedures; however, high
concentration of other metabolites was evidenced, which presents a future scenario for the
implementation of alternative process schemes using this microorganism. The results of the
simulation procedure demonstrated that the production of hydrogen based on the concept of a
biorefinery can improve the profitability, energy efficiency and reduce the emissions of the
processes compared to the stand-alone way.
Keywords: Lignocellulosic residues, hydrogen, bioenergy
Page 7
Resumen
Nuevos esfuerzos en la búsqueda de alternativas de energía limpia y renovable que reemplacen los
actuales precursores energéticos han sido evaluados con el fin de reducir las emisiones al medio
ambiente. La biomasa lignocelulósica (BL) se puede utilizar directamente para producir energía
debido a su alto potencial energético y disponiblidad. El principal objetivo de esta tesis es evalular
la producción de hidrógeno por medio de gasificación y fermentación oscura utilizando biomasa
lignocelulósica como materia prima. Para este proposito, la metodología fue dividida en dos
secciones: procedimientos experimentales y de simulación. El procedimiento experimental
involucra la producción de un gas de síntesis con alto contenido de hidrógeno por medio de
gasificación y el uso de la cepa comercial T. Thermosaccharolyticum ATCC 7956 para producir
hidrógeno por medio de fermentación oscura. Dos configuraciones de gasificación fueron
evaluadas: primero, utilizando biomasa lignocelulósica como materia prima y luego, se preparon
mezclas entre dichas materias primas y un adsorbente (en este caso, cal viva). Para el
procedimiento de la fermentación oscura, se incluyó una etapa de pretratamiento de la materia
prima. Posteriormente, azucares puros e hidrolizados (obtenidos de la etapa de pretratamiento)
fueron utilizados como fuente de carbono para la producción de hidrógeno utilizando la cepa
comercial. En la etapa de simulación, se evaluaron desde el punto de vista técnico, económico,
energético y ambiental, seis escenarios para la producción de hidrógeno. Como consecuencia, el
uso de un adsorbente de bajo costo y alta disponibilidad, en el procedimiento de gasificación,
incremento la selectividad del hidrógeno. En los procedimientos de fermentación oscura no fue
posible detectar hidrógeno; sin embargo, el microorganismo fue capaz de sintetizar otros
metabolitos en altas concentraciones, lo cual presenta un futuro escenario para la implementación
de nuevos esquemas de proceso utilizando esta cepa comercial. Los resultados del procedimiento
de simulación demostraron que la producción de hidrógeno basado en el concepto de biorefinería
mejoró la rentabilidad económica, eficiencia energética y redujó las emisiones de los procesos en
comparación a las rutas independientes.
Palabras clave: Residuos lignocelulósicos, hidrógeno, bioenergía, sostenibilidad
Page 8
VIII Hydrogen Production through Gasification and Dark Fermentation
Content
Pág.
1. Energy in Colombia 20
1.1 Energy Matrix .................................................................................................................. 21
1.2 Advantages and deficiencies of the current energy systems ............................................ 24
1.3 Renewable energy sources ............................................................................................... 25
1.4 Non-Interconnected Zones in Colombia .......................................................................... 26
1.5 Biomass suitable for energy production in Colombia ...................................................... 28
1.6 Final Remark .................................................................................................................... 30
2. Hydrogen as energy vector 31
2.1 Methods for hydrogen production .................................................................................... 32
2.1.1 Thermochemical technologies ...................................................................................... 33
2.1.2 Biochemical methods .................................................................................................... 36
2.1.3 Electrochemical Methods .............................................................................................. 37
2.2 Hydrogen economy .......................................................................................................... 38
2.3 Final Remarks .................................................................................................................. 39
3. Raw Material 41
3.1 Pinus Patula (PP) ............................................................................................................ 41
3.1.1 Pinus Patula in the Andean region ............................................................................... 44
3.2 Coffee Cut-Stems (CCS) .................................................................................................. 47
3.2.1 Coffee Cut-Stems in the Andean Region ...................................................................... 48
3.3 Final Remarks .................................................................................................................. 51
4. Methodology 52
4.1 Experimental Procedure ................................................................................................... 52
4.1.1 Raw Material Characterization ..................................................................................... 52
4.1.2 Proximate analysis ........................................................................................................ 55
4.1.3 Elemental analysis......................................................................................................... 56
4.2 Pilot-Scale Gasification .................................................................................................... 57
4.3 Experimental Catalyzed Gasification ............................... ¡Error! Marcador no definido.
4.4 Additional gasification experiences ................................................................................. 61
4.5 Dark Fermentation ........................................................................................................... 61
4.5.1 Dilute-acid hydrolysis ................................................................................................... 62
4.5.2 Detoxification................................................................................................................ 63
4.5.3 Enzymatic Saccharification ........................................................................................... 64
Page 9
4.5.4 Fermentation ................................................................................................................. 64
4.6 Simulation Procedure ....................................................................................................... 69
4.6.1 Scenarios ....................................................................................................................... 70
4.6.2 Process description ........................................................................................................ 71
4.6.3 Gasification ................................................................................................................... 72
4.6.4 Electricity generation .................................................................................................... 74
4.6.5 Ethanol Fermentation .................................................................................................... 75
4.6.6 Dark Fermentation ........................................................................................................ 76
4.7 Analysis of the proposed scenarios .................................................................................. 78
4.7.1 Economic Assessment ................................................................................................... 78
4.7.2 Energy Analysis ............................................................................................................ 80
4.7.3 Environmental Assessment ........................................................................................... 82
5. Results and Discusion 83
5.1 Overview .......................................................................................................................... 83
5.2 Physicochemical characterization of lignocellulosic biomass ......................................... 83
5.3 Experimental Procedure ................................................................................................... 87
5.3.1 Gasification ................................................................................................................... 87
5.3.1.1 Air Gasification of CCS and PP .................................................................................... 87
5.3.1.2 Effect of CaO in the downdraft gasification ................................................................. 91
5.3.2 Dark Fermentation ........................................................................................................ 93
5.3.2.1 Acid Hydrolysis ............................................................................................................... 93
5.3.2.2 Detoxification ................................................................................................................... 94
5.3.2.3 Enzymatic Saccharification .............................................................................................. 96
5.3.2.4 Dark Fermentation ........................................................................................................... 97
5.4 Stand-alone and biorefinery pathways for hydrogen production: Simulation approach 102
5.4.1 Pinus Patula ................................................................................................................ 102
5.4.1.1 Overall performance ....................................................................................................... 103
5.4.1.2 Techno-economic assessment ........................................................................................ 104
5.4.1.3 Energy Analysis ............................................................................................................. 114
5.4.1.4 Environmental Assessment ............................................................................................ 119
5.4.2 Coffee Cut-Stems (CCS) ............................................................................................. 121
5.4.2.1 Overall Performance ...................................................................................................... 121
5.4.2.2 Techno-economic assessment ........................................................................................ 122
5.4.2.3 Energy Analysis ............................................................................................................. 129
5.4.2.4 Environmental Assessment ............................................................................................ 133
6. General comparison of stand-alone and biorefinery pathways for hydrogen production136
7. Conclusions 138
8. Recommendations 140
A. Approach for the calculation of the elemental analysis and calorific value 141
B. Gasification of Wood chips: Effect of the temperature and gasifying agent Short Internship
in the Maryland University, College Park, USA 144
C. Kinetic Models 153
D. Mathematical modelling of biomass gasification for hydrogen production 157
9. References 174
Page 10
X Hydrogen Production through Gasification and Dark Fermentation
List of figures
Pág.
Figure 1-1. Production of crude oil (thousands of cubic feet per calendar day) in Colombia. ........ 21
Figure 1-2. Diesel consumption in Colombia. ................................................................................ 22
Figure 1-3. Distribution of the natural gas consumption in different sectors of Colombia ............ 22
Figure 1-4. Distribution of the main energy sources in Colombia ................................................... 24
Figure 1-5. Graphical map of the Non-Interconnected Zones in Colombia (Gray Departments) .... 27
Figure 2-1. Energy sources and methods for hydrogen production ................................................ 34
Figure 3-1. Main applications of roundwood in Colombia .............................................................. 44
Figure 4-1. Process flowsheet of the pilot-scale gasifier in the 10 kW Power Pallet. ..................... 59
Figure 4-2. Flowsheet of the biomass gasification to produce hydrogen from wood residues ....... 68
Figure 4-3. Flowsheet of the biomass gasification to produce hydrogen from wood residues ....... 74
Figure 4-4. Flowsheet of the ethanol production from wood residues using Z. mobilis ................ 76
Figure 4-5. Flowsheet of the hydrogen, ethanol, acetic acid and butyric acid production through
dark fermentation of wood residues. ................................................................................................ 77
Figure 5-1. Concentration profiles of the different gaseous species obtained from the pilot-scale
gasification of CCS. ......................................................................................................................... 88
Figure 5-2. Concentration profiles of different gaseous species obtained from the pilot-scale
gasification of PP. ............................................................................................................................ 90
Figure 5-3. Effect of the biorefinery location and plant capacity in the hydrogen production cost
....................................................................................................................................................... 105
Figure 5-4. Effect of the biorefinery location and plant capacity in the Net Present Value of the
process ........................................................................................................................................... 106
Figure 5-5. Effect of the plant capacity in the hydrogen production for the three scenarios that
involve gasification ........................................................................................................................ 107
Figure 5-6. Effect of the plant capacity in the NPV for the three gasification scenarios ............... 107
Figure 5-7. Sensibility analysis of the economic performance of the low scale biorefinery ........ 108
Figure 5-8. Sensibility analysis of the economic performance of the mid-scale biorefinery ........ 109
Figure 5-9. Contribution of the economic parameters to the total production costs of the
gasification scenarios ..................................................................................................................... 110
Figure 5-10. Effect of the plant capacity in the hydrogen production cost of the dark fermentation
scenarios ......................................................................................................................................... 111
Figure 5-11. Effect of the plant capacity in the economic performance of the dark fermentation
scenarios ......................................................................................................................................... 112
Page 11
Figure 5-12. Sensibility analysis of the economic performance of the low scale dark fermentation
biorefinery ...................................................................................................................................... 112
Figure 5-13. Sensibility analysis of the economic performance of the mid-scale dark fermentation
biorefinery ...................................................................................................................................... 113
Figure 5-14. Contribution of the economic parameters in the dark fermentation scenarios ......... 113
Figure 5-15. Sankey diagram of the energy balance for the gasification scenarios H2 .................. 115
Figure 5-16. Sankey diagram of the energy balance for the dark fermentation scenarios ............. 116
Figure 5-17. Energy efficiency considering hydrogen as the only product of the evaluated
scenarios ......................................................................................................................................... 117
Figure 5-18. Energy efficiency considering all the possible products from the evaluated scenarios
........................................................................................................................................................ 118
Figure 5-19. Net energy balance of the evaluated scenarios .......................................................... 119
Figure 5-20. GHG balance of the evaluated scenarios .................................................................. 120
Figure 5-21. Environmental assessment of the dark fermentation scenarios ................................ 121
Figure 5-22. Effect of the plant capacity in the hydrogen production cost of the gasification
scenarios. ........................................................................................................................................ 123
Figure 5-23. Effect of the plant capacity in the economic profitability of the gasification scenarios
........................................................................................................................................................ 124
Figure 5-24. Sensibility analysis of the economic performance of the low-scale gasification
biorefinery ...................................................................................................................................... 124
Figure 5-25. Sensibility analysis of the economic performance of the mid-scale gasification
biorefinery ...................................................................................................................................... 125
Figure 5-26. Contribution of the economic parameters to the total production costs of the
gasification scenarios ..................................................................................................................... 126
Figure 5-27. Effect of the plant capacity in the hydrogen production cost in the dark fermentation
scenarios ......................................................................................................................................... 127
Figure 5-28. Effect of the plant capacity in the NPV of the dark fermentation scenarios ............ 127
Figure 5-29. Sensibility analysis of the economic profitability of the low scale dark fermentation
biorefinery ...................................................................................................................................... 128
Figure 5-30. Sensibility analysis of the economic performance of the mid-scale dark fermentation
biorefinery ...................................................................................................................................... 128
Figure 5-31. Contribution of the main economic parameters to the total production costs of the
dark fermentation scenarios. .......................................................................................................... 129
Figure 5-32. Sankey diagrams for the gasification scenarios ......................................................... 130
Figure 5-33. Sankey diagrams for the dark fermentation scenarios ............................................... 131
Figure 5-35. Energy efficiency of the evaluated scenarios considering only hydrogen as product
........................................................................................................................................................ 132
Figure 5-36. Energy efficiency of the evaluated scenarios considering all the bioenergy products
........................................................................................................................................................ 132
Figure 5-37. Net energy balance of the evaluated scenarios ......................................................... 133
Figure 5-38. GHG balance of the gasification and dark fermentation scenarios ........................... 134
Figure 5-39. Environmental Potential Impact (PEI) of the dark fermentation scenarios .............. 135
Page 12
XII Hydrogen Production through Gasification and Dark Fermentation
List of tables
Pág.
Table 1-1. Potential energy of different crops and residues. Adapted from: [27] ............................ 29
Table 1-2. Potential energy of natural and reforested forests .......................................................... 30
Table 2-1. Energy yield of hydrogen and other common fuels at 25°C and 1 atm [29]. ................. 31
Table 2-2. Types of gasifying agent used in gasification procedures. ............................................. 36
Table 2-3. Description of the technologies used in the hydrogen production. ................................. 40
Table 3-1. Commercial forest species used in Colombia for reforestation programs. ..................... 43
Table 3-2. Production of PP and its residues in three departments in Colombia ............................. 46
Table 3-3. Production cost of PP and its residues in the three collection centers in Colombia ....... 46
Table 3-4. Freight cost between the collection center and the processing plant .............................. 47
Table 3-5. Production of “pergamino” and cherry coffee and its relation with the CCS production.
......................................................................................................................................................... 50
Table 3-6. Raw material purchase cost in the three selected departments ....................................... 50
Table 3-7. Freight cost between the collection center and the processing plant .............................. 51
Table 4-1. Chemical characterization of the quicklime reported by the local distributor. ............... 61
Table 4-2. Growth of T. Thermosaccharolyticum strains in different carbon sources ..................... 65
Table 4-3. Composition of the Clostridium Thermohydrosulfuricum (CT) medium [121] ............. 66
Table 4-4. Composition of the MB medium [47] ............................................................................ 66
Table 4-5. Pure substrate composition for the dark fermentation of T. Thermosaccharolyticum
ATCC 7956 ...................................................................................................................................... 67
Table 4-6. Stand-alone and biorefinery scenarios for the hydrogen production .............................. 71
Table 4-7. Utilities, reagents and products market prices ................................................................ 79
Table 5-1. Physicochemical characterization of Pinus Patula ......................................................... 84
Table 5-2. Physicochemical characterization of different types of wood reported in literature. ..... 85
Table 5-3. Physicochemical characterization of Coffee Cut-Stems ................................................. 86
Table 5-4. Global mass balance of the experimental gasification runs using CCS as raw material 88
Table 5-5. Composition and calorific value of the generated syngas from CCS ............................. 89
Table 5-6. Composition and calorific value of the generated syngas from PP ................................ 90
Page 13
Table 5-7. Composition and calorific value of the generated syngas from CCS ............................. 91
Table 5-8. Effect of the CaO catalyst in the synthesis gas composition from CCS gasification ..... 92
Table 5-9. Effect of the CaO catalyst in the synthesis gas composition from PP gasification ........ 92
Table 5-10. Sugars yield after the dilute-acid hydrolysis ................................................................. 94
Table 5-11. Monosaccharides conversion in the dilute-acid hydrolysis .......................................... 94
Table 5-12. Sugar and furfural content of the hydrolysate after overliming with Ca(OH)2............. 95
Table 5-13. Detoxification yield from PP and CCS hydrolysates .................................................... 95
Table 5-14. Monosaccharides degradation after the detoxification procedure ................................ 95
Table 5-15. Sugar and furfural content after the enzymatic hydrolysis ........................................... 96
Table 5-16. Sugar consumption of different experimental tests of the dark fermentation ............... 97
Table 5-17. Concentration of the gaseous species in the fermentation medium .............................. 99
Table 5-18. Concentration of secondary metabolites in the fermentation medium ....................... 100
Table 5-19. Sugar consumption of different experimental tests of the dark fermentation ............. 100
Table 5-20. Concentration of the gaseous species in the fermentation medium ............................ 101
Table 5-21. Concentration of secondary metabolites in the fermentation medium ....................... 101
Table 5-22. Overall performance of the stand-alone and biorefinery pathways for hydrogen
production using PP as feedstock. .................................................................................................. 103
Table 5-23. Productivity and yields of the CCS scenarios ............................................................. 122
Page 14
Hydrogen Production through Gasification and Dark Fermentation XIV
List of Publications
Research Papers
Carlos A. García, Ramiro Betancourt, Carlos A. Cardona. “Stand-alone and biorefinery pathways
to produce hydrogen through gasification and dark fermentation using Pinus Patula”. Journal of
Environmental Management. Elsevier. Status: Accepted. In Press. DOI:
10.1016/j.jenvman.2016.04.001.
Valentina Aristizábal M, Carlos A. García V, Carlos A. Cardona A. “Integrated Production of
Different Types of Bioenergy from Oil Palm through Biorefinery Concept”. Waste and Biomass
Valorization. Springer. Status: Accepted. DOI: 10.1007/s12649-016-9564-7
Carlos. A. García, Carlos. A. Cardona, “Anthocyanin Production Evaluation using Plant Cell
Cultures: Growth and Viability Analysis at Different Process Conditions,” Ing. Univ., vol. 20, no.
1, pp. 7-20, 2016. DOI:10.11144/Javeriana.iyu20-1.apeu
Héctor Forero, Carlos A. García, Carlos Cardona. “Aplicación de la termodinámica en la síntesis
óptima de procesos químicos y biotecnológicos”. Revista de la Facultad de Ciencias Químicas.
ISSN: 1390-1869.
Papers under review
Carlos A. García, Jonathan Moncada, Carlos A. Cardona, “Techno-economic and ex-ante
environmental assessment of bioenergy production systems: comparison of thermochemical and
biochemical pathways in the Colombian context”. Status: Under Review
Carlos A. García, Marjorie Morales, Germán Aroca, Carlos A. Cardona, “Environmental
assessment of hydrogen production based on Pinus patula plantations in Colombia”. Energy.
Status: Under Review
Page 15
Conferences Papers
Carlos A. García, Alvaro Gomez, Ramiro Betancourt, Carlos A. Cardona, “Environmental
comparison of thermochemical and biochemical ways for producing energy from agricultural solid
residues: Coffee Cut-Stem case”, In: Cyprus, Event: Conference of Sustainable Solid Waste
Management CYPRUS 2016.
Julio Sanchez, Carlos A. García, Carlos A. Cardona, “Biogas Production from Three
Lignocellulosic Residues: Coffe Cut-Stems (CCS), Sugarcane Bagasse and Pinus Patula”, In:
United States, Event: 2015 American Institute of Chemical Engineering (AIChE) Annual Meeting.
Ashley Caballero, Carlos A. García, Laura Daza, Carlos A. Cardona, “Techno-economic
assessment of biodiesel production from palm oil by supercritical transesterification”, In: United
States, Event: 2015 American Institute of Chemical Engineering (AIChE) Annual Meeting.
Julio Sanchez, Sebastian Serna, Carlos A. García, Carlos A. Cardona, “Simulation and
Comparison between the Real and Supplied Oxygen Demand of a Fermentation Process”, In:
United States, Event: 2015 American Institute of Chemical Engineering (AIChE) Annual Meeting.
Sebastian Serna, Sebastian Posada, Carlos A. García, Carlos A. Cardona, “Ethanol Production
from Cocoyam (Xanthosoma sagittifolium). Design and Analysis”, In: United States, Event: 2015
American Institute of Chemical Engineering (AIChE) Annual Meeting.
Carlos A. García, Carlos O. Tascón, Carlos A. Cardona, “Comparison of the Synthesis Gas
Production via Gasification and Combustion from Coffee Cut-Stems”, In: United States, Event:
2015 American Institute of Chemical Engineering (AIChE) Annual Meeting.
Carlos A. García, Alvaro Gomez, Yuri Pisarenko, Carlos A. Cardona, “Mathematical and
Experimental Modelling of Biomass Gasification for Hydrogen Production”, In: United States,
Event: 2015 American Institute of Chemical Engineering (AIChE) Annual Meeting.
Carlos A. García, Natalia Salazar, Carlos E. Orrego, Carlos A. Cardona, “Evaluación del impacto
ambiental de tres procesos para la obtención de energía a partir de Pino Pátula utilizando el
algoritmo de reducción de residuos”, In: Colombia, Event: VI Simposio Internacional:
Biorefinerias y productos sostenibles.
Page 16
XVI Hydrogen Production through Gasification and Dark Fermentation
Valentina Aristizabal, Carlos A. García, Carlos A. Cardona, “Stand-alone and Biorefinery ways
to produce bioenergy from solid biodiesel wastes in Colombia”, In: Greece, Event: Conference of
Sustainable Solid Waste Management TINOS 2015.
Carlos A. García, Carlos A. Cardona, “Hydrogen production by gasification and dark
fermentation from woody wastes: Energy and Environmental Analysis.”, In: Greece, Event:
Conference of Sustainable Solid Waste Management TINOS 2015.
Carlos A. García, Jonathan Moncada, Carlos A. Cardona, “Economic Comparison of Chemical
and Biochemical ways to produce bioenergy from biomass”, In: Austria, Event: 23th European
Biomass Conference and Exhibition EUBCE 2015.
Hector A. Forero, Valentina Hernandez, Carlos A. García, Carlos A. Cardona, “Use of Graph
Theory for Designing Efficient Biorefineries”, In: United States, Event: 2014 American Institute of
Chemical Engineering (AIChE) Annual Meeting.
Carlos A. García, Juan B. Restrepo, Carlos A. Cardona, “Hydrogen Production and Gasification
from Biomass: Challenges and Strategies”, In: United States, Event: 2014 American Institute of
Chemical Engineering (AIChE) Annual Meeting.
Participation of this Thesis in Research Projects
ERANet-LAC: Latin America, Caribbean and European Union. Project: Development of modular
small-scale integrated biorefineries to produce an optimal range of bioproducts from a variety of
rural, agricultural and agroindustrial residues/wastes with a minimum consumption of fossil energy
(SMIBIO). Position: Researcher in the techno-economic and environmental assessment of small-
scale integrated biorefineries using Coffee Cut-Stems, Coffee Grounds and Milk Whey.
Prizes
This thesis was awarded by the German Ministry of Education and Research with the Green Talent
Award 2016, which was created as an initiative to promote sustainable development research
among different countries around the world.
Page 17
Introduction
According to the U.S Energy International Administration (EIA), Colombia consumed 38.96
million tons of oil equivalent (Mtoe) of energy in 2012. Oil consumption constituted 41.7%,
followed by natural gas (23.5%), hydropower (11%) and coal (9.8%). The demand of primary and
secondary energy in Colombia has doubled in the period between 1975 and 2009, which required a
rapid growth of the energy conversion capacity [1]. Biomass plays an important role in the energy
matrix of the country, being the second largest renewable energy source after hydropower.
Renewable energy sources contribute with 23.2% to the primary energy matrix; water resources,
wood and bagasse contribute around 11%, 8.7% and 3.5 % of the primary energy matrix in
Colombia, respectively [2]. The demand for wood, cane bagasse and biomass residues have
remained relatively constant since 1975 ranging between 3.72 and 4.47 Mtoe [3].
The high dependence of the main economic sectors in Colombia on the fossil fuels highlights the
necessity of implementing new technologies to produce high-impact products with high energy
potential considering the large amount of wastes generated at different stages of the agroindustrial
and forestry supply chains. There are different methods to transform these residues into bioenergy
products. Thermochemical processes (i.e. gasification, combustion and pyrolysis) have been
gaining importance because they use an extensive range of biomass and have a high productivity.
In contrast, biochemical processes such as dark fermentation to produce hydrogen (as well as
fermentation processes to obtain second generation ethanol) require more research for its
implementation. However, it can be an alternative for bioenergy production with low energy
consumption [4].
Hydrogen is nowadays a promising source of energy that can be used directly and indirectly as
storage fuel with less environmental issues, especially without CO2 emissions [5]. However, only
4% of hydrogen is produced from renewable sources since high percentage of residual biomass is
used directly as feedstock for combustion processes where its energy density is lower [6][7].
Several authors have studied the influence of operating parameters such as temperature, moisture
Page 18
18 Hydrogen Production through Gasification and Dark Fermentation
content, air/biomass ratio, among others in biomass gasification and the effect of temperature, pH,
substrate concentration and fermentation time in dark fermentation for hydrogen production [8]–
[13].
Hence, the aim of this thesis is to develop a techno-economic, energy and environmental
assessment of six scenarios for the hydrogen production through gasification and dark fermentation
using Pinus Patula and Coffee Cut-Stems as energy sources. Two scenarios were considered as
base cases, which involve the stand-alone thermochemical and biochemical production of
hydrogen and the four remaining scenarios were evaluated based on the biorefinery concept for
different process configurations and products. The techno-economic evaluation was performed
considering the effect of the hierarchy distribution of the products in the hydrogen production cost.
The energy and environmental assessment was carried out in order to compare the energy
efficiency and CO2 emissions of the stand-alone and biorefinery pathways, respectively. Prior to
the simulation approach, experimental data of the air gasification and dark fermentation using the
selected raw material were obtained in order to feedback the simulation procedure.
Page 19
Hydrogen Production through Gasification and Dark Fermentation 19
Thesis Hypothesis
It is possible to obtain a rich-hydrogen gas that can be used directly as fuel for power generation
from lignocellulosic residues in the non-interconnected zones (NIZ) of Colombia through
gasification and dark fermentation.
Thesis Objectives
General Objective
To evaluate from the techno-economic, energetic and environmental point of view, the hydrogen
production from agro-industrial residues in Colombia
Specific Objectives
To perform the physicochemical characterization of the Coffee Cut-Stems (CCS) and
Pinus Patula (PP) residues.
To assess experimentally the production of synthesis gas through gasification using agro-
industrial residues coupled with the enrichment of the generated syngas using a catalyst.
To evaluate the production of hydrogen through dark fermentation using the selected raw
materials.
To simulate and compare the gasification and dark fermentation processes for hydrogen
production using the selected raw material from the techno-economic, energetic and
environmental point of view.
To simulate biorefineries based on the gasification and dark fermentation concept.
Page 20
20 Hydrogen Production through Gasification and Dark Fermentation
1. Energy in Colombia
Colombia is a country located in the North-western part of South America. With a total land area
of 1,141,748 km2 from which 40.4% of the surface is destined for agriculture activities [14].
However, Colombia has shifted in the last few years from an agricultural economy to one based on
mineral and energy resources. This new economy focus has enhanced the growth of the country
from 4% to almost 5% annually. The principal economic sectors that have influenced this growth
are: the tertiary sector which involves the trade and services activities with a participation of 60%
of the Gross Domestic Product (GDP). The secondary (manufacturing, energy and construction)
and the primary (agriculture and mining) sector have contributed with a 25.3% and 14.8% of the
GDP, respectively. In terms of the Gross Net Income (GNI), Colombia has a GNI per capital of
7,130 USD in 2015, which consolidates Colombia as an upper middle income economy [14]. The
Gini index measures the distribution of the incomes between the population in a given economy; in
2014 Colombia had a Gini index of 53.5 and it was located in the 14th place of countries with high
inequalities according to the United Nations Development Programme (UNDP). The main reason
of the high inequalities is related to the corruption, ineffective policies and weak institutions that
have caused a poor wealth distribution [3].
As a consequence of these socioeconomic and political issues, the energy and environmental sector
have suffered serious changes. According to the U.S Energy International Administration (EIA),
Colombia consumed 38.96 million tons of oil equivalent (Mtoe) of energy in 2012. Oil
consumption constituted 41.7%, followed by natural gas (23.5%), hydropower (11%) and coal
(9.8%). The demand of primary and secondary energy in Colombia has doubled in the period
between 1975 and 2009, which required a rapid growth of the energy conversion capacity [1]. In
order to mitigate the increase in the amount of required energy, various efforts have been
implemented. In the oil sector, new explorations and discoveries have been developed; however,
Colombian officials estimate that the current oil reserves will last about seven years [15]. Due to
the different weather events such as “El Niño”, which caused an intensive drought in Colombia,
Page 21
Hydrogen Production through Gasification and Dark Fermentation 21
new coal- and fired- power plants were built to reduce the high dependence of hydropower. The
use of these technologies based on coal and natural gas have increased the environmental impact of
the energy generation in Colombia. According to the Mining and Energy Planning Unit (UPME),
the Greenhouse Gas (GHG) emissions increased 2.5 times between 1975 and 2009 due to the
intensive used of non-renewable and high pollutant energy sources such as oil, coal and natural
gas.
1.1 Energy Matrix
The energy matrix of Colombia has been transformed throughout the last years. Oil is the main
energy source with a contribution to the 41.7% of the primary energy generation. Colombia
produced 1 million barrels per day of petroleum and other liquids in 2015 (see Figure 1-1) [16].
Colombia’s oil production has increased by an annual average of almost 11% since 2008. This
behavior is evidenced due to the intensive use of oil derivatives in the transportation sector,
especially Diesel, despite the implementation of new fuels such as the Natural Gas Vehicle (NGV)
(see Figure 1-2).
Figure 1-1. Production of crude oil (thousands of cubic feet per calendar day) in Colombia.
Adapted from: [17].
Page 22
22 Hydrogen Production through Gasification and Dark Fermentation
Figure 1-2. Diesel consumption in Colombia.
Adapted from: [18]
Regarding other fossil fuels, natural gas contributes to the 23.5% of the total energy sources.
According to the Energy Ministry, Colombia produced 413 billion cubic feet (Bcf) of dry natural
gas in 2015 [19]. The demand of this energy source has increased in an average of 7.4% annual
between 2009 and 2013, due to different factors such as: i) new government policies for the
implementation of natural gas in industrial processes because of its environmental and economic
benefits and ii) the high participation of the thermal energy in the electricity generation due to
different weather conditions such as “El Niño” that has forced the government to implement new
diversification strategies of the electric energy sources (see Figure 1-3).
Figure 1-3. Distribution of the natural gas consumption in different sectors of Colombia
Adapted from: [20]
Page 23
Hydrogen Production through Gasification and Dark Fermentation 23
Colombia is the eleventh coal producer and the fifth coal exporter in the world with a production of
97.6 million short tons (MMst) of coal in 2014 [16]. However, the participation of this energy
source in the Colombian matrix reaches 9.8% of the primary energy sources with an internal
consumption of 7.4 MMst. This behavior can be explained due to the fact that the generation of
electricity in Colombia is mainly from hydropower. According to the Energy International
Admisnitration (EIA), in 2015 Colombia had 15.7 gigawatts (GW) of installed electricity
generation capacity [16]. Of the generated electricity in 2015, hydropower plants provided 70%,
natural gas accounted for 12%, coal accounted for 7%, petroleum accounted for 10% and the
remaining electricity was from other sources.
Renewable energy sources contribute with 23.2% to the primary energy generation, which are
distributed in the following way: water resources contribute about 11%, wood fuel 8.7% and
bagasse with 3.5 % [2]. Biomass plays an important role in the energy matrix of the country as it is
today the second largest renewable energy resource after hydropower. The historical demand of
biomass in the form of wood, cane bagasse and biomass residues has remained relatively constant
since 1975 ranging between 3.72 and 4.47 Mtoe [3]. The use of biomass for energy purposes
depends of the type, composition and its application. Wood is used as traditional fuel for cooking
and heating in farms, where its energy density is very low. However, in 2008 a gasification project
was implemented in Necoclí (Antioquia), located in the northwestern of Colombia, aiming to
produce electricity using wood residues in order to supply energy to the town, which it is not
connected to the Interconnected National System (SIN). Gasification is one of the most promising
technologies for the production of energy using reciprocating engines. Besides, sugarcane bagasse,
which is a by-product of sugarcane processing, is used as fuel in boilers and cogeneration power
plants to provide heat and power. In 2012, sugarcane mills had an installed capacity of 187 MW, of
which 129 MW were needed in order to meet the electricity demand of the mills, whereas 53 MW
were available to generate surplus electricity to be sold to the grid [2].
Finally, the Colombian energy matrix is completed with bioethanol and biodiesel that are used as
fractions in mixtures with gasoline and diesel in the transportation sector. These biofuels contribute
about 1% and 0.7% of the total primary energy, respectively [3]. Bioethanol is produced from
sugarcane molasses through a fermentative, distillation and dehydration process. In 2012,
Colombia produced approximately 292,000 tons of ethanol, which were consumed directly in the
country [21]. According to the Biofuels National Federation (Fedebiocombustibles), the mandatory
blending of ethanol into gasoline was increased to 8% in the Andean, Amazon and Pacific regions
of the country. On the other hand, biodiesel is produced from oil palm through a series of processes
Page 24
24 Hydrogen Production through Gasification and Dark Fermentation
that involve the oil refining, continuous transesterification and biodiesel purification. In 2012,
Colombia produced around 490,000 tons of biodiesel, which were used for internal consumption,
as in the case of ethanol. Figure 1-4 summarizes the energy matrix of Colombia.
Figure 1-4. Distribution of the main energy sources in Colombia
Taken from: [3]
1.2 Advantages and deficiencies of the current energy systems
Nowadays, the production of energy in Colombia is mainly based on fossil fuels and water sources.
Fossil fuels such as oil, gasoline, natural gas, coal, among others have a series of advantages in
comparison to other energy sources. The enactment of a series of regulatory reforms to make the
oil and natural gas sector more attractive to foreign investors led to increase the Colombian
production of thes fuels. Therefore, the principal activity and background of the economy in
Colombia has become the oil industry, which can be evidenced in the current issue with the
petroleum international price. The emission of greenhouse gases (GHG) is related mainly to the
use of fossil fuels in the transportation and industrial sectors. In 2016, Colombia experimented the
hottest semester of the history due to a weather event “El Niño” that reduced the water reservoirs
levels below 50%. This behavior caused the reduction of electricity generation from hydropower
plants, and in order to supply the internal energy demand of Colombia, the government increased
the capacity of some thermal power stations to reach the energy needs of the country. However,
these plants do not have the installed capacity to meet the energy requirements of the country due
to the lack of planning and prevention of these types of disasters.
42%
23%
10%
11%
9%
3% 1% 1%
Petroleum
Natural Gas
Coal
Hydropower
Wood
Bagasse
Bioethanol
Biodiesel
Page 25
Hydrogen Production through Gasification and Dark Fermentation 25
For these and many other reasons, the search for new energy sources has begun to increase in
recent years. The main causes are related to environmental issues, the reduction of oil reserves and
the large amount of generated daily wastes. The high dependence on fossil fuels of the main
economic sectors in Colombia demonstrates the need to implement new technologies to generate
high-impact products with high energy potential, taking advantage of the large amount of
generated wastes at different stages of the agroindustrial supply chain.
1.3 Renewable energy sources
The Mining and Energy Planning Unit (UPME) developed the Program for the Rational and
Efficient Use of Energy and other Forms of Non-Conventional Energy 2010-2015 (PROURE) to
ensure a proper energy supply, competitiveness of the Colombian economy, consumer protection
and promotion of the use of non-conventional energy in a sustainable way with the environment
and natural resources [22]. The main goal of this program was to achieve in 2015 a share of 3.5%
of Non-Conventional Energy Sources (FNCE) in the National Interconnected System (SIN) and
20% of FNCE for Non-Interconnected Zones (NIZ). The non-conventional energy sources include
wind power, biomass, small hydropower plants and solar power, among others. With the law 1715
of 2014, the National Government regulated the integration of the non-conventional renewable
energies to the national energetic system. The main objective of the law 1715 is to promote the
development and use of non-conventional renewable energy sources through the integration in the
electric market, in the Non-Interconnected Zones and in other energy uses [23].
Biofuels have an important role in the energy matrix of Colombia but due to different regulatory
frameworks (Laws 693 of 2001 and 939 of 2004), the share of its use as land fuels is very limited.
Nevertheless, the biofuel sector has great benefits such as tax exemption. The incomes from the
use of crops such as the oil palm have a tax exemption for a period of 10 years. Biofuel plants that
obey with the requirement of a high investment of 75,000 SMMLV (Legal Minimum Wage) or
that have more than 500 employees, they can succeed to a special regime of Free Economic Zone,
which allows the owners of the plants to import machinery without paying duties and a tax rate of
15% [22]. In most of the country, a fraction of 8% ethanol in gasoline by regulation must be
supplied, while a fraction of 10% of biodiesel must be added to diesel.
Colombia does not have a properly structured production chain of bioenergy unlike biofuels.
However, different projects using residues for energy production have been developed. Sugarcane
Page 26
26 Hydrogen Production through Gasification and Dark Fermentation
bagasse is one of the main generated wastes in harvesting and milling of sugarcane mills.
Currently, this residue is being used for power generation through cogeneration systems. There are
several projects related to the use of the generated biogas from landfills, combustion, gasification,
pyrolysis and anaerobic digestion distributed along the country in department such as Caldas,
Cundinamarca, Nariño and Antioquia.
1.4 Non-Interconnected Zones in Colombia
The non-interconnected zones (NIZ) were defined in Colombia in the Article 11 of the Law 143 of
1994, and they were categorized by the resolution 182138 of the Energy and Gas Regulatory
Commission (CREG) in 2007 as the zones that do not have access to the public electricity service
through the National Grid (NG). According to the data of the World Bank [14], the access to
electricity of the population in Colombia reaches 97%, which do not affect the national PIB;
however, in regions such as Amazonia, Orinoquia and Pacific, the electricity access can affect
considerably the local growth. The main characteristics of the NIZ are: they are located in places of
difficult access, far away from the main urban centers, huge ecological importance due to their rich
natural resources and biodiversity, most of the natural national parks and reserves are located there,
lack of public services such as energy, water and sewage. The geographical location, the lack of
physical infrastructure and access routes make very difficult, from the economic and
environmental point of view, the connection of these zones to the National Grid (NG). Therefore,
renewable alternatives could be implemented in these zones considering the high availability and
variety of natural resources [24].
The NIZ comprise the 66% of the total country’s area; which include 5 capital cities and 1,500
towns in the rural area rising to 1.8 million inhabitants that represent the 3% of the total population
of Colombia (see Figure 1-5). From this point of view, the NIZ seem to have no significant effect
on the country growth. Nevertheless, according to the National Institution of Colombia, article
365: “Colombian government must provide the efficient energy supply to the population in
Colombia” gives some statements of the access to electricity in all the communities and
individuals to improve the quality of life. In non-interconnected areas the levels of poverty, access
to education, access and quality of housing, among other indicators, remain neglected with respect
to the national average.
Page 27
Hydrogen Production through Gasification and Dark Fermentation 27
Figure 1-5. Graphical map of the Non-Interconnected Zones in Colombia (Gray Departments)
Taken from: Minning and Energy Ministry, 2013.
Due to the relative high cost and the construction difficulties of hydropower plants for low scale
population, it is very difficult to connect the NIZ to the NG. Considering these drawbacks,
different energy alternatives have been implemented in order to supply the energy demand of the
non-interconnected areas. The highest contribution of electricity in the NIZ came from the use of
diesel generators and from small hydropower plants; however, 96.3% of the electricity generation
capacity comes from the diesel generators [25]. The Institute of Planning and Promotion of
Energy Solutions (IPSE) has promoted different non-conventional energy projects in departments
that are considered as NIZ. Solar and wind energetic solutions have been implemented in different
departments such as Chocó, La Guajira, Amazonas, Vaupés, among others [26]. The number of
hours that a town in the NIZ has electricity is very limited (e.g. 6 hours per day of electricity);
therefore, the main objective of these energetic solutions is to increase the time of the electricity
service supply. Despite the use of the sun and wind to generate electricity and considering the high
availability of natural resources in Colombia, especially in the NIZ, different technologies could be
implemented to supply the energy needs of these zones.
In the departments with lack of energy systems and high generation costs, the sale price of 1 kWh
of electricity varies between 400$ in Guainía to 850$ in Vaupés [24]. These costs are distributed
among the generation, transmission, commercialization and distribution. The generation costs are
related to the production of electricity through water, coal, natural gas and renewable resources.
The second process involve the transmission, which is the transport of the electricity from the
Page 28
28 Hydrogen Production through Gasification and Dark Fermentation
generation plants to the large consumption centers. Subsequently, the supplied energy must be
distributed to the final users in the cities and finally, the commercialization of the energy in
relation to its sale price.
1.5 Biomass suitable for energy production in Colombia
Biomass is the most used renewable resource in the world and it has a great energy potential. This
resource can be obtained from plants, plant-derived materials and animals. Wood has been the first
type of biomass used for cooking and heating water and still remains as the largest biomass energy
source, but recently other biomass can also be used to produce energy. These include food crops,
grassy and woody plants, residues from agriculture or forestry, oil-rich algae, and the organic
component of municipal and industrial wastes. These residues can provide an array of benefits:
- The use of biomass energy has the potential to greatly reduce greenhouse gas emissions.
Burning biomass releases about the same amount of carbon dioxide as burning fossil fuels.
However, biomass releases carbon dioxide that is largely balanced by the carbon dioxide
captured in its own growth (depending how much energy was used to grow, harvest, and in
the fuel production). It is considered by several authors that biomass has zero CO2
emissions into the atmosphere, but there are several factors that can increase the emissions
of these residues such as: the energy used to grow, harvest and the fuel consumption in the
different stages of the crop cultivation.
- The use of biomass can reduce the dependence on fossil fuels; nowadays, biofuels are the
only available renewable liquid transportation fuels.
There are different technologies to transform the biomass in energy: thermal processes such as
combustion and gasification to obtain heat to produce steam and subsequently, electricity or these
technologies can also produce directly bioenergy. On the other hand, biochemical methods use C5-
C6 fractions, obtained in a previously pretreatment stage, to produce different bioenergy products
through microorganisms able to degrade these fermentable sugars. In chapter 2 a more detailed
description of these technologies is presented.
Colombia is characterized by a vast bioenergy potential that remains untapped. Various studies
have recently estimated a theoretical biomass energy potential, ranging between 5 and 18 Mtoe,
depending on the assumptions [3]. The transformation technologies and the biomass availability
are the current constrains for energy exploitation. The energy efficiency of the technologies for
biomass transformation can vary from 20% (e.g. microturbines) to 50% (e.g. gasification).
Page 29
Hydrogen Production through Gasification and Dark Fermentation 29
Logistics and transportation issues are the main bottlenecks of the biomass to be implemented as
bioenergy system. Colombia is a country suitable for agriculture; however, due to its geography
and non-technified cultivation methods, the transportation of the biomass to the processing centers
presents a lot of drawbacks that make the process non profitable. Considering all these
inconveniences, from the theoretical biomass energy potential a fraction ranging between 1 and 10
Mtoe might be technically available. Tables 1-1 and 1-2 summarize some of the most common
energy crops in Colombia considering their production capacity, the main energetic product from a
given crop and the amount of energy that can be obtained from the crop processing.
Sugar cane is one of the most emblematic crops in Colombia due to the variety of products that can
be obtained. Ethanol, sugar, sugarcane bagasse and currently, other residues (e.g. leaves) from the
harvesting of sugarcane are the main bioenergy products of this crop. From the information
provided in Table 1-1, the high energy potential of these sub-products is related to the high
availability of this crop throughout the year in the country. The biomass availability is one the
bottlenecks of most of the biomass systems since the energy crops are harvested seasonally, which
means that the raw material would not be available, carrying new economic challenges for the
implementations of biomass-based processes.
Table 1-1. Potential energy of different crops and residues. Adapted from: [27]
Crop Productiona
(ton/year)
Energy
Productb
%
Energyc
Energy
Product
Generationd
(ton/year)
Calorific
Valuee
(KJ/kg)
Gross
Energy
Potentialf
(MWh/year)
Oil Palm 2,289,472 Oil 20% 457,894 36,950 536.50
Soybean 55,869 Oil 18% 10,056 34,750 11.08
Cacao 42,855 Oil 50% 21,428 36,000 24.46
Sugarcane 21,897,120
Alcohol 6% 1,210,911 26,700 1,025.22
Bagasse 29% 6,350,165 8,895 1,791.12
Crop Residues 46% 10,072,675 15,000 4,791.04
Corn 700,897 Alcohol 37% 259,332 26,700 219.56
Potato 2,586,451 Alcohol 79% 173,912 26,700 147.24
Rice 1,704,551 Husk 25% 426,138 13,900 187.83
Coffee 487,726 Pulp 50% 243,863 15,880 122,71
a Crop annual production based on the data reported by [27]
Page 30
30 Hydrogen Production through Gasification and Dark Fermentation
b Product that can be obtained from the energy crop.
c Fraction of the energy crop destined to the production of bioenergy.
d Energy product (ton/year) = Crop production(ton/year) ∗ % energy
e Calorific value of the bioenergy product
f The Gross Energy Potential (GEP) is defined as the maximum amount of energy that can be
obtained from a bioenergy product if it is submitted to a thermal process.
On the other hand, biomass from natural and planted forests has been one of the most used
alternatives to produce energy directly or indirectly (see, Table 1-2). However, stronger policies
must be implemented in relation to the deforestation of natural forests for commercial and
expansion purposes. Due to the lack of clear policies, reforestation programs do not have a large
participation in the energy matrix of the country, but its implementation can help to mitigate the
environmental impact on the natural forests.
Table 1-2. Potential energy of natural and reforested forests
Adapted from: [27]
Forest Area
(Ha)
Yield
(m3/ha)
%
Residues
Density
(ton/m3)
Residues
Production
(ton/year)
Calorific
Value
(KJ/kg)
Gross Energy
Potential
(MWh/year)
Natural 2,250,000 53 47% 0,51 1,141,635 18,744 697.98
Reforested 145,000 102 40% 0,53 799,500 17,444 441.82
1.6 Final Remark
Currently, Colombia is a country with high dependence to fossil fuels in most of the economic and
transportation sectors; however, new alternatives have begun to implement using residues from
different agroindustrial, agriculture and forestry supply chains in order to obtain energy products
with low CO2 emissions and high energy yields. Examples such as the use of sugarcane bagasse
and wood wastes for the production of electricity through cogeneration and gasification schemes,
are projects that seek to implement the idea of environment friendly technologies in Colombia.
Page 31
Hydrogen Production through Gasification and Dark Fermentation 31
2. Hydrogen as energy vector
Hydrogen is the most abundant component in the world. It does not exist by itself on earth, but
it can be produced from a variety of sources like coal, natural gas, oil, water and biomass using
different process technologies [5], [6]. The hydrogen energy is based on the fact that hydrogen
reacts with oxygen to produce energy and water as presented in Eq. 2-1.
𝐻2 +1
2 𝑂2 → 𝐻2𝑂 ∆𝐻 = −285,5 𝑘𝐽
𝑚𝑜𝑙⁄ 𝑎𝑡 25°𝐶 (2-1)
Nowadays, hydrogen is a promising source of energy that can be used directly and indirectly as
storage fuel with less environmental issues, especially without CO2 emissions [5]. Hydrogen has
the highest energy density (141.9 kilojoule per gram) in comparison with other hydrocarbon
fuels as summarized in Table 2-1. The future implementation of the hydrogen as energy carrier
depends primarily upon four factors: (i) the future cost of hydrogen, (ii) The advance of the
technologies for hydrogen production, (iii) log-term restrictions on greenhouse gases and (iv)
the cost of competing energy systems, mainly, fossil fuels [28].
Table 2-1. Energy yield of hydrogen and other common fuels at 25°C and 1 atm [29].
Fuel Higher Heating Value (kj/g)
Hydrogen 141.9
Methane 55.5
Gasoline 47.5
Diesel 44.8
Methanol 20
Ethanol 29.7
Coal 36
Propane 49.9
Hydrogen is not a primary energy source, it can serve as an energy carrier such as electricity and
thus, it can replace fossil fuels in a wide range of applications [30]. It could be implemented as a
long-term energy carrier to reduce the high dependence of fossil fuels and the CO2 emissions
into the atmosphere. Different methods can use hydrogen to release energy such as direct
combustion, steam production and fuel cells. Among these methods, the fuel cell is the most
efficient and cleanest technology for releasing energy from hydrogen [31]. The by-product of
Page 32
32 Hydrogen Production through Gasification and Dark Fermentation
the main fuel cell reaction, when hydrogen is the fuel, is pure water which means that a fuel cell
can be essentially ‘zero emission’ [32].
Only 4% of hydrogen is produced from renewable sources, the remaining 96% is produced from
fossil fuels, especially, natural gas [6]. Some renewable sources for hydrogen production are
biomass such as forest residues, wastewater, manure, crop residues, among others. Additionally,
hydrogen can be produced from water using as energy sources: the sun, wind, hydropower, geo-
thermal and nuclear energy. Only biomass can produce hydrogen directly; however, seasonal
availability and transportation issues make the process non-profitable [33]. In order to enhance
the economic profitability of the hydrogen production, energy efficiencies between 60-80% are
required [5]. Despite the high energy potential of the biomass, it is often dumped or used
directly as feedstock for combustion processes where its energy density is very less [7].
The biggest concern in using hydrogen as energy carrier in the transportation sector is related to
safety issues. It is also important to note, that the same concerns were evidenced when gasoline
and diesel were considered as energy carriers of the transportation sector [31].
Hydrogen is a nontoxic gas in concentration below 100 ppm, environmental safe and has low
radiation levels. However, hydrogen is odourless, which can be an issue because it burns with a
colourless flame that may not be visible. The ignition energy (IE) is the minimum amount of
energy required to ignite a combustible vapor or gas. The IE for hydrogen (0.2 mJ) is lower than
for ethanol (0.24 mJ) and methane (0.29 mJ). The self-ignite temperature (IT) is the minimum
temperature at which a substance spontaneously ignite in normal atmosphere. The IT for
hydrogen is 583.1 °C that it is a great advantage over other energy carriers such as gasoline (228
– 501°C) and natural gas (540.1°C). The hydrogen diffusivity in the air is considerably greater
than gasoline. For that reason, it is almost impossible to make hydrogen to explode in an open
area due to the high volatility [31]. Nevertheless, hydrogen is detonable over a very wide range
of concentrations when confined. In summary, hydrogen is safer than other fuels such as
gasoline, diesel and methane. Despite the advantages of hydrogen, low density is one of the
main bottlenecks of this gas so as to be implemented as energy carrier in the transportation
sector. Due to the low density (0.09 kg/Nm3), large storage vessels are required in order to store
enough hydrogen to give the vehicle an adequate driving range [28].
2.1 Methods for hydrogen production
Traditionally, technologies for hydrogen production can be divided into thermochemical
methods (steam methane reforming, gasification, pyrolysis, and combustion), electrochemical
methods (electrolysis and photolysis) and biochemical methods (dark fermentation and photo-
Page 33
Hydrogen Production through Gasification and Dark Fermentation 33
fermentation). Despite the classification based on the used technology, the hydrogen production
can also be classified by the source of energy; splitting in two main groups: fossil fuels energy
sources (coal, natural gas and other hydrocarbons) and renewable energy sources (biomass,
wind and solar). As previously mentioned, approximately 96% of the produced hydrogen comes
from fossil fuels, especially using thermochemical transformation methods such as Steam
Methane Reforming and Partial Oxidation. Figure 2-1 presents the relation between the energy
sources and the technologies for hydrogen production. Depending on the type of energy source,
different transformation methods can be implemented to produce hydrogen. When fossil fuels
are used, the main transformation pathway is the thermochemical conversion. On the other
hand, renewable sources use different technologies to produce hydrogen such as gasification,
fermentation or electrolysis. Biomass can be transformed to hydrogen through thermochemical
and biochemical technologies, depending on the type of biomass. Raw material with high
lignocellulosic content have higher energy yields when they are directly converted to hydrogen
through thermochemical methods, which allow an extensive range of feedstock, being much
faster but less selective, and require high temperature and therefore, larger energy inputs [34]–
[36]. Biomass with high biodegradability and low crystallinity can be used to produce hydrogen
through biochemical methods. These technologies are more hydrogen selective but they still
operate in batch regime, which provides low productivities. On the other hand, electrochemical
methods are widely used to obtain hydrogen through the electrolytic conversion of water but
great volumes of hydrogen cannot be produced by this method because of the production cost.
2.1.1 Thermochemical technologies
The main purpose of thermochemical methods is the separation of hydrogen from the feedstock
through a series of chemical reactions. Depending of the process, the reactions can be
endothermic (require an external energy input) or exothermic (internal energy generation) [37].
Steam Methane Reforming (SMR) is the most used commercial process for hydrogen
production due to its high cost-benefit ratio, using gaseous and liquid hydrocarbons as its main
feedstocks [38]. However, biomass gasification seems to be the most promising solution for the
production of second generation biofuels [5]. The main advantage of the thermochemical
methods is that the overall energy efficiency is higher than 52% and the production cost is lower
than biochemical methods [28]. In this section, a brief description of some thermochemical
processes is presented.
Page 34
34 Hydrogen Production through Gasification and Dark Fermentation
Figure 2-1. Energy sources and methods for hydrogen production
- Steam methane reforming (SMR)
SMR contributes to about 40–50% of total hydrogen production [37]. This process is divided in
four steps: Pretreatment of the raw gas, reforming of the synthesis gas, conversion to hydrogen
rich-gas and purification of hydrogen. Prior to steam reforming, the raw gas is pretreated in
order to convert any sulfur compound to H2S. Then, methane reacts with steam to produce
hydrogen and carbon monoxide (Eq. 2-2). In order to enhance the hydrogen concentration,
carbon monoxide is converted into hydrogen and carbon dioxide using steam as reacting agent
(Eq. 2-3). Finally, a hydrogen purification step is used to clean up the hydrogen rich gas from
carbon dioxide, carbon monoxide, unreacted methane, among others. Pressure Swing
Adsorption (PSA) is the most commonly technology for hydrogen purification. PSA typically
occurs at temperatures in the range of 800 – 1000 °C and pressures between 13 – 20 bar [37].
The heating requirements of the process are supplied via burning of natural gas [39]. The steam
reformation of methane produces a rich-hydrogen gas (70 – 75%), along with small amounts of
methane (2 – 6%), carbon monoxide (7 – 10%) and carbon dioxide (6 – 14%) [40]. The scale of
the process (large and small scale) determines the energy efficiency, which can varies from 85 –
90% in large scale process where some heat is recovered. On the other hand, in small scale
systems, the energy efficiency varies from 47 – 55% [41]. The chemical reactions involved in
the production of hydrogen through SMR are presented below.
𝐶𝐻4 + 𝐻2𝑂 → 𝐶𝑂 + 3𝐻2 ∆𝐻 = +206 𝑘𝑗/𝑚𝑜𝑙 (2-2)
Page 35
Hydrogen Production through Gasification and Dark Fermentation 35
𝐶𝑂 + 𝐻2𝑂 → 𝐶𝑂2 + 𝐻2 ∆𝐻 = −40.9 𝑘𝑗/𝑚𝑜𝑙 (2-3)
- Partial Oxidation (POx)
The second most common method to produce hydrogen from natural gas (mainly methane) or
other hydrocarbons is the Partial Oxidation. Fossil fuels are combusted with limited amount of
oxygen at 1200 – 1400°C and 700 – 1000°C using catalyst [31], [37], [41]. The product from
the partial oxidation consists of a syngas (CO and H2) and a mixture of CO2, N2, H2O and small
amounts of CH4. This process has a faster hydrogen production compared to SMR; however, the
hydrogen productivity per mass of raw material is lesser. According to this, the energy
efficiency varies from 71 – 89% [31]. The chemical reaction involved in the POx for hydrogen
production is presented below.
𝐶𝑛𝐻𝑚 +𝑛
2𝑂2 → 𝑛𝐶𝑂 +
𝑚
2𝐻2
(2-4)
- Gasification
Gasification consists in the conversion of carbonaceous material (mainly coal and biomass) into
a synthesis gas rich on hydrogen, carbon monoxide, carbon dioxide and methane using a
gasifying agent such as air, steam, oxygen or a mixture of these. Depending on the type of
gasifying agent used in the process, different gaseous species, in the synthesis gas can be
obtained as shown in Table 2-2. Using air as a gasifying agent to produce hydrogen has its main
drawback in the high nitrogen content present in the synthesis gas, requiring a downstream
process (i.e. membrane technology) to separate nitrogen from the fuel gas, increasing the
hydrogen production costs. The generation of electricity is the main application of air
gasification because it is the cheapest alternative and it provides a moderate energy content in
the produced synthesis gas. The remaining three types of gasifying agents (steam, oxygen and
oxygen / steam mixtures) have higher hydrogen production yields. Pure oxygen ends up
consuming methane, tar, and any hydrocarbons in the product gas via combustion, which means
that the gas is essentially a pure mixture of H2 and CO [42]. Using steam as gasifying agent
affects the H2/CO ratio, increasing the content of methane and thus, the energy content of the
gas. However, the main limitation of gasification processes, that use other gasifying agent
different to air, is the high acquisition cost of the gasifying agent (in the case of oxygen), and
the cost associated to the production of the gasifying agent; for example, the use of a boiler in
the steam production. Other parameters that affect the gasification performance are:
Temperature, pressure, particle size, moisture content of the feedstock, the equivalence ratio
(ER), among others.
The energy efficiency of the coal gasification (67%) is higher than for biomass gasification (41
– 59%); however, 11 kg of carbon dioxide are released into the atmosphere per kilogram of
Page 36
36 Hydrogen Production through Gasification and Dark Fermentation
produced hydrogen in the coal gasification. The general chemical reaction that describe the
gasification is presented below.
𝐶𝐻𝑥𝑂𝑦 + 𝑤𝐻2𝑂 + 𝑚(𝑂2 + 3.76𝑁2)
= 𝑛𝐻2𝐻2 + 𝑛𝐶𝑂𝐶𝑂 + 𝑛𝐶𝑂2
𝐶𝑂2 + 𝑛𝐻2𝑂𝐻2𝑂 + 𝑛𝐶𝐻4𝐶𝐻4 + 3.76𝑚𝑁2
(2-5)
Table 2-2. Types of gasifying agent used in gasification procedures.
Composition (% Vol) Gasifying Agent
Air [43] Steam [44] Oxygen [45] Oxygen/Steam [10]
Hydrogen 14 – 19 % 20 – 35 % 30 – 50 % 26 – 30 %
Carbon Monoxide 15 – 21 % 40 – 45 % 45 – 50 % 35 – 39 %
Carbon Dioxide 10 – 15 % 10 – 15 % 5 – 35 % 27 – 32 %
Methane 1 – 3 % 5 – 10 % < 2 % 3 – 4 %
Nitrogen 45 – 55 % ------ ------ ------
HHV (Mj/Nm3) 4 – 6 16 – 19 5 - 16 9 – 11
2.1.2 Biochemical methods
High performance of the biological conversion of biomass to hydrogen depends on the ability of
the microorganism to degrade the raw material. Lignocellulosic residues can be used to obtain
different added-value products due to their high cellulose/hemicellulose ratio. These residues
are mainly compose of cellulose and hemicellulose. Lignin is the main constraint for the
integration of these wastes in industrial processes: their high crystallinity and low
biodegradability. Considering this, different pretreatment methods have been studied in order to
enhance the availability of the fibers to be degraded by the microorganisms. Thermal, acid,
alkaline, enzymatic pre-treatment methods are some of the most used processes to enhance the
biomass biodegradability. Biological methods are considered as a promising way of producing
hydrogen as they provide a feasible route for the sustainable supply of H2 with low pollution
and high efficiency [46]. Dark fermentation is one of the methods that use microorganisms to
produce hydrogen from biomass. This process has the advantage over others such as photo-
fermentation since the bioreactor design is smaller and cheaper and it requires the absence of
light so that the organism develops in the best conditions [38]. A brief description of this
process is presented below.
- Dark fermentation
Dark fermentation is a complex process that involves diverse groups of bacteria where simple
sugars or disaccharides are converted into hydrogen, carbon dioxide and organic acids [13].
Temperature, pH, substrate type and Hydraulic Retention Time (HRT) are the main parameters
that affect the behavior of the microorganism in dark fermentation. Several authors have studied
Page 37
Hydrogen Production through Gasification and Dark Fermentation 37
the production of biohydrogen using different substrates. Ren et al., [47] studied the production
of hydrogen using glucose, xylose and a mixture of these as substrate to evaluate the ability of
the microorganism to degrade both sugars. Ren et al., [48] studied the effect of the enzymatic
hydrolysis of corn stover in the production of hydrogen. Ghimire et al., [4] reviewed a range of
different organic biomass and their biohydrogen potential from laboratory to pilot-scale
systems. Optimal pH range for hydrogen varies from 4.5 to 7, which depends on the type of
microorganism and also whether the raw material is hydrolyzed. Moreover, the temperature of
the fermentation also affects the hydrogen production. The fermentative process can be carried
out at different temperature conditions: mesophilic (35 °C), thermophilic (55 °C) and extreme
thermophilic (>65 °C). Low productivity per unit of mass, due to batch operation regime, is
obtained from this biochemical method. Capital investment is one of the major challenges of the
hydrogen production by dark fermentation; therefore, more research on the scale of the process
at industrial level is required to ensure high productivity and economic profitability.
2.1.3 Electrochemical Methods
Alkaline Water Electrolysis is a well-known process and it has been studied for around 200
years. However, due to the high percentage of hydrogen that is produced from thermochemical
methods, water electrolysis only contributes to the 4% of the worldwide total hydrogen
production. This method has the advantage to produce hydrogen at a high purity (>99.9%),
which is ideal for some high value-added processes such as manufacture of electronic
components [49]. The process scale is one of the most determining parameters in the industrial
application of this technology. Water electrolysis is often limited to small-scale applications and
in particular cases, where the large-scale production plants are not accessible or economical
profitable [50].
A basic water electrolysis unit consists of an anode, a cathode, power supply, and an electrolyte.
The operation of the unit requires a direct current (DC) to maintain the electrical balance and
flow of electrons from the anode to the cathode, where electrons are consumed by protons to
produce hydrogen. The equipment requires external electricity, which is normally provided
from fossil fuel, coal or natural gas; however, the system could be more sustainable if electricity
is derived from renewable sources such as wind, solar, hydro, geo-thermal, among others. The
energy efficiency of this electrolysis systems varies from 70 – 80%, operating at temperature in
the range of 343 – 353 K [51].
An overview of the previously described processes is summarized in Table 2-3. A techno-
economic comparison between different technologies for hydrogen production is carried out
Page 38
38 Hydrogen Production through Gasification and Dark Fermentation
considering the main products, the production cost of hydrogen, energy resource and efficiency.
Additionally, the main advantages and limitations of each technology are shown.
Thermochemical processes such as Steam Methane Reforming, Partial Oxidation and Coal
Gasification use hydrocarbons as raw material; therefore, these methods generate emissions into
the environment. From these three methods, coal gasification has the highest GHG emissions
with 11 kg of CO2 per kg H2, whereas the partial oxidation of natural gas has the lowest
emissions with less than 3 kg CO2 per kg H2. On the other hand, biomass gasification emits
about 5.43 kg CO2 per kg H2; nevertheless, the emissions of the process that use biomass as raw
material can be neglected if the complete biomass cycle is considered. Biomass absorbs carbon
dioxide from the atmosphere during its growth and then CO2 is released again into the
environment as a result of its processing, which can be considered as neutral emissions.
Electrochemical methods only use water as raw material and thus, the environmental impact is
related to the employed energy source. If renewable energy sources are used, there are no GHG
emissions into the atmosphere. Table 2-3 shows also the overall energy efficiency of different
technologies for hydrogen production. Processes that use fossil fuels as raw material have
energy efficiencies that vary from 60 to 89% depending of the energy source (e.g. thermal or
electric power). Biomass efficiency varies between 30% up to 50%, which can be considered a
competitive rate with other production processes.
2.2 Hydrogen economy
The term "hydrogen economy" refers to the vision of using hydrogen as a low-carbon energy
source – replacing, for example, gasoline as a transport fuel or natural gas as a heating fuel.
Hydrogen is attractive because whether it is burned to produce heat or reacted with air in a fuel
cell to produce electricity, the only byproduct is water [52]. Only in the last decade, the idea of a
post-fossil fuel hydrogen-based economy started to gain mainstream interest [28].
The global market for hydrogen is already greater than $40 billion dollars per year [53].
According to the International Energy Agency (IEA), hydrogen consumption in the market can
be distributed as follow: petroleum recovery and refining uses 46.3% of the total hydrogen
production, ammonia production 44.5%, methanol production 3.7% and the remaining is
distributed between the electronic, food and metal production industry.
Hydrogen sales have increased in the last decade, as a result of the stricter standards for fuel
quality which have enhanced the demand of hydrogen in refineries. On the other hand, the
number of hydrogen filling stations around the world have increased because of the high
application of hydrogen through fuel cells in vehicles [31].
Page 39
Hydrogen Production through Gasification and Dark Fermentation 39
World’s hydrogen demand in 2013 was around 255 billion cubic meters and it is expected that
the world consumption of this energy carrier will increase 3.5% annually through 2018. As a
result, a hydrogen demand of 300 billion cubic meters will be required to supply the world
hydrogen requirements. Given this overall outlook of hydrogen, new opportunities will be
created for the production of hydrogen from renewable resources. However, the scale of process
will be a key parameter in the economic profitability. Hydrogen can be produced in two ways:
(i) in large-scale centralized power plants or (ii) in small-scale generation plants [28]. The
selection of the proper production model depends first on the availability of the raw material
and the cost related to its purchase and transportation. In hydrogen production through Steam
Methane Reforming, the production cost of hydrogen is highly dependent on the natural gas
purchase cost, which is higher in small-scale plants than in large-scale plants. Same behavior is
considered in the partial oxidation of natural gas, where the hydrogen production cost is around
1.39 USD/kg. These two methods cannot be considered as a sustainable solutions for hydrogen
production into the long-term, because they are no zero emissions and highly dependent of
natural gas [31]. Coal gasification has a relative low hydrogen production cost in the range of
0.92 USD/kg; although, the energy efficiency is lower than other thermochemical methods and
the CO2 emissions are higher.
Fossil fuels depletion and thus, increase in the natural gas cost can be the decisive factor for
competitive and economic feasible production of hydrogen from biomass. Nevertheless, the
process scale is a constraint because of large plants require high amount of feedstock and the
seasonal availability of biomass cannot meet the feedstock requirements of this large facilities.
2.3 Final Remarks
Currently, the most important energy sources in the world are fossil fuels and thus, the
production of hydrogen through the conversion of natural gas, oil or coal is cost-effective.
Nevertheless, long-term and sustainable production of hydrogen, where the fossil fuels reserves
decrease and the cost of the oil derivatives increase, is no defined. Moreover, the use of biomass
can be considered as a promising source to produce sustainable hydrogen. On the other hand,
biomass, as energy source, has several constraints that must be overcome in order to produce
hydrogen efficiently and highly profitable. Availability, purchase costs, homogeneous
composition, transportation and logistics issues are some of the constraints to be considered.
Page 40
40 Hydrogen Production through Gasification and Dark Fermentation
Table 2-3. Description of the technologies used in the hydrogen production.
Technology Energy
Source
Energy
Source Price
[6] Products
Hydrogen cost
[5], [31], [41]
Energy
Efficiency
[28]
Advantages [37], [38] Disadvantages
Steam Methane
Reforming
(SMR)
Natural gas,
steam Natural gas
3-5 $/GJ
H2, CH4, CO,
CO2
0.75 $/kg H2
(without CO2
sequestration)
60 – 85%
Most developed
industrial process.
Lowest operation
temperature. Best
H2/CO ratio.
Highest GHG
emissions. Fossil fuel
dependence
Partial Oxidation Natural gas,
oil, steam
H2, CO, CO2,
N2, H2O(S), small
amount CH4
1.39 $/kg H2
(residual oil) 71 – 88.5%
Cost-effective, no
catalyst required
Low H2/CO, high
temperatures, require
pure O2
Coal gasification Coal
Coal
1-2 $/GJ
H2, CO, CO2,
H2O(S), CH4,
impurities
0.92 $/kg H2
(without CO2
sequestration)
60 – 67% Cost-effective Low quality H2, CO2
as by-product
Biomass
Gasification Biomass
Biomass
2-5 $/GJ
H2, CO, CO2,
H2O(S), N2 1.21-2.42 $/kg H2 40 – 50%
High gas energy
content. Use of
renewable raw
materials.
Varying H2 content.
Feedstock seasonal
availability.
Transportation and
logistics issues.
Dark
Fermentation Biomass
H2, CO2,
ethanol, organic
acids
R&D R&D
Use of variety of waste
streams. Simple reactor
design. Low Emissions.
Large amounts of
byproducts.
Feedstock seasonal
availability.
Alkaline Water
Electrolysis
Water,
electricity
Water
1.251 $/m3 H2 and O2
2.56-2.97 $/kg H2
(Nuclear source) 25 – 38%
No pollution, cheap
materials
High capital costs,
low system
efficiency, design
issues
Page 41
Hydrogen Production through Gasification and Dark Fermentation 41
3. Raw Material
In this thesis, two raw material were selected for the hydrogen production through gasification
and dark fermentation. Pinus Patula (PP) and Coffee Cut-stems (CCS) are raw materials from
different forest and agroindustrial supply chains in Colombia, respectively. There are different
parameters that encourage the use of these lignocellulosic residues in the production of
bioenergy. High availability, high energy yield and low purchase cost are some of the key
factors that were considered in this work in order to evaluate the hydrogen production from
Pinus Patula (PP) and Coffee Cut-Stems (CCS). A detailed description of the two raw material
is presented below considering six components: a general overview of the raw material in
Colombia, the description of the scenario that is going to be evaluated in the techno-economic
assessment (chapter 5), the location of the collection center, the biomass purchase price, the
analysis of the processing plant location and the freight cost associated to the transportation of
the raw material from the collection center to the processing plant.
3.1 Pinus Patula (PP)
PP is a tree native to the highlands of Mexico. It grows from 24° to 18° North latitude and 1800
to 2700 m above sea level (masl). It has been cultivated in higher altitudes in Colombia (3300
masl). PP is widely distributed in Colombia and has become a useful timber specie for
reforestation programs. Its main application is in the production of sawn wood and the residues
from the sawmilling are used directly as pulp in the production of Kraft paper.
Colombia is considered as a country suitable for forestry; it has approximately 60 million
hectares of natural forest with a deforestation rate of 280,000 Ha per year. Currently, native
forest represents the main source of wood and fibers for the communities and the local industry
accounting to 84.1%. The remaining 15.9% is divided between the forestry plantation (12.4%)
and wood importation (3.5%) [54]. This behavior is presented since recent governments have
Page 42
42 Hydrogen Production through Gasification and Dark Fermentation
not provided clear policies that encourage the sustainable use of natural forests in the country,
and due to the lack of enforcement of laws by the environmental authorities in both informal
and legal forest exploitation and commercialization of wood. Based on the previous statement, a
heterogeneous deterioration in the forest coverage of Colombia is evidenced.
In recent years, reforestation programs have helped to mitigate the demand of wood from native
forests. Colombia has a high potential to develop reforestation programs due to its excellent
weather, geographic and topographic conditions for tree growth, the geostrategic location for
foreign trade and the relative high number of signed free trade agreements [55]. Besides,
Colombia has identified 7.2 million hectares potentially suitable for commercial plantations
[55]. These areas cover different ecological regions from the tropics to the mountainous zones,
which offer a wide range of opportunities for different commercial species: those with high
productivity such as pines, with high-added value such as Teak and also industrial ones such as
the rubber [27]. However, the commercial silviculture in Colombia is under development.
According to the Agriculture and Rural Development Ministry (MADR), Colombia has 477,575
hectares of commercial plantations, which are lesser compared to other countries such as Brazil
(7.4 million hectares), Chile (2.4 million hectares) and Argentina (1.4 million hectares) [56].
Aiming to increase the amount of reforested areas, the Colombian government has created some
incentives for the cultivation of certain forest species (Alnus jorullensis, Bombacopsis quinata,
Cedrela odorata, Schizolobium parahibum, Tabebuia rosea, Eucalyptus grandis, Eucalyptus
globulus, Pinus patula, Gmelina arborea, among others). Resolution 711 of October 31, 1994
determined the forest species involved in the Forestry Incentive Certificate (CIF), which is a
direct contribution in cash, in recognition to positive activities in reforestation. The certificate
consists of a bonus cash of the commercial plantations cultivation costs with productive and
protective purposes. The bonus can mitigate 50% of the cultivation costs if the planted specie
comes from another country and 75% if a native species is planted [57].
The largest areas with forest plantations are located in the Atlantic Coast (Córdoba and
Magdalena Bajo), Andean Region (Antioquia, Cauca) and Orinoquía. The department with the
highest planted area is Antioquia (94,716 Ha), but Vichada has been increasing its share in
recent years (65,079 Ha) [55]. In Antioquia, there are also several wood processing companies
that in principle can be considered as a cluster. Aiming to meet the wood requirements of the
national market, it is highly important to determine the areas that may offer the greatest
physical, socioeconomic and environmental advantages in order to promote the wood
cultivation in a sustainable way. Within this context, the Agricultural Rural Planning Unit
(UPRA) developed a zonification tool to determine the suitable areas for the establishment of
commercial plantations [58]. The suitable area for forest plantations was divided in two
Page 43
Hydrogen Production through Gasification and Dark Fermentation 43
categories: the area with and without some type of determinant. Different zones have a legal or
technical determinant, since they require a complementary social, cultural and/or environmental
analysis to develop commercial forest plantations. Colombia has a total area of 114,174,800
hectares from which only 24,805,854 Ha are suitable for forest plantations. According to the
zonification tool, 56% of the suitable forest plantation areas in Colombia can be planted without
any determinant, and the remaining 44% requires a further complementary analysis [55].
From the 70 species tested in commercial plantations, Colombia uses mainly 12 species in
reforestation programs including: teak (Tectona grandis), melina (Gmelina arborea), acacia
mangium (Acacia mangium), pink eucalyptus (Eucalyptus grandis), eucalyptus (eucalyptus
tereticornis), ceiba (Bombacopsis quinata), oak (Tabebuia rosea), walnut (Cordia alliodora),
cypress (Cupressus lusitanica), Caribbean pine (Pinus caribaea), patula pine (Pinus patula),
pine tecunumanii (Pinus tecunumanii) and oocarpa pine (Pinus oocarpa). According to the
records of commercial plantations, approximately 73% of the planted area corresponds to
introduced species such as pines and eucalyptus; only 9% is planted with native species [59].
Table 3-1. Commercial forest species used in Colombia for reforestation programs.
Forest
Specie
Rotation
(years)
Density
(g cm-3)
Yield
(m3 ha-1 year-1) Location Reference
Eucalyptus
globulus 10 -15 0.7 15 - 20
Antioquia, Boyacá,
Caldas,
Cundinamarca
[60]
Pinus
Patula 30 0.43 27
Antioquia,
Cundinamarca,
Santanderes, Caldas
[61]
[62][63]
Tectona
grandis 25 - 28 0.53 7 - 13 Córdoba [64]
Forest resources can be analyzed considering the plantation yield and the lifespan of the crop.
The volumetric timber yield per unit area and time (m3 ha-1 year-1) is a measure of the
productivity of various tree species and, when used together with the rotation period of the crop,
is a decisive factor when selecting a lignocellulosic source as the most suitable to be used in a
production process [59]. In addition, the geographical distribution of timber resources has a
marked influence on the economy of processing lignocellulosic materials, since the transport of
biomass significantly increases the raw material costs [59]. Table 3-1 presents some
characteristics of commercial forest species commonly used in reforestation programs.
Colombia extracts annually 11 million cubic meters of wood from the natural forest, from which
60% are used as fuel and in the production of coal. The remaining 40% is destined to the
Page 44
44 Hydrogen Production through Gasification and Dark Fermentation
production of roundwood, which is used in the sawn wood, pulp and paper, panels and boards
industries. Figure 3-1 summarizes the main applications of the Pinus Patula in Colombia.
Figure 3-1. Main applications of roundwood in Colombia
3.1.1 Pinus Patula in the Andean region
- Scenario description
In order to evaluate the economic performance of the hydrogen production, three parameters
were assessed. Biomass availability, location of the collection center and the processing plant
were used as key parameters in the economic assessment of the gasification and dark
fermentation processes. The optimum size of a processing plant involves tradeoffs between
economies of scale with larger plants and increased costs of feedstock transportation [33]. Low
scale processes have high initial investment and operation costs, in contrast to high scale
processes; however, large plant sizes mean larger transportation distances for collecting
biomass. Carolan et al., [33] evaluated the effect of the process scale in the economic behavior
of the cellulosic bioethanol production biorefinery, and it was concluded that future
biorefineries are likely to be large facilities with capacities in the range of 5,000-10,000 ton per
day of biomass, if not larger. The costs of biomass as fuel was divided in two components: the
costs associated with the purchase of biomass in the collection centers and the transportation
logistics costs (freight costs). Transportation costs in Colombia are very high due to the
heterogeneous geography and the high diesel price. The transportation logistics can be a
decisive criteria when assessing the economic viability of the project. Aiming to evaluate the
biomass cost on the profitability of the proposed scenarios in the simulation procedure (see,
Section 4.6.3), a location-based problem was proposed, from which three locations or
departments were selected as collection centers, considering as main criteria the high
availability. Based on the data reported in Table 3-1, Antioquia, Caldas and Cundinamarca
were selected as the most important biomass collection centers in the Andean region. The
Roundwood
Industrial Roundwood
SawnwoodPulp and
PaperPlywood
Veneers
Panels and Boards
Others
Wood for fuel and carbon
Page 45
Hydrogen Production through Gasification and Dark Fermentation 45
processing plant was located considering, between these three locations, the department that has
the lowest biomass purchase and transportation costs, and also the highest biomass availability.
The collection logistics is one of the most important issues that affects the implementation of
these biomass-based processes. Due to the heterogeneous distribution of the PP in the
geography of each department, the collection of the raw material may be regarded as a
bottleneck of the production process. According to this, the amount of raw material that can be
collected and used in the processing plant is limited. In this study, it is considered that fractions
above 50% of the total PP production in each department cannot be used as raw material in the
processing plant, because of the collection logistic issues.
- Collection center location
PP is widely distributed in Colombia; however, there are some departments that have a high
forestry potential because of the climate conditions or geography, which favors the pine
cultivation. According to the National Research Corporation and Forestry Development
(CONIF), Antioquia, Caldas and Cundinamarca have the highest PP cultivated area in the
Andean region, since these areas are destined to reforestation programs in Colombia [63], [65].
Antioquia (6°13′00″N 75°34′00″O) is a department located in the northwest of Colombia and
has a reforestation area of 94,716 Ha. Caldas (5°06′N 75°33′O) is located in the center region of
Colombia and possess a reforestation area of 21,079 Ha. Finally, Cundinamarca (4°36′00″N
74°05′00″O) is located also in the center region and has a reforestation area of 33,490 Ha. The
geography and cultivation techniques are different from one department to another, for this
reason, the yield of PP changes and thus, affecting the productivity of the crop. The main
application of the PP is the production of sawn wood, which is used directly in the furniture
industry. After the activities that involve the transformation of the roundwood in sawn wood,
plywood, among others, approximately 30% of this wood remains as residue [27]. These
residues still have a great potential to be used for bioenergy production. Table 3-2 presents a
general overlook of the availability of PP in the three departments.
- Raw Material Cost
Biomass cost is related to the production costs of PP, which involves different stages: seedling
plantation, agrochemical application, ground preparation, pruning, cutting, debarking and the
transportation to the collection center. The PP cost varies from one department to another,
depending on the geography of the zone, the silviculture practices (applied agrochemicals,
diesel consumption in the machinery, among others) and the soil fertility. The wood price in
Colombia is calculated based on the growing zone, the specie and the wood denomination (pulp
wood, splintered wood, roundwood) [27], [66]. In this thesis, the PP price involves the
transformation cost of the tree in roundwood for the three evaluated departments. It was also
Page 46
46 Hydrogen Production through Gasification and Dark Fermentation
considered that the purchase price of the residues, from different PP applications, corresponds to
3% of the roundwood production cost. Table 3-3 presents the production cost of roundwood
and its residues from PP plantations.
Table 3-2. Production of PP and its residues in three departments in Colombia
Department PP Cultivated
Area (Ha)a
PP Yield
(𝐦𝟑𝐇𝐚−𝟏𝐲𝐞𝐚𝐫−𝟏)b
PP Productivity
(ton/year)
Residues
(ton/year)
Antioquia 94,716 20 852,444 102,293
Caldas 21,079 17 161,254 19,350
Cundinamarca 33,490 19.3 290,860 34,903
a Data taken from the Ministerio de Agricultura y Desarrollo Rural [66].
b Data taken from the National Research Corporation and Forestry Development (CONIF) [63],
[65].
Table 3-3. Production cost of PP and its residues in the three collection centers in Colombia
Location of the collection
center
PP cost
(USD/ton)a
Residues
(USD/ton)
Antioquia 348.2 10.4
Caldas 237.0 7.1
Cundinamarca 407.4 12.2
a Data taken from the Ministerio de Agricultura y Desarrollo Rural [66]
- Processing Plant Location
The processing plant location was selected from the three evaluated departments, considering
that the department with the lowest biomass purchase and transportation cost will be the suitable
location of the hydrogen production plant. The capital cities of each department were selected as
the collection center and processing plant locations, assuming that all raw material from the
department is collected in the capital city. In this study, the supply chain of the raw material
across the department was not considered since this analysis involves an optimization problem
that must be considered in further works. The transportation cost of the raw material from the
collection center to the processing plant was calculated based on the freight cost between the
main cities of each department. The freight cost was determined based on the distance between
the main cities and the consumption of diesel of a CS-truck, which is normally used to transport
wood in Colombia. Table 3-4 presents the freight cost between the cities per ton of raw
material.
Page 47
Hydrogen Production through Gasification and Dark Fermentation 47
Table 3-4. Freight cost between the collection center and the processing plant
Collection Center Processing Plant
Location
Freight Cost
(USD/ton)a
Medellin (Antioquia) Manizales 7.29
Bogotá D.C (Cundinamarca) Medellin 13.74
Manizales (Caldas) Bogotá D.C 10.61
a Data taken from the Information System for the Regulation of Road Freight Transport [67].
3.2 Coffee Cut-Stems (CCS)
Coffee is the second most traded commodity in the world after petroleum, which has a
significant importance to the global economy [68]. Most consumption takes place in
industrialized countries, while over 90% of coffee is produced in developing countries [69].
Colombia is the fourth largest coffee producer in the world after Brazil, Vietnam and Indonesia
[70]. The coffee cultivation and exportation are managed by the Federación Nacional de
Cafeteros (FNC; National Coffee Growers Federation). The federation sponsors farmers in the
coffee-growing zones through extensive social and economic aid programs [69]. The produced
coffee in Colombia is the Arabica, which is originated from the particular combination of
diverse factors: the latitude and altitude of Colombia’s coffee growing zones, its soils, the
botanical origin of the species, and the varieties of produced coffees, the climate and rain
pattern [71].
The Arabica coffee produced in Colombia needs specific climatic conditions for its production.
The ideal conditions for the cultivation of this specie are found between 1,200 m (4,000 ft) and
1,800 m (6,000 ft) above sea level, with temperatures between 17 and 23 °C (62 and 75 °F), and
with precipitation close to 2,000 mm (78 in.) per year, evenly distributed throughout the year
[69]. The specific geographic location of each Colombian coffee growing region determines its
particular conditions of water availability, temperature, solar radiation, and wind regime for
coffee cultivation [72]. Most Colombian coffee growing areas are located in the departments of
Antioquia, Boyacá, Caldas, Cauca, Cesar, Caquetá, Casanare, Cundinamarca, Guajira, Huila,
Magdalena, Meta, Nariño, Norte de Santander, Quindío, Risaralda, Santander, Tolima, and
Valle.
According to the FNC [69], the green coffee production in Colombia was 9.9 million of bags
(60 kg-bag) in 2013. In the coffee process is estimated that less than 5% of the generated
biomass is used in the production of the beverage and the remaining fraction represents
Page 48
48 Hydrogen Production through Gasification and Dark Fermentation
lignocellulosic material such as leaves, branches and stems, which are generated from the
renovation of coffee plantations.
In the coffee cultivation, the “zoqueo” process is highly recommended for a good and constant
production of coffee [73]. The “zoqueo” process involves cutting the main coffee stem at a
height between 20 and 30 cm above the ground, inducing the growth of new stems that replace
the cut stem [74]. It is estimated that in Colombia, the renovation of coffee plantations should
be done in the fifth or sixth year of the plantation. This activity produces a considerable
increment in low-productive coffee crops, besides it is more profitable than a new plantation
[75], [76]. The residues obtained from the “zoqueo” process are called Coffee Cut-Stems (CCS)
and can be considered as a potential energy source, but also as a substitute for the wood used in
the manufacture of chipboard, veneers, among others [77].
In coffee-producing countries such as Colombia, coffee tree wood as waste is abundant, either
from cuts or renovations, because between 80,000 and 90,000 coffee hectares are renovated per
year, from which on average 17 tonnes of dry wood per hectare can be obtained. These residues
would serve to produce, approximately, 690 GWe every year [78]. Currently, most of the forest
residues are used directly in combustion processes for cooking and heating in rural areas.
According to Roa et al., [79], CCS have a higher calorific value (19.75 MJ/kg) than other by-
products of the coffee process such as the coffee pulp (15.88 MJ/kg) and coffee dust (17.90
MJ/kg). This residue is normally used in the mechanical drying of the coffee grain with a
consumption of 4 kg of CCS to dry 12.5 kg of dry coffee grain [80]. However, the energy
content of these residues is no properly used and the direct emissions related to the combustion
processes are relative high. For this reason, different thermochemical and biochemical methods
have been tested for the transformation of these residues in bioenergy and/or biochemical
products. Bioethanol, furfural, octane, nonane, HMF and synthesis gas are some of the products
that can be obtained from CCS as raw material [81], [82].
3.2.1 Coffee Cut-Stems in the Andean Region
- Scenario description
The same methodology proposed in section 3.1.1 was used for the location-based problem of
the CCS in the Andean region. For this purpose, three departments were selected, based on the
coffee cultivated area, as the CCS collection centers: Caldas, Antioquia and Huila. The
processing plant location was selected considering as main parameters the biomass purchase and
transportation costs, and also the CCS availability. The transportation logistics of the CCS may
be coupled to the coffee supply chain; therefore, the recollection and transportation of CCS can
be done immediately after the coffee recollection in the farms and subsequently, they can be
Page 49
Hydrogen Production through Gasification and Dark Fermentation 49
transported to the collection centers. The CCS recollection process can be done by the farmers
and in order to encourage its collection, an economic incentive to these residues can be added.
The biomass availability is one of the drawbacks of the use of CCS as raw material, since the
residue is harvested every 5 or 6 years and thus, the raw material supply is limited This behavior
compromises a stable productivity and consequently, the economic profitability of the process.
The heterogeneous distribution of coffee farms throughout the geography of the selected
departments implies that the total CCS production would not be available for the processing
plant. Based on this, it was assumed that fractions above 50% of the total CCS production in
each department cannot be considered as feedstock for the processing plant because of the
logistics issues.
- Collection center location
According to the FNC, the departments with the highest cultivated coffee area are: Antioquia,
Huila and Caldas due to its climate, soil and geographical conditions. Huila (2°59′55″N
75°18′16″O) is located in the southwest of Colombia and has a coffee cultivated area of 154,980
Ha. Antioquia (6°13′00″N 75°34′00″O) is located in the northwest of Colombia and has a coffee
cultivated area of 130,990 Ha. Finally, Caldas (5°06′N 75°33′O) is located in the center region
of Colombia and possess a coffee cultivated area of 74,530 Ha. The amount of CCS that is
produced in these departments was calculated based on the following assumptions:
The cherry coffee is the grain that is harvested from the coffee tree and it is used as
raw material in the coffee processing process. The “pergamino” coffee is the
product obtained at the end of the coffee production process. In order to evaluate
the amount of cherry coffee that is required to produced 1 kilogram of “pergamino”
coffee, the Centro Nacional de Investigación de Café (CENICAFÉ) determined the
conversion factors between different coffee grain status [83]. Based on the reported
data, 4.92 kilogram of cherry coffee are required to produce 1 kilogram of
“pergamino” coffee.
Based on the Departamento Administrativo Nacional de Estadísticas (DANE), the
productivity of “pergamino” coffee in each department varies depending on the
geography and cultivation techniques. Table 3-5 summarizes some information
about the production of “pergamino” and cherry coffee, and CCS in the selected
departments.
According to the Federación Nacional de Cafeteros (FNC), an average of 0.6
kilogram of CCS are obtained per kilogram of processed cherry coffee [84].
Page 50
50 Hydrogen Production through Gasification and Dark Fermentation
Since the CCS is harvested every 5 to 6 years, the amount of CCS that is produced
from the coffee plantations was divided by 5.
Table 3-5. Production of “pergamino” and cherry coffee and its relation with the CCS
production.
Department
Coffee
Plantations
(Ha)a
“Pergamino”
Coffee Yield
(Ton/Ha)b
Cherry Coffee
Production
(Ton)
CCS
Productivity
(Ton/year)
Huila 154,980 1.2 914,072 109,688
Antioquia 130,990 1.1 708,197 84,983
Caldas 74,530 1.2 439,577 52,749
a Data taken from the economic profile of each department according to the Ministerio de
Comercio, Industria y Turismo [85]–[87]
b Data taken from the National Agricultural Census [88]
- Raw material cost
The calculation of the CCS purchase cost was performed based on three parameters: the
international “pergamino” coffee price, the mass ratio between the “pergamino” and cherry
coffee production, and the CCS productivity from the cherry coffee (0.6 kg CCS per kg cherry
coffee). According to the FNC, the international price of the “pergamino” coffee, in the first
semester of 2016, in the three selected departments had a similar trend with small variations as
observed in Table 3-6. It was assumed that the contribution of the “pergamino” coffee price to
the CCS price was approximately 5%. Due to this small variations in the “pergamino” coffee
price, it can be evidenced that the CCS purchase price may not have a significant effect on the
selection of the suitable collection center location and therefore, the decision criteria in the
selection of the processing plant location will be the transportation cost.
Table 3-6. Raw material purchase cost in the three selected departments
Department “Pergamino” Coffee Price
(USD/ton)a
CCS price
(USD/ton)
Huila 2,130 23.86
Antioquia 2,132.3 23.88
Caldas 2,134.3 23.84
a Data taken from the Federación Nacional de Cafeteros (FNC) [89]
Page 51
Hydrogen Production through Gasification and Dark Fermentation 51
- Processing Plant location
As mentioned before in section 3.1.1 for the PP case, the processing plant location was
evaluated based on the department with the lowest biomass purchase and transportation cost.
Nevertheless, the biomass purchase cost has no significant variation between the selected
departments, as mentioned before. The transportation cost was calculated based on the freight
cost between the main cities of the departments. Table 3-7 presents the freight cost between the
main cities per ton of raw material.
Table 3-7. Freight cost between the collection center and the processing plant
Collection Center Processing Plant
Location
Freight Cost
(USD/ton)a
Neiva (Huila) Medellín 25.81
Medellín (Antioquia) Manizales 11.30
Manizales (Caldas) Neiva 21.28
a Data taken from the Information System for the Regulation of Road Freight Transport [67]
3.3 Final Remarks
The process scale assessment based on the raw material availability and therefore, its purchase
cost and transportation logistic issues, can provide a general overlook of the advantages and
limitations for the implementation of different process schemes for the hydrogen production.
The relation between the raw material supply chain and the production process can be used to
evaluate the economic performance of the hydrogen production. It is noteworthy that some
parameters such as the seasonal availability, recollection and physicochemical characteristics of
the raw material have great influence in the future implementation of bioenergy productive
schemes. The aim of this preliminary analysis of the supply chain of the selected raw material
was intended to provide some guidelines for the evaluation of the hydrogen production through
thermochemical and biochemical technologies, considering the raw material supply as a key
criteria for the techno-economic assessment of different process schemes.
Page 52
52 Hydrogen Production through Gasification and Dark Fermentation
4. Methodology
In this chapter, a brief description of the experimental and modeling procedure used in this
thesis is presented. The experimental procedure comprises the characterization of the raw
material, pilot-scale gasification and laboratory-scale dark fermentation. Subsequently, in the
simulation procedure, different scenarios for hydrogen production under stand-alone and
biorefineries pathways are described. Finally, the guidelines in order to analyze the processes
from the economic, energy and environmental point of view are presented.
4.1 Experimental Procedure
4.1.1 Raw Material Characterization
The physicochemical characterization of the raw material involves the determination of the
chemical composition, proximate, and elemental analysis and the calorific value. The chemical
composition of the biomass comprises the determination of the cellulose, hemicellulose, lignin,
extractives and ash content. On the other hand, proximate analysis breaks down the biomass in
volatile matter, fixed carbon or char and ash. Subsequently, elemental analysis presents directly
the constitutive elements in the organic part of biomass. Finally, the calorific value of the
biomass gives an insight of the amount of energy that can release this material if it is submitted
directly to a combustion process. A detailed description of the experimental procedure for the
biomass characterization is summarized below.
- Chemical composition
Plants are composed mainly by water; however on dry basis, the plant cells consist of sugar-
based polymers (carbohydrates), lignin and lesser amounts of extractives, starch and inorganics.
These chemical components are distributed throughout the cell wall. There are different
parameters that affect the chemical composition of the plant such as the type of plant, the part of
the plant that is analyzed, the geographical location, age, climate and soil conditions, among
Page 53
Hydrogen Production through Gasification and Dark Fermentation 53
others [90]. The following procedures describe the methods used in the determination of
extractives, holocellulose (cellulose + hemicellulose), lignin and ash content.
- Sample Preparation
Samples should be dried and milled before they can be used in further determinations. Prior to
the milling process, raw materials were placed on a horizontal table and were exposed directly
to the sun for two to three days until a moisture content < 10% was reached. The moisture
content of the raw material was measured in a Shimadzu moisture balance MOC - 120H.
Subsequently, samples were ground to pass 40 mesh (0.04 mm) using a gyratory mill (SR200
Gusseisen, Retsch GmbH, Germany) based on the procedure reported by Hames et al., [91].
- Extractives Determination
Extractives are a group of chemicals mainly composed of fats, fatty acids, fatty alcohols,
phenols, terpenes, steroids, resin acids, rosin, waxes, etc. These chemicals exist as monomers,
dimers, and polymers. They derive their name as chemicals that are removed by one of several
extraction procedures
The extractives content was measured based on the experimental procedure proposed by
National Renewable Energy Laboratories (NREL/TP-510-42619) [92]. Ethanol and water were
selected as solvents for this procedure. First, 10 grams of raw material were weighed and added
into a tared extraction thimble. Then, the thimble was placed on the Soxhlet syphon tube
considering that the thimble must not exceed the Soxhlet syphon height. Subsequently, 250mL
of distilled water were added to the tared receiving flask with several boiling chips to prevent
bumping. The heating mantles were adjusted to provide a minimum of 4-5 siphon cycles per
hour. After 24 hours of extraction, the thimble with the raw material was placed in an oven
overnight at temperature not exceeding 45°C. The dried thimble were removed from the oven
and transfer to a desiccator for one hour and the weight was recorded. The same procedure in
the case of ethanol as solvent was performed.
- Holocellulose Determination
Most of the plants are composed mainly of cellulose and hemicellulose polymers with minor
amounts of other sugar polymers such as starch. The combination of cellulose and the
hemicelluloses are called holocellulose and usually accounts for 65–70 percent of the plant dry
weight [90].
Holocellulose content determination was based on the chlorination method reported by the
ASTM Standards (D-1104). Free-extractives sample (2.5 g) was added to a 250ml Erlenmeyer
flask with water (80 ml), acetic acid (0.5 ml) and sodium chlorite (1 g). It is highly
recommended to put an erlenmeyer flask (100 ml) inverted in the neck of the reaction flask to
Page 54
54 Hydrogen Production through Gasification and Dark Fermentation
avoid the release of gases from the chlorination reaction. The mixture was stirred and placed in
a water bath at 70°C for 6 hours. After the first hour, acetic acid (0.5 ml) and sodium chloride (1
g) were added. Subsequently, the same amounts of acetic acid and sodium chloride were added
until the reaction time (6 hours) was reached. The sample was left without further addition of
acetic acid and sodium chloride in the water bath overnight. At the end of 24 hours of reaction,
the holocellulose was filtered on a filter paper using a Buchner funnel until the yellow color and
the odor of chlorine dioxide was removed. Afterwards, the filter was placed in a porcelain tray
in the oven at 105° for 24 hours. The dried sample was transferred to a desiccator for 1 hour and
weighed.
- Cellulose Determination
Cellulose is the most abundant organic chemical on the face of the earth. On a dry weight basis,
most plants consist of approximately 45-50% cellulose. The preparation of cellulose is a
continuous procedure of holocelluose determination in pursuit of the ultimately pure form of
fiber based on the procedure reported by Hames et al., [91].
Free-extractives holocellulose (2 g) was added to a 250 ml beaker with a glass cover. Then, 25
ml of a NaOH solution (17.5%v/v) was prepared and maintained at 20°C. Afterwards, 10 ml of
17.5% NaOH solution was added to the holocellulose in the 250 ml beaker and with a glass rod,
the sample and NaOH solution, were completely mixed. At 5 minute intervals, 5 ml of NaOH
solutions was added and then, the mixture was placed in a water bath at 20°C for 30 min.
Subsequently, 33 ml of water were added, the mixture was thoroughly stirred and maintained at
20°C for 1 h before filtering. The holocellulose was transferred to the filter paper and then
washed with 100 ml of 8.3% NaOH solution. Additionally, the cellulose was subjected to an
acid treatment using 10% acetic acid solution. The acid solution was poured in the filter and was
left for 3 min without suction. In order to reduce the amount of acid in the cellulose, the sample
was washed with water at 20°C until the acid concentration was completely drained. Finally, the
filter paper and the cellulose was removed from the filter and were placed in an oven at 105°C
overnight. At the end of the 24 h, the cellulose was transferred to the desiccator for 1 h and then,
weighed.
- Hemicellulose Determination
In general, the hemicellulose fraction of plants consists of a collection of polysaccharide
polymers. On biomass, the hemicellulose corresponds to approximately 25-30%, on dry basis.
This percentage can change depending of the biomass source, climate, and soil conditions,
among others. The hemicellulose content was calculated from the subtraction between the
holocellulose and cellulose content.
Page 55
Hydrogen Production through Gasification and Dark Fermentation 55
- Lignin Determination
Lignins are amorphous, highly complex, mainly aromatic polymers of phenyl-propane units.
The function of lignin in plants is as an encrusting agent in the cellulose/hemicellulose matrix.
The procedure for the lignin content determination was based on a modified version of the
TAPPI T222 acid-insoluble lignin in wood and pulp [91], [93]. Free-extractives and –moisture
sample was required. Approximately 200 mg of dried sample was added into a 100 mL
centrifuge tube. Then, 1 ml of 72% (w/w) H2SO4 per each 100 mg of sample was poured. The
sample and acid were completely mixed and were placed in a water bath at 30°C for 1 h.
Subsequently, the acid concentration was reduced adding 56 ml of water. The mixture was
autoclaved at 121°C, 15 psia for 1 h before filtering. The residue in the filter paper was washed
with hot water until the sulfuric acid concentration was reduced. Then, the filter paper and the
lignin were placed in an oven at 105°C overnight. Finally, the lignin was transferred into a
desiccator and weighed.
- Ash Determination
Ash content is an approximate measure of the mineral salts and other inorganic matter in the
fiber after combustion at a temperature of 575 ± 25°C. The inorganic content can be quite high
in plants containing large amounts of silica.
The ash content was determined according to the experimental procedure proposed by National
Renewable Energy Laboratories (NREL/TP-510-42622). A sample of 0.5g was added into a
crucible and the weight was recorded. The sample was placed in a furnace with a temperature
ramp program as indicate below: Ramp from room temperature to 105°C. Hold at 105°C for 12
minutes. Ramp to 250°C at 10°C per minute. Hold at 250°C for 30 minutes. Ramp to 575°C at
20°C per minute. Hold at 575°C for 180 minutes. Allow temperature to drop to 105°C. Hold at
105°C until samples are removed. After ignition, the crucible was carefully removed from the
furnace and was placed directly into a desiccator. When cooled to room temperature, the weight
was recorded on the analytical balance.
4.1.2 Proximate analysis
When considering biomass thermal conversion, proximate analysis is one of the most important
characterization methods. This method involves the determination of moisture, ash, volatile
matter and fixed carbon content of the raw material. These components affect both the
combustion behavior and the plant design. In that way, high moisture values decrease the
combustion yield, while high volatile matter/fixed carbon ratios increase the fuel reactivity [94].
Page 56
56 Hydrogen Production through Gasification and Dark Fermentation
A detailed description of the procedure involve in the determination of the volatile matter, fixed
carbon and ash content is presented below.
- Volatile Matter Determination
Volatile matter refers to the components of biomass, except for moisture, which are liberated at
high temperature in the absence of air. The volatile matter determination was based on the
standard method proposed by the American Society of Testing and Materials (ASTM D3175-
11) [95].
A sample (1 g) was added into a previously weighed platinum crucible and then, it was placed
in a furnace at 950°C for 7 min. It is highly important to cover the crucible with the platinum
cap in order to avoid that the carbon deposit burn away. After heating for exactly 7 min, the
crucible was removed from the furnace and without disturbing the cover, it was allowed to cool.
Weighed as soon as cold. The percentage loss of weight minus the percentage moisture equals
the volatile matter.
- Fixed Carbon Determination
The fixed carbon content is the carbon found in the material which is left after volatile materials
are driven off. Fixed carbon is used as an estimate of the amount of char that will be yielded
from a biomass sample. The fixed carbon can be calculated from the subtraction between the
volatile matter, the moisture and the ash content of the biomass [96]. Ash content was
determined considering the same procedure in section 4.1.1.
4.1.3 Elemental analysis
Elemental analysis or ultimate analysis is the second typical way (after proximate analysis) to
represent the components in the organic part of fuels. Elemental analysis includes the
identification and quantification of elements in a sample, determination of the elemental
composition and trace level elements. The main identified elements in this analysis are the
carbon, hydrogen, oxygen and nitrogen or almost always refer to CHON. From this analysis,
secondary elements can be quantified such as sulphur, chlorine, among others. A detailed
description of the procedure used in the determination of the elemental analysis is presented
below.
- Carbon, hydrogen and nitrogen determination
The quantification of the elemental composition of the raw material was performed in the
University of Alicante in a CHNS elemental microanalyzer with Micro detection system
TruSpec (LECO, USA). The equipment uses a combination of continuous carrier gas flow,
infrared and thermal conductivity detectors giving simultaneous detection of CHNS in less than
Page 57
Hydrogen Production through Gasification and Dark Fermentation 57
four minutes. Before the determination, the samples should be ground to a uniform consistency.
Subsequently, 0.15 g of biomass sample was weighed into a 502-186 Tin Foil Cup and then, the
sample was placed in the equipment and proceed with the analysis.
- Heat of Combustion
The heat of combustion is the total energy release when a substance, biomass, coal, among
others, undergoes complete combustion with oxygen under standard conditions. This energy
value is characteristic for each substance. The units of the heat of combustion are energy per
unit of mass or mole such as kJ/kg or kJ/mol. The heating value is commonly determined by the
use of a bomb calorimeter. A detailed description of the equipment and the procedure used in
the determination of the heat of combustion is summarized below.
The determination of the calorific value was based on the American Society for Testing and
Materials (ASTM D-5468). The procedure was developed in the University of Alicante using a
bomb calorimeter (IKA Werke model C5003, Brazil) with a measuring cell controller and a
refrigeration system. About 1 g of the solid sample was weighed in a crucible, which was
introduced into a stainless steel container. The decomposition vessel or bomb was filled with
oxygen (30 bar) (Quality 3.5: Technical oxygen 99.95%). The sample was ignited (e.g. a cotton
thread attached to a solid ignition wire) within the decomposition vessel and it was burned.
During the combustion process, the central temperature in the furnace may rise to 1000 ° C, and
the pressure also increases. Under these conditions, all the organic materials were burned and
oxidized. The generated heat during the combustion process was measured using the adiabatic
measuring method.
An approach to the calculation of elemental analysis and calorific value of the raw material is
presented in Annex A. The calculation is based on data reported in literature for a variety of
feedstock and the experimental determination of proximate analysis. This approach is proposed
as an alternative to the experimental methods to estimate the heating value and the elemental
analysis, which are time consuming as well as expensive and have higher possibilities of
experimental errors [97]–[99].
4.2 Pilot-Scale Gasification
Gasification consists in the transformation of carbonaceous material (i,e. lignocellulosic
biomass) into synthesis gas with high content of hydrogen, carbon monoxide, carbon dioxide
and methane using air as gasifying agent. The experimental gasification procedure of PP and
CCS involved four stages: (i) feedstock pretreatment, (ii) biomass gasification, (iii) syngas
purification and (iv) electricity generation. Particle size and moisture content are the key
Page 58
58 Hydrogen Production through Gasification and Dark Fermentation
parameters in the pretreatment stage due to their effect on the hydrogen content and,
consequently in the gasification performance. Zainal et al., [100] evaluated the effect of the
biomass moisture content in the hydrogen composition and calorific value of the generated
syngas in a downdraft gasifier. High moisture content increases hydrogen production, but the
calorific value of the syngas decreases because of the high energy requirements to evaporate the
water and thus, promoting exothermic reactions, which produce CO2 and H2O. Small particles
have larger surface area and therefore, faster heating rate affecting the product gas composition
[43]. Particle size between 0.5-1 cm and a moisture content < 20% were selected based on
literature reports and the requirements of the pilot-scale gasifier. Woody residues were acquired
chipped from the distributor and they were exposed directly to the sun on a horizontal table for
3 days until a moisture content between 10 – 20% was reached. For each gasification procedure,
12 kg of raw material were fed in the gasifier.
The gasification equipment used in the pilot-scale gasification was a 10 kW Power Pallet (All
Power Labs, California, USA) integrated with a combustion engine and a generator. Figure 4-1
presents a schematic process flowsheet of the pilot-scale gasifier used in the experimental
procedure. The process starts with the supply of biomass into the hopper. Then, the feedstock
passes through an auger and enters into the gasifier reactor. The auger is controlled by a level
switch incorporated into the reactor. Biomass fills the reactor and undergoes in the gasification
stages: pyrolysis, combustion and reduction. The gasifier uses air as gasifying agent; therefore,
the high temperature syngas (750 – 850°C) that is generated in the reactor, heats up the air flow
before it enters into the combustion stage. Ash is produced as main by-products from the
gasification stages. Ashes are collected through a vibratory grater which separates the ashes
from the carbonized biomass (char). Subsequently, the hot syngas passes through a cyclone to
separate the remaining ashes and char particles. After the cyclone, the syngas still has enough
energy as heat to be used. For this reason, the syngas uses its high heating energy to remove part
of the moisture in the biomass that is fed through the auger. The generated gas has some
impurities such as tars, water and char particles that must be removed to avoid damage of the
gas engine. In this sense, the gas passes through a four-level filter in order to remove these
impurities. The first level of the filter contains big pieces of wood (average particle size of 5-10
cm), the second level has smaller pieces of wood (3-5 cm), the third level is filled with shavings
from the furniture industry, and the last level consists of a foam filter. During the gasification
procedures, the composition of the synthesis gas was monitored using a portable gas analyzer
(GASBOARD 3100p, Wuhan, China). The gas analyzer measures the outlet gas composition in
terms of hydrogen, carbon dioxide, carbon monoxide, methane, oxygen content and
additionally, it calculates the calorific value of the syngas. Finally, the purified syngas is
submitted to a gas engine which uses it as fuel to generate electricity. The generator has an
Page 59
Hydrogen Production through Gasification and Dark Fermentation 59
electrical capacity between 2 – 10 kW. An overall balance of the process indicates that 1 kg of
biomass can produce 0.75 kWh of electricity, which can be used to turn on approximately 50
energy saving bulbs of 15 watts for 1 hour [101].
Figure 4-1. Process flowsheet of the pilot-scale gasifier in the 10 kW Power Pallet.
In order to determine the overall mass balance of the gasifier, the initial amount of biomass and
the unreacted feedstock from the gasification procedure were measured. Ash and the remaining
char were also measured. The amount of wood that was converted into synthesis gas was
determined by the subtraction of the initial biomass with the final char and ash content. The
amount of produced syngas was determined based on the stoichiometry of the gasification
reaction as follows.
Stoichiometrical ratio (SR) is a characteristic parameter of the fuels that is determined by the
complete combustion of the raw material to fuel. Zhu et al., [102] presented different
correlations to calculate the SR based on the high heating value (HHV) of the raw material. It is
also presented the SR values for different raw materials such as liquid fuels, coal and biomass.
Based on the reported data, hardwood and softwood have an average SR of 6.1 kg air per kg
biomass. This means that 1 kg of hardwood and/or softwood needs 6.1 kg of air for complete
combustion. Based on this statement, the combustion stoichiometry of wood materials is
described by the following equation (Eq. 4-1).
1.0 𝑘𝑔 𝑤𝑜𝑜𝑑 + 6.1 𝑘𝑔 𝑎𝑖𝑟 → 7.1 𝑘𝑔 𝑓𝑙𝑢𝑒 𝑔𝑎𝑠 (4-1)
Where “flue gas” consists mainly of H2O, CO2 and N2. Normally, the gasification procedure is
carried out at a nominal 0.25 ER (equivalence ratio) and thus, the amount of air that is used in
the gasification reaction is calculated from the relation between the equivalence ratio and the
amount of air from the complete combustion (e.g. 0.25 × 6.1 = 1.5 𝑘𝑔 𝑜𝑓 𝑎𝑖𝑟). In gasification,
the combustion reaction is basically divided in two steps as shown in the following equations
Page 60
60 Hydrogen Production through Gasification and Dark Fermentation
(Eq. 4-2 and 4-3). The first reaction (Eq. 4-2) describes the gasification, where a
stoichiometrical amount of air is supplied to the process to obtained syngas.
1.0 𝑘𝑔 𝑤𝑜𝑜𝑑 + 1.5 𝑘𝑔 𝑎𝑖𝑟 → 2.5 𝑘𝑔 𝑠𝑦𝑛𝑔𝑎𝑠 (4-2)
To burn the synthesis gas, an additional 4.9 kg of air must be added.
2.5 𝑘𝑔 𝑠𝑦𝑛𝑔𝑎𝑠 + 4.6 𝑘𝑔 𝑎𝑖𝑟 → 7.1 𝑘𝑔 𝑓𝑙𝑢𝑒 𝑔𝑎𝑠 (4-3)
Note that overall mass balance is exactly the same as in the case of the combustion reaction.
Based on the gasification stoichiometry, the synthesis gas flux and yield of the gasification
procedure was calculated.
4.3 Effect of CaO in the biomass gasification
Among the gasifying agents used in the production of hydrogen through biomass gasification,
air produces the lowest hydrogen content. Nevertheless, air gasification is the most suitable
technology for the production of bioenergy in small scale processes and Non-Interconnected
Zones (NIZ). This technology has a relative medium maturity, the gasifying agent must not be
produced in situ (i.e. steam) and it does not involve a purchase cost in comparison to oxygen in
some gasification procedures in which it is used pure or as a mixture with steam. Low hydrogen
content in the air gasification makes the process economically infeasible, when considering for
hydrogen production and purification. In order to increase the hydrogen content in the syngas,
the use of an adsorbent is proposed as an alternative to enhance the hydrogen selectivity and
thus, the feasibility of the process. Several authors have studied the effect of catalyst/adsorbents
on the behavior of the syngas composition in the biomass gasification using different gasifying
agents. CaO, nickel and iron are some of the catalyst/adsorbents more used in the gasification
procedures due to their strong influence in the tar decomposition and synthesis gas composition
[103]–[105]. The use of calcium oxide (CaO) dually acknowledged as a tar reforming catalyst
and a CO2 sorbent has currently gained lots of attention due to its cheapness and abundance
[106]. Jordan et al., [103] evaluated the behavior of the syngas composition and tar destruction
using different concentration of CaO in an air-blown downdraft gasifier. The synthesis gas
composition and tar degradation were evaluated using different concentrations of CaO (2, 4 and
6%wt.). The hydrogen content increased 35% when the gasification with 6%wt. CaO was
carried out in comparison to the gasification without adsorbent. Hydrogen content in the syngas
was increased due to the tar cracking catalyzed by the CaO. In this thesis, CaO was proposed as
adsorbent aiming to evaluate the behavior of the syngas composition in the pilot-scale 10kW
Power Pallet.
Page 61
Hydrogen Production through Gasification and Dark Fermentation 61
Quicklime (Calcium Oxide) was acquired from a local distributor (Pintucales, Manizales,
Caldas) with the chemical characterization presented in Table 4-1. Prior to the gasification
procedure, the quicklime was crushed with a hammer until a particle size between 0.5 – 1 cm
was obtained. Subsequently, the quicklime was calcined in a muffle oven at 900°C for 3 hours
and then, gradually cooled down with nitrogen gas to avoid a carbonation reaction of the
calcined quicklime [106]. Calcined CaO and woody residues were mixed manually at 10wt%
and 20wt% CaO, respectively. No additional runs were carried out with higher percentage of
CaO due to the unavailability of wood chips. The same gasification procedure from section 4.2
was used and the behavior of the syngas composition was monitored by the portable gas
analyzer.
Table 4-1. Chemical characterization of the quicklime reported by the local distributor.
Characteristics Component Composition
Available Calcium Oxide CaO ≥ 90%
Total Calcium Oxide CaO ≥ 92%
Magnesium Oxide MgO ≤ 1%
Sulfur Content S ≤ 0.1%
Silica Content SiO2 ≤ 0.5%
Iron Content Fe2O3 ≤ 0.1%
Aluminum Content Al2O3 ≤ 0.1%
Phosphorus Content P ≤ 0.1%
4.4 Additional gasification experiences
As part of this thesis, a short internship in the combustion laboratory at the University of
Maryland with the professor Ashwani K. Gupta was carried out. The main objective of this
internship was to evaluate the effect of various gasifying agents (steam, carbon dioxide and a
mixture of these) in the hydrogen composition of the generated gas. A detailed description of
the experimental procedure developed in the University of Maryland is summarized in Annex
B.
4.5 Dark Fermentation
Among the methods to transform lignocellulosic biomass into bioenergy, dark fermentation has
gained great interest. There is a wide range of microorganisms that are capable of producing
hydrogen via dark fermentation. This includes strict anaerobes (Clostridia, methylotrophs,
rumen bacteria, methanogenic bacteria, archaea), facultative anaerobes (E. coli, Enterobacter,
Page 62
62 Hydrogen Production through Gasification and Dark Fermentation
Citrobacter), and even aerobes (Alcaligenes, Bacillus) [12]. In the recent years, extensive
research has also been carried out in hydrogen production at high temperature, using
thermophilic or hyperthermophilic bacteria such as Thermoanaerobacterium
Thermosaccharolyticum, since the increase of temperature in principle improves the reaction
kinetics [12]. In this section, the production of hydrogen from wood residues using as
microorganism Thermoanaerobacterium Thermosaccharolyticum ATCC 7956 is described.
Main emphasis is made on the pretreatment step of the raw material and the transformation of
fermentable sugars into hydrogen. Fermentation procedure can be divided in four steps: acid
hydrolysis, enzymatic saccharification, dark fermentation, hydrogen and metabolites
quantification.
Dark fermentation is a complex process manifested by diverse groups of bacteria where simple
sugars or disaccharides are converted into hydrogen, carbon dioxide and organic acids [13]. Due
to high cellulose crystallinity and low biodegradability, lignocellulosic biomass may require a
pretreatment prior to biohydrogen fermentation [11]. A detailed description of the steps involve
in the dark fermentation is presented below.
4.5.1 Dilute-acid hydrolysis
The first step involves the pretreatment of the lignocellulosic biomass in order to obtain mainly
C5 fractions used in the fermentation step. Dilute acid hydrolysis under mild conditions is the
main process used for the saccharification of lignocellulosic biomass. Rafiqul et al., [107]
evaluated the performance of the dilute acid hydrolysis of Meranti wood at different sulfuric
acid concentrations (2-6 %wt.) and residence time (0-120 min). Highest acid concentration
(6%wt.) enhanced the content of xylose and glucose, and reduced the residence time to 20 min.
On the other hand, low xylose and glucose concentration, and higher residence time (>100 min)
are obtained when the process was carried out with a low acid concentration (2%wt.). However,
high acid concentration also enhanced the formation of toxic compounds that may inhibit the
performance of the microorganism. For this reason, mild conditions (sulfuric acid 2%wt, 115°C
and 3 hours) were selected aiming to keep a low sugars degradation and also increase the
concentration of glucose and xylose in the hydrolyzate. The solid to dilute-acid ratio was fixed
at 1:10 (w/w). These conditions were selected based on different studies related to the acid
hydrolysis of wood materials [107]–[109]. After the hydrolysis procedure, the solid and liquid
fractions were separated by filtration. Liquid fraction was collected and placed in the
refrigerator for further analysis. Solid fraction was washed with water until the pH of the
solution rises up to 4.5 – 5.
Page 63
Hydrogen Production through Gasification and Dark Fermentation 63
Due to the difficulty in finding a strict mechanism for hydrolysis reactions, it is usual to use
simplified models to determine the kinetics of the hydrolysis of lignocellulosic materials [110].
Some of the proposed models in literature are pseudo-homogeneous irreversible first-order
reactions. The general reaction can be described in Eq. (4-4).
𝑃𝑜𝑙𝑦𝑚𝑒𝑟𝑠 (𝑃) → 𝑀𝑜𝑛𝑜𝑚𝑒𝑟𝑠(𝑀) → 𝐷𝑒𝑐𝑜𝑚𝑝𝑜𝑠𝑖𝑡𝑖𝑜𝑛 𝑝𝑟𝑜𝑑𝑢𝑐𝑡𝑠 (4-4)
In order to determine the conversion of the quantified monosaccharides by HPLC and based on
the previous reaction (Eq. (4-4)), the potential concentration of the monosaccharides (𝑀𝑛) was
calculated considering that the polymer is completely converted into its constitutive components
through the following equation [110]:
𝑀𝑛 = (𝑃𝑀𝑀
𝑃𝑀𝑃) (
𝐶𝑋𝑛
𝐿𝑆𝑅) ∗ 5
(4-5)
Where 𝑃𝑀𝑀 and 𝑃𝑀𝑃 are the molecular weight of the monosaccharide and polymer,
respectively. 𝐶𝑋𝑛 is the initial content of the polymer in the raw material from the chemical
characterization (see, Tables 5-1 and 5-3) and 𝐿𝑆𝑅 is the liquid/solid ratio (10 g liquid/ g of
wood).
4.5.2 Detoxification
One problem associated with the dilute-acid hydrolysis is the formation of toxic compounds
such as phenolic. Furfural and hydroxymethyl furfural are the two main decomposition products
formed by acid hydrolysis [111]. These compounds may inhibit the cell growth. Several
methods have been reported to remove these toxic compounds from lignocellulosic hydrolysates
such as: neutralization, overliming, steam stripping, ion exchange, solvent extraction, among
others. Treatment with Ca(OH)2 (overliming) seems to be a good alkali treatment for
hydrolysate’s detoxification [112]. The main drawback of this treatment is that sugars are also
degraded. Purwadi et al., [113] evaluated the performance of the alkaline detoxification of acid
hydrolysates at different temperatures and pH in terms of the sugar, furfural and HMF
degradation using Ca(OH)2. As a result, higher temperatures (> 45°C) are recommended in
order to avoid high pH, where high amount of sugars are degraded and also less lime and acid
are used.
For this procedure, Ca(OH)2 was added to increase the pH (up to 10) and keep this condition for
20 min at 60°C. Subsequently, the resulting precipitate was removed by centrifugation. Then,
the pH of the supernatant was adjusted back to 6.5 using H2SO4. Afterwards, the supernatant
was again filtered aiming to remove the remaining precipitate. In order to evaluate the
Page 64
64 Hydrogen Production through Gasification and Dark Fermentation
performance of the detoxification process, sugar degradation and detoxification yield were
calculated. Samples were taken at the beginning and the end of the detoxification procedure
aiming to determine the monosaccharides and furfural concentration and thus, the sugar
degradation and detoxification yield.
4.5.3 Enzymatic Saccharification
The unconverted solid fraction from the acid hydrolysis pretreatment can be degraded by
enzymatic saccharification. The cellulose degradation process was carried out with a total solid
content of 2.5%w/v at 50°C using cellulases (celluclast 1.5 L, Novozymes, Denmark) and a
multienzyme complex Viscozyme L (Novozymes, Denmark). An enzyme dosage of 60 filter
paper units (FPU) per gram of cellulose or substrate for celluclast 1.5L and an enzyme load of
64 pNPGU per gram of cellulose or substrate for Viscozyme L were added. The reaction
volume and pH were adjusted using a Citrate Buffer 0.1 M (pH 4.8 – 5.0). The operational
conditions of the saccharification (50°C, 72 hours and 100 rpm) were adapted from Agrawal et
al., [114] and Normark et al., [109]. Subsequently, the liquid fraction (rich in hexoses) was
separated from the solid by filtration and placed in the refrigerator for further analysis.
4.5.4 Fermentation
In this section, a detailed description of the components involved in the dark fermentation
procedure is presented. First, a brief description of the microorganism Thermoanaerobacterium
thermosaccharolyticum ATCC 7956, especially regarding to its phenotypic features, is
developed. Then, the growth medium components and compositions are presented. Based on the
phenotypic features and reports in literature, different substrates to be used as carbon source by
the microorganism are analyzed. Subsequently, a brief description of the experimental setup
used in this thesis to determine the amount of gaseous products (H2 and CO2) is carried out.
Finally, the quantitative and qualitative methods used to determine hydrogen, sugars and
secondary metabolites concentration are described.
- Microorganism
The strain T. Thermosaccharolyticum is a thermophile saccharolytic microorganism that
effectively produces hydrogen and other secondary metabolites (ethanol, acetic acid, lactic acid,
among others) from carbohydrates [47]. The strain ATCC 7956 and other T.
Thermosaccharolyticum strains can grow in a variety of complex and simple carbohydrates as
can be observed in Table 4-2. The optimal growth conditions of the microorganism are 55°C
and an anaerobic atmosphere (N2 atmosphere). There are different reports of the production of
hydrogen using different T. Thermosaccharolyticum strains (W16, FH1, PDU-2, KKU19, TERI
Page 65
Hydrogen Production through Gasification and Dark Fermentation 65
S7, among others) [48], [115], [116]. However, there are no reports of the use of the commercial
T. Thermosaccharolyticum ATCC 7956 in the hydrogen production.
- Growth medium
According to the Leibniz Institute (DSMZ), the suitable growth medium for the T.
Thermosaccharolyticum ATCC 7956 is a Clostridium Thermohydrosulfuricum (CT) medium,
which its main components are presented in Table 4-3. In order to ensure the suitable growth
conditions for the microorganism, the pH of the medium must be adjusted to 6.8 – 7.5 and
sparge the medium with 100% N2 gas to make it anoxic (30-45 min). Then, the medium is
autoclaved at 115°C and 15 psia.
Table 4-2. Growth of T. Thermosaccharolyticum strains in different carbon sources
Carbon source W16
[47]
PSU-2
[117]
KKU-19
[115]
ATCC-7956
[118]
Sucrose + + + +
Arabinose + + + +
D-xylose + + + +
Lactose + + + +
Glucose + + + +
Mannose + + + +
Galactose + + + +
Xylan + + + +
Cellulose + + + ND
Yeast extract + + + ND
Starch + + + +
Glycerol - - - -
ND: not determined.
Individual isolates were cultivated anaerobically in a MB medium aiming to determine the
effect of different substrates in the hydrogen and secondary metabolites production. The
components and composition of the MB medium are presented in Table 4-4. The modified MB
medium is widely used in different literature reports for the production of hydrogen and
secondary metabolites of different T. Thermosaccharolyticum strains, giving high hydrogen
yields [48], [119], [120]. Therefore, this medium was used to evaluate the performance of the
commercial T. Thermosaccharolyticum ATCC 7956 for hydrogen and secondary metabolites
production.
Page 66
66 Hydrogen Production through Gasification and Dark Fermentation
Table 4-3. Composition of the Clostridium Thermohydrosulfuricum (CT) medium [121]
Table 4-4. Composition of the MB medium [47]
Component Concentration (g/L)
NH4Cl 1.0
K2HPO4 1.5
KH2PO4 0.75
MgCl2 x 6H2O 0.5
NaCl 2.0
KCl 0.2
Cysteine-HCL 0.5
Yeast extract 2.0
Tryptone 2.0
Sucrose 10
- Substrate type
Based on the datasheet of the Leibniz Instutite DSMZ, the microorganism grows using sucrose
as carbon source. However, based on the information provided in Table 4-2, the microorganism
can grow in a variety of substrates. Prior to utilization of acid and enzymatic hydrolysates for
growth and H2 production, a set of experimental runs were carried out using the synthetic
medium (MB) supplemented with analytical-grade sugars as carbon source to determine the
fermentative behavior of the T. thermosaccharolyticum ATCC 7956 (see, Table 4-5). Sucrose,
glucose, xylose, and a mixture of glucose and xylose were added at a fixed total sugar quantity
(10 g L-1). Subsequently, the hydrolysates from the acid and enzymatic pretreatments of both
raw materials were tested as carbon source for the production of hydrogen and secondary
metabolites using T. Thermosaccharolyticum ATCC 7956.
Components Concentration (g/L)
Tryptone 10
Yeast Extract 2
FeSO4 · 7H2O 0.2
Na2SO3 0.2
Na2S2O3 · 5H2O 0.08
Cysteine-HCL 0.001
Sucrose 10
Page 67
Hydrogen Production through Gasification and Dark Fermentation 67
Table 4-5. Pure substrate composition for the dark fermentation of T. Thermosaccharolyticum
ATCC 7956
Preliminary tests
Sucrose 100%
Glucose 100%
Glucose 75% - Xylose 25%
Glucose 50% - Xylose 50%
Glucose 25% - Xylose 75%
Xylose 100%
- Preinoculum
First, the bacteria was growth in agar plates using the CT medium in an incubator at 55°C and
subsequently, several colonies were collected with a handle and were transferred into tubes with
rubber stoppers that contained MB medium. In the tubes, 5 ml of the medium was poured in
anaerobic conditions (using nitrogen as sparging gas). Previously, the pH of the medium was
adjusted to 6.8 – 7.5 using NaOH 2N and HCL 2N. The tubes with the bacteria were incubated
in a water bath at 55°C for 3 days.
- Fermentation
Fermentation was carried out in 100 mL glass serum bottles with 50 mL medium and the pH
was adjusted between 6.5 and 7. The inoculum was added at 2%w/w in anaerobic conditions
using N2 as sparging gas. Fermentation procedure was performed at 60°C in a reciprocal
shaking bath at 120 rpm for 3 days. These conditions were adapted from different authors that
have worked with T. Thermosaccharolyticum strains in order to produce hydrogen [47], [115],
[117]. The experimental setup consisted of three serum bottles serially connected by hoses and
valves. The first flask contained the inoculum previously gassed with nitrogen. The second flask
was filled with water and was connected directly to the first flask. The function of the second
flask was to collect the gas that was produced in the fermentation; and the water in the second
flask was displaced to the third bottle. This works as an indicator of the amount of gas that was
produced in the fermentation. This procedure is normally called the water displacement method.
Figure 4-2 presents a schematic description of the dark fermentation experimental setup.
Page 68
68 Hydrogen Production through Gasification and Dark Fermentation
Figure 4-2. Flowsheet of the biomass gasification to produce hydrogen from wood residues
- Analytical Methods
Sugars and furan-based compounds from the acid hydrolysis and enzymatic saccharification
were quantified using High Performance Liquid Chromatography (HPLC) (Hitachi Elite
LaCrhome) with a column Transgenomic CARBOSep CHO-782 Pb. Deionized water was used
as mobile phase. The column oven and RID were maintained at 70°C, and the flow rate of the
mobile phase was fixed at 0.6 ml min-1. Prior to the quantification, the samples were centrifuged
at 10,000 rpm for 10 min. Then, the supernatant was filtered through an Agilent Nylon Filter
with a pore diameter of 0.2 µm into HPLC vials. Peaks were detected by the RI detector and
quantified based on the area and the retention time of the standards (glucose, xylose, galactose,
arabinose, mannose and furfural) procured from Merck, Sigma-Aldrich and Acros Organics.
The HPLC quantification was carried out in the Laboratorio de Intensificación de Procesos y
Sistemas Híbridos of the National University of Colombia at Manizales.
Volatile fatty acids (acetic and lactic acid) were quantified using HPLC (Shimadzu, Kyoto,
Japan) with a column C18 ODS hypersil. Phosphate buffer with pH=2.4 was used as mobile
phase. The column and UV detector were maintained at 40°C, and the flow rate of the mobile
phase was fixed at 0.7 ml min-1. The sample preparation was the same procedure mentioned in
the sugar and furan-based compounds quantification. Peaks were detected by the UV detector
and quantified based on the area and retention time of the standards. This procedure was carried
out in the Laboratorio of Cinéticas Enzimáticas y Equilibrios Químicos of the National
University of Colombia at Manizales.
Ethanol was measure using HPLC (Hitachi Elite LaCrhome) consisting of a pump, autosampler,
column oven, RID and organizer units. Transgenomic ICSep ORH-801 Column was used as
stationary phase with H2SO4 0,01N as mobile phase at a flowrate of 1 mL/min and temperatures
in the oven and detector of 70 and 45°C, respectively. This procedure was also carried out in the
Fermentation
Broth
Water
Displacement
Method
Sampling
Point
Gas
Gas
Shaking Bad
Page 69
Hydrogen Production through Gasification and Dark Fermentation 69
Laboratorio de Intensificación de Procesos y Sistemas Híbridos of the National University of
Colombia at Manizales.
The sugars concentration in the dark fermentation were measured based on the determination of
reducing sugars using the dinitrosalicylic acid (DNS) method, where the absorbance was
measured at different wave-lengths depending on the sugar concentration, following the
protocol proposed by Miller [122].
The amount of produced gases in the dark fermentation were measured by water displacement
method, where gaseous samples were collected in 250 ml flasks and then, they were analyzed in
a Portable Gas Analyzer (GASBOARD3100p, Wuhan, China). The calculation of the gaseous
species yield was performed considering the following equation (Eq. 4-6).
𝑌𝑔𝑎𝑠 =
𝑉𝑔𝑎𝑠 ∗ 𝐶𝑔𝑎𝑠 ∗𝜌𝑔𝑎𝑠
𝑀𝑊𝑔𝑎𝑠
(𝑆𝑓 − 𝑆𝑜) ∗𝑉𝑡𝑜𝑡𝑎𝑙
𝑀𝑊𝑠𝑢𝑏
(4-6)
Where 𝑉𝑔𝑎𝑠 is the volume of water that was displaced by the generated gas from the dark
fermentation, 𝐶𝑔𝑎𝑠 the concentration of the specie in the gaseous mixture, 𝜌𝑔𝑎𝑠 is the density of
the gaseous specie, 𝑀𝑊𝑔𝑎𝑠 is the molecular weight of the gas specie, (𝑆𝑓 − 𝑆𝑜) is the substrate
consumption in the dark fermentation, 𝑉𝑡𝑜𝑡𝑎𝑙 is the volume of fermentation medium and 𝑀𝑊𝑠𝑢𝑏
the molecular weight of the substrate.
4.6 Simulation Procedure
- Overview
In order to evaluate the performance of stand-alone and biorefinery ways to produce hydrogen,
six scenarios were proposed. Two scenarios are related to the production of hydrogen in a stand-
alone pathway from which only one product (hydrogen) was obtained. The remaining four
scenarios were evaluated considering the conceptual design of a biorefinery which is related to
three concepts: i) hierarchy, ii) sequence and iii) integration [123]. First corresponds to the
hierarchical decomposition of relevant elements in the biorefinery, such as feedstocks, products
and technologies. Then, the logical order of the technologies and products in the biorefinery
must be decided (sequence). And finally, the convenience of the integration of raw material,
processes or process streams is analyzed [124].
According to the hierarchy approach, the first step considers the selection of the main products
that are going to be targets for the biorefinery design. Biorefinery products can be categorized in
five groups: biofuels, bioenergy, biomolecules and natural chemicals, biomaterials, and food
Page 70
70 Hydrogen Production through Gasification and Dark Fermentation
product. Hydrogen, electricity, ethanol, acetic acid and butyric acid were selected as main
products addressing the hierarchy design to hydrogen, then to ethanol, VFA and finally,
electricity. Besides, the sequence of the technological routes was established according to the
well-known onion diagram, giving importance to the reaction stage [125]. Finally, the
integration of stream processes that can be used as energy sources in other processes was carried
out. Mass and energy balances were obtained using simulation procedures. The software used
for this purpose was the simulation tool Aspen Plus v8.0 (Aspen Technology, Inc, USA).
The effect of the hierarchy of products within a biorefinery was used to evaluate the economic
performance of the hydrogen production. The main objective of this procedure was to select the
scenarios, in a biorefinery way, that make the hydrogen production process more profitable
compared to those in a stand-alone pathway. Additionally, the energy efficiency of each
scenario, to support the selection of the most suitable process, was calculated. There must be a
balance between economic profitability and environmental impacts of the process to be
considered as sustainable. As a consequence, Green House Gases (GHG) assessment was
performed in order to calculate the amount of CO2 emitted by each scenario, especially
gasification scenarios. Since GHG evaluation only considers the effect of CO2 in the atmosphere
(which can be related to the global warming potential), another simulation tool that evaluates
the performance of the process in different impact categories was implemented. For this
purpose, the Waste Reduction Algorithm (WAR) developed by the Environmental Protection
Agency of the United States (EPA) was used to compare each scenario based on eight (8)
impact categories. A detailed description of the scenarios, the processes and the evaluation
parameters involve in the simulation procedure is presented below.
4.6.1 Scenarios
Six scenarios for gasification and dark fermentation were proposed to evaluate the effect of the
hierarchy decomposition of the products in the economic, energy and environmental assessment
of the hydrogen production. Stand-alone ways (the production of hydrogen as a single product
from gasification and dark fermentation) were selected as base cases for the comparison with
the remaining four scenarios in which, the conceptual design of a biorefinery was applied.
Table 4-6 presents the description of the six evaluated scenarios considering three products
(hydrogen, ethanol and electricity) for the gasification scenarios and four products (hydrogen,
ethanol, acetic acid and butyric acid) for the dark fermentation scenarios.
Page 71
Hydrogen Production through Gasification and Dark Fermentation 71
Table 4-6. Stand-alone and biorefinery scenarios for the hydrogen production
Technology Scenario Products Description
Gasification
Scenario 1 Hydrogen 100 % Raw material for syngas
production
Scenario 2a Hydrogen +
Electricity
50% of syngas intended for power
generation and the remaining for the H2
production.
Scenario 3b Hydrogen +
Electricity + Ethanol
70% raw material for syngas
production. The remaining 30% for
ethanol production.
Dark
Fermentation
Scenario 4 Hydrogen 100% raw material for hydrogen
production
Scenario 5c Hydrogen + Ethanol Additional ethanol separation
Scenario 6d Hydrogen +
Ethanol+ VFA
Additional acetic and butyric acid
separation
a Same distribution of raw material as in the scenario 1. b Same distribution of synthesis gas as in the scenario 2. c Same distribution of raw material as in the scenario 4. d Same distribution of raw material as in the scenario 5.
Scenarios 1 and 4 consider only the production of hydrogen from the stand-alone processes.
Two additional scenarios are proposed for the production of hydrogen, ethanol and electricity
through biomass gasification. Scenario 2 considers the use of 50% of the generated syngas in
the gasification for hydrogen production and the remaining 50% for the electricity generation,
using the syngas as fuel in a gas engine. Furthermore, scenario 3 considers the ethanol
production from a fraction (30%) of the feedstock to the process. The remaining 70% is used in
the gasification process for syngas production from which, 50% is used for hydrogen production
and the remaining 50% for electricity generation. Finally, scenarios 5 and 6 consider the
separation of the byproducts from the fermentation broth (ethanol and VFA) along with the
hydrogen production.
4.6.2 Process description
For all proposed scenarios, mass and energy balances were obtained using simulation
procedures aiming to calculate the requirements for raw material, utilities and energy needs.
Mathematical modelling of the concentration profiles using kinetic models was performed in
software packages such as Matlab (MathWorks, USA). Calculation of the technological routes
are based on kinetic models [107], [117], [126]–[129] (see, Annex C).
Page 72
72 Hydrogen Production through Gasification and Dark Fermentation
For the simulation of the biomass gasification, the Grayson-Streed thermodynamic model was
used to calculate the activity coefficients of the liquid phase since the model was developed for
systems with high H2 concentration. The Redlich-Kwong equation of state was applied to
describe the vapor phase. In the simulation of the dark fermentation, the Non Random Two
Liquids (NRTL) was used to analyze the behavior of the liquid phase and the Hayden
O´Connell equation of state was selected to describe the vapor phase [130]. Additional data
such as physical properties were obtained from the work of Wooley and Putsche [131].
4.6.3 Gasification
The process scheme used in the production of hydrogen through biomass gasification is
presented in the Figure 4-3. The simulation of the air gasification was divided in three stages:
pretreatment of the raw material (drying and milling), gasification (enrichment of the syngas)
and purification (membranes). The first part of the process involved the pretreatment of the
feedstock which consisted on drying the raw material to achieve a moisture content between 10
- 20%. Subsequently, the lignocellulosic residue was chipped to obtain a particle size between
0.5 and 1 cm. These conditions were selected for the simulation according to the requirements
of the gasifier from the experimental procedure.
The second stage was related to the chemical pathway of gasification that took place inside of
the reactor as shown in Eq. 4-7 to 4-14. The simulation of the downdraft gasifier was performed
splitting the reactor in three main processes: pyrolysis, combustion and reduction. Dried
biomass underwent into the devolatilization (pyrolysis), where the raw material was
decomposed into carbon, hydrogen, oxygen and ash according to the elemental analysis from
the experimental procedure. Then, all the components from pyrolysis zone went into the
combustion chamber, where they reacted with oxygen to produce CO2, CO, H2O and heat. The
produced char in the pyrolysis and the combustion zone passed to the reduction zone, where
char gasification took place to produce CO2, CO, H2 and CH4. Ash and the remaining char were
separated from the syngas using a cyclone. The operational conditions of the gasifier (e.g.
temperature, air/biomass ratio) were selected based on equilibrium and kinetic models of the
modelling of a downdraft gasifier. Annex D presents the equilibrium and kinetic models used in
the mathematical modelling of the downdraft gasifier and the effect of two process parameters
(moisture content and air/biomass ratio) in the synthesis gas composition and energy content.
Pyrolysis
𝐵𝑖𝑜𝑚𝑎𝑠𝑠 + ℎ𝑒𝑎𝑡 → 𝐶𝑠 + 𝑡𝑎𝑟 𝑔𝑎𝑠𝑒𝑠
(4-7)
Combustion
𝐶𝑠, 𝑡𝑎𝑟 𝑔𝑎𝑠𝑒𝑠 + 𝑂2 → 𝐶𝑂2 + 𝐻2𝑂 + ℎ𝑒𝑎𝑡 (4-8)
Page 73
Hydrogen Production through Gasification and Dark Fermentation 73
𝑡𝑎𝑟 𝑔𝑎𝑠𝑒𝑠 + ℎ𝑒𝑎𝑡 → 𝐶𝑂 + 𝐻2 (4-9)
Reduction
𝐶𝑠 + 𝐶𝑂2 ↔ 2𝐶𝑂 (4-10)
𝐶𝑠 + 𝐻2𝑂 ↔ 𝐶𝑂 + 𝐻2 (4-11)
𝐶𝑠 + 2𝐻2 ↔ 𝐶𝐻4 (4-12)
𝐶𝐻4 + 𝐻2𝑂 ↔ 𝐶𝑂 + 3𝐻2 (4-13)
𝐶𝑂 + 𝐻2𝑂 ↔ 𝐶𝑂2 + 𝐻2 (4-14)
In order to improve the hydrogen content in the generated gas, a catalyst adsorption was
proposed. Carbonation reaction was based on the conversion of carbon dioxide (CO2) into
calcium carbonate (CaCO3) using calcium oxide (CaO) as adsorbent. For this purpose, the
kinetic analysis for the capture and desorption of CO2 proposed by Nikulshina et al., [127] was
used. As mentioned in section 4.3, the presence of CaO in the biomass gasification can increase
the hydrogen and carbon monoxide content, and further reduce the tar content in the syngas.
For this reason, a coupled two bed reactors, using CaO as catalyst, were chosen to improve the
selectivity of the hydrogen in the synthesis gas. In the first reactor, the carbonation reaction took
place (Eq. 4-15). The calcination reaction involved the CO2 desorption using air in the second
reactor (Eq. 4-16).
𝐶𝑂2(g)+ 𝐶𝑎𝑂(𝑠) → 𝐶𝑎𝐶𝑂3(𝑠)
(4-15)
𝐶𝑎𝐶𝑂3(s)→ 𝐶𝑎𝑂(𝑠) + 𝐶𝑂2(𝑔) (4-16)
Finally, a further purification stage was required using hollow fiber membranes, which are
widely used in many gas separation industries [132]. Ideal selectivity, separation factor and H2
recovery were obtained from data reported in literature [132], [133]. Choi et al., [133] evaluated
the performance of hollow fiber membranes in the separation of H2/N2 and H2/CO mixtures for
hydrogen production, and consequently their application in the separation of gaseous mixtures
in thermochemical methods such as Steam Methane Reforming (SMR) from which hydrogen
concentration up to 30% can be obtained. First, the authors tested the permeance of the
membrane with pure gases (H2, N2, CO, CO2). Then, based on the selectivity of the membrane
for the pure components, two mixture (H2/N2 and H2/CO) were selected to evaluate the
hydrogen recovery in these systems. The operational conditions of the membrane were: 50°C,
feed/retentate pressure up to 6 bar and permeate pressure 1 bar. Based on the reported data, 85%
molar of hydrogen recovery and 72% molar of hydrogen purity were obtained in the
experimental procedures [133]. Therefore, these data were used in the simulation procedure of
the hydrogen purification using hollow fiber membranes. Previous treatment of the hydrogen
rich gas was required to reach the suitable pressure conditions inside the membrane to enhance
the mass transfer of the hydrogen. Maus et al., [134] examined the problems involve in
Page 74
74 Hydrogen Production through Gasification and Dark Fermentation
refueling vehicles woth compressed hydrogen. According to Maus et al., [134], the filling
pressure that must be supplied from the hydrogen storage location should be at levels between
35 to 70 MPa, in order to achieve an adequate volumetric storage density. For this reason, due
to the loss of energy after the membrane separation, the hydrogen stream must be compressed to
reach the required conditions for the filling station.
Figure 4-3. Flowsheet of the biomass gasification to produce hydrogen from wood residues
4.6.4 Electricity generation
The generated synthesis gas from the biomass gasification has a high energy content, which can
be used directly as fuel in a gas engine to produce electricity due to its high H2/CO ratio. An
internal combustion engine burns the gaseous fuel to produce electricity by means of a
generator. Normally, the efficiency of these devices is between 27 – 38% and they can provide
energy in form of electricity from 30 kWh to 60 MWh [27]. The simulation of the electricity
generation from the synthesis gas was based on the syngas mass flow, lower heating value
(LHV) of the gas and the efficiency of the internal combustion engine. As a result, the amount
of available energy that can be obtained from the synthesis gas was calculated.
Coffee Cut-StemsChipperDryer
Air
Absorber Desorber
Membrane
Exhausted Gas
H2-Rich Gas
Gasifier
Ash
Calcium OxidePurge
Carbon Dioxide
Hydrogen
Heating Requirements
Net Work
Purification and Conditioning
Gasification
Raw material conditioning
Page 75
Hydrogen Production through Gasification and Dark Fermentation 75
4.6.5 Ethanol Fermentation
Wood residues have high cellulose and hemicellulose content, from which fermentable sugars
for bioenergy production can be obtained. Due to high crystallinity and low biodegradability,
lignocellulosic biomass may require a pretreatment prior to fermentation processes [11]. For this
reason, a mild-acid pretreatment and enzymatic hydrolysis were proposed as methods for raw
material pretreatment. Acid hydrolysis with sulfuric acid (2% w/w) at 130°C and solid to liquid
ratio of 1:10 were used as conditions in the simulation procedure. Hydrolysis yields were
calculated based on the kinetic expression reported by Rafiqul et al., [107] considering the
operational conditions mentioned before. Xylose is the main fermentable sugar from the acid
hydrolysis that can be used as carbon source for the ethanolic fermentation. One problem
associated with the dilute-acid hydrolysis is the formation of toxic compounds such as acids,
furfural and phenolic compounds. Alkaline treatment with Ca(OH)2 is widely used in the
hydrolysates detoxification [111]. The simulation procedure of the alkaline treatment consisted
in the degradation of furan compounds and consequently, the formation of gypsum that was
separated from the hydrolysate by filtration. The chemical pathway of the overliming was
obtained from Purwadi et al., [113]. The unconverted fraction of cellulose from the acid
hydrolysis can be used to produce glucose by enzymatic saccharification. Enzymatic hydrolysis
of woody residues was simulated based on the kinetic expressions reported by Zheng et al.,
[110], Khodaverdi et al., [111], Kadam et al., [119]. This model correlates the degradation of
cellulose and cellobiose with the formation of glucose considering the enzyme charge (cellulase
and β-glucosidase). The concentration profiles of the enzymatic saccharification were calculated
in the software MATLAB (MathWorks, USA).
The fermentable sugars obtained from the pretreatment stage were converted into ethanol using
the bacteria Zymomonas mobilis at 30°C for 30 hours. This bacteria has the ability to degrade
hexoses and pentoses, as carbon source. Leksawasdi et al., [136] developed a two-substrate
model for the fermentation of glucose and xylose by the recombinant Zymomonas mobilis.
Concentration profiles of ethanol and fermentable sugars were calculated based on the
Leksawasdi model in the software MATLAB (MathWorks, USA). Then, the fermentation broth
with an ethanol concentration of 5 – 6 % by weight was sent to a downstream process, which
consisted of two distillation columns and molecular sieves. In the first column, the ethanol was
concentrated up to 60%. Then, the ethanol was concentrated until the azeotropic point (96 %wt).
Finally, a dehydration stage was required in order to obtain ethanol at 99.6 %wt using molecular
sieves [81]. The process scheme of the ethanol production using woody residues is presented in
Figure 4-4.
Page 76
76 Hydrogen Production through Gasification and Dark Fermentation
Figure 4-4. Flowsheet of the ethanol production from wood residues using Z. mobilis
4.6.6 Dark Fermentation
The production of hydrogen through dark fermentation involved various stages: pretreatment of
the raw materials, fermentation, hydrogen purification, ethanol and VFA separation. The
process scheme for hydrogen, ethanol, acetic acid and butyric acid production is presented in
Figure 4-5. The pretreatment of the raw material consisted mainly in physical and chemical
treatments. The same process for the physical treatment (drying and milling) in section 4.6.3
and the same for chemical treatment (acid and enzymatic hydrolysis) in section 4.6.5 were
considered in the simulation procedure of the dark fermentation. The hydrolysate from the acid
and enzymatic hydrolysis was used as carbon source for hydrogen production by the moderate
thermophile Thermoanaerobacterium thermosaccharolyticum. Cell growth and substrate
consumption was simulated based on the Monod model [117] and the products formation was
described based on the Luedeking–Piret model [137]. Hydrogen, carbon dioxide and other
metabolites (ethanol, acetic and butyric acid) were the main products from the dark
fermentation. The separation of hydrogen from the carbon dioxide was performed using coupled
porous and non-porous membranes, in order to enhance the hydrogen selectivity. Belafibako et
al., [138] evaluated the performance of porous and non-porous membranes for the hydrogen
separation of a fermentative process. During the fermentation, four gaseous species are
produced: water vapor, hydrogen, carbon dioxide and nitrogen. The direct separation of
hydrogen from CO2 and N2 seems to be too difficult; therefore, a two-step gas separation system
can be used to separate first, the mixture H2-N2 in a non-porous membrane and subsequently,
the mixture H2-CO2 in a porous membrane. At the end of the two-step separation system, a
hydrogen recovery percentage up to 75% can be reached [138]. Consequently, this data was
used in the simulation of the hydrogen purification.
H2SO4 2%
Acid Hydrolysis
Filter
DetoxificationFilter
Ca(OH)2
Enzyme
CaSO4
Filter
AutoclaveFermentationWater
Enzymatic Saccharification
Distillation
Rectification
Molecular sieves
ETHANOL
Filter
Nutrients
Z. mobilis
CO2Biomass
StillageWaterResidual Solid Fraction
Coffee Cut-Stems
Cellulose rich-solid
Water
C5–C6 fractions
Page 77
Hydrogen Production through Gasification and Dark Fermentation 77
Figure 4-5. Flowsheet of the hydrogen, ethanol, acetic acid and butyric acid production through
dark fermentation of wood residues.
The separation of ethanol and VFA’s (acetic and butyric acid) was simulated based on different
separation process schemes. The downstream process for ethanol separation from the
fermentation broth followed the same procedure described in section 4.6.5. Acetic and butyric
acid are the main VFA in the fermentation broth, the separation of these two metabolites was
performed based on the aqueous two-phase system using calcium chloride [139], [140].
Aqueous two-phase partition is a liquid-liquid extraction method broadly used in the separation
of inorganic molecules and biomolecules [140]. The introduction of a salt affects the boiling
point, the solubility of the liquid components and the equilibrium composition of the vapor
phase. Wu et al., [140] evaluated the separation of butyric acid by an aqueous two-phase
system. A solution of butyric acid-water-salt and a simulated fermentation broth, consisting of
butyric-acetic acid, were used in the experimental runs. Separation yield of the system butyric
acid-water reached a recovery percentage up to 87%. From the simulated fermentation broth,
the concentration of butyric acid raised 2-3 times the initial concentration of the butyric-acetic
acid mixture. Furthermore, Wu et al., [139] studied the extraction and separation of butyric acid
from a clostridium tyrobutyricum fermentation broth using a Polyethylene Glycol
(PEG)/sodium sulfate aqueous two-phase system. As a result, an extraction yield up to 92% can
be obtained using a solution of 9.6% Na2SO4 (w/w) in order to induce the salting effect in the
fermentation broth and a solution of 26% PEG (w/w) to form the aqueous two-phase solution.
The aqueous two-phase process scheme (see, Figure 4-5) and its operational conditions were
adapted from Wu et al., [139], Wu et al., [140] and Lefranc et al., [141]. First, NasSO4 was
mixed with the fermentation broth at 36°C to salt out the cell protein, sugars and nitrogen
Wood Residues
Acid Hydrolysis
Solid
Residue
Liquor
Detoxification
Calcium
Hydroxyde
Xylose
Calcium Sulfate
Water
Enzymatic Hydrolysis
Enzyme
Lignine
Dark Fermentation
T. Thermosaccarolyticum
Hydrogen
Biomass
Byproducts
Glucose
Stillage
Waste Water
Ethanol
Molecular Sieves
Sodium Sulfate
Sugars
N2 compounds
PEG
Sodium Sulfate
Sugar
N2 compounds
PEG
rich-phase
Iodine
PEG
VFA
Acetic Acid
Butyric Acid
Sulfuric Acid
Page 78
78 Hydrogen Production through Gasification and Dark Fermentation
compounds. Then, the liquid fraction was separated from the precipitate by filtration.
Subsequently, the broth was added into PEG from which an aqueous and organic phase were
formed. The organic phase contained most of the butyric acid, acetic acid and PEG. Iodine
solution (in a ratio 1:2 of iodine: PEG) was added to the organic phase to precipitate the PEG.
The filtrate from the solution contained butyric acid and acetic acid, which were submitted to an
atmospheric distillation system at 118°C to separate the butyric acid.
4.7 Analysis of the proposed scenarios
In this section, a detailed description of the economic, energetic and environmental assessment
of the proposed scenarios is presented. These analyzes were used as decision criteria for the
selection of the suitable scenarios for hydrogen production, considering as main parameters:
economic profitability, energy efficiency and the environmental potential impact of the
evaluated processes.
4.7.1 Economic Assessment
A basic equipment mapping adapted to the economic conditions (tax rate, interest of return,
operator and supervisor wages, among others) in Colombia was performed to determine the
operating costs of the proposed scenarios including the raw material, utilities, labor and
maintenance, general plant and administrative costs. Additionally, the depreciation of the
equipment was evaluated considering a project life of 10 years. The mass and energy balances
from the simulation procedure were used as a starting point for the economic assessment using
the software Aspen Process Economic Analyzer v8.0 (Aspen Technology, Inc, USA). Raw
material and utilities costs are the parameters that have the greatest influence in the production
costs. Biomass costs were evaluated considering two parameters: the biomass purchase cost
(depending on the location of the collection centers) and the transportation cost of biomass from
the collection center to the processing plant. The utilities costs are linked to the heating and
cooling requirements of the process, which are obtained from the energy balance in the software
Aspen Energy Analyzer (Aspen Technology, Inc., USA).
The transportation cost of the raw material is limited by the biomass availability and the
distance between the collection center and processing plant. Biomass availability influences
directly the process scale of the proposed scenarios. The amount of raw material that can be
used in the processing plant was calculated as the sum of the maximum capacity of each
collection center. The feedstock availability in each department define the collection center
capacity. However, some departments have higher biomass availability than others because of
the large cultivation area of the crop. These departments have higher contribution to the total
Page 79
Hydrogen Production through Gasification and Dark Fermentation 79
amount of available biomass. However, as mentioned in chapter 3, fractions above the 50% of
the total biomass production in each department cannot be used as raw material in the
processing plant due to the logistics issues.
Another important parameter in the evaluation of the economic performance of the hydrogen
production is the distance between the collection centers and the processing plant. The hydrogen
production through gasification (scenario 1) is the process scheme with the lower raw material
(biomass and reagents) requirements in comparison to other scenarios. Wood residues and
calcium oxide are the main inputs of this scenario. It was considered that the most important
parameter in the economic behavior of the hydrogen production was the biomass cost; therefore,
the purchase cost of CaO was not deeply analyzed and its price was obtained from different
databases such as ICIS Princing and Alibaba [142], [143]. Hence, the effect of the biomass cost
in the economic profitability of the hydrogen production was assessed considering that the base
case for the evaluation was the scenario 1. The region or department that evidence the lowest
hydrogen production cost was selected as suitable zone for the plant. The results from this
analysis can be extrapolated to the other scenarios and thus, the economic performance of each
one was calculated based on the selected location in the scenario 1.
Subsequently, the economic profitability in terms of the Net Present Value (NPV) was assessed
in the different proposed scenarios. Net Present Value (NPV) represents the amount of money,
which must be available at the present time considering the profit on the project, pay-off
investment, and normal interest on the investment [144]. The production cost of hydrogen and
further by-products (electricity, ethanol, acetic acid and butyric acid) were determined and the
influence of the process scale (plant capacity) in the production costs was assessed.
Additionally, the effect of the fluctuations in the market price of the main products and reagents,
in the economic profitability of the proposed scenarios were evaluated. The main data used in
the economic assessment of the proposed scenarios is presented in Table 4-7.
Table 4-7. Utilities, reagents and products market prices
Component Price Units
Sulfuric Acid 0.094a USD/Kg
Sodium Hydroxide 0.35 a USD/Kg
Calcium Hydroxide 0.05 a USD/Kg
Calcium Oxide 0.062 a USD/Kg
Sodium Sulfate 0.077 a USD/kg
Fuel Ethanol 0.68c USD/L
Acetic Acid (86%w/w) 0.595 a USD/kg
Page 80
80 Hydrogen Production through Gasification and Dark Fermentation
Butyric Acid (94%w/w) 0.2 a USD/kg
Hydrogen 4.47b USD/Kg
Water 1.252 d USD/m3
Electricity 0.1d USD/kWh
Iodine 30 a USD/kg
Polyethylene glycol 2 a USD/kg
Propane (Refrigerant) 2.94 a USD/kg
High P. Steam (105 bar) 9.86 d USD/ton
Mid P. Steam (30 bar) 8.18 d USD/ton
Low P. Steam (3 bar) 1.57 d USD/ton
a Prices based on Alibaba International Prices [142]
b Based on hydrogen price projections [145]
c Ethanol price based on statistics of the Biofuels National Federation [146]
d Prices adapted to the Colombian context [82], [147]
4.7.2 Energy Analysis
The net energy balance is a sustainability parameter that represents the relation between the
produced and required bioenergy in the evaluated scenarios, based on the amount of energy that
can supply the bioenergy products in order to mitigate the energy requirements of the processes.
The net energy balance (𝑬𝒏) of the process involves two components: first, the energy content
of the bioenergy products in each scenario (i.e. hydrogen (𝑬𝑯𝟐), ethanol (𝑬𝑬𝒕𝑶𝑯) and electricity
(𝑬𝒘), among others) and the energy needs of the process (i.e. heating requirements (𝑬𝒉𝒆𝒂𝒕𝒊𝒏𝒈),
power supply (𝑬𝒑𝒐𝒘𝒆𝒓), among others). Positive values indicate that the process is energically
sustainable, since the energy content of the products can fulfil the energy requirements of the
process. Negative values means that the energy requirements are higher than the produced
energy and thus, the process is energetically deficient.
𝐸𝑛 = ∑ 𝐸𝑜𝑢𝑡𝑝𝑢𝑡𝑠 − ∑ 𝐸𝑖𝑛𝑝𝑢𝑡𝑠 (4-16)
Considering the main bioenergy products from the evaluated scenarios and their respective
energy requirements, Eq. (4-16) can be expressed as
𝐸𝑛 = 𝐸𝐻2+ 𝐸𝐸𝑡𝑂𝐻 + 𝐸𝑤 − 𝐸ℎ𝑒𝑎𝑡𝑖𝑛𝑔 − 𝐸𝑝𝑜𝑤𝑒𝑟 (4-17)
The energy content of the products can be calculated from the amount of hydrogen and ethanol
that was produced in the simulation procedure and the heating value of each product. The
heating value is the energy released as heat when a compound undergoes complete combustion.
The energy content of the products can be calculated with the following expression.
Page 81
Hydrogen Production through Gasification and Dark Fermentation 81
𝐸𝑝𝑟𝑜𝑑𝑢𝑐𝑡 = �̇�𝑝𝑟𝑜𝑑𝑢𝑐𝑡 ∗ 𝐿𝐻𝑉𝑝𝑟𝑜𝑑𝑢𝑐𝑡 (4-18)
Where �̇�𝒑𝒓𝒐𝒅𝒖𝒄𝒕 is the mass flow of the product in kg/h and 𝑳𝑯𝑽𝒑𝒓𝒐𝒅𝒖𝒄𝒕 is the heating value of
the product in MJ/kg. The amount of produced energy from the synthesis gas, which is used as
fuel in a gas engine, can be calculated considering the engine efficiency (ƞ) as mentioned in
section 4.6.4, the syngas flux �̇�𝒔𝒚𝒏𝒈𝒂𝒔 and the heating value of the syngas. The heating value of
the syngas is the sum of the heating value of the gaseous species by the mass fraction of the
specie. The equation that describes the electricity generation from the synthesis gas is shown
below.
𝐸𝑤 = �̇�𝑠𝑦𝑛𝑔𝑎𝑠 ∗ 𝐿𝐻𝑉𝑠𝑦𝑛𝑔𝑎𝑠 ∗ 𝜂𝑒𝑛𝑔𝑖𝑛𝑒 (4-19)
The heating requirements (𝑬𝒉𝒆𝒂𝒕𝒊𝒏𝒈) were taken from the pinch evaluation of the process using
the educational software Hint, which uses the pinch methodology to calculate the exchanger
network of a process [148]. The software Hint calculates the energy requirements of the process
in terms of the heating and cooling utilities. In the other hand, the amount of power (𝑬𝒑𝒐𝒘𝒆𝒓)
required in the process was calculated from the energy balance in the simulation procedure.
Additionally, the energy performance of the scenarios were evaluated based on two criteria.
First, the energy efficiency of the process considering as only product the hydrogen (Eq. 4-20)
and secondly, the energy efficiency taking into account all the bioenergy products along with
the energy requirements (𝑬𝒏) (Eq. 4-21).
𝜂 =𝐸𝐻2
�̇�𝑏𝑖𝑜𝑚𝑎𝑠𝑠 ∗ 𝐿𝐻𝑉𝑏𝑖𝑜𝑚𝑎𝑠𝑠 (4-20)
𝜂 =𝐸𝑛
�̇�𝑏𝑖𝑜𝑚𝑎𝑠𝑠 ∗ 𝐿𝐻𝑉𝑏𝑖𝑜𝑚𝑎𝑠𝑠 (4-21)
Where �̇�𝒃𝒊𝒐𝒎𝒂𝒔𝒔 is the mass flow of biomass (kg/h) and 𝑳𝑯𝑽𝒃𝒊𝒐𝒎𝒂𝒔𝒔 is the heat of combustion
of the raw material (MJ/kg).
The lower heating value of the raw material can be calculated from the higher heating value
(HHV) of biomass fuels on dry basis as shown in Eq. (4-22). HHV was determined
experimentally or as a function of the proximate analysis as described in Annex A.
𝐿𝐻𝑉 = 𝐻𝐻𝑉 − ℎ𝑓𝑔 (𝐹𝑤𝑎𝑡𝑒𝑟
𝐹𝑓𝑒𝑒𝑑𝑠𝑡𝑜𝑐𝑘)
(4-22)
Where 𝒉𝒇𝒈 is the entalphy of vaporization of water (approx. 2.26 MJ/Kg) [149]. The ratio
(𝑭𝒘𝒂𝒕𝒆𝒓
𝑭𝒇𝒆𝒆𝒅𝒔𝒕𝒐𝒄𝒌⁄ ) is the relation between the moisture content of biomass and the amount of
feedstock.
Page 82
82 Hydrogen Production through Gasification and Dark Fermentation
4.7.3 Environmental Assessment
Two methodologies were used to evaluate the environmental performance of the hydrogen
production through gasification and dark fermentation in the different proposed scenarios. First,
the Green House Gases (GHG) balance was used to calculate the CO2 emissions and then, the
potential environmental impact (PEI) was evaluated using the Waste Reduction Algorithm
(WAR).
Green House Gases (GHG) balance is the net amount of greenhouse gases emitted by a process
or product, considering all emissions and sinks along a supply chain [150]. The activities and
processes involved in the calculation of the GHG emissions are limited, depending on the
system boundaries. In this study, only the gate-to-gate process boundary (i.e, the transformation
of raw material into products) was considered.
In the other hand, the Waste Reduction Algorithm WAR evaluates processes in terms of
potential environmental impacts. The PEI balance is a quantitative indicator of the
environmental friendliness or unfriendliness of a process [151]. WAR algorithm evaluates the
PEI in terms of eight categories: Human toxicity by ingestion (HTPI), human toxicity by dermal
exposition or inhalation (HTPE), aquatic toxicity potential (ATP), Global warming (GWP),
Ozone depletion potential (ODP), Photochemical oxidation potential (PCOP) and acidification
Potential (AP).
Page 83
Hydrogen Production through Gasification and Dark Fermentation 83
5. Results and Discusion
5.1 Overview
In this chapter the main results of this thesis are presented. First, the results from the
physicochemical characterization of the Pinus Patula (PP) and Coffee Cut-Stems (CCS) in
terms of the chemical composition, proximate and elemental analysis are presented. Then, the
experimental results from the gasification and dark fermentation procedures are evaluated and
discused. The gasification of both raw material involved two components: a normal and a
catalyzed downdraft gasification as described in sections 4.2 and 4.3. Additionally, some
experimental runs were performed in a fluidized-bed gasifier as part of a short research stay
conducted at the Maryland University as can be noticed in Annex B. Subsequently, the results
from the dark fermentation are presented based on the experimental procedure described in
section 4.5. The results from the experimental procedure were used as starting point in the
simulation of the stand-alone and biorefinery scenarios using both raw material. The results
from the simulation procedure were compared in terms of the productivity, economic
profitability, energy efficiency and environmental performance of the evaluated scenarios.
5.2 Physicochemical characterization of lignocellulosic
biomass
Both raw material were characterized in terms of the chemical composition, proximate and
elemental analysis to evaluate the potential use of these residues in the production of hydrogen.
The results related to the characterization of the feedstock have great importance to understand
the mechanisms of the chemical conversion, and further optimization of the lignocellulosic
residues.
There are hundreds of reports on the chemical composition, proximate and elemental analysis of
different biomass. Comparing the data from one author to another, it evidences that the
analytical procedures are different from lab to lab, and a complete description of the procedure
is not provided. For example, many reports do not describe if the samples were pre-extracted
Page 84
84 Hydrogen Production through Gasification and Dark Fermentation
with some solvents before analysis. Others do not follow a published procedure, so comparison
of data is not suitable. Nevertheless, data reported in literature related to the chemical
characterization of PP and CCS was compared with those obtained in this thesis.
- Pinus Patula (PP)
The results from the physicochemical characterization of PP are presented in Table 5-1. The
high hollocellulose content of the raw material suggests the potential use of this residue for the
production of different platforms such as fermentable sugars that can be used to produce
hydrogen through fermentative processes, and synthesis gas to produce directly bioenergy
and/or hydrogen through thermochemical methods. However, due to its high lignin content, this
residue requires a prior pretreatment stage in order to increase the biodegradability of
lignocellulosic biomass to obtain fermentable sugars able to produce bioenergy and biochemical
products. The wood extractives are mainly composed of resins, which are molecules of high
molecular weight (12 – 80 carbon bonds). They are brittle, friable and aromatic substances,
insoluble in water and soluble in alcohol, ether and other organic solvents. The main application
of these oleoresins are in the chemical, pharmaceutical, paper, soap, paint, rubber, adhesives and
insecticide industry [152]. The ash content is the remaining inorganic part of wood that cannot
be combusted. For Pinus Patula, it is below 1%. A high ash content makes the wood material
less desirable as fuel, because a considerable fraction cannot be converted into energy [153].
Table 5-1. Physicochemical characterization of Pinus Patula
Moisture Content (%wt) 9.21
Chemical Composition (%wt dry)
Cellulose 44.78
Hemicellulose 23.75
Lignin 20.22
Extractives 11.0
Ash 0.25
Proximate Analysis (%wt dry)
Volatile Matter 82.14
Fixed Carbon 17.64
Ash 0.23
Elemental Analysis (%wt dry)
Carbon 49.78
Hydrogen 6.03
Oxygen 44.19
HHVa (MJ/kg) 18.48
a HHV = Higher Heating Value
Page 85
Hydrogen Production through Gasification and Dark Fermentation 85
The proximate and elemental analysis are widely used to describe the behavior of the gaseous,
liquid and solid components that are obtained through thermochemical methods. From the
proximate analysis, the amount of gaseous species (volatile matter) can be calculated and the
solid fraction (fixed carbon), mainly char, can be determined. The high volatile matter content
of the PP evidences its high potential to produce bioenergy through the direct conversion of the
raw material. Char and ash are the main solid residues obtained from a thermochemical process,
which constitute the fixed carbon and ash fractions in the proximate analysis; therefore, low
content of char and ash are desirable since greater proportion of wood is converted in bioenergy.
The calorific value of wood is related to its chemical composition and varies between 17 and
20 MJ/kg for oven-dried wood [153]. Major elements contributing to the calorific value are
carbon, hydrogen, nitrogen, oxygen and sulphur. Elemental analysis can be used to describe
biomass fuels, to determine their calorific values [154] and their expected impact on the
environment. Table 5-2 summarizes the physicochemical characterization of some types of
wood reported in literature. It is evidence that the results from every characterization varies
depending on the evaluated conditions and the type of residue.
Table 5-2. Physicochemical characterization of different types of wood reported in literature.
a Chemical composition of the biomass was evaluated in dry and extractives-free basis. b The chemical composition of the wood was not determined by authors
Chemical
Composition (%wt)
Softwood
(Average) [155] Hardwood
(Average) [155]
Block wood [98]
Humidity NRa NRa 12.16
Cellulose 45.8 45.2 NRb
Hemicellulose 24.4 31.3 NRb
Lignin 28.0 21.7 NRb
Extractives NRa NRa NRb
Ash 1.7 2.7 NRb
Proximate Analysis (%wt dry)
Volatile Matter 70.0 72.3 83.32
Fixed Carbon 28.1 25.0 14.59
Ash 1.7 2.7 2.09
Elemental Analysis (%wt dry)
Carbon 52.1 48.6 46.90
Hydrogen 6.1 6.2 6.07
Oxygen 41.0 41.1 43.99
HHV (MJ/Kg) 20.0 18.8 18.26
Page 86
86 Hydrogen Production through Gasification and Dark Fermentation
- Coffee Cut-Stems (CCS)
Table 5-3 presents the results of the physicochemical characterization of CCS. High
holocellulose (cellulose and hemicellulose) and low lignin content provide a suitable scenario
for the production of fermentable sugars aiming to produce bioenergy and/or biochemicals
because of the high biodegradability of this coffee residue [84]. On the other hand, CCS has
higher ash content than PP, which affects its calorific value. Despite this fact, its energy content
is very high and it can be used directly as fuel in combustion processes or as mentioned before,
in the bioenergy and/or biochemicals production. The behavior of the proximate and elemental
analysis for both raw material (PP and CCS) remains almost unchanged as can be compared in
Table 5-1 and 5-3, whereas their calorific value differ appreciably. There is not enough
information about CCS reported in literature; however, some authors have studied the
production of different bioernergy and/or biochemical from CCS and thus, the characterization
of CCS is performed [82], [156].
Table 5-3. Physicochemical characterization of Coffee Cut-Stems
a HHV = Higher Heating Value
a Chemical composition was not determined by authors
This Thesis Ortega et al., [156]
Moisture Content (%wt) 8.7 11.44
Chemical Composition (%wt dry)
Cellulose 40.39 NRb
Hemicellulose 34.01 NRb
Lignin 10.13 NRb
Extractives 14.18 NRb
Ash 1.27 NRb
Proximate Analysis (%wt dry)
Volatile Matter 82.15 83.14
Fixed Carbon 16.78 14.57
Ash 1.07 2.29
Elemental Analysis (%wt dry)
Carbon 48.21 51.2
Hydrogen 5.61 5.6
Oxygen 45.81 43.2
HHV (MJ/Kg) 18.25 17.52
Page 87
Hydrogen Production through Gasification and Dark Fermentation 87
5.3 Experimental Procedure
In this section, a detailed description of the results obtained from the gasification and dark
fermentation of both raw material is presented. The gasification procedure involves two
components: First, the gasification was carried out using CCS and PP as raw material and air as
gasifying agent. Subsequently, the results from the normal gasification were compared with the
gasification using an adsorbent (CaO) aiming to improve the hydrogen selectivity in the
synthesis gas. On the other hand, the results from the dark fermentation procedure involve the
production of fermentable sugars from both raw material through different treatment methods
such as acid hydrolysis and enzymatic saccharification, the formation of hydrogen and other
metabolites using different substrate sources i.e. pure sugars (glucose and xylose) and
hydrolysates from the pretreatment methods.
5.3.1 Gasification
The results from the gasification procedure are divided in two sections. First, the concentration
profiles of the generated gaseous species are presented for different experimental runs in the
pilot-scale gasifier. Then, the comparison of the gasification performance without catalyst and
with different catalyst loads is assessed based on the syngas composition.
5.3.1.1 Air Gasification of CCS and PP
- Coffee Cut-Stems (CCS)
Figure 5-1 presents the results from the CCS gasification for three experimental runs: CCS-1,
CCS-2 and CCS-3. It can be evidence that the concentration profiles of the three experimental
runs (CCS-1, CCS-2 and CCS-3) changed throughout the gasification time, especially in the
amount of generated hydrogen, carbon monoxide and carbon dioxide. An average gasification
temperature (850°C) was kept constant in all the experimental procedures. However, the
gasification time varied in each experimental run: CCS-1 was monitored for 90.5 min, CCS-2
for 104.9 min whereas CCS-3 for 64.6 min. The portable gas analyzer is able to detect the
composition of the synthesis gas every 5 seconds, store it and then, plot the composition of the
synthesis gas vs the gasification time (see, Figure 5-1). The difference between the gasification
times from one run to the other is related to the conversion of the wood materials to the
synthesis gas (see, Table 5-4). The highest CCS conversion to syngas (88.2%) was obtained in
the experimental run CCS-2, from which an average hydrogen, carbon monoxide and methane
concentration of 15.6, 14.4 and 3.1% was determined, respectively. However, the highest
hydrogen (18.9%) and carbon monoxide (16.9%) concentration were generated from the
experimental run CCS-1, which had a lower CCS conversion (70.8%). The experimental run
Page 88
88 Hydrogen Production through Gasification and Dark Fermentation
CCS-3 had the lowest biomass conversion to syngas, which it was evidenced in the high amount
of remaining char and ash from the gasification procedure accounting for the 34.7% of the total
CCS fed to the gasifier.
Table 5-4. Global mass balance of the experimental gasification runs using CCS as raw material
Experimental
Run
Conversion to
syngas
CCS-1 70.8%
CCS-2 88.2%
CCS-3 65.5%
Figure 5-1. Concentration profiles of the different gaseous species obtained from the pilot-scale
gasification of CCS.
CCS-1
CCS-2
CCS-3
Page 89
Hydrogen Production through Gasification and Dark Fermentation 89
The most important fuel species in the syngas are hydrogen, carbon monoxide and methane.
High concentration of hydrogen and carbon monoxide were obtained from the downdraft
gasification of CCS using air as gasifying agent as presented in Table 5-5. The hydrogen
content varies from 15 – 20% and the carbon monoxide from 11 – 18%, based on the data
obtained from the three experimental runs. According to this, the generated syngas has a great
energy potential to be used as fuel in a gas engine for the electricity generation because of the
high H2/CO ratio. Despite that the methane content is relative low (2 – 4%), it can contribute to
the relative high calorific value of the synthesis gas as can be observe in Table 5-5. Despite the
high hydrogen content, the yield of syngas is relative low compared to other literature reports
depending on the syngas concentration. Lv et al., [43] evaluated the production of hydrogen-rich
gas using air and oxygen/steam as gasifying agents in a downdraft gasifier. As a result, the
synthesis gas yield between 0.88 and 0.91 Nm3 kg biomass was obtained using air as gasifying
agent and pine wood as feedstock.
Table 5-5. Composition and calorific value of the generated syngas from CCS
Syngas Components Composition (%mol)
Hydrogen 15 -20 %
Carbon Monoxide 11 – 18%
Methane 2 – 4%
Calorific Value (Mj/kg) 4 – 5.3
Gas flux (Nm3/h) 6.77 – 10.37
Gas Yield (Nm3/kg wood) 0.62 – 0.94
- Pinus Patula (PP)
Figure 5-2 presents the concentration profiles of the main gaseous species of the synthesis gas
from the PP gasification. As in the case of the CCS gasification, three experimental runs using
PP as raw material with an average temperature of 850°C were carried out. The gasification
time using PP as raw material was lower than the CCS gasification: PP-1 was monitored for
62.5 min, PP-2 for 47.1 min and PP-3 for 62.6 min. The process performance was evaluated
based on the conversion of PP to syngas and the amount of remaining char and ash (see, Table
5-6). The highest conversion of the three experimental runs was obtained in the PP-1 (74.5%)
and the lowest in the PP-2 (54.5%). The use of PP as raw material for syngas production has a
low conversion compared to the gasification using CCS. Despite the similar trend of the
proximate analysis in both raw material, the amount of remaining char and ash in the PP case is
higher than in the CCS case. Another posible explanation related to the difference in the
gasification time and the wood conversion could be the density of both materials. Hardwood
(CCS) has higher density than softwood (PP); therefore, the produced charcoal lasts longer and
Page 90
90 Hydrogen Production through Gasification and Dark Fermentation
light better. In this sense, the longest gasification times and the highest conversion were
obtained using CCS as raw material.
Table 5-6. Composition and calorific value of the generated syngas from PP
Experimental
Run
Conversion
to Syngas
PP-1 74.5%
PP-2 54.5%
PP-3 68.2%
Figure 5-2. Concentration profiles of different gaseous species obtained from the pilot-scale
gasification of PP.
PP-1
PP-2
PP-3
Page 91
Hydrogen Production through Gasification and Dark Fermentation 91
Moderate hydrogen and carbon monoxide content was obtained from the PP gasification. The
hydrogen concentration varies from 13 – 17% and in the same way, the carbon monoxide from
13 – 16%. When comparing the composition of the PP syngas with that obtained from CCS,
higher hydrogen and carbon monoxide content were obtained from the CCS gasification
because of the high charcoal reactivity in the CCS case, which implies its great potential to be
implementated as fuel in the energy generation. This can be also evidenced in the calorific value
of the generated syngas. Whereas the CCS syngas has an energy content between 4 to 5.3
Mj/kg, PP syngas has a lower energy content ranging between 3.5 and 4.3 Mj/kg as evidenced
in Table 5-7. However, the syngas yield using PP (1.30 Nm3 kg-1 wood) as feedstock is higher
than in the CCS case (0.94 Nm3 kg-1 wood). Despite the syngas yield, there must be a tradeoff
between the heating value and the flux of the generated syngas in order to obtain the highest
energy efficiency in the gasification procedure.
Table 5-7. Composition and calorific value of the generated syngas from CCS
Syngas Components Composition (%mol)
Hydrogen 13 – 17%
Carbon Monoxide 13 – 16%
Methane 2 – 4%
Calorific Value (Mj/kg) 3.5 – 4.3
Gas Flux (Nm3/h) 10.94 – 14.31
Gas Yield (Nm3/kg wood) 0.99 – 1.30
5.3.1.2 Effect of CaO in the downdraft gasification
Tables 5-8 and 5-9 present the results of the CCS and PP gasification using CaO. Different
adsorbent loads were used to evaluate the effect of CaO in the syngas composition as mentioned
previously in section 4.3. Two experimental runs (with 10 and 20%wt. CaO) for CCS and one
(10%wt CaO) for PP were carried out. Higher CaO loads and more PP experimental runs were
not considered in this thesis due to the unavailability of wood chips (both for CCS and PP).
By increasing the CaO load, the hydrogen and carbon dioxide content raises while the carbon
monoxide content is reduced as evidenced in Tables 5-8 and 5-9. The use of CaO as adsorbent
in the biomass gasification improves the hydrogen content in the syngas due to the promotion of
the Water Gas-Shift (WGS) reaction (Eq. 5-1) [106]. This behavior can be also evidenced in the
reduction of the CO to produce more hydrogen in the WGS reaction. Higher content of CO2 was
obtained because of the CO2 release from CaO. This can be explained since the gasification
procedures were carried out at high temperatures (850°C), which is unfavorable for the CO2
absorption, in terms of thermodynamic equilibrium, because of the exothermic nature of CaO
carbonation reaction [157]. In this sense, the reverse reaction (calcination) is favored, which
Page 92
92 Hydrogen Production through Gasification and Dark Fermentation
causes more CO2 content in the synthesis gas [158]. Another drawback of the use of high
temperatures in the air gasification is the reduction in the hydrogen and carbon monoxide
content due to the high reactivity of char with air at a high equivalence ratios (ER) [159]. On the
other hand, the concentrations of CH4 remained constant at different CaO loads. As a result,
quicklime had no apparent enhancing effect on the air gasification of small molecular
hydrocarbons such as methane [159].
𝐶𝑂 + 𝐻2𝑂 ↔ 𝐶𝑂2 + 𝐻2 (5-1)
Table 5-8. Effect of the CaO in the synthesis gas composition from CCS gasification
Syngas Composition (%mol) Without CaO 10%wt. CaO 20%wt. CaO
Hydrogen 13.49 14.52 15.7
Carbon Monoxide 15.98 12.36 10.83
Methane 2.89 2.32 2.85
Carbon Dioxide 11.15 12.69 14.12
Energy Content (Mj/kg) 3.85 3.38 3.5
Table 5-9. Effect of the CaO in the synthesis gas composition from PP gasification
Syngas Composition (%mol) Without CaO 10%wt. CaO
Hydrogen 13.95 15.81
Carbon Monoxide 14.95 13.41
Methane 2.69 3.21
Carbon Dioxide 10.39 13.1
Energy Content (Mj/kg) 3.7 3.94
As can be evidenced from the results in Tables 5-8 and 5-9, the variation in the hydrogen
content from the gasification with and without CaO is relative low for both raw material, which
implies that hydrogen is obtained mainly from the thermal cracking of biomass. Additionally,
increasing the CaO load resulted in improvement of the calorific value of the generated syngas;
however, the difference between the energy content of the syngas in the experimental runs is
relative low. This can be explained since high CaO loads increase the hydrogen content but
decrease the carbon monoxide content, and subsequently, changing the energy content of the
syngas. Based on the previous statements, a novel and more highly efficient catalyst/adsorbent
should be used to obtain higher H2 yields. Although, the implementation of CaO as adsorbent to
increase the hydrogen production using air gasification can improve the economic profitability
of the process because of the high availability and low purchase price of CaO.
Page 93
Hydrogen Production through Gasification and Dark Fermentation 93
5.3.2 Dark Fermentation
The main results of the dark fermentation procedure were divided in two sections: the
pretreatment of both raw material (acid hydrolysis, detoxification and enzymatic
saccharification) and the fermentation of pure sugars and hydrolysates from the pretreatment
stage. Fermentable sugars from the pretreatment stage were quantified in terms of glucose,
xylose, galactose, arabinose, mannose and furfural. Additionally, the detoxification yield and
sugar degradation in the detoxification procedure were calculated.
Sugars yield, gaseous species content and secondary metabolites concentration from the dark
fermentation process were determined based on different analytical methods. Pure sugars
(sucrose, glucose and xylose), acid and enzymatic hydrolysates were used as substrate in the
hydrogen production. The produced hydrogen from the dark fermentation was measured using
the water displacement method and a portable gas analyzer. Secondary metabolites were
quantified using High Performance Liquid Chromatography (HPLC) and the determination of
reducing sugars concentration was performed using the dinitrosalicylic acid (DNS) method.
5.3.2.1 Acid Hydrolysis
One of the main advantages of the dilute-acid hydrolysis is that the hemicellulose fraction of the
raw material can be easily and selectively extracted to obtain a xylose-rich hydrolysate, which
can be used as substrate for different bioconversion processes [107]. Table 5-10 presents the
results from the dilute-acid hydrolysis in terms of the evaluated monosaccharides and furfural.
After the mild pretreatment, the monosaccharides yield in the PP and CCS hydrolysate have no
similar trend. In the PP case, the sugars yield follows the order mannose > glucose > xylose >
galactose > arabinose. On the other hand, the sugars yield for CSS follows the order xylose >
mannose > glucose > galactose > arabinose. High content of hexoses were obtained from the
acid hydrolysis of PP whereas high content of pentoses were obtained from CCS hydrolysis.
Sykes et al., [160] developed the hemicellulose characterization of eight lignocellulosic raw
materials considering softwood, hardwood and agroindustrial residues as raw material.
Softwood (PP) has the potential to produce high amount of glucose, galactose, arabinose and
mannose; meanwhile hardwood (CCS) can be used to obtain high content of glucose and xylose,
mainly. From Table 5-10, it is evidenced that the CCS hydrolysate has the highest xylose
concentration (10.72g/100g substrate) in comparison to the PP hydrolysate (3.44g/100g
substrate), since CCS has higher hemicellulose content and thus, xylose can be obtained as main
fermentable sugar. However, higher hexoses (glucose, mannose and galactose) content were
obtained from the PP hydrolysate due to the low hemicellulose content of the lignocellulosic
material. Small amounts of arabinose were detected in the hydrolysates after dilute-acid
Page 94
94 Hydrogen Production through Gasification and Dark Fermentation
treatment, which indicates that the pentoses were sensitive to the acid hydrolysis conditions and
had been degraded to furfural [109].
Table 5-10. Sugars yield after the dilute-acid hydrolysis
Sample
Glucose
(g/100 g
substrate)
Xylose
(g/100 g
substrate)
Galactose
(g/100 g
substrate)
Arabinose
(g/100 g
substrate)
Mannose
(g/100 g
substrate
Furfural
(g/L)
PP 4.96±0.03 3.44±0.03 2.31±0.04 1.02±0.03 8.55±0.05 0.53±0.01
CCS 2.30±0.07 10.72±0.06 1.44±0.10 0.73±0.1 2.71±0.12 0.55±0.01
Based on the results from the sugars yield of the acid hydrolysis, the monosaccharides
conversion was evaluated considering the potential concentration of fermentable sugars that can
be obtained from both raw material (see, Eq. 4-4). The potential concentration of fermentable
sugars was calculated considering the polymer concentration (cellulose and hemicellulose,
mainly) in the raw material based on Eq. 4-5. Table 5-11 presents the conversion of the main
monosaccharides that constitute the cellulose and hemicellulose matrix in the dilute-acid
hydrolysis of both raw material.
Table 5-11. Monosaccharides conversion in the dilute-acid hydrolysis
Sample
Glucose
Conversion
(%)
Xylose
Conversion
(%)
Galactose
Conversion
(%)
Arabinose
Conversion
(%)
Mannose
Conversion
(%)
PP 19.92±0.13 13.79±0.12 81.52±1.47 85.43±2.57 96.33±0.57
CCS 10.22±0.30 47.73±0.25 35.51±2.57 43.12±5.80 21.36±0.91
The type and amount of reaction byproducts are also important, because some compounds can
limit the viability of hydrolysates as fermentation media. In this sense, special attention must be
taken with the production of furfural, because this byproduct can cause inhibitory or toxic
effects in microorganisms. One of the drawbacks of using sulfuric acid as hydrolysis agent is
the formation of these toxic compounds; therefore, an additional pretreatment method should be
implemented aiming to remove totally or partially these compounds from the hydrolysate.
5.3.2.2 Detoxification
After the dilute-acid treatment, the liquid fraction was submitted to overliming process, which
involves the addition of Ca(OH)2 to remove the produced toxic compounds in the acid
hydrolysis. Table 5-12 presents the yields of monosaccharides and furfural after the overliming
process. The furfural content in the hydrolysate was reduced for both raw material, when
comparing to the results of the dilute-acid hydrolysis (see, Table 5-10). However, the highest
detoxification yield was obtained for CCS hydrolysate (73.3%) in contrast to detoxification
Page 95
Hydrogen Production through Gasification and Dark Fermentation 95
yield of 45.8% in the PP hydrolysate as presented in Table 5-13. Despite the high reduction of
furfural after the overliming process, degradation of sugars was also evidenced. Higher sugars
degradation was presented in the PP hydrolysates than CCS as observed in Table 5-14. Among
the quantified sugars, arabinose and galactose were the monosaccharides that evidenced the
highest degradation yield since they were the sugar fractions with the lowest production yield
from the acid hydrolysis.
Table 5-12. Sugar and furfural content of the hydrolysate after overliming with Ca(OH)2
Sample
Glucose
(g/100 g
substrate)
Xylose
(g/100 g
substrate)
Galactose
(g/100 g
substrate)
Arabinose
(g/100 g
substrate)
Mannose
(g/100 g
substrate)
Furfural
(g/L)
PP 3.93±0.09 2.64±0.07 1.64±0.05 ND 7.42±0.22 0.29±0.01
CCS 2.0±0.01 9.46±0.05 1.18±0.01 0.56±0.0 2.32±0.01 0.15±0.01
Table 5-13. Detoxification yield from PP and CCS hydrolysates
Sample Yield (%)
PP 45.78±0.84
CCS 73.3±0.09
The results obtained in this thesis are in concordance with other detoxification studies of
different lignocellulosic residues. Martinez et al., [161] studied the effect of the Ca(OH)2
addition in the production of ethanol from sugarcane bagasse hydrolysates. Furan compounds
reduction up to 69% and sugar degradation up to 17% were obtained at 60°C, pH 10 and 30
min. Horváth et al., [112] evaluated the effect of overliming in Spruce wood hydrolysates in
order to produce ethanol using S. Cerevisiae. As a result, the reduction of furan compounds was
enhanced to 59% and the sugar degradation was increased up to 15%. In this study, higher pH
value (pH 11) and detoxification time (3 hours), but lower temperature (30°C) were used in the
detoxification procedure, which makes the process uneconomically since longer times are
required to obtain low furan yields.
Table 5-14. Monosaccharides degradation after the detoxification procedure
Sample Glucose (%) Xylose (%) Galactose (%) Arabinose (%) Mannose (%)
PP 20.75±1.65 23.18±1.94 29.09±2.43 100.0±0.0 13.28±2.83
CCS 13.0±3.11 11.96±0.94 18.01±5.78 22.63±11.3 14.41±3.50
Page 96
96 Hydrogen Production through Gasification and Dark Fermentation
5.3.2.3 Enzymatic Saccharification
The solid fraction from the dilute-acid hydrolysis was submitted to the enzymatic
saccharification using Celluclats 1.5L and a multienzyme complex Viscozyme. Table 5-15
presents the monosaccharides yield and the furfural concentration of the PP and CCS
hydrolysates after the enzymatic saccharification. The hydrolysates gave none or very low
yields of pentoses (e.g. xylose) since the main role of the acid pretreatment is to solubilize
hemicellulose from biomass and to make cellulose more accessible for cellulases [162]. Glucose
and mannose have the highest yields from the enzymatic saccharification owing to the fact that
the enzymes used in the procedure were able to degrade the cellulose fraction. On the other
hand, higher content of glucose and mannose was obtained from the CCS hydrolysate in
comparison to PP case. Despite the high lignin content of the CCS (approx. 40%), the acid
pretreatment has a positive effect in the delignification of the raw material, increasing the
available cellulose to be degraded by cellulase enzymes. The hexose sugars from PP have a
relative high yield despite the observation of Soudhamn et al., [162], which showed that the acid
pretreatment did not benefit the subsequent enzymatic hydrolysis of softwood substrates. The
furfural concentration in both hydrolysates was very low since most of the remaining furfural in
the solid fraction, after the acid pretreatment, was washed prior the enzymatic saccharification.
Table 5-15. Sugar and furfural content after the enzymatic hydrolysis
Sample
Glucose
(g/100 g
substrate)
Xylose
(g/100 g
substrate)
Galactose
(g/100 g
substrate)
Mannose
(g/100 g
substrate)
Furfural
(mg/L)
PP 6.77±0.63 ND 0.17±0.04 3.56±0.37 4.91±0.22
CCS 7.56±1.25 0.20±0.01 0.17±0.04 3.51±0.30 3.33±0.45
Normark et al., [109] evaluated the effect of different acid pretreatment conditions in the
enzymatic saccharification of Scott Pine. The glucose yield obtained from the enzymatic
hydrolysis at mild conditions (2%wt H2SO4, 180°C and 6 min) varies from 0.03 to 0.06 g g-1
substrate depending of the evaluated Scott Pine fraction. Mannose was the second highest
hexose fraction that was obtained from the enzymatic hydrolysis with a yield between 0.007 and
0.009 g g-1 substrate. Low yield of pentose fractions (xylose and arabinose) were obtained
because of the hemicellulose solubilization in the acid pretreatment.
The glucose and mannose yield in this thesis are higher than those reported by Normark et al.,
[109]. This can be explained since the acid hydrolysis in this thesis was carried out with a
sulfuric acid concentration of 2%wt., 115°C and a reaction time of 3 hours. In contrast, Norwark
et al., [109] used higher temperature and lesser reaction time. High hydrolysis temperatures can
enhance the formation of toxic compounds due to the decomposition of pentose sugars to furan
Page 97
Hydrogen Production through Gasification and Dark Fermentation 97
compounds. Longer reaction times can also increase the formation of toxic compounds, but the
formation of pentose and hexose fractions is also enhanced. There should be a trade-off between
the temperature and the hydrolysis time in order to obtain the highest concentrations of sugars
and the lowest concentration of toxic compounds. As a consequence, the conditions used in this
thesis were selected.
5.3.2.4 Dark Fermentation
First, the production of the hydrogen and secondary metabolites using pure sugars (sucrose,
glucose and xylose) as substrate was assessed. Then, the behavior of the T.
Thermosaccharolyticum ATCC 7956 using acid and enzymatic hydrolysates (from the previous
pretreatment stages) as substrates in the hydrogen production was evaluated. The main products,
secondary metabolites and sugaras were monitored based on the procedure described in section
4.5.4.
- Pure sugars
From the phenotypic chart, it was evidenced that the T. Thermosaccharolyticum ATCC 7956 is
able to degrade different carbohydrates such as glucose, xylose, arabinose, mannose, galactose
and sucrose. Table 5-16 presents the sugar conversion in a set of dark fermentation experiments
using different substrates as carbon source. Sucrose had the highest sugar consumption, which it
is in agreement with other reports [117]. The microorganism prefered glucose over xylose, since
the dark fermentation using 100% glucose had a sugar conversion of 52%, whereas the
experimental test using a mixture of glucose and xylose (50% - 50%) had a sugar conversion of
35%.
Table 5-16. Sugar consumption of different experimental tests of the dark fermentation
Experimental Sets % Substrate Consumption
Sucrose 100% 90%
Glucose 100% 52%
Glucose – Xylose 75% - 25% 33%
Glucose – Xylose 50% - 50% 35%
Glucose – Xylose 25% - 75% 30%
Cao et al., [120] evaluated the performance of the T. Thermosaccharolyticum strain W16 in the
production of hydrogen using as raw material corn stover hydrolysates. Prior to the utilization of
corn stover in the production of hydrogen, various experimental tests using analytical-grade
sugars (glucose, xylose and arabinose) were carried out. When xylose was the carbon source in
the medium, consumption of this sugar was somewhat slower than consumption of glucose.
Page 98
98 Hydrogen Production through Gasification and Dark Fermentation
Glucose and xylose conversion were 73 and 69%, respectively. In contrast, lower conversion of
sugars were obtained using the T. Thermosaccharolyticum ATCC 7956 in this thesis;
nevertheless, the microorganism was able to degrade more easily sucrose and glucose than other
sugars (pentoses).
The composition of the produced gaseous species in the dark fermentation was analyzed
through a portable gas analyzer that was connected directly to the sample instrument. The
composition of the gaseous species from the different experimental tests are presented in Table
5-17. The portable gas analyzer (GASBOARD 3100-P) uses a Thermal Conductivity Detector
(TCD) in order to quantify the concentration of hydrogen in a sample with high accuracy;
however, the equipment was initially design to measure continuous flowing samples (i.e.
gasification) with a minimum flow rate of 1 L min-1. Since the dark fermentation was carried
out in a batch operation regime and the sample was collected with a 60 mL-syringe, the portable
gas analyzer was not able to detect the hydrogen concentration in the sample. There are many
reports of the production of hydrogen using T. Thermosaccharolyticum strains through dark
fermentation of pure sugar and hydrolysates; however, the analytical method used to quantify
the composition of hydrogen in the generated gas is Gas Chromatography equipped with a
thermal conductivity detector (TCD). In most of the cases, GC allows to determine the
concentration of hydrogen in mM (mmol of H2 per L) [47], [115], [119], [120]. Another factor
that may influence the detection of hydrogen from the gaseous mixture is related to the
concentration of this gaseous specie in the generated gas. According to reported data, the
hydrogen production rate (HPR) using T. Thermosaccharolyticum W16 and different substrates
(pure sugars and hydrolysates) varies between 0.25 to 0.31 liters of H2 per liter-hour. As a
comparison, the hydrogen production rate of the commercial strain T. Thermosaccharolyticum
ATCC 7956 was calculated considering a total volume of 60 mL (volume of the syringe used in
the sampling procedure) with a HPR between 0.015 to 0.018 liters of H2 per liter-hour, which it
is lower than the reported HPR for the isolated strain (T. Thermosaccharolyticum W16) and
therefore, the equipment used for the detection of the gaseous species was not able to determine
the composition of hydrogen. Besides, the headspace of the fermentation bottle was filled with
nitrogen to ensure anaerobic conditions; therefore, the hydrogen concentration could be diluted
and thus, its detection was not possible using the portable gas analyzer.
Despite that hydrogen was not detected using the portable gas analyzer, the carbon dioxide
composition from the generated gas was measured, supporting the idea that the microorganism
was able to growth in the fermentation medium, except in the medium containing the mixture
glucose – xylose (25% - 75%) (see, Table 5-17). The carbon dioxide yield of the five evaluated
medium was calculated with the same expression used to determine the hydrogen yield (see,
Eq. (4-6)). It can be evidenced that an increment in the xylose fraction as substrate, the amount
Page 99
Hydrogen Production through Gasification and Dark Fermentation 99
of carbon dioxide in the dark fermentation is enhanced. This can be explain since the
microorganism can also degrade xylose in order to produce higher concentration of carbon
dioxide than using glucose as substrate. However, this behavior does not mean that hydrogen
production is linked to the degradation of xylose by the microorganism, although many authors
have evaluated the production of hydrogen from this substrate [47], [115], [117].
Table 5-17. Concentration of the gaseous species in the fermentation medium
Experimental Sets CO2 Yield (mol
CO2/mol sugar)
Sucrose 100% 0.703
Glucose 100% 0.980
Glucose – Xylose 75% - 25% 1.083
Glucose – Xylose 50% - 50% 1.209
Glucose – Xylose 25% - 75% ND
Based on the results obtained from the gaseous phase, it was decided to evaluate the liquid
fraction of the fermentation it was evidenced that the microorganism was able to produce acetic
acid, lactic acid, ethanol and butanol. Some authors have studied the production of ethanol and
other metabolites (acetic acid, lactic acid and butyric acid) using Thermoanaerobacterium
species. Wang et al., [163] evaluated the production of cellulosic ethanol using a combination of
two strains C. thermocellum and C. thermosaccharolyticum. From the behavior of the C.
thermosaccharolyticum with xylose as carbon source, it was obtained as metabolic products
ethanol (14.5 g L-1), lactic acid (16 g L-1) and acetic acid (10 g L-1). Chimtong et al., [164]
performed the characterization of an isolated thermophilic anaerobic bacterium, T.
thermosaccharolyticum strain NOI-1. As fermentation products, ethanol (19.34 mM), acetic
acid (13.48 mM) and butyric acid (0.33 mM) were obtained. Based on the results presented in
Table 5-18 and that reported in literature, it can be considered that the main metabolic products
from the dark fermentation are acetic acid, lactic acid, ethanol and butyric acid. In this thesis,
the concentration of acetic acid, lactic acid and ethanol in the fermentation media were
measured as observed in Table 5-18. According to the results from the metabolites
quantification by HPLC, it is noteworthy that high concentration of acetic acid was dertermined
in the fermentation broth. In general, the H2 yield is directly influenced by the state of reduction
of the fermented energy source, and tends to be inversely related to the total quantity of the
reduced end products in the fermentation medium [165]. Based on this statement, the hydrogen
production using T. Thermosaccharolyticum ATCC 7956 was reduced due to most of the energy
source was directed to produce acetic acid instead hydrogen. Decreasing the amount of acetic
acid in the fermentation medium, could improve the hydrogen production [166].
Page 100
100 Hydrogen Production through Gasification and Dark Fermentation
Table 5-18. Concentration of secondary metabolites in the fermentation medium
Experimental Sets Acetic Acid (mM) Lactic Acid (mM) Ethanol (mM)
Sucrose 100% 166.2 64.4 4.67
Glucose 100% 483.5 13.6 0
Glucose – Xylose 50% - 50% 222.6 16.1 0
- Hydrolysates
In this section, three carbon sources were evaluated: Two hydrolysates obtained from the
enzymatic saccharification of CCS and PP, and one hydrolysate from the acid hydrolysis of PP.
Table 5-19 presents the conversion of sugars using the T. Thermosaccharolyticum ATCC 7956
in the three evaluated hydrolysates. The substrate conversion in both enzymatic hydrolysates is
very similar; however, the sugars conversion from the acid hydrolysate is relative low compared
to the enzymatic hydrolysates. Despite the detoxification process of the acid hydrolysate, some
toxic compounds could remain in the liquid fraction and thus, they could inhibit the substrate
consumption by the microorganism. On the other hand, the substrate consumption of the
hydrolysates, in this thesis, is lower than those reported by different authors in literature. Ren et
al., [48] evaluated the performance of the T. Thermosaccharolyticum W16 for the production of
biological hydrogen using corn stover hydrolysates after enzymatic saccharification. A substrate
consumption of 60% using corn stover hydrolysate was reached. This result is relative higher
than those obtained in this thesis (58% for PP and 53% for CCS). This can be explained since
the initial substrate concentration of the evaluated hydrolysates were lower than the reported
corn stover hydrolysate. In this thesis, an initial total reducing sugar content of 2.83 g L-1 and
2.57 g L-1 of PP and CCS hydrolysate were used, respectively. In contrast, an initial corn stover
hydrolysate concentration of 9.9 g L-1 was employed in the experimental tests reported by [48].
Cao et al., [120] evaluated the production of hydrogen using the hydrolysate from the acid
hydrolysis pretreatment as carbon source through dark fermentation. An overall substrate
consumption of 82% was obtained, which is higher than that obtained in this thesis (41%).
Table 5-19. Sugar consumption of different experimental tests of the dark fermentation
Experimental Sets % Substrate Consumption
Enzymatic Hydrolysis PP 58%
Enzymatic Hydrolysis CCS 53%
Acid Hydrolysis PP 41%
As mentioned before in the dark fermentation of pure sugars, the hydrogen content in the
generated gas was not detected. However, the carbon dioxide and nitrogen composition were
measured and thus, the CO2 yield was calculated as presented in Table 5-20. The highest CO2
yield was obtained from the CCS enzymatic hydrolysate and the lowest from the PP acid
Page 101
Hydrogen Production through Gasification and Dark Fermentation 101
hydrolysate. These results are in concordance with those presented in Table 5-19, since low
sugar conversion is linked to low substrate uptake by the microorganism and hence, its growth
is inhibited (based on the assumption that CO2 can be linked to the bacteria growth). When
comparing the CO2 yield from the fermentation with pure sugars and hydrolysates, it is
evidenced that high content of carbon dioxide was obtained from the fermentation with pure
sugars (Table 5-17). This can be explained since the formation of carbon dioxide was linked to
the consumption of xylose, and the concentration of xylose in the hydrolysates was very low.
The PP and CCS enzymatic hydrolysates (Table 5-15) are mainly composed of glucose,
whereas the PP acid hydrolysate is composed of mannose, glucose and xylose (Table 5-12).
Table 5-20. Concentration of the gaseous species in the fermentation medium
Experimental Sets CO2 Yield (mol
CO2/mol sugar)
Enzymatic Hydrolysis PP 0.101
Enzymatic Hydrolysis CCS 0.456
Acid Hydrolysis PP 0.049
The same trend of the fermentation with pure sugars was evidenced in the case of the acid and
enzymatic hydrolysates. The concentration of acetic acid from the dark fermentation using the
acid and enzymatic hydrolysates as carbon source was lower than the media containing only
glucose as substrate (see, Table 5-21). Due to the presence of different monosaccharides in the
acid and enzymatic hydrolysates, the performance of the dark fermentation was hindered. This
behavior can be also evidenced in the concentration of lactic acid, which decreases when
hydrolysates are used as carbon source in the dark fermentation.
Table 5-21. Concentration of secondary metabolites in the fermentation medium
Experimental Sets Acetic Acid (mM) Lactic Acid (mM) Ethanol (mM)
Enzymatic Hydrolysis PP 286.29 6.95 0
Enzymatic Hydrolysis CCS 281.64 7.5 0.43
Acid Hydrolysis PP 274.19 5.6 0.43
Despite that the hydrogen was not detected in the dark fermentation procedure, high
concentration of acetic acid was produced in the fermentation broth. It is noteworthy that an
acetic acid concentration of 29.01 g L-1 from the fermentation with pure sugars and a
concentration of 17.18 g L-1 from the fermentation of the enzymatic hydrolysate was obtained in
the experimental procedure. Several authors have estudied the production of acetic acid from the
anaerobic bacteria Clostridium Thermoaceticum using mainly glucose as carbon source.
Page 102
102 Hydrogen Production through Gasification and Dark Fermentation
Schwartz et al., [167] studied the production of acetic acid using the anaerobic bacteria in a pH-
controlled batch fermentation at acidic pH. From the fermentation procedure, acetic acid
concentrations of 20 g L-1 at pH 7 and 15 g L-1 at pH 6 were obtained. Wang et al., [168] studied
also the production of acetic acid using the C. Thermoaceticum. The maximum acetic acid
concentration was 37 g L-1 at pH 7. In comparison to the results of the acetic acid production
using the C. Thermoaceticum, relative high concentration of acetic acid was obtained from the
dark fermentation of different substrates (glucose and hydrolysates) as carbon sources using as
microorganism T. Thermosaccharolyticum ATCC 7956. When using glucose as substrate, the
concentration of acetic acid was 29.01 g L-1, which is relative close to the results reported by
Wang et al., [168]. An average acetic acid concentration between 16.45 to 17.18 g L-1 was
obtained from the dark fermentation using acid and enzymatic hydrolysates as substrate,
respectively. It is a very interesting result since the commercial strain T.
Thermosaccharolyticum ATCC 7956 is able to produce acetic acid in high concentrations which
gives an insight of the implementation of different process schemes to produce other
metabolites using the commercial strain.
5.4 Stand-alone and biorefinery pathways for hydrogen
production: Simulation approach
In this section, the techno-economic, energetic and environmental assessment of the stand-alone
and biorefinery pathways to produce hydrogen through gasification and dark fermentation was
developed. Each feedstock (PP and CCS) was evaluated based on the six proposed scenarios.
Finally, the result of the assessment of each feedstock was compared aiming to determine the
suitable lignocellulosic biomass for hydrogen production through different stand-alone and
biorefinery pathways.
5.4.1 Pinus Patula
The simulation results of the proposed scenarios using Pinus Patula as feedstock are presented
in this section. First, the productivities and yields of the different process schemes were
calculated. Then, the economic profitability of the process considering the PP supply chain was
assessed. Subsequently, the energy performance of the stand-alone and biorefinery schemes
were evaluated and compared. Finally, the environmental assessment of each process in terms
of the GHG balance and the potential environmental impact was performed.
Page 103
Hydrogen Production through Gasification and Dark Fermentation 103
5.4.1.1 Overall performance
From the simulation procedure of the evaluated scenarios, the mass and energy balances were
obtained as presented in Table 5-22. The highest hydrogen productivity and yield were obtained
when the feedstock was used directly to generate synthesis gas, from which hydrogen was
separated. Scenarios 2 and 3 involved the use of fractions of the feedstock aiming to produce
different bioenergy products (ethanol and electricity) under the biorefinery concept. From these
approaches, it is evidenced that the hydrogen productivity decreases since not all raw material is
destined for hydrogen production. In scenario 2, 50% of the synthesis gas was used to generate
electricity through a gas engine, which can be used to supply the internal energy demand of the
process and the surplus can be sold to the national grid. Meanwhile, scenario 3 considers the
production of bioethanol (25% of the feedstock) and also the electricity generation from the
synthesis gas. Despite the low electricity yield, it was enough to supply the energy requirements
of the biorefinery scheme, especially when considering the ethanol separation and purification,
which are high energy consumption processes. It is noteworthy that the bioethanol yield is
higher than other reported yields for different lignocellulosic biomass such as sugarcane bagasse
[147], coffee cut-stems [82], olive stone [169], among others.
Table 5-22. Overall performance of the stand-alone and biorefinery pathways for hydrogen
production using PP as feedstock.
Scenarios Productivitya Yieldsa
Value Units Value Units
Scenario 1 8.54 Ton H2/day 0.040 Ton H2/ton PP
Scenario 2 4.34 Ton H2/day 0.020 Ton H2/ton PP
10.54 MW 4,248.5 MJ/ton PP
Scenario 3 3.15 Ton H2/day 0.015 Ton H2/ton PP
43,108.44 Liters Ethanol/day 201.16 Liters Ethanol/ton PP
3.13 MW 1,263.63 MJ/ton PP
Scenario 4 0.87 Ton H2/day 0.004 Ton H2/ton PP
Scenario 5b 7,540.38 Liters Ethanol/day 35.19 Liters Ethanol/ton wood
Scenario 6c 32.68 Ton Acetic Acid/day 0.153 Ton Acetic Acid/ton PP
16.10 Ton Butyric Acid/day 0.075 Ton Butyric Acid/ton PP
Page 104
104 Hydrogen Production through Gasification and Dark Fermentation
a Calculated based on 214.3 Ton Pinus Patula/day
b Hydrogen productivity has the same value than scenario 4
c Hydrogen and ethanol productivity have the same values than scenario 4 and 5, respectively.
The scenarios that involve the dark fermentation of lignocellulosic biomass presented low
hydrogen yields compared to gasification processes. This behavior is mainly related to the
production regime; thermochemical technologies operate in a continuous mode, whereas
biochemical processes operate in a batch mode and therefore, the overall performance of the
process in terms of productivity is hindered. Ethanol, acetic acid and butyric acid are obtained
as main secondary metabolites in the fermentation broth and in order to provide an added value
to these bioenergy products, the separation of these metabolites from the fermentation broth in
scenario 5 and 6 was considered. The ethanol productivity in scenario 3 is higher than in the
scenario 5. The main reason is related to the fact that the ethanol, in the dark fermentation, is
separated from the fermentation broth as byproduct, which could increase the added-value of
hydrogen. Meanwhile, ethanol is the main product from the metabolic pathway of the
microorganism (Z. mobilis) in the scenario 3 and it is not considered as a by-product of the
process. The separation and valorization of the acetic and butyric acid from the fermentation
broth could enhance the economic profitability of the dark fermentation and reduces the
potential environmental impact that these organic acids could generate if they are emitted
directly into the environment.
5.4.1.2 Techno-economic assessment
- Processing Plant Location
In chapter 3, a detailed description of the PP supply chain was developed considering three
departments (Caldas, Antioquia and Cundinamarca) as the potential processing plant locations
in Colombia. Based on this statement, the economic performance of the gasification process to
produce hydrogen as main product was assessed aiming to select the suitable collection and
plant location between the three departments. The main parameters that influence the plant
location are the PP purchase price and the freight cost in each department. The suitable location
was selected based on two economic parameters: the hydrogen production cost and the Net
Present Value (NPV) of the scenario 1 in each department. Figures 5-3 and 5-4 present the
results of the economic assessment of the scenario 1 in terms of the hydrogen production cost
and NPV for each department, respectively. The most outstanding result of both figures is the
effect of the process scale (processing plant capacity) in the hydrogen production cost and NPV
of the process. From figure 5-3, it is evident that as the process scale increases, the hydrogen
production cost decreases until it reaches a point in which the effect of the process scale has no
a direct influence in the hydrogen production cost. Moreover, it is noteworthy that the
Page 105
Hydrogen Production through Gasification and Dark Fermentation 105
processing plant capacity also affects the economic profitability of the process. At low process
scale (biomass availability < 50 MT year-1), the hydrogen production through gasification is not
profitable as evidenced by the negative values of the NPV in all departments (see, Figure 5-4).
However, at high plant capacity (above 50 MT year-1), the process starts to show positive values
of the NPV.
Figure 5-3. Effect of the biorefinery location and plant capacity in the hydrogen production cost
On the other hand, there is no significant difference between the hydrogen production cost and
the NPV of the process between the three selected departments. Nevertheless, Antioquia seems
to be the suitable department for the location of the biorefinery due to the lower hydrogen
production cost and higher NPV. Additionally, Antioquia is the department with the highest PP
cultivated area with a PP yield of 20 m3 Ha-1 year-1 and therefore, the amount of residues that
can be obtained from the transformation of the roundwood is larger compared to other
departments (See, Table 3-2). Despite the higher PP residue purchase price (10.4 USD ton-1) in
comparison to other departments such as Caldas (7.1 USD ton-1), the large availability of
biomass in Antioquia reduces the transportation costs since the collection center can be also
located in the same department and thus, reducing the amount of biomass from other collection
centers.
Page 106
106 Hydrogen Production through Gasification and Dark Fermentation
Figure 5-4. Effect of the biorefinery location and plant capacity in the Net Present Value of the
process
- Economic assessment of the evaluated scenarios
- Gasification
Figure 5-5 presents the effect of the plant capacity in the hydrogen production cost for the three
scenarios that involve gasification. From the sensibility analysis, it is noteworthy that the
hydrogen production cost in the scenario 1, at low process scale, is higher than the scenario 2.
However, at high plant capacity, the production cost is lower than in scenario 2. Scenario 2
involves the production of electricity and hydrogen, where 50% of the synthesis gas is used to
produce electricity, which has a lower added-value in comparison to hydrogen. This behavior
evidences that the production of other energetic products, that have a low added-value, does not
improve the economic performance of the process when the feedstock is distributed among
different processes. However, this behavior was not evidenced in the scenario 3, which produces
hydrogen, ethanol and electricity. The contribution of the ethanol to the economic performance
of the scenario 3 is limited by the production cost and volume. High volume and low production
costs are required in order to implement the ethanol as a byproduct of the biorefinery scheme. In
this sense, the high productivity of ethanol (43,108 L day-1) and low production cost (0.268
USD L-1) improve the profitability of the scenario 3, which have direct influence in the
hydrogen production cost since the ethanol represents the highest contribution to the total sales
of the products in the biorefinery. Moreover, the generated electricity from the synthesis gas, in
the scenario 3, is used to supply the internal energy requirements of the process. From the
scenario 3, a hydrogen production cost between 1,650 and 1,750 USD ton-1 was calculated,
considering a plant capacity of 60 MT year-1. Higher plant capacities were not evaluated
because of the seasonal availability of lignocellulosic biomass.
Page 107
Hydrogen Production through Gasification and Dark Fermentation 107
Figure 5-5. Effect of the plant capacity in the hydrogen production for the three scenarios that
involve gasification
Figure 5-6. Effect of the plant capacity in the NPV for the three gasification scenarios
Based on the results from the hydrogen production cost in each scenario, the NPV was
calculated considering a hydrogen market price of 4,400 USD ton-1 [145]. Figure 5-6 presents
the effect of the plant capacity in the NPV of the three gasification scenarios. At low scale, the
scenarios 1 and 2 have negative values of NPV due to the high hydrogen production cost.
However, high process scale (> 50 MT year-1) could improve the economic performance of the
scenarios. Scenario 3 seems to be the most promising process scheme for the integral production
of hydrogen through gasification under a biorefinery concept, with the highest economic
profitability of the three evaluated scenarios.
Page 108
108 Hydrogen Production through Gasification and Dark Fermentation
Based on the previous statement, the effect of the market price variations for PP and the main
products of the scenario 3 (hydrogen, ethanol and electricity) in the NPV of the biorefinery were
evaluated considering a low scale biorefinery (1.8 ton h-1) and a mid-scale biorefinery (8.9 ton
h1). Figure 5-7 presents the behavior of the NPV in the scenario 3 when a low scale biorefinery
is considered. The parameters that have a strongly influence in the NPV are the ethanol and
hydrogen prices since a reduction of 40% and 80% in the market price, respectively, which may
turn the process non-profitable. However, according to the National Biofuels Federation
(Fedebiocombustibles), this behavior is unlikely since the ethanol market price in the last 6
years has been between 0.54 and 0.78 USD L-1. In the hydrogen case, the scenario is almost the
same, since the hydrogen market price will vary between 9,400 and 4,400 USD ton-1, based on
hydrogen production costs projections [145]. The integrated biorefinery would give negative
NPV values if the ethanol and hydrogen reach a selling price below 0.34 USD L-1 and 1,100
USD ton-1, respectively. PP and electricity market price do not affect considerably the economic
performance of the biorefinery. The ethanol market price has the strongest influence in the NPV
behavior because of the high production volume and thus, it has the highest contribution to the
economic allocation of the scenario.
Figure 5-7. Sensibility analysis of the economic performance of the low scale biorefinery
Figure 5-8 presents the behavior of the NPV in the scenario 3 considering a mid-sacle
biorefinery. It is evidenced that neither the market price of raw material or products have a
significant effect on the economic performance of the biorefinery. The ethanol market price
could affect the NPV of the scenario 3 if a reduction above 90% of the selling price is reached.
Page 109
Hydrogen Production through Gasification and Dark Fermentation 109
Figure 5-8. Sensibility analysis of the economic performance of the mid-scale biorefinery
The total production cost of a process scheme was calculated based on different parameters that
influenced, positive or negative, the economic performance of the process. Raw material costs,
utilities costs, capital depreciation and maintenance costs are the most important parameters that
have the highest contribution to the total production cost as presented in Figure 5-9. Scenario 3
has the highest raw material costs since it involves the ethanol production, which requires
additional reagents such as sulfuric acid and calcium hydroxide for the pretreatment of the
lignocellulosic biomass. On the other hand, scenarios 1 and 2 have similar raw material costs
due to these scenarios involve the transformation of the feedstock to synthesis gas and then, the
production of hydrogen (scenario 1) and electricity (scenario 2). Scenario 1 has the highest
utilities costs since this process scheme does not consider a cogeneration or power generation
plant in order to supply the energy requirements of the synthesis gas conditioning stage prior to
the membrane system, which is a high energy consumption process. Scenario 2 has the highest
contribution to the capital depreciation and maintenance costs. Despite that the scenario 3
requires a higher number of equipment for the ethanol production, scenario 2 has the highest
capital costs. This behavior is associated with the direct equipment cost of the generator used in
the electricity production. Higher synthesis gas flux is destined for the electricity generation in
the scenario 2 in comparison to scenario 3; therefore, large capacity of the generator is required
and thus, its contribution to the capital depreciation and maintenance costs is higher.
Page 110
110 Hydrogen Production through Gasification and Dark Fermentation
Figure 5-9. Contribution of the economic parameters to the total production costs of the
gasification scenarios
- Dark fermentation
The production of hydrogen through dark fermentation is not feasible because of the high
production cost that varies between 32,000 and 18,000 USD ton-1, which is a consequence of the
low productivity of hydrogen from batch processes and the hindered exploitation of secondary
metabolites from the fermentation broth. Figure 5-10 presents the effect of the process scale in
the hydrogen production cost of the dark fermentation scenarios. When the separation of ethanol
from the fermentation broth is considered along with the hydrogen production in the scenario 5,
the hydrogen production cost is reduced and the profitability of the process in terms of the NPV
is enhanced. However, due to the low volume of ethanol in comparison to the scenario 3, the
NPV of the scenario 5 is similar to the scenario 4. This gives the insight that it is not enough the
separation of one product from the fermentation broth and leave the remaining secondary
metabolites without any valorization. Based on this statement, the valorization of all the
metabolites in the fermentation broth was considered in the scenario 6. In this scenario, a
hydrogen production cost between 4,000 and 6,200 USD ton-1 and a small economic margin
were calculated. The main drawback to obtain low production costs and positive economic
margins is the fact that high process scales are required (> 80% of the plant capacity) (see,
Figure 5-11), which it is not possible since the biorefinery scheme requires a continuous and
sustainable feedstock supply and due to the seasonal availability of the lignocellulosic biomass,
the production of hydrogen may be hindered.
Page 111
Hydrogen Production through Gasification and Dark Fermentation 111
Figure 5-10. Effect of the plant capacity in the hydrogen production cost of the dark
fermentation scenarios
Based on the previous statement, the effect of the market price variations of PP and main
products of the scenario 6 (hydrogen, ethanol, acetic acid and butyric acid) in the NPV of the
biorefinery was evaluated considering a low scale biorefinery (1.8 ton h-1) and a mid-scale
biorefinery (8.9 ton h1). Figure 5-12 presents the behavior of the NPV in the scenario 6 when a
low scale biorefinery is considered. The integrated production of hydrogen through dark
fermentation is a non-profitable process when the selling price variations in the PP, hydrogen,
ethanol and butyric acid are considered. However, if the acetic acid price increases almost
100%, the hydrogen production can yield a small profit margin. An acetic acid market price of
1,190 USD ton-1 is required in order to turn the process profitable, but this scenario is unlikely
since 75% of the acetic acid is produced by the carbonylation of methanol, which is the cheapest
and highly productive process for the acetic acid production.
Page 112
112 Hydrogen Production through Gasification and Dark Fermentation
Figure 5-11. Effect of the plant capacity in the economic performance of the dark fermentation
scenarios
Figure 5-12. Sensibility analysis of the economic performance of the low scale dark
fermentation biorefinery
Figure 5-13 presents the behavior of the NPV in the scenario 6 considering a mid-scale
biorefinery. By increasing the process scale, the biorefinery profitability is enhanced. As
mentioned in Figure 5-12, the acetic acid market price has the strongest influence in the NPV of
the process scheme. In this case, an increment of 20% in the acetic acid selling price is required
in order to turn the process profitable. Despite this behavior, the profitability of the hydrogen
production through dark fermentation is lower than the gasification scenarios.
Page 113
Hydrogen Production through Gasification and Dark Fermentation 113
Figure 5-13. Sensibility analysis of the economic performance of the mid-scale dark
fermentation biorefinery
Figure 5-14. Contribution of the economic parameters in the dark fermentation scenarios
The main economic parameters that have the highest contribution to the total production cost of
hydrogen are the raw material and utilities costs. The scenarios 4 and 5 have the same raw
material costs since both are the same process, but the scenario 5 involves the separation of
ethanol from the fermentation broth, which is the most energy consumption process as
evidenced in Figure 5-14. On the other hand, the scenario 6 has the highest raw material costs
since it involves the production of hydrogen along with the separation of ethanol, acetic and
butyric acid. The separation of acetic and butyric acid from the fermentation broth requires
additional reagents such as polyethylene glycol, iodine solution and sodium sulfate, which
increase the raw material costs in this scenario. Scenario 5 has the highest utilities costs since
the the largest energy energy sink of the process is located in the separation and purification of
Page 114
114 Hydrogen Production through Gasification and Dark Fermentation
ethanol. Scenario 6 involves the separation of ethanol, acetic and butyric acid from the
fermentation broth; nevertheless, the utilities costs are lower than in scenario 5. The Pinch
methodology was used to develop the energy integration of the biorefinery scenarios and based
on the results of the analysis, the heating and cooling requirements of the scenario 5 are higher
than in scenario 6.
5.4.1.3 Energy Analysis
From the simulation procedure, the energy balance of the proposed scenarios was evaluated.
The results from this analysis were represented in Sankey diagrams in order to achieve a better
description of the inputs and outputs involve in the simulation of each scenario. Figures 5-15
and 5-16 describe the energy balance of the gasification and dark fermentation scenarios
through Sankey diagrams, respectively.
From the Sankey diagrams, the inputs of the gasification scenario involve the potential energy
content of the feedstock and the energy requirements of the process. The outputs consider the
main products from the gasification scenarios such as hydrogen, electricity, ethanol and heating
utilities (low and high pressure steam). Moreover, the outputs of the Sankey diagrams represent
the energy losses of the process, which refers to the amount of energy in the inputs that is not
converted into the respective products in each scenario. According to Figure 5-15, the highest
energy losses in the conversion of the feedstock to bioenergy products were determined in the
scenario 1. Scenario 3 has the lowest energy losses due to the integrated production of different
bioenergy products such as hydrogen, ethanol and electricity along with the steam generation,
which could reduce the heating requirements of the process. Additionally, the surplus of
electricity can be sold to the national grid, which could improve the economic profitability of
the biorefinery scheme.
Scenarios that involve the production of hydrogen through dark fermentation have high energy
requirements in terms of electricity and heating utilities (lower and high pressure steam) as
observed in Figure 5-16. The highest energy losses of the three evaluated schemes were
obtained in the scenario 5, which involves the production of hydrogen along with the separation
of ethanol from the fermentation broth. This can be explained due to the high energy
consumption of the ethanol separation and purification stage. Despite that scenario 6 also
involves the separation of ethanol from the fermentation broth, the energy losses were the
lowest for the three dark fermentation scenarios due to the energetic valorization of the
secondary metabolites (acetic and butyric acid).
Page 115
Hydrogen Production through Gasification and Dark Fermentation 115
Figure 5-15. Sankey diagram of the energy balance for the gasification scenarios H2
Scenario 1
Pinus Patula
49.53 MW
Power 4.15 MW11.86 MW H2
LP Steam 0.85 MW
HP Steam 16.96 MW
Energy Losses
24.1 MW
Scenario 2Pinus Patula
49.53 MW
6.02 MW H2
Power 10.54 MW
HP Steam 13.01 MW
Energy Losses
19.96 MW
Scenario 3Pinus Patula
49.53 MW
Energy Losses
9.95 MW
HP Steam 11.62 MW
Ethanol
11.36 MW H2
4.37 MW
Power 12.23 MW
Page 116
116 Hydrogen Production through Gasification and Dark Fermentation
Figure 5-16. Sankey diagram of the energy balance for the dark fermentation scenarios
Based on the results of the simulation procedure, two energy efficiencies were calculated. The
first energy efficiency considers only the hydrogen as the main product of the evaluated
scenarios and the second energy efficiency involves the hydrogen along with the other
bioenergy products from each scenario. Figure 5-17 presents the energy efficiencies of the
evaluated scenarios considering hydrogen as the only energetic product. The highest energy
Scenario 4
Pinus Patula
49.53 MW
HP Steam 5.93 MW
1.21 MW H2
Energy Losses
59.5 MW
LP Steam 4.99 MW
Power 0.26 MW
Scenario 5
Pinus Patula
49.53 MW
1.32 MW H2
Ethanol 1.99 MW
Energy Losses
78.01 MW
HP Steam 13.09 MW
LP Steam 18.43 MW
Power 0.27 MW
Scenario 6
Pinus Patula
49.53 MW
Energy Losses
56.78 MW
Acetic Acid 5.52 MW
Ethanol
2.03 MW H2
1.21 MW
Butyric 5.52 MWHP Steam 3.03 MW
LP Steam 17.34 MW
Power 0.26 MW
Page 117
Hydrogen Production through Gasification and Dark Fermentation 117
efficiency was calculated for the gasification scenarios due to the high hydrogen productivity in
contrast to the dark fermentation scenarios, where the highest energy efficiency was 2.65%.
Among the gasification scenarios, scenario 1 has the highest energy efficiency due to the fact
that the feedstock is directly converted into synthesis gas and subsequently to hydrogen.
However, energy efficiency of the processes is very low when considering only hydrogen as
product, with a maximum value of 23.94%. The process design under the biorefinery concept
can improve the energy efficiency of the process due to the variety of bioenergy products (i.e.
electricity and ethanol) that can be obtained from the evaluated scenarios, as observed in Figure
5-18. When the energy analysis involves all the bioenergy products from each scenario as
represented in the Sankey diagrams (see, Figure 5-15 and 5-16), the overall energy efficiencies
of the scenarios is increased.
Figure 5-17. Energy efficiency considering hydrogen as the only product of the evaluated
scenarios
As evidenced in Figure 5-18, the energy efficiency of the scenario 1 increases from 23.94% to
59.89%, the scenario 2 increases from 12.16% to 59.83% and the scenario 3 from 8.83% to
61.57%. These results highlight the importance of the design of integrated biorefineries to
obtain different added-value products. In this case, the scenario 3 has the highest energy
efficiency due to the integral production of hydrogen, ethanol and electricity, which improve the
overall process efficiency. Regardless the evaluated gasification scenario, the energy efficiency
of the biomass gasification varies between 50 – 60%, which is in agreement with the literature
reports [5], [170]. On the other hand, the valorization of the secondary metabolites in the dark
fermentation improves the energy efficiency of the process. It is evidenced in Figure 5-18 that
the energy efficiency of the dark fermentation increases from 2.44%, considering only hydrogen
as main product in the scenario 4, to 27.01% in the scenario 6 where the hydrogen production
along with the separation of ethanol, acetic and butyric acid were considered. Ruggeri et al.,
[171] evaluated the production of energy from the dark anaerobic fermentation considering the
Page 118
118 Hydrogen Production through Gasification and Dark Fermentation
net energy balance aiming to determine when a process is energetically sustainable. From the
results, it is suggested the possibility to recover the fatty volatile acids from the fermentation
broth and giving them an energy valorization in order to enhance not only the energy efficiency,
but also the economic performance of the dark fermentation.
Figure 5-18. Energy efficiency considering all the possible products from the evaluated
scenarios
A process aimed at producing energy needs to produce more energy than the energy necessary
to run the process itself in order to be energetically sustainable [171]. Based on this statement,
the Net Energy Value (NEV) was used as key parameter in the determination of the net energy
balance between the energy expended to produce hydrogen and other by-products, and the
amount of energy gained from the bioenergy products. Figure 5-19 presents the net energy
balance of the evaluated scenarios. At first sight, the gasification scenarios have positive values
of NEV that evidences the high energy content in the bioenergy products in comparison to the
required energy to produce them. In contrast, dark fermentation scenarios have negative values
of NEV; however, when the valorization of the secondary metabolites was considered, the net
energy balance almost reaches zero. Scenario 3 has the highest NEV value because of the
integrated production of different bioenergy products as presented in Figure 5-15. The worst
scenario, in terms of the energy sustainability, is the scenario 5 because of the high energy
requirements in the separation and purification of ethanol. Regardless that scenario 6 also
involves the ethanol purification along with the acetic and butyric acid separation, the scenario 6
has the lowest NEV due to the valorization of the secondary metabolites in the fermentation
broth.
Page 119
Hydrogen Production through Gasification and Dark Fermentation 119
Figure 5-19. Net energy balance of the evaluated scenarios
5.4.1.4 Environmental Assessment
The main emissions generated from thermochemical processes are related to the gaseous species
that are emitted directly into the atmosphere. In this sense, the GHG balance was used as
methodology in the determination of the CO2 emissions from the gasification scenarios. Figure
5-20 presents the emissions of kilogram CO2-equivalent per kilogram of feedstock in the
gasification and dark fermentation scenarios. All the evaluated scenarios has negative values,
which gives an insight of the low CO2 emissions and thus, the mitigation of these emissions.
However, the gasification scenarios evidence the lowest CO2 mitigation potential because of the
emissions of carbon monoxide from the hydrogen purification stage and the flue gas from the
electricity generation. Scenario 3 has the lowest CO2 emissions, which can be explained since a
fraction of the feedstock is intended in the production of ethanol instead synthesis gas, reducing
notoriously the CO2 emissions of the biorefinery scheme.
On the other hand, GHG balance has no significant effect on the dark fermentation scenarios as
evidenced in Figure 5-20 since the main residues from the fermentation scenarios are: solid
wastes (cellulose, hemicellulose, lignin and ash), sulfuric acid, gypsum and volatile fatty acids,
which could affect not only the emissions into the atmosphere, but also emissions into water and
land sources. In this sense, other environmental impact categories were evaluated for the dark
fermentation scenarios such as acidification, photochemical oxidation and human toxicity using
the Waste Reduction Algorithm (WAR) that evaluates the potential environmental impact of the
processes if the outlet streams were submitted directly into the atmosphere. As mentioned
before in Chapter 3, the software evaluates the process in eight impact categories; however,
three categories were selected to evaluate the dark fermentation scenarios: human toxicity by
Page 120
120 Hydrogen Production through Gasification and Dark Fermentation
dermal exposition or inhalation (HTPE), photochemical oxidation potential (PCOP) and
terrestrial toxicity potential (TTP). Figure 5-21 presents the potential environmental impact of
the dark fermentation scenarios based on the three selected impact categories. Due to the
valorization of the secondary metabolites from the fermentation broth, the potential
environmental impact of the dark fermentation scenarios decrease from the scenario 3 to 6.
Figure 5-20. GHG balance of the evaluated scenarios
The impact categories that have the highest contribution to the total potential environmental
impact are TTP and PCOP. The lethal-dose that produce death in 50% of rats by oral ingestion
(LD50) is used as an estimate for the TTP [172]. The LD50 for ethanol is 7,060 mg/kg, which is
the highest dose in comparison to the other by-products from the fermentation broth: acetic acid
and butyric acid with LD50 of 3310 and 2000 mg/kg, respectively. As a consequence, the
separation of ethanol and the valorization of the other secondary metabolites in the scenario 6
reduce the TTP in comparison to the scenario 1. The PCOP or smog formation potential is
determined by comparing the rate at which a unit mass of chemical reacts with hydroxyl radical
(OH·) to the rate at which a unit mass of ethylene reacts with OH· [172]. The main components
involve in the smog formation are the volatile organic compounds (VOC’s), which are
categorized in alkanes, olefins, alkines, aromates, alcohols, aldehydes and hydrocarbons.
Ethanol and acetic acid are some of the volatile organic compounds that are included in the dark
fermentation scenarios; therefore, their contribution to the environmental potential impact is
reflected in scenario 4, where their valorization is not considered. Ethanol seems to be the
component that has the highest contribution to the PCOP based on the PEI reduction from
scenario 4 to 5, which is approximately 64%. In the scenario 6, this behavior is more evident
due to a reduction in the PCOP of 99.6% from the scenario 4.
Page 121
Hydrogen Production through Gasification and Dark Fermentation 121
Figure 5-21. Environmental assessment of the dark fermentation scenarios
5.4.2 Coffee Cut-Stems (CCS)
In this section, techno-economic, energetic and environmental assessment of the hydrogen
production through gasification and dark fermentation using CCS as feedstock was developed.
First, the overall performance of the proposed scenarios in terms of the productivity and yields
of each process was evaluated. Subsequently, the selection of the suitable plant location based
on the economic performance of each scenario was carried out. Then, the selected plant location
was used in the economic assessment of the proposed scenarios. The energy analysis was
carried out considering the energy efficiency and the Net Energy Value (NEV) of each scenario.
Finally, GHG emissions and the Potential Environmental Impact (PEI) were used as key
parameters in the environmental assessment of the evaluated scenarios.
5.4.2.1 Overall Performance
Among the gasification scenarios, the scenario 1 has the highest hydrogen production yield
because of the direct use of the generated synthesis gas to produce hydrogen (see, Table 5-23).
Despite the low productivity of the other two gasification scenarios, high yields (> 0.038 ton H2
ton-1 CCS) are obtained in comparison to the dark fermentation scenarios (0.005 ton H2 ton-1
CCS). Due to the batch operation regime of the dark fermentation processes, low productivities
and yields were calculated. Electricity is generated as by-product in the scenarios 2 and 3 taking
advantage of the high energy content of the synthesis gas. The highest electricity generation is
evidenced in the scenario 2 due to the use of 50% of the generated syngas in the CCS
gasification in the electricity generation. Bioethanol was evaluated as one of the by-products
from the biorefinery scheme due to the high lignocellulosic content in the CCS. Scenario 3
Page 122
122 Hydrogen Production through Gasification and Dark Fermentation
involves the production of ethanol along with hydrogen and electricity. Higher bioethanol yields
were determined from the gasification scenarios in comparison to the dark fermentation
scenarios. A yield of 202.21 L ethanol ton-1 CCS was calculated in the scenario 3, whereas a
yield of 47.19 L ethanol ton-1 CCS was obtained in the scenarios 5 and 6. The main results from
the overall performance of the dark fermentation scenarios are related to the fact that the
valorization of the different by-products from the fermentation broth could improve the
economic profitability of the process.
Table 5-23. Productivity and yields of the CCS scenarios
Scenarios Productivitya Yieldsa
Value Units Value Units
Scenario 1 35.76 Ton H2/day 0.106 Ton H2/ton CCS
Scenario 2 17.92 Ton H2/day 0.053 Ton H2/ton CCS
13.04 MW 3,325.98 MJ/ton CCS
Scenario 3 12.83 Ton H2/day 0.038 Ton H2/ton CCS
68,490.34 Liters Ethanol/day 202.21 Liters Ethanol/ton CCS
9.00 MW 2,294.84 MJ/ton CCS
Scenario 4 1.53 Ton H2/day 0.005 Ton H2/ton CCS
Scenario 5b 15,983.91 Liters Ethanol/day 47.19 Liters Ethanol/ton CCS
Scenario 6c 57.54 Ton Acetic Acid/day 0.170 Ton Acetic Acid/ton CCS
28.34 Ton Butyric Acid/day 0.084 Ton Butyric Acid/ton CCS
a Calculated based on 338.70 Ton CCS/day b Hydrogen productivity has the same value than scenario 4 c Hydrogen and ethanol productivity have the same values than scenario 5
5.4.2.2 Techno-economic assessment
- Processing Plant Location
In chapter 3, a detailed description of the CCS scenario in Colombia was performed considering
three departments (Huila, Antioquia and Caldas) as the largest coffee producers. According to
this, the economic performance of the gasification process (scenario 1) to produce hydrogen as
main product was evaluated in order to select the suitable collection and plant location between
the three departments. In contrast to the PP case, the main parameter that influences the location
of the processing plant is the transportation cost. The CCS purchase price was not considered as
a key parameter in the economic profitability of the process since the coffee market price is
regulated by the Federación Nacional de Cafeteros (FNC) and, at national level, this price is
Page 123
Hydrogen Production through Gasification and Dark Fermentation 123
stable with slight changes from region to region. Hence, the CCS purchase price has no
significant variation between the three selected departments. However, these changes have not
significant effect in the economic viability of the process. Therefore, the coffee price was not
considered as a parameter that influences the location of the processing plant, but an average
coffee price was selected aiming to determine the CCS purchase price as mentioned in Chapter
3. From the three selected departments, Huila has the largest coffee plantations per hectare
(154,980 Ha), the highest coffee yield per hectare (1.2 ton Ha-1) and thus, the highest CCS
production (109,688 Ton year-1). For this reason, Neiva (capital city of Huila) was selected as
the processing plant location due to the high availability of raw material in this department,
which reduces the raw material requirements from other collection centers (Antioquia and
Caldas).
- Economic assessment of the evaluated scenarios
- Gasification
Figure 5-22 presents the effect of the plant capacity in the hydrogen production cost of the
gasification scenarios. Low process scales involve higher hydrogen production costs in
comparison to high process scales that involve lower hydrogen production costs. At low plant
capacity, the hydrogen cost in the scenario 1 is higher than in the scenario 2; however, the
hydrogen production cost is lower in the scenario 1 than in scenario 2 at high plant capacities.
This can be explained since 50% of the generated synthesis gas is intended for the production of
electricity, and the remaining is submitted to the hydrogen separation stage. Due to the low
added-value of the electricity in comparison to hydrogen, the economic profitability of the
scenario 2 decreases at high plant capacities. Due to the integral production of different by-
products (hydrogen, electricity and ethanol) under a biorefinery scheme, scenario 3 has the
lowest hydrogen production cost (1,702.4 USD ton-1).
Figure 5-22. Effect of the plant capacity in the hydrogen production cost of the gasification
scenarios.
Page 124
124 Hydrogen Production through Gasification and Dark Fermentation
This behavior is reflected in the economic profitability of the scenario 3 as presented in Figure
5-23. Despite that scenario 3 has the lowest hydrogen production cost, it is noteworthy that the
economic profitability of the scenario 1 is relative high; however, the implementation of an
integrated biorefinery could improve even more the feasibility of the process, as in scenario 3.
Figure 5-23. Effect of the plant capacity in the economic profitability of the gasification
scenarios
Despite the low process scale, the economic profitability of the integrated production of
hydrogen in the scenario 3 is relative high, as observed in Figures 5-24 and 5-25. The effect of
the market price variations of CCS and main product (hydrogen, ethanol and electricity) in the
NPV of the biorefinery was evaluated considering a low scale biorefinery (2.82 ton h-1) and
mid-scale biorefinery (14.1 ton h-1). The only parameter that may adversely affect the economic
profitability of the scenario 3 is the ethanol market price. However, an ethanol selling price
below 0.17 USD L-1 (a reduction of above 60% of the market price) is required in order to turn
the process non-profitable. Based on the current ethanol selling price, this behavior is very
difficult to be evidenced.
Figure 5-24. Sensibility analysis of the economic performance of the low-scale gasification
biorefinery
Page 125
Hydrogen Production through Gasification and Dark Fermentation 125
Figure 5-25 presents the behavior of the NPV in the scenario 3 considering a mid-scale
biorefinery. It is evidenced that neither the raw material and products mrket price has a
significant effect on the economic profitability of the biorefinery. The ethanol market price has
the greatest influence in the NPV of the biorefinery; however, a reduction above 80% of the
ethanol selling price is required to turn the process non-profitable.
Figure 5-25. Sensibility analysis of the economic performance of the mid-scale gasification
biorefinery
The economic parameters that influence the most the total production cost of the gasification
scenarios are the raw material costs, utilities costs and capital depreciation (see, Figure 5-26).
Scenarios 1 and 2 have similar raw material costs since the processes involve the same amount
of reagents. In contrast, the scenario 3 requires additional reagents such as sulfuric acid and
calcium hydroxide for the raw material pretreatment due to the production of ethanol. The
energy requirements of the gasification scenarios are related to heating utilities (steam) and
electricity. Scenario 1 has the highest utilities costs because of the energy needs in the hydrogen
separation and purification. In contrast, the utilities costs of the scenario 2 are lower than in
scenario 1 due to the integrated production of electricity from the synthesis gas in the scenario 2
that would help to meet the energy requirements of the process and the surplus can be sold to
the national grid. The capital depreciation costs were calculated based on the basic sizing of the
equipment in each scenario. The scenario 2 and 3 have the highest capital depreciation costs,
which are related to the high direct costs of the electricity generator (scenario 2) and the
additional costs of the ethanol processing plant (scenario 3).
Page 126
126 Hydrogen Production through Gasification and Dark Fermentation
Figure 5-26. Contribution of the economic parameters to the total production costs of the
gasification scenarios
- Dark Fermentation
The same behavior presented in the PP case for the economic profitability of the hydrogen
production through dark fermentation is evidenced in the CCS case. Figures 5-27 and 5-28
present the effect of the process scale in the hydrogen production cost and economic
profitability of the dark fermentation scenarios. It is evidenced that the valorization of secondary
metabolites from the fermentation broth reduces the hydrogen production costs and increases
the profitability of the process. The lowest hydrogen production cost was calculated for the
scenario 3 (4,861.45 USD ton-1) along with the production of ethanol (952.24 USD ton-1), acetic
acid (657.4 USD ton-1) and butyric acid (220.98 USD ton-1). Despite the valorization of these
by-products, the NPV is negative due to the high raw material and utilities costs in comparison
to the main products profit margins. It is noteworthy that the process scale has a different
influence in the economic profitability of the dark fermentation in comparison to the
gasification scenarios. The economic profitability of the gasification scenarios increases when
the process scale increases (see, Figure 5-23). In contrast, the NPV of the dark fermentation
scenarios reduces when the process scale increases. This behavior of the NPV in the dark
fermentation scenarios is strongly influenced by the valorization of the secondary metabolites
and the utilities costs.
Page 127
Hydrogen Production through Gasification and Dark Fermentation 127
Figure 5-27. Effect of the plant capacity in the hydrogen production cost in the dark
fermentation scenarios
Figure 5-28. Effect of the plant capacity in the NPV of the dark fermentation scenarios
Based on the previous statement, the effect of the market price variations of CCS and main
products of the scenario 6 (hydrogen, ethanol, acetic acid and butyric acid) in the NPV of the
biorefinery was evaluated considering a low scale biorefinery (2.82 ton h-1) and a mid-scale
biorefinery (14.1 ton h1). Figure 5-29 presents the behavior of the NPV in the scenario 6 when a
low scale biorefinery is considered. The integrated production of hydrogen through dark
fermentation is a non-profitable process when the selling price variations in the CCS, hydrogen,
ethanol and butyric acid are considered.
Page 128
128 Hydrogen Production through Gasification and Dark Fermentation
Figure 5-29. Sensibility analysis of the economic profitability of the low scale dark
fermentation biorefinery
Figure 5-30. Sensibility analysis of the economic performance of the mid-scale dark
fermentation biorefinery
Figure 5-30 presents the behavior of the NPV in the scenario 6 considering a mid-scale
biorefinery. The acetic acid market price has the strongest influence in the NPV of the process
scheme. However, an almost 100% increment in the acetic acid market price is required in order
to yield a small profit margin in the hydrogen production through dark fermentation. An acetic
acid market price of 1,190 USD ton-1 is required in order to turn the process profitable, but this
scenario is unlikely since 75% of the acetic acid is produced by the carbonylation of methanol,
which is the cheapest and highly productive process for the acetic acid production.
Page 129
Hydrogen Production through Gasification and Dark Fermentation 129
Figure 5-31. Contribution of the main economic parameters to the total production costs of the
dark fermentation scenarios.
Figure 5-31 presents the influence of the economic parameters in the total production costs of
the dark fermentation scenarios. Scenario 6 involve the separation and valorization of the
metabolites in the fermentation broth, which is reflected in the low negative values of NPV. The
highest utilities costs were determined in the scenario 5 because of the high energy requirements
in the separation and purification of ethanol and thus, the economic profitability of the scenario
5 is lower than in scenario 4, which only involves the production of hydrogen. Scenario 6 has
the highest raw material costs due to the additional reagents used in the formation of the two
aqueous phase system in the separation of acetic and butyric acid. Moreover, the separation of
acetic acid from butyric acid increases the capital costs of the scenario.
5.4.2.3 Energy Analysis
The net energy balance of the proposed scenarios from the simulation procedure were described
using Sankey diagrams as presented in Figures 5-32 and 5-33. The inputs of the Sankey
diagram are related to the potential energy content of the feedstock and energy requirements.
The main products from each scenario along with other by-products such as steam and
electricity are the outputs of the Sankey diagrams. Additionally, the energy losses of the
process, based on the energy balance, were also described in these diagrams. The highest energy
exploitation of the gasification scenarios was obtained in the scenario 3 due to the integral
production of different bioenergy products under the biorefinery scheme. This behavior cannot
be evidenced in the dark fermentation scenarios due to the high energy requirements of the
scenarios that involve the separation and purification of the secondary metabolites from the
fermentation broth.
Page 130
130 Hydrogen Production through Gasification and Dark Fermentation
Figure 5-32. Sankey diagrams for the gasification scenarios
Scenario 1
Coffee Cut-Stems
78.29 MW
Power 6.73 MW19.54 MW H2
LP Steam 2.73 MW
HP Steam 26.32 MW
Energy Losses
36.43 MW
Scenario 2Coffee Cut-Stems
78.29 MW
9.77 MW H2
Power 13.04 MW
HP Steam 22.76 MW
Energy Losses
32.72 MW
Scenario 3Coffee Cut-Stems
78.29 MW
Energy Losses
4.29 MW
HP Steam 43.91 MW
Ethanol
18.05 MW H2
6.76 MW
Power 5.28 MW
Page 131
Hydrogen Production through Gasification and Dark Fermentation 131
Figure 5-33. Sankey diagrams for the dark fermentation scenarios
As mentioned in the PP case, the energy efficiency of the scenarios was evaluated based on two
criteria: the energy efficiency only considering hydrogen as the main product of each scenario
and the energy efficiency considering all the bioenergy products. The energy efficiency of the
evaluated scenarios considering hydrogen as the only product is presented in Figure 5-35. The
gasification scenarios have the highest energy efficiencies due to the high productivity of
hydrogen in comparison to the dark fermentation scenarios, from which an energy efficiency up
Scenario 4
Coffee Cut-Stems
78.29 MW
HP Steam 13.77 MW
2.13 MW H2
Energy Losses
106.5 MW
LP Steam 16.24 MW
Power 0.29 MW
Scenario 5
Coffee Cut-Stems
78.29 MW
2.8 MW H2
Ethanol 3.97 MW
Energy Losses
151.7 MW
HP Steam 29.93 MW
LP Steam 49.90 MW
Power 0.32 MW
Scenario 6
Coffee Cut-Stems
78.29 MW
Energy Losses
113.51 MW
Acetic Acid 9.72 MW
Ethanol
4.18 MW H2
2.13 MW
Butyric 8.13 MWHP Steam 11.88 MW
LP Steam 47.21 MW
Power 0.29 MW
Page 132
132 Hydrogen Production through Gasification and Dark Fermentation
to 3.58% was reached. Among the gasification schemes, the scenario 1 has the highest energy
efficiency due to the direct production of hydrogen from the synthesis gas. Nevertheless, the
energy efficiency of the gasification and dark fermentation scenarios is very low when
considering only hydrogen as main product.
Figure 5-34. Energy efficiency of the evaluated scenarios considering only hydrogen as product
Therefore, the energy efficiency of the scenarios taking into account all the bioenergy products
was calculated and the results are presented in Figure 5-36. The energy efficiency of the
scenario 1 was improved from 24.96% to 62.06% and the scenario 2 from 12.48% to 58.20%,
whereas the energy efficiency of the scenario 3 reached 94% due to the integrated production of
hydrogen, ethanol, electricity and steam under the biorefinery scheme (see, Figure 5-33). On
the other hand, the efficiency of the dark fermentation scenarios was improved when the
valorization of the secondary metabolites was considered, reaching an energy efficiency of
30.86% in the scenario 6.
Figure 5-35. Energy efficiency of the evaluated scenarios considering all the bioenergy
products
Page 133
Hydrogen Production through Gasification and Dark Fermentation 133
Despite the energy efficiency, the relation between the required energy in a process scheme and
the amount of produced energy from the main products can be also used as a decision criteria of
the sustainability of different process schemes. In this sense, the Net Energy Value (NEV) was
used along with the energy efficiency as key parameters in the assessment of the sustainability
of the proposed scenarios. Figure 5-37 presents the net energy balance of the evaluated
scenarios. Positive NEV were obtained from the gasification scenarios, which is related to the
high valorization of the bioenergy products in comparison to the energy requirements of the
process. In contrast, the dark fermentation scenarios have negative NEV because of the high
energy requirements as shown previously in the Sankey diagrams (see, Figure 5-34). The
highest NEV of the gasification scenarios was calculated for the scenario 3 due to the lower
energy losses and the production of different bioenergy products. The worst scenario, from the
energetic point of view, is the scenario 5 that involves the separation and purification of ethanol.
From these results, it is noteworthy that the energy efficiency of a process is highly influenced
by the productivity of the main bioenergy products, and since the dark fermentation scenarios
have lower productivities, the sustainability of these schemes cannot be accomplished.
Figure 5-36. Net energy balance of the evaluated scenarios
5.4.2.4 Environmental Assessment
From the evaluation of the GHG emissions and the potential environmental impact (PEI) using
the WAR algorithm, it was evidenced a similar trend as in the PP case. The scenarios 2 and 3
have the highest GHG emissions due to the generation of electricity, which is related to the flue
gas realease into the atmosphere after the combustion of the synthesis gas. Since the highest
synthesis gas fractions is intended for the production of electricity in the scenario 2, the
emissions of the flue gas have a greater environmental potential impact than scenario 3. This
Page 134
134 Hydrogen Production through Gasification and Dark Fermentation
flue gas has a strongly influence in the Global Warming Potential (GWP) and thus, in the
environmental performance of the gasification scenarios as observed in Figure 5-38. The effect
of the secondary metabolites from the fermentation broth in the GHG balance was not
evidenced since the main residues from the fermentation are compounds such as sulfuric acid,
gypsum, ethanol and secondary metabolites, which should be analyzed based on other impact
categories that reflect their environmental impact. In this sense, the Waste Reduction algorithm
(WAR) was used in the evaluation of the environmental performance of the dark fermentation
scenarios based on different impact categories, being the most important: human toxicity by
dermal exposition or inhalation (HTPE), photochemical oxidation potential (PCOP) and
terrestrial toxicity potential (TTP). The highest potential environmental impact (PEI) was
calculated for the scenario 4; however, the valorization of the secondary metabolites improved
the environmental efficiency of the dark fermentation scenarios; therefore, the PEI of the
scenario 6 is lower than scenarios 4 and 5 (see, Figure 5-39). The impact category with the
highest contribution to the total environmental impact was the TTP, which is related to the final
disposition of ethanol and the remaining secondary metabolites based on the lethal-dose of each
component. The LD50 for ethanol is 7,060 mg/kg which is the highest dose in comparison to
other by-products from the fermentation broth: acetic acid and butyric acid with LD50 of 3310
and 2000 mg/kg, respectively. For this reason, the valorization of the secondary metabolites
reduces the TTP impact from the scenario 5 to scenario 6. The PCOP is influenced by the
presence of ethanol, acetic and butyric acid in the fermentation broth, which in the presence of
UV radiation, produce smog. Due to the valorization of VFA’s from the fermentation broth, the
smog formation potential is reduced from the scenario 4 to scenario 6.
Figure 5-37. GHG balance of the gasification and dark fermentation scenarios
Page 135
Hydrogen Production through Gasification and Dark Fermentation 135
Figure 5-38. Environmental Potential Impact (PEI) of the dark fermentation scenarios
Page 136
136 Hydrogen Production through Gasification and Dark Fermentation
6. General comparison of stand-alone and
biorefinery pathways for hydrogen production
One of the main purposes of this thesis was to stablish if the production of hydrogen in a stand-
alone way from lignocellulosic biomass can be a feasible route for future industrial production
levels. In this way the results from the techno-economic assessment of stand-alone and
biorefinery ways to produce hydrogen evidenced that the production of a product portfolio from
different fractions of the feedstock or the valorization of by-products enhanced the profitability
of the process schemes.
In the gasification scenarios, the selected products in the biorefinery schemes influenced the
NPV of the process. In this sense, low added-value products (e.i. electricity) do not improve the
economic performance of the evaluated scenarios. In contrast, high-volume production of
ethanol enhanced the NPV of the biorefinery scheme and thus, reduced the hydrogen production
costs (see, Figure 5-7 and 5-24). When considering only hydrogen as main product, the stand-
alone pathway had the highest energy efficiency of the evaluated scenarios since high
productivities were obtained (see, Figures 5-18 and 5-35). Nevertheless, when the integral
production of different bioenergy products was considered, the energy efficiency of the
biorefinery schemes increased up to 50% in the PP case and 90% in the CCS case (see, Figures
5-19 and 5-36). In contrast, the GHG emissions of the stand-alone production of hydrogen
through gasification were lower than the biorefinery schemes because of the generated
emissions from the combustion of the syngas to produce electricity (Scenario 2) and the energy
requirements (mainly, steam) in the bioethanol production (Scenario 3) (see, Figures 5-21 and
5-38).
On the other hand, the valorization of by-products from the dark fermentation reduced the
hydrogen production costs and increased the NPV of the integrated biorefinery scheme due to
the additional profits from the sale of the secondary metabolites (see, Figures 5-12 and 5-29).
The energy efficiency of the dark fermentation scenarios was very low; however, the high
Page 137
Hydrogen Production through Gasification and Dark Fermentation 137
energy content of the secondary metabolites, especially ethanol, and their valorization in the
biorefinery scenarios increased the energy efficiency of the process from approximately 2%
(stand-alone way) to 30% (see, Figures 5-19 and 5-36). Moreover, the disposal of the
secondary metabolites had the highest contribution to the total environmental impact of the dark
fermentation; although their valorization in the biorefinery scheme mitigated the environmental
impact up to 90% (see, Figures 5-22 and 5-39).
So it is very understandable that the stand-alone ways for hydrogen production are not yet the
solution, and different approaches should be included such as the integrated biorefinery
pathways. There are few information reported in literature related to the transformation of
biomass in hydrogen, especially using biochemical methods. Some author have evaluated the
economic assessment of the hydrogen production through thermochemical pathways
(especially, gasification) using biomass. Bowen et al., [173] evaluated the production of
hydrogen from three lignocellulosic residues: sugarcane bagasse, switchgrass and nutshell at
different process scales. From the economic assessment, high process scale improve the
hydrogen production cost. For bagasse with a flowrate between 400 to 1600 dry tonnes day-1,
the hydrogen production costs range from 0.92 USD kg-1 (high scale) to 1.23 USD kg-1 (low
scale). Parthasarathy et al., [5] analyzed the hydrogen production costs of different technologies
from thermochemical to biochemical methods. A hydrogen production cost of 5.52 USD kg-1
was calculated for the biochemical methods. The authors highlight the necessity to study the
effect of the production scale and its influence in the hydrogen production costs and the energy
efficiency of the process.
Page 138
138 Hydrogen Production through Gasification and Dark Fermentation
7. Conclusions
The results of this thesis revealed the potential use of lignocellulosic residues (Pinus Patula and
Coffee Cut-Stems) for the production of bioenergy through thermochemical (gasification) and
biochemical (dark fermentation) methods. Air gasification seems to be a promising method for
the production of bioenergy in the Non-Interconnected Zones (NIZ) in Colombia due to its
technological maturity and high productivity. The hydrogen content in the gasification
procedure was improved using CaO, which gives an insight of the potential use of this cheap
and high available adsorbent in the production of a high energy content syngas. The dark
fermentation seems to be a very interesting process for the production of a multiproduct
portfolio; however, its potential application is hindered by its productivity and batch operation
regime. The commercial strain T. Thermosaccharolitycum ATCC 7956 did not report
production of hydrogen; however, high concentration of acetic acid was determined in the
fermentation broth which it is an interesting result for the implementation of different process
schemes to produce other metabolites using this commercial strain.
Pinus Patula (PP) and Coffee Cut-Stems (CCS) are two of the most available wood residues in
Colombia that can be used in the production of bioenergy because of their high lignocellulosic
content. Colombia is considered as a country suitable for forestry and agriculture due to its soil
conditions, weather, geographical location, among other factors. PP is the most cultivated
reforestation specie in Colombia with high productivity and easy adaptation to different climatic
and geographical conditions. On the other hand, Colombia is the fourth largest coffee producer
in the world and thus, the main wood residue (CCS) of the crop is highly available after the
“Zoqueo” process every 5-6 years. Despite the high availability of these wood residues, their
supply chain is not well stablished in Colombia. The residues of the processing of furniture,
pulp and paper, and ply wood are not well exploited since they are used directly in combustion
processes for cooking and heating. Similar trend is observed in the CCS case, where the wood
residue is left in the ground or use by the farmers for heating and cooking after the “Zoqueo”.
Page 139
Hydrogen Production through Gasification and Dark Fermentation 139
The high availability and lignocellulosic content of these wood residues evidence their high
energy potential in the production of bioenergy multiproduct portfolio.
The stand-alone and biorefinery pathways for hydrogen production were evaluated in order to
determine the most important parameters that influence the economic, energetic and
environmental performance of the evaluated scenarios. Parameters such as the biomass supply
chain, products portfolio and the process scale are the most important variables that must be
considered to improve the profitability of the hydrogen production. Thermochemical methods
such as a gasification have the highest economic yields and energy efficiencies; nevertheless,
the implementation of this method in a biorefinery approach can further increase the
profitability of the process due to the wide range of products that can be obtained from the same
raw material. For both raw materials, the best scenario for the hydrogen production through
gasification was the scenario 3, which considers the production of hydrogen along with ethanol
and electricity. The hydrogen production cost in this scenario varied between 1.6 – 2.3 USD kg-1
in the PP case, and 1.6 – 2.0 USD kg-1 in the CCS case. These results are in agreement with the
values reported by Parthasarathy et al., [5]. However, the hydrogen production cost should be
improved aiming to be competitive to the traditional technologies such as steam methane
reforming (SMR), from which a production cost of 0.75 USD kg-1 with an energy efficiency of
83% is obtained. The parameter that has the highest influence in the total production cost of the
scenario 3 is the raw material costs that involve the biomass purchase and transportation costs.
In this sense, a well-stablished supply chain of the feedstock coupled to the biorefinery scheme
are required in order to obtain competitive processes. From the energetic point of view, both
feedstocks had similar energy content; however, when they are used in the integrated production
of bioenergy in a biorefinery pathway, the CCS case presented the highest energy performance
accounting to an energy efficiency of 94% in comparison to the PP case (62%). Despite the high
energy efficiency, the GHG emissions of the gasification scenarios in the CCS was higher than
the PP case.
Biochemical processes require more research not only in terms of productivity, but also in the
proper valorization of secondary metabolites from the fermentation broth. The best scenario for
hydrogen production through dark fermentation considers the separation of ethanol, acetic and
butyric acid from the fermentation broth along with the production of hydrogen. Due to the
valorization of the secondary metabolites, the hydrogen production cost is reduced, the global
energy efficiency is increased and the potential environmental impact is also reduced compared
to the stand-alone production of hydrogen. A hydrogen production cost of 4.3 USD kg-1 in the
PP case and 4.8 USD kg-1 in the CCS case were obtained. For both lignocellulosic residues, an
energy efficiency in the range of 27 – 30% was reached. The impact categories that contribute
Page 140
140 Hydrogen Production through Gasification and Dark Fermentation
the most to the total environmental impact were the human toxicity by dermal exposition or
inhalation (HTPE), photochemical oxidation potential (PCOP) and terrestrial toxicity potential
(TTP).
8. Recommendations
As part of the research path, there are many conclusions and reflections that are reflected in
future research projects. Some of the recommendations that the authors suggest for the
development of future works in relation to this topic are:
To use different catalyst such as Nickel, Iron or Cobalt in order to increase the remotion
of CO2 from the synthesis gas and also evaluate the location of the catalyst in the
gasifier (fixed bed).
To evaluate the production of hydrogen using T. Thermosaccharolyticum isolated
strains
To determine the suitable growth conditions and substrate type for the production of
hydrogen using the commercial strain T. Thermosaccharolyticum.
To assess the implementation of different process schemes to produce different
metabolites using the commercial strain T. Thermosaccharolyticum.
Page 141
Hydrogen Production through Gasification and Dark Fermentation 141
A. Approach for the calculation of the
elemental analysis and calorific value
Experimental methods to estimate the heating value and elemental analysis of biomass
compounds are time consuming as well as expensive, and have higher possibilities of
experimental errors. For these reasons, several authors have developed correlations, based on
experimental data, to estimate the heating value and elemental analysis of biomass. Shen et al.,
[99] developed various correlations for the determination of the carbon, hydrogen, oxygen and
nitrogen content in biomass. A large number of biomass data (137 materials) such as husk,
wood, straw, saw dust, food wastes, among others from literature reports were collected. Some
of these data were used for the correlation derivation and validation. The experimental
correlations used in the determination of the carbon, hydrogen and oxygen content, based on the
proximate analysis, are presented in Eq.A-1 to A-3.
𝐶 = 0.635𝐹𝐶 + 0.460𝑉𝑀 − 0.095𝐴𝑆𝐻 (𝑤𝑡. %) (A-1)
𝐻 = 0.059𝐹𝐶 + 0.060𝑉𝑀 − 0.010𝐴𝑆𝐻 (𝑤𝑡. %) (A-2)
𝑂 = 0.340𝐹𝐶 + 0.469𝑉𝑀 − 0.023𝐴𝑆𝐻 (𝑤𝑡. %) (A-3)
Where C, H and O are abbreviations of carbon, hydrogen and oxygen, respectively.
Additionally, FC, VM and ASH are also abbreviations of fixed carbon, volatile matter and ash,
respectively. According to the authors, these correlations have an applicability range as
summarized below.
Fixed Carbon 9.2% ≤ 𝐹𝐶 ≤ 32.79%
Volatile Matter 57.2% ≤ 𝑉𝑀 ≤ 90.6%
Ash 0.1% ≤ 𝐴𝑆𝐻 ≤ 24.6%
Carbon 36.2% ≤ 𝐶 ≤ 53.1%
Hydrogen 4.7% ≤ 𝐻 ≤ 6.61%
Oxygen 31.37% ≤ 𝑂 ≤ 48.0%
Page 142
142 Hydrogen Production through Gasification and Dark Fermentation
Nhuchhen et al., [97] proposed a new approach of linear and non-linear correlations for the
calculation of the higher heating value. Different published data of proximate analysis and
higher heating values were collected for the correlations derivation. Subsequently, the
developed correlations were validated using experimental higher heating values and proximate
analysis, and also with data reported in literature. The authors developed 20 linear and 4 non-
linear correlations with their respective standard deviation. Two correlations (1 linear and 1
non-linear) were selected since they have the lowest standard deviation and therefore, these
correlations were used in the calculation of the higher heating value.
𝐻𝐻𝑉 = 19.2880 − 0.2135 (𝑉𝑀
𝐹𝐶) − 1.9584 (
𝐴𝑆𝐻
𝑉𝑀) + 0.0234 (
𝐹𝐶
𝐴𝑆𝐻)
(A-4)
𝐻𝐻𝑉 = 20.7999 − 0.3214 (𝑉𝑀
𝐹𝐶) + 0.0051 (
𝑉𝑀
𝐹𝐶)
2
− 11.2277 (𝐴𝑆𝐻
𝑉𝑀)
+ 4.4953 (𝐴𝑆𝐻
𝑉𝑀)
2
− 0.7223 (𝐴𝑆𝐻
𝑉𝑀)
3
+ 0.0383 (𝐴𝑆𝐻
𝑉𝑀)
4
+ 0.0076 (𝐹𝐶
𝐴𝑆𝐻)
(A-5)
Tables A-1 and A-2 present the results of the experimental and correlation approach of the
elemental analysis and higher heating value of PP and CCS, respectively. Despite the nitrogen
content, the elemental analysis of the experimental and correlation approach have similar values
in terms of carbon, hydrogen and oxygen. Nitrogen content in the experimental determination
was quantified from the microanalyzer; however, the correlation approach does not consider this
element due to its low contribution to the biomass composition. On the other hand, the higher
heating value for both feedstocks has different values from the experimental and correlation
approach. Based on the results of the experimental and correlation approach, it can be concluded
that both procedures accurate describe the elemental composition and energy content of
lignocellulosic raw material.
Table A - 1. Results of the experimental and correlation approach in the PP elemental analysis
and calorific value
Pinus Patula Experimental data Correlation approach
Carbon (%) 49.78 49.23
Hydrogen (%) 6.03 6.00
Oxygen (%) 44.19 44.76
Nitrogen (%) 0.37 NRa
HHV (kJ/kg) 18,484 20,109b
19,974c
a Nitrogen content not calculated from the correlation approach b Linear correlation c Non-linear correlation
Page 143
Hydrogen Production through Gasification and Dark Fermentation 143
Table A - 2. Results of the experimental and correlation approach in the CCS elemental
analysis and calorific value
Coffee Cut-Stems Experimental data Correlation approach
Carbon (%) 48.21 49.09
Hydrogen (%) 5.61 6.02
Oxygen (%) 45.81 44.89
Nitrogen (%) 0.00 NRa
HHV (kJ/kg) 18,246 18,856b
19,324c
a Nitrogen content not calculated from the correlation approach b Linear correlation c Non-linear correlation
Page 144
144 Hydrogen Production through Gasification and Dark Fermentation
B. Gasification of Wood chips: Effect
of the temperature and gasifying agent
Short Internship in the Maryland
University, College Park, USA
Overview
Recently, the main focus of the research group directed by the professor Ashwani K. Gupta is
related to the clean conversion of biomass, wastes and low grade fuels to clean hydrogen-rich
syngas and liquid fuels. Therefore, the work that is presented below is related to the evaluation
of some parameters such as the gasifying agent (steam and carbon dioxide) flow rate and
reaction temperature in the syngas production, especially the effect of these parameters in the
hydrogen and carbon monoxide ratio. Steam gasification is a well-known technology that is
commonly used in the production of hydrogen due to its high hydrogen selectivity; however, the
high production of tar is one of the main drawbacks of this technology. On the other hand, the
gasification using carbon dioxide as gasifying agent has not been widely studied; although, it
has a lot of applications because of the fact that most of the processes generates carbon dioxide,
mainly the thermochemical technologies such as coal gasification, and therefore, this
greenhouse gas can be used as raw material in the production of high added-value bioenergy
products and reducing the GHG emissions into the atmosphere. The main drawback of this
thermochemical method is that an external heat source is required to maintain the gasification
temperature because the heat is not supplied by the partial combustion of biomass as in the case
of the air, oxygen or steam gasification [174].
Experimental Procedure
The experimental procedure was developed in the Combustion laboratory in the Maryland
University using a laboratory scale gasifier which consists, mainly, of a boiler to produce steam
according to the stoichiometric reaction between hydrogen and oxygen, a steam heater in order
to preheat all the gaseous and vapor species that undergoes into the reactor chamber containing
the wood sample. The gases from the gasification, first, goes into five bottles in which samples
Page 145
Hydrogen Production through Gasification and Dark Fermentation 145
are measured at different time intervals (0.5, 1, 2, 3 and 4 minutes). Subsequently, the behavior
of the gasification after first 5 minutes of the reaction was measured using a gas
chromatography. Nitrogen was used as carrier gas at constant flow (2.1 LPM) and it was used to
determine the flow rates of different gaseous species of the gasification [175].
In this study, carbon dioxide, steam and a mixture of these at different ratios were used as
gasifying agents in order to determine the performance of the gasification in terms of the H2/CO
ratio and total energy production. The results from the gasification with different gasifying
agents were compared with that from the pyrolysis of wood chips aiming to evaluate the
differences in the syngas composition and energy yield of both technologies. Yellow wood was
used as feedstock for the gasification and pyrolysis processes, and the elemental
characterization of this raw material was reported by Ahmed et al., [35]. Table B-1 presents the
elemental analysis and the calorific value of the Yellow wood used in the pyrolysis and
gasification procedures.
Table B - 1. Elemental composition of the Yellow wood.
Elemental
Analysis Carbon Hydrogen Oxygen Nitrogen Sulfur Chloride
LHV
[Mj/kg]
Yellow
Woodchips 52.6 7 40.1 0 0 0 22.3
Table B-2 summarizes the different conditions that were evaluated in the carbon dioxide
gasification in order to determine the suitable operation conditions at which the best H2/CO
ratios and energy production can be obtained. For this reason, five flow rates of carbon dioxide
were evaluated keeping constant the steam flow rate. Besides, four temperatures in the pyrolysis
and gasification case were assessed.
Table B - 2. Experimental conditions used in the evaluation of wood pyrolysis and gasification
Conditions Values Units
CO2 flow rate 2.7 3.65 5.4 6.25 8.1 g/min
Steam flow rate 4.42 g/min
CO2/Steam ratios 0.61 1.22 1.31 g CO2/ g H2O
Nitrogen flow rate (Inert gas) 2.1 LPM
Reactor Temperatures 700 800 900 1000 °C
Wood Sample 35 g of wood chips
Page 146
146 Hydrogen Production through Gasification and Dark Fermentation
Results and Discussion
Effect of the temperature in the hydrogen flow rate
Figures B-1, B-2 and B-3 present the effect of the temperature in the hydrogen flow rate profile
of the pyrolysis, steam gasification and CO2 gasification, respectively. The highest hydrogen
flow rate in the pyrolysis was obtained at a temperature of 1000°C in the first 2 minutes
(approximately 0.22 g per min); however, the hydrogen rate decreases rapidly until it reaches
zero at approximately 5 minutes. When the pyrolysis was carried out at lower temperature
(700°C), the hydrogen flow rate (0.05 g per min) is not as high as the pyrolysis at 1000°C, but
the reaction rate takes more time to reach zero (approximately 20 min). Therefore, the best
hydrogen production performance in the pyrolysis process can be obtained at 700°C. In the case
of the steam and dry gasification, the highest hydrogen flow rate was obtained at 1000°C in the
first two minutes of the process. Nevertheless, the CO2 gasification reaches the zero flow rate in
5 min, whereas the steam gasification took approximately 20 min to reach zero hydrogen flow
rate. Slow reaction kinetics of char gasification, using steam as gasifying agent, leads to
increase the gasification reaction time. The best hydrogen performance profile for both
gasifying agents was obtained at 900°C with higher reaction time in the steam gasification
(approximately 40 min), which means that the char-steam reaction is more favorable at this
condition.
Figure B - 1. Effect of the temperature in the hydrogen flow rate of the wood chips pyrolysis
Page 147
Hydrogen Production through Gasification and Dark Fermentation 147
Figure B - 2 Effect of the temperature in the hydrogen flow rate of the wood chips steam
gasification
Figure B - 3. Effect of the temperature in the hydrogen flow rate of the wood chips CO2
gasification
Aiming to improve the performance of the dry gasification, different mixtures of CO2 and steam
as gasifying agent were tested in the gasification of wood chips. Three CO2/steam ratios were
selected as presented in Table B-2. For this purpose, the effect of two temperatures in the
hydrogen flow rate were evaluated: 900°C and 1000°C. Figure B-4 presents the effect of the
temperature in the hydrogen flow rate for three CO2/steam ratios. As expected, the use of carbon
dioxide along with steam as gasifying agent improve the hydrogen flow rate in comparison to
the results obtained in the dry gasification of wood chips. At a CO2 rate of 5.4 g min-1 and
900°C, the maximum hydrogen flow rate in the dry gasification was 0.092 g min-1, whereas the
same CO2 flowrate mixed with steam generated a hydrogen flow rate of 0.12 g min-1. According
Page 148
148 Hydrogen Production through Gasification and Dark Fermentation
to this, the use of steam in the dry gasification improves the hydrogen production performance
along with the reaction extend.
Figure B - 4. Effect of the temperature and the CO2/steam ratio in the hydrogen flow rate in the
wood chips gasification. CO2/steam ratios: (A) 1.31 (B) 1.22 and (C) 0.61 g CO2/g steam
Page 149
Hydrogen Production through Gasification and Dark Fermentation 149
Effect of the H2/CO ratio
From the gaseous species that are generated in the gasification of wood chips, hydrogen and
carbon monoxide are considered the most important fuel components of the synthesis gas since
a high H2/CO ratio could increase the energy efficiency of the process. Figure B-5 presents the
behavior of the H2/CO ratio at different temperatures in the three main evaluated processes:
pyrolysis, carbon dioxide and steam gasification. In the pyrolysis, the highest ratio was obtained
at 700°C and the concentration of hydrogen decreases as the temperature increases. The main
reaction that takes place in the dry gasification is the Boudouard reaction [174], from which the
main product is carbon monoxide. According to this, the H2/CO ratio decreases as the
gasification temperature increases. In the steam gasification, the highest H2/CO ratio was
obtained at 900°C and subsequently, the ratio decreases as the temperature increases. From the
three evaluated processes, steam gasification has the highest H2/CO ratio due to high influence
of the water-gas shift reaction, which uses the carbon monoxide to produce more hydrogen.
Figure B - 5. Effect of the temperature in the H2/CO ratio of the three evaluated processes:
pyrolysis, dry and steam gasification.
The H2/CO ratio was also evaluated considering different CO2/steam ratios. Figure B-6 presents
the behavior of the H2/CO ratio in terms of the temperature and the CO2/steam mixtures. Two
main results were obtained from this evaluation: First, a mixture with high amount of carbon
dioxide (CO2/steam = 1.31) generates a low H2/CO ratio (0.08 g H2/g CO), whereas a low
carbon dioxide content (CO2/steam = 0.61) in the gasifying agent produces higher content of
hydrogen. From Figure B-5, the H2/CO ratio of the dry gasification is 0.006, whereas the
H2/CO ratio in Figure B-6, using the same CO2 flow rate (5.4 g min-1) mixed with steam, is
Page 150
150 Hydrogen Production through Gasification and Dark Fermentation
0.087. Therefore, the conversion of wood chips into a mixture of hydrogen and carbon
monoxide is increased when the gasifying agent is a mixture between CO2 and steam.
Figure B - 6. Effect of the temperature and the CO2/steam mixture in the H2/CO ratio in the
wood gasification. CO2/steam ratios: ratio 1 (0.61), ratio 2 (1.22) and ratio 3 (1.31)
Energy yield
Table B-3 summarizes the results of all the experimental procedures developed in the
University of Maryland based on the amount of hydrogen and carbon monoxide that was
obtained from each of the experimental runs. When steam was used as gasifying agent, either
alone or mixed, high hydrogen content can be obtained and thus, this technology is commonly
used to produce hydrogen. On the other hand, dry gasification has a low hydrogen content;
nevertheless, the amount of carbon monoxide that is generated from the Boudouard reaction is
high. Therefore, the main application of this technology may be in the generation of electricity
through the combustion of the generated syngas in a gas engine. Moreover, CO2 generates high
environmental impacts to the Global Warming; therefore, its valorization aiming to generate
electricity seems to be a promising option, especially in zones where the electricity supply is
limited. Based on the previous statements, the energy yield of the three main evaluated
processes is presented in Figure B-7. It is evidenced that the amount of energy that can be
obtained from the dry gasification is higher than steam gasification and pyrolysis since most
wood chips are converted into high amounts of carbon monoxide (with low hydrogen content),
which can be used as fuel in gas engine to produce electricity. It is noteworthy that the energy
yield of the dry gasification increases with the temperature, which confirms the effect of the
Boudouard reaction in the carbon monoxide production.
Page 151
Hydrogen Production through Gasification and Dark Fermentation 151
Figure B-7. Effect of the temperature in the energy yield of the three evaluated processes
Table B-3. Amount of hydrogen and carbon monoxide obtained in the experimental runs
Process Amount of Hydrogen (g) Amount of Carbon Monoxide (g)
Temperature: 700°C
Pyrolysis 0.318 5.65
Dry Gasification 0.106 8.98
Steam Gasification 0.425 2.73
Temperature 900°C
Pyrolysis 0,32 6.9
Dry Gasification 0.261 44.68
Steam Gasification 1.90 7.64
CO2/steam = 1.31 1.25 15.25
CO2/steam = 1.22 1.21 13.85
CO2/steam = 0.61 1.34 10.06
Temperature 1000°C
Pyrolysis 0.29 8.51
Dry Gasification 0.44 58.67
Steam Gasification 1.54 9.48
CO2/steam = 1.31 0.90 13.11
CO2/steam = 1.22 1.19 12.16
CO2/steam = 0.61 1.31 13.82
Page 152
152 Hydrogen Production through Gasification and Dark Fermentation
Final Remarks
Currently, new efforts have been developed aiming to reduce the amount of GHG emissions
into the atmosphere, especially related to CO2. The use of carbon dioxide as gasifying agent
seems to be one of the solutions that can be implemented in order to reduce the GHG emission
to the environment and simultaneously, its valorization in an integrated process. A synthesis gas
with high carbon monoxide content and high energy yield was generated from the CO2
gasification, which can be used in the generation of electricity through gas engines. However,
the hydrogen content in the syngas from the dry gasification is very low. In this sense, a mixture
of gasifying agents should be used to improve the hydrogen content in the synthesis gas. In this
research stay, different CO2/steam mixtures were tested in order to enhance the productivity and
energy efficiency of the dry gasification. Higher H2/CO ratios and energy efficiencies were
obtained when carbon dioxide was mixed with steam as gasifying agents.
The main objective of this short-internship in the Maryland University was related to the use of
different gasifying agents (carbon dioxide and steam) to produce a synthesis gas with high
calorific value and H2/CO ratio that can be used as an alternative for the production of
bioenergy in Colombia, mostly the dry gasification using CO2 as gasifying agent.
Page 153
Hydrogen Production through Gasification and Dark Fermentation 153
C. Kinetic Models
Table C-1. Kinetic models used in the simulation procedure of the stand-alone and biorefinery
pathways to produce hydrogen through gasification and dark fermentation. Technologies (1)
Acid Hydrolysis, (2) Enzymatic Saccharification, (3) Gasification, (4) Dark Fermentation and
(5) Ethanol Fermentation
Technology Kinetic Model Parameters Conditions Ref
(1)
Xylan to Xylose
[𝑋] =𝑘1[𝑋𝑛𝑝]
𝑘2 − 𝑘1(𝑒−𝑘1𝑡 − 𝑒−𝑘2𝑡) + [𝑋𝑜]𝑒−𝑘2𝑡
Cellulose to Glucose
[𝐺] = [𝐺𝑝](1 − 𝑒−𝑘3𝑡)
Furfural formation
[𝐹] = [𝐹𝑝](1 − 𝑒−𝑘4𝑡)
Acetic acid formation
[𝐴] = [𝐴𝑝](1 − 𝑒−𝑘5𝑡)
[𝑋𝑛𝑝] = potential concentration of xylan
[𝐺𝑝], [𝐹𝑝] 𝑎𝑛𝑑 [𝐴𝑝] = potential concentration of
glucose, furfural and acetic acid.
[𝑋𝑛𝑝] = 20.75 g xylose/l
𝑘1=0.03522 min-1
𝑘2=0.00381 min-1
[𝐺𝑝]= 8.02 g/l
𝑘3=0.01134 min-1
[𝐹𝑝]= 1.81 g/l
𝑘4=0.0045 min-1
[𝐴𝑝]= 4.55 g/l
𝑘5=0.04188 min-1
Sulfuric acid
concentration:
2wt.%
Temperature:
121°C
[107]
(2)
Cellulose to Cellobiose
𝑟1 =𝑘1,𝑟𝐶𝐸1𝐵
𝑅𝑠𝐶𝑠
1 +𝐶𝐺2
𝐾1𝐼𝐺2+
𝐶𝐺𝐾1𝐼𝐺
+𝐶𝑋𝑦
𝐾1𝐼𝑋𝑦
Cellulose to glucose
𝑟2 =𝑘2,𝑟(𝐶𝐸1𝐵
+ 𝐶𝐸2𝐵)𝑅𝑠𝐶𝑠
1 +𝐶𝐺2
𝐾2𝐼𝐺2+
𝐶𝐺𝐾2𝐼𝐺
+𝐶𝑋𝑦
𝐾2𝐼𝑋𝑦
Cellobiose to glucose
𝑘1𝑟 = 22.3 g·mg-1·h-1
𝑘2𝑟 = 7.18 g·mg-1·h-1
𝑘3𝑟 = 285.5 g·mg-1·h-1
𝐸𝑎1= 𝐸𝑎2
= 𝐸𝑎3= -23190
J·mol-1
𝐾1𝐼𝐺2 = 0.015 g/l
𝐾1𝐼𝐺 = 0.1 g/l
𝐾1𝐼𝑋𝑦 = 0.1 g/l
Temperature:
50°C [129]
Page 154
154 Hydrogen Production through Gasification and Dark Fermentation
𝑟3 =𝑘3,𝑟𝐶𝐸2𝐹
𝐶𝐺2
𝐾3𝑀 (1 +𝐶𝐺
𝐾3𝐼𝐺+
𝐶𝑋𝑦
𝐾3𝐼𝑋𝑦) + 𝐶𝐺2
Enzyme adsorption
𝐶𝐸𝑖𝐵=
𝐸𝑖𝑚𝑎𝑥𝐾𝑖𝑎𝑑𝐶𝐸𝑖𝐹
𝐶𝑠
1 + 𝐾𝑖𝑎𝑑𝐶𝐸𝑖𝑓
Enzyme
𝐶𝐸𝑖𝑇= 𝐶𝐸𝑖𝐹
+ 𝐶𝐸𝑖𝐵
Substrate Reactivity
𝑅𝑠 =𝐶𝑠
𝑆𝑜
Temperature dependence
𝑘𝑖𝑟 = 𝑘𝑖𝑟(𝑇𝐼) exp (−𝐸𝑎𝑖
𝑅𝑇)
𝐶𝐺2[Cellobiose], 𝐶𝐺[Glucose], 𝐶𝑋𝑦[Xylose],
𝐶𝑠[Cellulose]
𝐾2𝐼𝐺2 = 132.0 g/l
𝐾2𝐼𝐺 = 0.04 g/l
𝐾2𝐼𝑋𝑦 = 0.2 g/l
𝐾3𝐼𝑋𝑦 = 201 g/l
𝐾3𝑀 = 24.3 g/l
𝐸1𝑚𝑎𝑥 = 0.06 g/g
𝐸2𝑚𝑎𝑥 = 0.01 g/g
𝐸𝑎,1 = 111600 J·mol-1
𝐾1𝑎𝑑 = 0.4 g/g
𝐾2𝑎𝑑 = 0.1 g/g
(3)
Gasification based on the elemental analysis of
the raw material, stoichiometric approach using
free Gibbs energy minimization method.
Involved components
H2, CO2, CO, CH4, N2, O2, H2O, CxHyOz
Chemical Approach
Gasification
temperature:
850 °C
Pressure:
1 atm
[100]
(4)
Substrate Uptake
𝑑𝑆
𝑑𝑡= −𝑢𝑚𝑎𝑥 ∗ 𝐼 ∗ (
𝑆
𝑆 + 𝐾𝑠) ∗ 𝑋
pH inhibition
𝐼 = exp (−3 ∗ (𝑝𝐻 − 𝑝𝐻𝑢
𝑝𝐻𝑢 − 𝑝𝐻𝑖)
2
)
Biomass Growth
𝑑𝑋
𝑑𝑡= −𝑌𝑥/𝑠 ∗
𝑑𝑆
𝑑𝑡
Products formation
𝑑𝐻2
𝑑𝑡= −𝑌1 ∗
𝑑𝑆
𝑑𝑡
𝑑𝐴𝑐
𝑑𝑡= −𝑌2 ∗
𝑑𝑆
𝑑𝑡
𝑑𝐵𝑢𝑡
𝑑𝑡= −𝑌3 ∗
𝑑𝑆
𝑑𝑡
𝑢𝑚𝑎𝑥 = 0.31 h-1
𝐾𝑠 = 1.47 g/l
𝑌𝑥/𝑠 = 0.135 g/g
𝑌1 = 0.0127 g/g
𝑌2 = 0.1928 g/g
𝑌3 = 0.1278 g/g
𝑌4 = 0.1597 g/g
𝑌5 = 0.0521 g/g
𝑝𝐻𝑢 = 7
𝑝𝐻𝑖 = 4
Temperature:
60°C
pH = 6.25
Microorganism:
Thermoanaer
obacterium
thermosacch
arolitycum
[119]
Page 155
Hydrogen Production through Gasification and Dark Fermentation 155
𝑑𝐶𝑂2
𝑑𝑡= −𝑌4 ∗
𝑑𝑆
𝑑𝑡
𝑑𝐸𝑡𝑜𝐻
𝑑𝑡= −𝑌5 ∗
𝑑𝑆
𝑑𝑡
𝑑𝐻2
𝑑𝑡 [Hydrogen],
𝑑𝐴𝑐
𝑑𝑡 [Acetic Acid],
𝑑𝐵𝑢𝑡
𝑑𝑡 [butyric
acid], 𝑑𝐶𝑂2
𝑑𝑡 [Carbon dioxide],
𝑑𝐸𝑡𝑜𝐻
𝑑𝑡 [Ethanol]
(5)
Glucose consumption
𝑅𝑠1 = 𝛼𝑞𝑠𝑚𝑎𝑥1 (𝐶𝑠1
𝐾𝑠𝑠1 + 𝐶𝑠1) (1
−𝐶𝑝 − 𝑃𝑖𝑠1
𝑃𝑚𝑠1 − 𝑃𝑖𝑠1) (
𝐾𝑖𝑠1
𝑘𝑖𝑠1 + 𝐶𝑠1) 𝐶𝑥
Xylose consumption
𝑅𝑠2
= (1 − 𝛼)𝑞𝑠𝑚𝑎𝑥2 (𝐶𝑠2
𝐾𝑠𝑠2 + 𝐶𝑠2) (1
−𝐶𝑝 − 𝑃𝑖𝑠2
𝑃𝑚𝑠2 − 𝑃𝑖𝑠2) (
𝐾𝑖𝑠2
𝑘𝑖𝑠2 + 𝐶𝑠2) 𝐶𝑥
Ethanol production
𝑅𝑝 = [𝛼𝑞𝑝𝑚𝑎𝑥1 (𝐶𝑠1
𝐾𝑠𝑝1 + 𝐶𝑠1
) (1
−𝐶𝑝 − 𝑃𝑖𝑝1
𝑃𝑚𝑝1 − 𝑃𝑖𝑝1
) (𝐾𝑖𝑝1
𝑘𝑖𝑝1 + 𝐶𝑠1
)
+ (1 − 𝛼)𝑞𝑝𝑚𝑎𝑥2 (𝐶𝑠2
𝐾𝑠𝑝2 + 𝐶𝑠2
) (1
−𝐶𝑝 − 𝑃𝑖𝑝2
𝑃𝑚𝑝2 − 𝑃𝑖𝑝2
) (𝐾𝑖𝑝2
𝑘𝑖𝑝2 + 𝐶𝑠2
)] 𝐶𝑥
Biomass Growth
𝑅𝑥
= [𝛼𝑢𝑚𝑎𝑥1 (𝐶𝑠1
𝐾𝑠𝑥1 + 𝐶𝑠1) (1
−𝐶𝑝 − 𝑃𝑖𝑥1
𝑃𝑚𝑥1 − 𝑃𝑖𝑥1) (
𝐾𝑖𝑥1
𝑘𝑖𝑥1 + 𝐶𝑠1)
+ (1 − 𝛼)𝑢𝑚𝑎𝑥2 (𝐶𝑠2
𝐾𝑠𝑥2 + 𝐶𝑠2) (1
−𝐶𝑝 − 𝑃𝑖𝑥2
𝑃𝑚𝑥2 − 𝑃𝑖𝑥2) (
𝐾𝑖𝑥2
𝑘𝑖𝑥2 + 𝐶𝑠2)] 𝐶𝑥
𝛼 = 0.65
𝑢𝑚𝑎𝑥1 = 0.31 𝑢𝑚𝑎𝑥2 = 0.1
𝐾𝑠𝑥1 = 1.45 𝐾𝑠𝑥2 = 4.91
𝑃𝑚𝑥1 = 57.2 𝑃𝑚𝑥2 = 56.3
𝑘𝑖𝑥1 = 200 𝑘𝑖𝑥2 = 600
𝑃𝑖𝑥1= 28.9 𝑃𝑖𝑥1= 26.6
𝑞𝑠𝑚𝑎𝑥1 = 10.9 𝑞𝑠𝑚𝑎𝑥2 = 3.27
𝐾𝑠𝑠1 = 6.32 𝐾𝑠𝑠2 = 0.03
𝑃𝑚𝑠1 = 75.4 𝑃𝑚𝑠2 = 81.2
𝐾𝑖𝑠1 = 186 𝐾𝑖𝑠2 = 600
𝑃𝑖𝑠1 = 42.6 𝑃𝑖𝑠2 = 53.1
𝑞𝑝𝑚𝑎𝑥1 = 5.12 𝑞𝑝𝑚𝑎𝑥2 = 1.59
𝐾𝑠𝑝1 = 6.32 𝐾𝑠𝑝2 = 0.03
𝑃𝑚𝑝1 = 75.4 𝑃𝑚𝑝2 = 81.2
𝐾𝑖𝑝1 = 186 𝐾𝑖𝑝2 = 600
𝑃𝑖𝑝1 = 42.6 𝑃𝑖𝑝2 = 53.1
Temperature:
35°C
Microorganism:
Zymomonas
mobilis
[136]
Page 157
D. Mathematical modelling of biomass
gasification for hydrogen production
Introduction
Mathematical modeling of gasification processes has high complexity; however, different
mechanisms have been proposed to simulate this technology in different reaction zones. Depending
on the complexity of the mathematical model, different procedures have been assessed [8], [9],
[126], [176]–[178]. Different mathematical models can be used to describe the behavior of a
downdraft gasifier. Among these, the kinetic models predict the progress and product composition
at different positions along a reactor, whereas an equilibrium model predicts the maximum
achievable yield of a desired product from a reacting system. The neural network model predicts
the gas yield and composition from gasification processes. It does not require the mathematical
description of the phenomena involved in the process and therefore, it might be useful in the
simulation and up-scaling of complex biomass gasification processes. However, its main limitation
is the amount and quality of the provided data. The main objective of these models is to study the
thermochemical pathways involve in the gasification and evaluate the influence of the major
process variables such as moisture content, air / biomass ratio, reaction temperature, composition
and energy content of the produced gas [179].
The chemical pathway of a gasification can be divided in three zones as previously described in
section 4.6.3. In the pyrolysis and combustion zones, it is not possible to describe the concentration
profile of the gas species, for this reason, a thermodynamic equilibrium model was used to
determine the maximum product yields in each zone. The reduction zone is the most important
stage in the gasification since the synthesis gas is generated there. Given the importance of the
reduction zone, a kinetic model was used to describe the concentration profile of the gas mixture.
The aim of this section is to evaluate the effect of two process parameters (moisture content and
equivalence ratio (ER)) in the synthesis gas production from two wood residues in Colombia
Page 158
158 Hydrogen Production through Gasification and Dark Fermentation
(Coffee Cut-Stems and Pinus Patula). Thermodynamic equilibrium and kinetic models were used
to carry out the mathematical modelling of the synthesis gas production in a three-zone downdraft
gasifier. The effect of the major process variables such as moisture content and the air / biomass
ratio in the composition and energy content of the generated gas were also assessed. The effect of
the evaluated parameters was used as guideline in the energetic and exergetic assessment aiming to
determine the suitable process conditions for the gasification simulation.
Model description
Figure D-1 describes the three zones in which a downdraft gasifier can be divided. Biomass is feed
in the top of the equipment, whereas the gasifying agent (in this case, air) undergoes from the
bottom to the top of the gasifier. Given this behavior, the first reaction that takes places is the
pyrolysis, followed by the combustion and then, the reduction. In this section, the thermodynamic
and kinetic models used in each zone of the downdraft gasifier are described. Some assumption of
the model are:
- The model evaluates only the reactions that take place inside the reactor to produce the
synthesis gas.
- The model predicts the production of H2-rich synthesis gas; therefore, additional separation
equipment must be incorporated in order to separate the hydrogen. However, in the
mathematical modelling were not considered.
- Heat losses are directly related to the gasifier temperature. The air/biomass ratio and the
energy content of the feedstock (in terms of Higher Heating Value, HHV) govern the
behavior of the reactor. For this reason, the heat losses may be calculated as the product
between the air/biomass ratio and the HHV. The heat losses are ruled for the maximum
temperature in each zone, from which the heat transfer into the environment is going to be
distribute between the zones [126].
Pyrolysis zone model
The mathematical modelling of the pyrolysis zone is governed by the following assumptions:
50% of the hydrogen presents in the biomass (𝐶𝐻𝑚𝑂𝑛) is converted into methane.
Due to absence of air, the elemental balance for oxygen does not take into account the
contribution of air.
The products from the pyrolysis are C, H2, CO, CO2, CH4, H2O
Page 159
Hydrogen Production through Gasification and Dark Fermentation 159
The biomass conversion to the previously selected products in this zone is defined by the
stoichiometric reaction Eq. D-1.
𝐶𝐻𝑚𝑂𝑛 + 𝑤𝐻2𝑂 → 𝑥𝑝1𝐶 + 𝑥𝑝2𝐻2 + 𝑥𝑝3𝐶𝑂 + 𝑥𝑝4𝐶𝑂2 + 𝑥𝑝5𝐶𝐻4 + 𝑥𝑝6𝐻2𝑂 (D-1)
Where 𝐶𝐻𝑚𝑂𝑛 is the chemical representation of biomass (dry basis). The m and n subscripts were
calculated from the elemental analysis of the raw material. The 𝑥𝑝𝑛 fractions represent the number
of moles in each one of the pyrolysis products.
From the Eq. D-1, the mass balance (elemental balance C, H, O) can be obtained as follows
- Balance for C
𝑥𝑝1 + 𝑥𝑝3 + 𝑥𝑝4 + 𝑥𝑝5 = 1 (D-2)
- Balance for H
2 ∗ 𝑥𝑝2 + 4 ∗ 𝑥𝑝5 + 2 ∗ 𝑥𝑝6 = 𝑚 + 2 ∗ 𝑤 (D-3)
- Balance for O
𝑥𝑝3 + 2 ∗ 𝑥𝑝4 + 𝑥𝑝6 = 𝑛 + 𝑤 (D-4)
Figure D-1. Scheme of a downdraft gasifier using wood residues as feedstock
Combustion zone model
The combustion zone modelling based on the thermodynamic equilibrium model has the following
assumptions.
The resulting hydrogen fraction in the pyrolysis zone are completely oxidized to produce
water due to its high combustion rate [126].
Page 160
160 Hydrogen Production through Gasification and Dark Fermentation
Oxygen fraction will be totally consume in the char oxidation because of the large reaction
area available for the O2 adsorption in the high reactive char from the pyrolysis zone.
Methanation (𝐶 + 2𝐻2 → 𝐶𝐻4) reaction is developed in the char surface, where the
equilibrium is reached. According to this, the equilibrium constant related to the number of
moles of hydrogen and methane can be calculated as follows.
𝑘1 =𝑥𝑝5
𝑥𝑝22
(D-5)
The main products in the combustión zone are C, CO, CO2, CH4, H2O y N2.
Global reaction in the oxidation zone can be describe by the following stoichiometric reaction.
𝑥𝑝1𝐶 + 𝑥𝑝2𝐻2 + 𝑥𝑝3𝐶𝑂 + 𝑥𝑝4𝐶𝑂2 + 𝑥𝑝5𝐶𝐻4 + 𝑥𝑝6𝐻2𝑂 + 𝑎(𝑂2 + 3.76𝑁2)
→ 𝑥𝑐1𝐶 + 𝑥𝑐2𝐶𝑂 + 𝑥𝑐3𝐶𝑂2 + 𝑥𝑐4𝐶𝐻4 + 𝑥𝑐5𝐻2𝑂 + 𝑥𝐶6𝑁2
(D-6)
Where 𝑎 is the number of moles of oxygen per mol of raw material and can be calculate from the
elemental balance for oxygen. The fractions 𝑥𝐶𝑛 represent the number of moles of the main
products in the oxidation zone.
From the general stoichiometric reaction, the elemental balances (C, H, O y N) were calculated.
- Balance for C
𝑥𝑝1 + 𝑥𝑝3 + 𝑥𝑝4 + 𝑥𝑝5 = 𝑥𝑐1 + 𝑥𝑐2 + 𝑥𝑐3 + 𝑥𝑐4 (D-7)
- Balance for H
2 ∗ 𝑥𝑝2 + 4 ∗ 𝑥𝑝5 + 2 ∗ 𝑥𝑝6 + 2 ∗ 𝑎 = 𝑥𝑐2 + 4 ∗ 𝑥𝑐4 + 2 ∗ 𝑥𝐶5 (D-8)
- Balance for O
𝑥𝑝3 + 2 ∗ 𝑥𝑝4 + 𝑥𝑝6 = 𝑥𝑐2 + 2 ∗ 𝑥𝐶3 + 𝑥𝑐5 (D-9)
- Balance for N
(3.76 ∗ 2)𝑎 = 2 ∗ 𝑥𝑐6 (D-10)
Reduction zone model
Unlike the pyrolysis and combustion zone, kinetic models were used to simulate the reduction
zone. After all the oxygen, present in the air, is consume in the combustion zone, and the pyrolysis
products are also decomposed into low-molecular weight compounds; the remaining produced char
Page 161
Hydrogen Production through Gasification and Dark Fermentation 161
in this two zones undergoes into the reduction zone, where five reactions describe the formation of
six gaseous species.
Boudouard Reaction 𝐶𝑠 + 𝐶𝑂2 → 2𝐶𝑂 (D- 11)
Water – Gas Reaction 𝐶𝑠 + 𝐻2𝑂 → 𝐶𝑂 + 𝐻2 (D-12)
Methanation Reaction 𝐶𝑠 + 2𝐻2 → 𝐶𝐻4 (D-13)
Steam Reforming reaction 𝐶𝐻4 + 𝐻2𝑂 → 𝐶𝑂 + 3𝐻2 (D-14)
Water – Gas Shift Reaction 𝐶𝑂 + 𝐻2𝑂 → 𝐶𝑂2 + 𝐻2 (D-15)
The kinetic model uses Arrhenius type-equations which are function of the temperature as
presented in Table D-1 [176].
Table D-1. Kinetic rate equation for the reduction zone
Reaction Kinetic rate
Boudouard Reaction 𝑟1 = 𝑛𝐴1 exp (−𝐸1
𝑅𝑇) (𝑃𝐶𝑂2
−𝑃𝐶𝑂
2
𝐾1) (D-18)
Water – Gas Reaction 𝑟2 = 𝑛𝐴2 exp (−𝐸2
𝑅𝑇) (𝑃𝐻2𝑂 −
𝑃𝐶𝑂 ∗ 𝑃𝐻2
𝐾2) (D-19)
Methanation Reaction 𝑟3 = 𝑛𝐴3 exp (−𝐸3
𝑅𝑇) (𝑃𝐻2
2 −𝑃𝐶𝐻4
2
𝐾3) (D-20)
Steam Reforming reaction 𝑟4 = 𝑛𝐴4 exp (−𝐸4
𝑅𝑇) (𝑃𝐶𝐻4
∗ 𝑃𝐻2𝑂 −𝑃𝐶𝑂 ∗ 𝑃𝐶𝐻4
2
𝐾4) (D-21)
Water – Gas Shift Reaction 𝑟5 = 𝑛𝐴5 exp (−𝐸5
𝑅𝑇) (𝑃𝐶𝑂2
∗ 𝑃𝐻2−
𝑃𝐶𝑂 ∗ 𝑃𝐻2𝑂
𝐾5) (D-22)
The activation energy and frequency factor values were taken from reported data in literature for
each gas specie and reaction involve in the reduction zone [9], [177], [178]. 𝑛 is the char reactivity
factor. It indicates the degree of burn-off and number of active sites on char and its particle size
[9]. The value of CRF may vary between 10 and 10,000 and sometimes exponentially or linearly,
for the present models it is taken as 100. Table D-2 summarizes the equilibrium constant,
activation energy and frequency factor used for each reaction involve in the reduction zone.
Page 162
162 Hydrogen Production through Gasification and Dark Fermentation
Table D-2. Activation energy data [9].
Reaction number 𝑨𝒊 (𝟏𝒔⁄ ) 𝑬𝒊 (𝒌𝑱
𝒎𝒐𝒍⁄ )
D-18 36.16 77.39
D-19 15.17𝑥104 121.62
D-20 4.189𝑥10−3 19.21
D-21 7.301𝑥10−2 36.15
D-22 2.842𝑥10−2 32.84
The equilibrium constant is a temperature dependent factor and it is calculated based on the Gibbs
function. The equilibrium constant for the five reactions that are involved in the reduction zone
were calculated as follows [9].
𝐾𝑒𝑞,1 = 𝑒−(2
𝑔𝐶𝑂° (𝑇)𝑅𝑇
−𝑔𝐶𝑂2
° (𝑇)
𝑅𝑇−
𝑔𝐶° (𝑇)𝑅𝑇
)
(D-23)
𝐾𝑒𝑞,2 = 𝑒−(
𝑔𝐶𝑂° (𝑇)𝑅𝑇
+𝑔ℎ2
° (𝑇)
𝑅𝑇−
𝑔𝐻2𝑂° (𝑇)
𝑅𝑇−
𝑔𝐶° (𝑇)𝑅𝑇
)
(D-24)
𝐾𝑒𝑞,3 = 𝑒−(
𝑔𝐶𝐻4° (𝑇)
𝑅𝑇−2
𝑔𝐻2° (𝑇)
𝑅𝑇−
𝑔𝐶° (𝑇)𝑅𝑇
)
(D-25)
𝐾𝑒𝑞,4 = 𝑒−(
𝑔𝐶𝑂° (𝑇)𝑅𝑇
+3𝑔ℎ2
° (𝑇)
𝑅𝑇−
𝑔𝐻2𝑂° (𝑇)
𝑅𝑇−
𝑔𝐶𝐻4° (𝑇)
𝑅𝑇)
(D-26)
𝐾𝑒𝑞,2 = 𝑒−(
𝑔𝐶𝑂° (𝑇)𝑅𝑇
+𝑔𝐻2𝑂
° (𝑇)
𝑅𝑇−
𝑔ℎ2° (𝑇)
𝑅𝑇−
𝑔𝐶𝑂2° (𝑇)
𝑅𝑇)
(D-27)
Where
𝑔𝑖°(𝑇)
𝑅𝑇= 𝐴𝑔𝑖 + 𝐵𝑔𝑖𝑇 + 𝐶𝑔𝑖𝑇2 + 𝐷𝑔𝑖𝑇3 + 𝐸𝑔𝑖𝑇4 +
𝐹𝑔𝑖
𝑇+ 𝐺𝑔𝑖 ln 𝑇 (D-28)
The values of the constants A, B, C, D, E, F and G were taken from Table D-3 for each gaseous
specie in a temperature range of 1000 – 5000 K [9].
Table D-3. Values of the constants for the Gibbs function calculation
Species Ag Bg Cg Dg Eg Fg Gg
CO -3,083139 -7,21E-04 9,38E-08 -8,49E-12 1,16E-15 -1,43E+04 -3,03E+00
CO2 5,409019 -1,57E-03 2,13E-07 -2,00E-11 2,78E-15 -4,90E+04 -4,45E+00
H2 4,346533 -3,50E-04 9,39E-09 7,69E-13 -2,64E-16 -8,35E+02 -2,99E+00
H2O -4,190672 -1,53E-03 1,46E-07 -1,00E-11 1,07E-15 -2,99E+04 -2,67215
CH4 -7,939917 -5,12E-03 6,45E-07 -5,65E-11 7,51E-15 -1,01E+04 -1,68E+00
𝐶𝑠 1,02E+01 -8,31E-04 1,11E-07 -1,08E-11 1,53E-15 -7,07E+02 -1,49E+00
Page 163
Hydrogen Production through Gasification and Dark Fermentation 163
The modelling procedure was divided in two sections: first, the pyrolysis and combustion zones
were modeled using the thermodynamic equilibrium model in the computational tool Engineering
Equation Solver (EES) (F-chart software, Wisconsin, USA). And finally, the reduction zone was
simulated in the software Matlab (MathWorks, USA) using Arrhenius-type kinetic models.
Energy Analysis
All processes must satisfy the first law of thermodynamics, which is related with the energy
conservation (Eq. 29).
∑ 𝐻𝑖𝑛 − ∑ 𝐻𝑜𝑢𝑡 = 𝑄𝑙𝑜𝑠𝑠 (D-29)
Where 𝐻 is the enthalpy of the reactants and products in the gasification process and 𝑄 is the
amount of energy lost as heat through the gasifier. Considering the chemical energy of the gas as
the main objective of the process, the gasification efficiency can be calculated as follows Eq. D-30.
𝜂 =�̇�𝑠𝑦𝑛𝑔𝑎𝑠 ∗ 𝐿𝐻𝑉𝑠𝑦𝑛𝑔𝑎𝑠
�̇�𝑏𝑖𝑜𝑚𝑎𝑠𝑠 ∗ 𝐿𝐻𝑉𝑏𝑖𝑜𝑚𝑎𝑠𝑠 (D-30)
Where �̇�𝑠𝑦𝑛𝑔𝑎𝑠 and �̇�𝑏𝑖𝑜𝑚𝑎𝑠𝑠 represent the mass flow of the synthesis gas and biomass,
respectively. 𝐿𝐻𝑉𝑠𝑦𝑛𝑔𝑎𝑠 and 𝐿𝐻𝑉𝑏𝑖𝑜𝑚𝑎𝑠𝑠 are the calorific values of the syngas and biomass,
respectively. The energy content of the biomass was calculated using lineal correlations based on
experimental data of the chemical composition of different raw materials.
Exergy Analysis
The exergy of a system is defined as the maximum shaft work that can be done by the composite of
the system and a specified reference environment. The reference environment is assumed to be
infinite, in equilibrium, and to enclose all other systems. Typically, the environment is specified by
stating its temperature, pressure, and chemical composition [180]. The corresponding exergy
balance of a steady-state process obeys the equation:
𝐸𝑥𝑏𝑖𝑜𝑚𝑎𝑠𝑠 + 𝐸𝑥𝑎𝑔𝑒𝑛𝑡 = 𝐸𝑥𝑠𝑦𝑛𝑔𝑎𝑠 + 𝐸𝑥𝑎𝑠ℎ ∗ 𝐼 (D-31)
Where 𝐸𝑥𝑏𝑖𝑜𝑚𝑎𝑠𝑠, 𝐸𝑥𝑎𝑔𝑒𝑛𝑡, 𝐸𝑥𝑠𝑦𝑛𝑔𝑎𝑠 y 𝐸𝑥𝑎𝑠ℎ represent the biomass, gasifying agent (air),
synthesis gas and ash exergy, respectively. 𝐼 is the irreversibility of the system. The exergy in a
stream can be calculated as the sum of its chemical 𝐸𝑥𝑐ℎ and physical exergy 𝐸𝑥𝑝ℎ.
𝐸𝑥 = 𝐸𝑥𝑐ℎ + 𝐸𝑥𝑝ℎ (D-32)
Page 164
164 Hydrogen Production through Gasification and Dark Fermentation
The kinetic and other types of exergies are neglected. The physical exergy of the gaseous material
is calculated as:
𝐸𝑥𝑝ℎ = ∑ 𝑥𝑖 ∗ 𝑒𝑥𝑖𝑝ℎ
(D-33)
Where 𝑥𝑖 and 𝑒𝑥𝑖𝑝ℎ
are the mole flow rate and physical exergy of component 𝑖, respectively. For
each component, the physical exergy is defined as:
𝑒𝑥𝑖𝑝ℎ
= (ℎ − ℎ𝑜) − 𝑇𝑜(𝑆 − 𝑆𝑜) (D-34)
Where (ℎ − ℎ𝑜) and (𝑆 − 𝑆𝑜) are calculated according to the following equations.
ℎ − ℎ0 = ∫ 𝐶𝑝 𝑑𝑇𝑇
𝑇𝑜
(D-35)
𝑆 − 𝑆0 = ∫𝐶𝑝
𝑇 𝑑𝑇
𝑇
𝑇𝑜
(D-36)
Where ℎ and 𝑆 are the specific enthalpy and entropy as function of the temperature T in a specified
state, respectively; ℎ𝑜 and 𝑆𝑜 denote the enthalpy and entropy in standard conditions (reference
environment) with temperature 𝑇𝑜 (298 K) and pressure (1 atm), respectively; and 𝐶𝑝 is the
constant pressure specific heat capacity, which can be calculated based on correlations proposed by
[181], as shown in Table D-4.
Table D-4. Heat Capacity at constant pressure for gaseous species involve in the gasification
Species 𝑪𝒑 (𝒌𝑱
𝒌𝒎𝒐𝒍 ∗ 𝑲)
𝑁2 𝐶𝑝 = 39.060 − 512.79 (𝑇
100)
−1.5
+ 1072.7 (𝑇
100) − 820.4 (
𝑇
100)
−3
𝑂2 𝐶𝑝 = 25.4 + 1.52𝑥10−2𝑇 − 0.7155𝑥10−5𝑇2 + 1.312𝑥10−9𝑇3
𝐻2𝑂 𝐶𝑝 = 32.24 + 0.1923𝑥10−2𝑇 + 1.055𝑥10−5𝑇2 − 3.595𝑥10−9𝑇3
𝐶𝑂 𝐶𝑝 = 28.16 + 0.1675𝑥10−2𝑇 + 0.5327𝑥10−5𝑇2 − 2.222𝑥10−9𝑇3
𝐶𝑂2 𝐶𝑝 = 22.26 + 5.981𝑥10−2𝑇 − 3.501𝑥10−5𝑇2 + 7.469𝑥10−9𝑇3
𝐻2 𝐶𝑝 = 29.11 − 0.1916𝑥10−2𝑇 + 0.4003𝑥10−5𝑇2 − 0.8704𝑥10−9𝑇3
𝐶𝐻4 𝐶𝑝 = 18.89 + 5.024𝑥10−2𝑇 + 1.269𝑥10−5𝑇2 − 11.01𝑥10−9𝑇3
On the other hand, the chemical exergy can be calculated from Eq. D-37:
𝐸𝑥𝑐ℎ = ∑ 𝑥𝑖 (𝑒𝑥𝑖𝑐ℎ + 𝑅𝑇𝑜
𝑥𝑖
∑ 𝑥𝑖) (D-37)
Page 165
Hydrogen Production through Gasification and Dark Fermentation 165
Where 𝑒𝑥𝑖𝑐ℎ is the standard chemical exergy of gaseous component 𝑖 (see, Table D-5); and 𝑅 is the
universal gas constant with a value of 8.314 kJ/kmol*K.
Table D-5. Specific enthalpy, entropy and standard chemical exergy values for the gaseous
components in the gasification
Component 𝒉𝒐 (𝒌𝑱 𝒌𝒎𝒐𝒍−𝟏) 𝒔𝒐 (𝒌𝑱 𝒌𝒎𝒐𝒍−𝟏𝑲−𝟏) 𝒆𝒙𝒊𝒄𝒉(𝒌𝑱 𝒌𝒎𝒐𝒍−𝟏)
N2 0 191.61 668
O2 0 205.03 3,970
H2O -228.58 188.72 9,500
CO -137.15 197.54 275,100
CO2 -394.37 213.68 19,870
H2 0 120.574 236,100
CH4 -74.85 186.16 831,650
Thermodynamic parameters such as the standard enthalpy, standard entropy and standard chemical
exergy of the species involve in the process were taken from reported data in literature [34] [181].
Table D-5 summarizes the values of the thermodynamic parameters for each gaseous component.
Finally, the biomass exergy was calculated based on the method propose by Szargut et al., [182].
𝐸𝑥𝑏𝑖𝑜𝑚𝑎𝑠𝑠 = 𝛽 ∗ 𝐿𝐻𝑉𝑏𝑖𝑜𝑚𝑎𝑠𝑠 (D-38)
Where the coefficient 𝛽 was calculated based on the elemental analysis, especially in the oxygen –
carbon and hydrogen – carbon ratios. And 𝐿𝐻𝑉𝑏𝑖𝑜𝑚𝑎𝑠𝑠 is the amount of energy that can be released
as heat from the raw material.
𝛽 =1.0414 + 0.0177 [
𝐻𝐶] − 0.3328 [
𝑂𝐶] {1 + 0.0537 [
𝐻𝐶]}
1 − 0.4021 [𝑂𝐶]
(D-39)
The exergetic efficiency is defined as the ratio between useful exergy outputs from the gasifier to
the necessary exergy input to the gasifier. In this work, the exergetic efficiency was calculated as
follows:
𝜂𝑒𝑥 =𝐸𝑥𝑠𝑦𝑛𝑔𝑎𝑠
𝐸𝑥𝑏𝑖𝑜𝑚𝑎𝑠𝑠 + 𝐸𝑥𝑎𝑖𝑟
(D-40)
Where 𝐸𝑥𝑠𝑦𝑛𝑔𝑎𝑠 is the exergy of the synthesis gas, 𝐸𝑥𝑏𝑖𝑜𝑚𝑎𝑠𝑠 is the exergy of the biomass and
𝐸𝑥𝑎𝑖𝑟 is the exergy of the gasifying agent.
Page 166
166 Hydrogen Production through Gasification and Dark Fermentation
Results
Effect of the moisture content in the concentration and calorific value of the generated gas
The moisture content in the raw material can generated a positive and negative effect in the
gasification process. The formation of hydrogen is favored since a greater number of moles of
hydrogen are presented by increasing the moisture content. However, in order to maintain the
operating conditions of the process, more energy is required; therefore, exothermic reactions are
favored rather than endothermic reactions, which affects the formation of CO and H2 [182].
Figures D-2, D-3 and D-4 present the effect of the moisture content of the Pinus Patula and
Coffee Cut-Stems in the concentration profiles of the gaseous species of the different zones of the
gasifier. In the pyrolysis zone, the number of moles of hydrogen increase as the number of moles
of water increase (moisture content of the raw material), whereas the number of moles of CO2 and
CO decrease (see, Figure D-2). Since the main gaseous products in the combustion zone are CO2,
CO, H2O and N2, increasing the number of moles of water reduces the concentration of the
remaining gaseous species from the combustion reaction (see, Figure D-3). The effect of the
moisture content of the raw material is evidenced in the reduction zone, where high number of
moles of hydrogen are generated because of the high amount of water (See, Figure D-4). Besides,
the effect of the moisture content in the heating value of the generated syngas was evaluated (see,
Figure 5). Hydrogen, carbon monoxide and methane are considered the most important fuel
species in the synthesis gas; if the hydrogen content increases in the syngas (due to the moisture
content), the heating value of the syngas also increases.
A
Page 167
Hydrogen Production through Gasification and Dark Fermentation 167
Figure D-2. Effect of the moisture content in the syngas composition in the pyrolysis zone
a) Pinus Patula and b) Coffee Cut-Stems
Figure D-3. Effect of the moisture content in the syngas composition in the combustion zone
a) Pinus Patula and b) Coffee Cut-Stems
B
A
B
Page 168
168 Hydrogen Production through Gasification and Dark Fermentation
Figure D-4. Effect of the moisture content in the syngas composition in the reduction zone
a) Pinus Patula and b) Coffee Cut-Stems
A
B
A
Page 169
Hydrogen Production through Gasification and Dark Fermentation 169
Figure D-5. Effect of the moisture content on the heating value of the synthesis gas
a) Pinus Patula b) Coffee Cut-Stems
Effect of the air/biomass ratio in the composition and heating value of the syngas
Equivalence ratio (ER) is defined as the ratio between the air–fuel of the gasification and the air–
fuel ratio for complete combustion [183]. Higher ER increases the amount of oxygen in the the
gasifier, which reduces the calorific value of the product gas. On the other hand, lower ER results
in higher calorific product gas; however, the tar yield is considerably higher. Generally,
combustion processes operate with ER > 0.5; whereas gasification processes the ER varies
between 0.2 and 0.4. Pyrolysis is a process that is carried out in absence of oxygen, for this reason,
the effect of ER on the composition of the gaseous species in this zone is negligible. In the
combustion zone, an increment in the supplied air increases the carbon dioxide content due to the
presence of more oxygen in order to reach a complete combustion condition (see, Figure D-6).
The low concentration of carbon dioxide compared to the high carbon monoxide content at low ER
values can be attributed to the fact that under oxygen deficient atmosphere and the presence of
highly reactive char, the partial oxidation of char is dominant [126]. In the reduction zone, high
content of carbon dioxide is obtained at ER values above 0.3 since most of the supplied air is
destined to produce heat and CO2 from the combustion zone (see, Figure D-7). Additionally, most
of the carbon dioxide is intended to produce carbon monoxide through the Boudouard reaction.
The amount of air that is supplied into the gasifier affects directly the heating value of the syngas
as presented in Figure D-8.
B
Page 170
170 Hydrogen Production through Gasification and Dark Fermentation
Figure D-6. Effect of the ER in the gas composition in the combustion zone
a) Pinus Patula b) Coffee Cut-Stems.
A
B
A
Page 171
Hydrogen Production through Gasification and Dark Fermentation 171
Figure D-7. Effect of the ER in the gas composition in the reduction zone
a) Pinus Patula b) Coffee Cut-Stems.
Figure D-8. Effect of the ER in the calorific value of the generated gas
a) Pinus Patula b) Coffee Cut-Stems.
B
A
B
Page 172
172 Hydrogen Production through Gasification and Dark Fermentation
Energy and exergy analysis
Based on the results of the effect of the ER in the syngas composition and heating value, it can be
concluded that high ER values decrease the hydrogen content and thus, the heating content of the
syngas. As a consequence, high ER values decrease the cold gas efficiency of the process (see,
Figure D-9). A lean mixture is considered when the biomass/air ratio is below 0.1 (ER < 0.1);
hence, these mixtures are more efficient but may cause engine damage. According to this, the
suitable ER varies between 0.25 and 0.3, which corresponds to an efficiency between 70 – 50%. It
is also evidenced that the highest energy efficiency was obtained using as raw material CCS in the
gasification procedure.
Figure D-9. Effect of the equivalence ratio (ER) in the energy efficiency of the gasification
Figure D-10. Effect of the equivalence ratio (ER) in the total syngas exergy
Page 173
Hydrogen Production through Gasification and Dark Fermentation 173
High air-to-fuel ratios favor the exothermic reactions that produce as main products CO2 and H2O.
The chemical exergy of these gases is lower than the chemical exergy of CO and H2; therefore, the
total exergy of the synthesis gas is lower and hence, decreasing the exergy efficiency of
conversion. The behavior of the total exergy of the generated gas is presented in Figure D-10.
Final Remarks
The mathematical modelling approach of the three-zone downdraft gasifier was used to evaluate
the behavior of the synthesis gas composition and heating value in terms of the moisture content
and the amount of supplied air. The moisture content of the biomass influences the energy
efficiency of the gasification procedure since additional energy is required to remove water from
the feedstock aiming to obtain a H2-rich syngas; therefore, a moisture content below 20% is
recommended. On the other hand, high biomass/air ratios increase the available oxygen for
combustion and thus, a flue gas with low hydrogen content is produced. Moreover, biomass/air
ratios between 0.25 and 0.3 are recommended in order to produce a high energy content syngas.
The effect of the ER in the energy and exergy efficiency of the air gasification was also evaluated.
High ER decreases the cold energy efficiency of the process because of the low energy content
syngas. Besides, the total exergy of the synthesis gas is also reduced since exothermic reactions are
more favorable at high ER values and hence, the content of CO2 and H2O is increased. From this
approach, it was evidenced that the composition of hydrogen and thus, the heating value of the
synthesis gas using as feedstock Coffee Cut-Stems (CCS) is higher than the case of Pinus Patula.
However, the relative high energy content of the syngas from both feedstocks can be used as an
indicator of the energy potential of these residues.
Page 174
9. References
[1] Unidad de planeación Minero Energética (UPME), “Balances Energéticos 1975 - 2006,”
Bogotá, Colombia, 2006.
[2] Food and Agriculture Organization of the United Nations (FAO), “Pilot Testing of GBEP
Sustainability Indicators for Bioenergy in Indonesia,” Environment and natural resources
management working paper, 2014. [Online]. Available: http://www.fao.org/3/a-
i4059e/index.html.
[3] M. Gonzalez, M. Venturini, W. Poganietz, M. Finkenrath, T. Kirsten, and H. Acevedo,
“Bioenergy Technology Roadmap for Colombia,” Univ. degli Stud. di Ferrara, 2014.
[4] A. Ghimire et al., “A review on dark fermentative biohydrogen production from organic
biomass: Process parameters and use of by-products,” Appl. Energy, vol. 144, pp. 73–95,
2015.
[5] P. Parthasarathy and K. S. Narayanan, “Hydrogen production from steam gasification of
biomass: Influence of process parameters on hydrogen yield - A review,” Renew. Energy,
vol. 66, pp. 570–579, 2014.
[6] J. Udomsirichakorn and P. A. Salam, “Review of hydrogen-enriched gas production from
steam gasification of biomass: The prospect of CaO-based chemical looping gasification,”
Renew. Sustain. Energy Rev., vol. 30, pp. 565–579, 2014.
[7] I. a. Panagiotopoulos, R. R. Bakker, M. a W. Budde, T. de Vrije, P. a M. Claassen, and E.
G. Koukios, “Fermentative hydrogen production from pretreated biomass: A comparative
study,” Bioresour. Technol., vol. 100, no. 24, pp. 6331–6338, 2009.
[8] C. Dejtrakulwong and S. Patumsawad, “Four Zones Modeling of the Downdraft Biomass
Gasification Process: Effects of Moisture Content and Air to Fuel Ratio,” Energy Procedia,
vol. 52, pp. 142–149, 2014.
[9] S. Hameed, N. Ramzan, Z. U. Rahman, M. Zafar, and S. Riaz, “Kinetic modeling of
reduction zone in biomass gasification,” Energy Convers. Manag., vol. 78, pp. 367–373,
2014.
[10] P. Lv, Z. Yuan, L. Ma, C. Wu, Y. Chen, and J. Zhu, “Hydrogen-rich gas production from
biomass air and oxygen/steam gasification in a downdraft gasifier,” Renew. Energy, vol. 32,
pp. 2173–2185, 2007.
[11] M. E. Nissilä, C. H. Lay, and J. a. Puhakka, “Dark fermentative hydrogen production from
lignocellulosic hydrolyzates - A review,” Biomass and Bioenergy, vol. 67, pp. 145–159,
2014.
Page 175
Hydrogen Production through Gasification and Dark Fermentation 175
[12] I. Ntaikou, G. Antonopoulou, and G. Lyberatos, “Biohydrogen production from biomass
and wastes via dark fermentation: A review,” Waste and Biomass Valorization, vol. 1, pp.
21–39, 2010.
[13] K. Urbaniec and R. R. Bakker, “Biomass residues as raw material for dark hydrogen
fermentation – A review,” Int. J. Hydrogen Energy, vol. 40, no. 9, pp. 3648–3658, 2015.
[14] The World Bank (WB), “Stadistics of Colombia,” 2016. [Online]. Available:
http://www.worldbank.org/. [Accessed: 05-Mar-2016].
[15] U.S Energy Information Administration (EIA), “Energy Analysis of Colombia,” 2015.
[Online]. Available: https://www.eia.gov/. [Accessed: 03-Mar-2016].
[16] U.S Energy Information Administration (EIA), “Description of the Colombian energetic
overview,” 2016.
[17] U.S Energy Information Administration (EIA), “Total Petroleum Consumption in the
World,” 2013. .
[18] Ministerio de Minas y Energía (Minminas), “Sistema de Información de Petroleo y Gas
Colombiano.” .
[19] Agencia Nacional de Hidrocarburos (ANH), “Producción Mensual de Petróleo y gas natural
en Colombia,” 2016. .
[20] Ministerio de Minas y Energía (Minminas), “Proyección de Demanda de Energía en
Colombia,” Bogotá, Colombia, 2010.
[21] Asocaña, “Informe Anual 2013-2014,” Asp. Gen. del Sect. Azucar. 2013-2014, 2014.
[22] E. Bochno Hernández, “Estado del Arte y Novedades de la Bioenergía en Colombia,”
Organ. las Nac. Unidades para la Aliment. y la Agric., pp. 1–33, 2011.
[23] Congreso de Colombia, “Ley N° 1715 Del 13 de mayo de 2014,” no. May, p. 26, 2014.
[24] F. A. J. Hernán, D. Tobón Orozco, and G. A. Castillo Quintero, “¿Ha sido efectiva la
promoción de soluciones energéticas en las Zonas No Interconectadas (ZNI) en Colombia?:
Un análisis de la estructura institucional,” Cuad. Adm., vol. 22, no. 38, pp. 219–245, 2009.
[25] J. F. González Bustos, L. A. Sepúlveda, and K. Triviño Aponte, “Zonas no interconectadas
eléctricamente en colombia: problemas y perspectiva,” Econografos Esc. Econ., vol. 65, p.
27, 2014.
[26] Ministerio de Minas y Energía (Minminas), “Energía Eléctrica,” Bogotá, Colombia, 2012.
[27] UPME, “Potencialidades de los cultivos energéticos y residuos agrícolas en colombia,”
Bogotá, Colombia, 2003.
[28] M. Balat, “Potential importance of hydrogen as a future solution to environmental and
transportation problems,” Int. J. Hydrogen Energy, vol. 33, no. 15, pp. 4013–4029, Aug.
2008.
[29] I. Dincer, “Green methods for hydrogen production,” Int. J. Hydrogen Energy, vol. 37, no.
2, pp. 1954–1971, Jan. 2012.
Page 176
176 Hydrogen Production through Gasification and Dark Fermentation
[30] Energy Information Administration. U.S Department of Energy, “The Impact of Increased
Use of Hydrogen on Petroleum Consumption and Carbon Dioxide Emissions,” no. August,
p. 65, 2008.
[31] J. Alazemi and J. Andrews, “Automotive hydrogen fuelling stations: An international
review,” Renew. Sustain. Energy Rev., vol. 48, pp. 483–499, Aug. 2015.
[32] J. Larminie and A. Dicks, Fuel cell systems explained, Second. England: John Wiley &
Sons Ltda., 2003.
[33] J. Carolan, S. Joshi, and B. Dale, “Technical and Financial Feasibility Analysis of
Distributed Bioprocessing Using Regional Biomass Pre-Processing Centers,” J. Agric.
Food Ind. Organ., vol. 5, no. 2, pp. 1–29, 2007.
[34] a. Abuadala, I. Dincer, and G. F. Naterer, “Exergy analysis of hydrogen production from
biomass gasification,” Int. J. Hydrogen Energy, vol. 35, no. 10, pp. 4981–4990, 2010.
[35] I. I. Ahmed and A. K. Gupta, “Kinetics of woodchips char gasification with steam and
carbon dioxide,” Appl. Energy, vol. 88, no. 5, pp. 1613–1619, May 2011.
[36] A. González, J.-R. Riba, R. Puig, and P. Navarro, “Review of micro- and small-scale
technologies to produce electricity and heat from Mediterranean forests׳ wood chips,”
Renew. Sustain. Energy Rev., vol. 43, pp. 143–155, Mar. 2015.
[37] R. Chaubey, S. Sahu, O. O. James, and S. Maity, “A review on development of industrial
processes and emerging techniques for production of hydrogen from renewable and
sustainable sources,” Renew. Sustain. Energy Rev., vol. 23, pp. 443–462, Jul. 2013.
[38] I. Dincer and C. Acar, “Review and evaluation of hydrogen production methods for better
sustainability,” Int. J. Hydrogen Energy, Jan. 2015.
[39] B. Yildiz and M. Kazimi, “Efficiency of hydrogen production systems using alternative
nuclear energy technologies,” Int. J. Hydrogen Energy, vol. 31, no. 1, pp. 77–92, Jan. 2006.
[40] T. E. Lipman, “What Will Power the Hydrogen Economy?: Present and Future Sources of
Hydrogen Energy,” University of California, Davis, 2004.
[41] C. M. Kalamaras and a. M. Efstathiou, “Hydrogen Production Technologies: Current State
and Future Developments,” Conf. Pap. Energy, vol. 2013, p. 9, 2013.
[42] D. Zhang, Q. Liu, and Y. Li, Reactor and Process Design in Sustainable Energy
Technology. 2014.
[43] P. M. Lv, Z. H. Xiong, J. Chang, C. Z. Wu, Y. Chen, and J. X. Zhu, “An experimental
study on biomass air-steam gasification in a fluidized bed,” Bioresour. Technol., vol. 95,
no. 1, pp. 95–101, 2004.
[44] C. Franco, F. Pinto, I. Gulyurtlu, and I. Cabrita, “The study of reactions influencing the
biomass steam gasification process☆,” Fuel, vol. 82, no. 7, pp. 835–842, May 2003.
[45] J. Zhou et al., “Biomass-oxygen gasification in a high-temperature entrained-flow
gasifier.,” Biotechnol. Adv., vol. 27, no. 5, pp. 606–11, Jan. 2009.
[46] K.-J. Wu and J.-S. Chang, “Batch and continuous fermentative production of hydrogen with
Page 177
Hydrogen Production through Gasification and Dark Fermentation 177
anaerobic sludge entrapped in a composite polymeric matrix,” Process Biochem., vol. 42,
no. 2, pp. 279–284, Feb. 2007.
[47] N. Ren, G. Cao, A. Wang, D. J. Lee, W. Guo, and Y. Zhu, “Dark fermentation of xylose
and glucose mix using isolated Thermoanaerobacterium ihermosaccharolyticum W16,” Int.
J. Hydrogen Energy, vol. 33, no. 21, pp. 6124–6132, 2008.
[48] N. Q. Ren et al., “Biological hydrogen production from corn stover by moderately
thermophile Thermoanaerobacterium thermosaccharolyticum W16,” Int. J. Hydrogen
Energy, vol. 35, no. 7, pp. 2708–2712, 2010.
[49] K. Zeng and D. Zhang, “Recent progress in alkaline water electrolysis for hydrogen
production and applications,” Prog. Energy Combust. Sci., vol. 36, no. 3, pp. 307–326,
2010.
[50] D. M. F. Santos, C. A. C. Sequeira, and J. L. Figueiredo, “Hydrogen production by alkaline
water electrolysis,” Quim. Nova, vol. 36, no. 8, pp. 1176–1193, 2013.
[51] T. Kato, M. Kubota, N. Kobayashi, and Y. Suzuoki, “Effective utilization of by-product
oxygen from electrolysis hydrogen production,” Energy, vol. 30, no. 14, pp. 2580–2595,
2005.
[52] N. Brandon, “What is the ‘hydrogen economy,’” London, United Kingdom, 2012.
[53] T. Kraus, “Hydrogen Fuel — An Economically Viable Future for the Transportation
Industry ?,” Economics 195S - Economic Analysis of Energy Issues, pp. 1–39, 2006.
[54] Departamento Nacional de Planeación, “National Development Plan: 2011-2014
‘Prosperity for All,’” Bogotá, Colombia, 2011.
[55] Unidad de Planeación Rural Agropecuaria (UPRA), “COLOMBIA: Potencial de
Reforestación Comercial - Diagnostico,” Bogotá, Colombia, 2015.
[56] Food and Agriculture Organization of the United States (FAO), Global Forest Resources
Assessment 2010, vol. 163. 2010.
[57] Agriculture and Rural Development Ministry, “Resolution 711 of October 31, 1994,”
Bogotá, Colombia, 2012.
[58] Unidad de Planeación Rural Agropecuaria (UPRA), “Formulacion y ajuste de una
metodología general para la zonificación de plantaciones forestal con fines comerciales en
Colombia,” Bogotá, Colombia, 2015.
[59] E. A. Gómez, L. A. Ríos, and J. D. Peña, “Madera, un Potencial Material Lignocelulósico
para la Producción de Biocombustibles en Colombia,” Inf. tecnológica, vol. 23, no. 6, pp.
73–86, 2012.
[60] R. G. Skolmen and F. Thomas, “Eucalyptus globulus Labill . Eucalipto goma azul.”
[61] A. J. Gillespie, “Pinus patula Schiede and Deppe. Patula pine.,” p. 5 p., 1992.
[62] O. Escobar and J. Rodríguez, “‘Teca’ Las maderas en Colombia,” Medellín, Colombia,
1993.
Page 178
178 Hydrogen Production through Gasification and Dark Fermentation
[63] G. H. Chitiva, H. Castillo, and E. González, “Guia para plantaciones forestales comerciales
en Antioquia,” Bogotá, Colombia, 1998.
[64] C. A. V. Córdoba, C. E. C. Ayala, O. M. Gamboa, D. J. Orozco, and H. A. Tatis, “Valor de
mercado de plantaciones de Teca (Tectona grandis Linn .) en el departamento de Córdoba,”
Temas Agrar., vol. 18, no. 76, pp. 9–22, 2013.
[65] G. H. Chitiva, H. Castillo, and E. González, “Guía para plantaciones forestales comerciales
en Caldas,” Santa Fé de Bogotá, 1998.
[66] Ministerio de agricultura y desarrollo Rural, “Cadena Forestal-Madera,” Bogotá, Colombia,
2014.
[67] Ministerio de Transporte, “Sistema de Información para la Regulación del Transporte de
Carga por Carretera,” 2016. .
[68] C. Beelaerts, “Coffee trade: a basic lesson on the economics of the price of coffee,” Global
Coffee Review. https:// globalcoffeereview.com/economics/view/coffeenomics., 2011.
[Online]. Available: http://gcrmag.com/economics/view/coffeenomics. [Accessed: 25-May-
2016].
[69] S. R. Hughes et al., “Sustainable conversion of coffee and other crop wastes to biofuels and
bioproducts using coupled biochemical and thermochemical processes in a multi-stage
biorefinery concept,” Appl. Microbiol. Biotechnol., vol. 98, no. 20, pp. 8413–8431, 2014.
[70] Food and Agriculture Organization of the United States (FAO), “Perspectivas a plazo
medio de los productos básicos agrícolas,” Roma, 2004.
[71] Federación Nacional de Cafeteros (FNC), “Colombian Coffee,”
http://www.cafedecolombia.com/particulares/ en/el_cafe_de_colombia/, 2010. .
[72] Federación Nacional de Cafeteros (FNC), “The coffee land: our coffee regions,”
http://www.cafedecolombia.com/ particulares/en/la_tierra_del_cafe/regiones_cafeteras/,
2010. .
[73] Centro de Investigaciones de Café (Cenicafé), “La renovación de los cafetales por zoca,”
Avances Técnicos Cenicafé No. 174, Chinchiná, Colombia, p. 8, 1992.
[74] B. Fernandez, “Patogenicidad de Ceratocystis fimbriata,” Chinchiná, Colombia, 1975.
[75] J. Salazar and M. Mestre, “Efecto del zoqueo en la producción de la variedad Colombia,”
Avances Técnicos Cenicafé No. 159, Chinchiná, Colombia, p. 2, 1991.
[76] H. Uribe, “Zoqueo de cafetales,” Avances Técnicos Cenicafé No. 66, Chinchiná, Colombia,
p. 4, 1977.
[77] F. Farfán, “El zoqueo del café conserva el bosque nativo,” Avances Técnicos 209,
Chinchiná, Colombia, pp. 15–18, Nov-1994.
[78] National Coffee Research Center, “Cenicafé Generates Electricity from Coffee Tree
Wood,” 2015.
[79] M. Roa, “Potencialidad del café y sus residuos rurales como cultivo energético,” Disciplina
Ingeniería Agrícola, Chinchiná, Colombia, p. 2, 2003.
Page 179
Hydrogen Production through Gasification and Dark Fermentation 179
[80] C. E. Oliveros Tascón, U. Sanz, G. Ramírez, and M. Peñuela, “Aprovechamiento eficiente
de la energía en el secado mecánico del café,” Avances Técnicos No. 380, Chinchiná,
Colombia, 2009.
[81] J. a. Quintero, J. Moncada, and C. a. Cardona, “Techno-economic analysis of bioethanol
production from lignocellulosic residues in Colombia: A process simulation approach,”
Bioresour. Technol., vol. 139, pp. 300–307, 2013.
[82] V. Aristizábal M, Á. Gómez P, and C. A. Cardona A, “Biorefineries based on coffee cut-
stems and sugarcane bagasse: Furan-based compounds and alkanes as interesting
products.,” Bioresour. Technol., vol. 196, pp. 480–9, Nov. 2015.
[83] J. Montilla Pérez et al., “Propiedades físicas y factores de conversión del café en el proceso
de beneficio,” Av. Técnicos 370, p. 8, 2008.
[84] N. Rodríguez Valencia and D. Zambrano Franco, “Los subproductos del café: fuente de
energía renovable,” Av. Técnicos Cenicafé, no. 3, p. 8, 2010.
[85] Oficina de Estudios Económicos, “Perfil Económico: Departamento de Antioquia,” Bogotá,
Colombia, 2015.
[86] Oficina de Estudios Económicos, “Perfil Económico: Departamento de Caldas,” Bogotá,
Colombia, 2015.
[87] Oficina de Estudios Económicos, “Perfil Económico: Departamento de Huila,” Bogotá,
Colombia, 2015.
[88] Departamento Administrativo Nacional de Estadísticas, “Censo Nacional Agropecuario
2014,” Bogotá, Colombia, 2014.
[89] Federación Nacional de Cafeteros (FNC), “Tabla de precio interno de referencia para la
compra de café pergamino seco por carga de 125 kilogramos,” Bogotá, Colombia, 2016.
[90] J. S. Han and J. S. Rowell, “Chemical Composition of Fibers,” in Paper and Composites
from agro-based resources, 1997, pp. 83–134.
[91] B. Hames et al., “Preparation of Samples for Compositional Analysis,” Biomass Anal.
Technol. Team Lab. Anal. Proced., no. August, pp. 1–10, 2004.
[92] A. Sluiter, R. Ruiz, C. Scarlata, J. Sluiter, and D. Templeton, “Determination of Extractives
in Biomass Laboratory Analytical Procedure ( LAP ),” 2008.
[93] Technical Association of the Pulp and Paper Industry (TAPPI), “Acid-insoluble lignin in
wood and pulp T222,” 2006.
[94] P. G. Emmanouil karampinis, “The Bioenergy System Planners BISYPLAN web-based
handbook,” 2012. .
[95] ASTM, “Standard Test Method for Volatile Matter in the Analysis Sample of Coal and
Coke,” West Conshohocken, pp. 3–7, 2009.
[96] American Society for Testing and Materials (ASTM), “Standard Test Methods for
Proximate Analysis of Coal and Coke by Macro Thermogravimetric Analysis,” 2015.
Page 180
180 Hydrogen Production through Gasification and Dark Fermentation
[97] D. R. Nhuchhen and P. Abdul Salam, “Estimation of higher heating value of biomass from
proximate analysis: A new approach,” Fuel, vol. 99, pp. 55–63, 2012.
[98] S. a. Channiwala and P. P. Parikh, “A unified correlation for estimating HHV of solid,
liquid and gaseous fuels,” Fuel, vol. 81, pp. 1051–1063, 2002.
[99] J. Shen, S. Zhu, X. Liu, H. Zhang, and J. Tan, “The prediction of elemental composition of
biomass based on proximate analysis,” Energy Convers. Manag., vol. 51, no. 5, pp. 983–
987, 2010.
[100] Z. a. Zainal, R. Ali, C. H. Lean, and K. N. Seetharamu, “Prediction of performance of a
downdraft gasifier using equilibrium modeling for different biomass materials,” Energy
Convers. Manag., vol. 42, no. 12, pp. 1499–1515, 2001.
[101] All Power Labs, “10 kW Power Paller - User Manual,” California, United States, 2012.
[102] X. Zhu and R. Venderbosch, “A correlation between stoichiometrical ratio of fuel and its
higher heating value,” Fuel, vol. 84, pp. 1007–1010, 2005.
[103] C. A. Jordan and G. Akay, “Effect of CaO on tar production and dew point depression
during gasification of fuel cane bagasse in a novel downdraft gasifier,” Fuel Process.
Technol., vol. 106, pp. 654–660, 2013.
[104] C. Wu and P. T. Williams, “Nickel-based catalysts for tar reduction in biomass
gasification,” Biofuels, vol. 2, no. 4, pp. 451–464, 2011.
[105] T. Nordgreen, V. Nemanova, K. Engvall, and K. Sjöström, “Iron-based materials as tar
depletion catalysts in biomass gasification: Dependency on oxygen potential,” Fuel, vol.
95, pp. 71–78, 2012.
[106] J. Udomsirichakorn, P. Basu, P. Abdul Salam, and B. Acharya, “CaO-based chemical
looping gasification of biomass for hydrogen-enriched gas production with in situ CO2
capture and tar reduction,” Fuel Process. Technol., vol. 127, pp. 7–12, 2014.
[107] I. S. M. Rafiqul and a. M. Mimi Sakinah, “Kinetic studies on acid hydrolysis of Meranti
wood sawdust for xylose production,” Chem. Eng. Sci., vol. 71, pp. 431–437, 2012.
[108] J. C. Parajó, D. Vázquez, J. L. Alonso, V. Santos, and H. Dominguez, “Prehydrolysis of
Eucalyptus wood with dilute sulphuric acid: operation at atmospheric pressure,” Holz als
Roh- und Werkst., vol. 51, no. 5, pp. 357–363, 1993.
[109] M. Normark, S. Winestrand, T. a Lestander, and L. J. Jönsson, “Analysis, pretreatment and
enzymatic saccharification of different fractions of Scots pine.,” BMC Biotechnol., vol. 14,
p. 20, 2014.
[110] R. Aguilar, J. a. Ramírez, G. Garrote, and M. Vázquez, “Kinetic study of the acid
hydrolysis of sugar cane bagasse,” J. Food Eng., vol. 55, pp. 309–318, 2002.
[111] M. J. Taherzadeh, L. Gustafsson, C. Niklasson, and G. Lidén, “Inhibition effects of furfural
on aerobic batch cultivation of Saccharomyces cerevisiae growing on ethanol and/or acetic
acid,” J. Biosci. Bioeng., vol. 90, no. 4, pp. 374–380, 2000.
[112] I. S. Horváth, A. Sjöde, B. Alriksson, L. J. Jönsson, and N.-O. Nilvebrant, “Critical
conditions for improved fermentability during overliming of acid hydrolysates from
Page 181
Hydrogen Production through Gasification and Dark Fermentation 181
spruce.,” Appl. Biochem. Biotechnol., vol. 121–124, no. 3, pp. 1031–1044, 2005.
[113] R. Purwadi, C. Niklasson, and M. J. Taherzadeh, “Kinetic study of detoxification of dilute-
acid hydrolyzates by Ca(OH) 2,” J. Biotechnol., vol. 114, pp. 187–198, 2004.
[114] R. Agrawal et al., “Pilot scale pretreatment of wheat straw and comparative evaluation of
commercial enzyme preparations for biomass saccharification and fermentation,” Biochem.
Eng. J., vol. 102, pp. 54–61, Oct. 2015.
[115] S. Khamtib and A. Reungsang, “Biohydrogen production from xylose by
Thermoanaerobacterium thermosaccharolyticum KKU19 isolated from hot spring
sediment,” Int. J. Hydrogen Energy, vol. 37, no. 17, pp. 12219–12228, Sep. 2012.
[116] S. Singh, P. M. Sarma, and B. Lal, “Biohydrogen production by Thermoanaerobacterium
thermosaccharolyticum TERI S7 from oil reservoir flow pipeline,” Int. J. Hydrogen
Energy, vol. 39, no. 9, pp. 4206–4214, Mar. 2014.
[117] S. O-Thong, P. Prasertsan, D. Karakashev, and I. Angelidaki, “Thermophilic fermentative
hydrogen production by the newly isolated Thermoanaerobacterium thermosaccharolyticum
PSU-2,” Int. J. Hydrogen Energy, vol. 33, pp. 1204–1214, 2008.
[118] B. K. Ganghofner D, Kellermann J, Staudenbauer WL, “Purification and properties of an
amylopullulanase, a glucoamylase, and an alpha-glucosidase in the amylolytic enzyme
system of Thermoanaerobacterium thermosaccharolyticum.,” Biosci Biotechnol Biochem.,
vol. 62, no. 2. pp. 302–308, 1998.
[119] S. Othong, P. Prasertsan, D. Karakashev, and I. Angelidaki, “High-rate continuous
hydrogen production by Thermoanaerobacterium thermosaccharolyticum PSU-2
immobilized on heat-pretreated methanogenic granules,” Int. J. Hydrogen Energy, vol. 33,
no. 22, pp. 6498–6508, Nov. 2008.
[120] G. Cao et al., “Acid hydrolysis of corn stover for biohydrogen production using
Thermoanaerobacterium thermosaccharolyticum W16,” Int. J. Hydrogen Energy, vol. 34,
no. 17, pp. 7182–7188, Sep. 2009.
[121] Leibniz Institute DSMZ - German Collection of microorganisms and cell cultures,
“Composition of the Clostridium Thermohydrosulfuricum (CT) medium,” 2016.
[122] G. L. Miller, “Use of Dinitrosalicylic Acid Reagent for Determination of Reducing Sugar,”
Anal. Chem., vol. 31, no. 3, pp. 426–428, 1959.
[123] J. Moncada, J. A. Tamayo, and C. A. Cardona, “Integrating first, second, and third
generation biorefineries: Incorporating microalgae into the sugarcane biorefinery,” Chem.
Eng. Sci., vol. 118, pp. 126–140, Oct. 2014.
[124] Ó. J. Sánchez and C. A. Cardona, “Conceptual design of cost-effective and
environmentally-friendly configurations for fuel ethanol production from sugarcane by
knowledge-based process synthesis,” Bioresour. Technol., vol. 104, pp. 305–314, 2012.
[125] J. Moncada, M. M. El-Halwagi, and C. a. Cardona, “Techno-economic analysis for a
sugarcane biorefinery: Colombian case,” Bioresour. Technol., vol. 135, pp. 533–543, 2013.
[126] J. K. Ratnadhariya and S. a. Channiwala, “Three zone equilibrium and kinetic free
Page 182
182 Hydrogen Production through Gasification and Dark Fermentation
modeling of biomass gasifier - a novel approach,” Renew. Energy, vol. 34, no. 4, pp. 1050–
1058, 2009.
[127] V. Nikulshina, M. E. Gálvez, and a. Steinfeld, “Kinetic analysis of the carbonation
reactions for the capture of CO2 from air via the Ca(OH)2-CaCO3-CaO solar
thermochemical cycle,” Chem. Eng. J., vol. 129, no. 1–3, pp. 75–83, 2007.
[128] Y. Zheng, Z. Pan, R. Zhang, and B. M. Jenkins, “Kinetic modeling for enzymatic
hydrolysis of pretreated creeping wild ryegrass,” Biotechnol. Bioeng., vol. 102, no. 6, pp.
1558–1569, 2009.
[129] M. Khodaverdi, K. Karimi, A. Jeihanipour, and M. J. Taherzadeh, “Kinetic modeling of
rapid enzymatic hydrolysis of crystalline cellulose after pretreatment by NMMO,” J. Ind.
Microbiol. Biotechnol., vol. 39, no. 3, pp. 429–438, 2012.
[130] J. A. López, V. M. Trejos, and C. A. Cardona, “Parameters estimation and VLE calculation
in asymmetric binary mixtures containing carbon dioxide + n-alkanols,” Fluid Phase
Equilib., vol. 275, no. 1, pp. 1–7, 2009.
[131] R. J. Wooley and V. Putsche, “Development of an ASPEN PLUS Physical Property
Database for Biofuels Components,” Victoria, no. April, pp. 1–38, 1996.
[132] C. Y. Feng, K. C. Khulbe, T. Matsuura, and A. F. Ismail, “Recent progresses in polymeric
hollow fiber membrane preparation, characterization and applications,” Sep. Purif.
Technol., vol. 111, pp. 43–71, Jun. 2013.
[133] S.-H. Choi, A. Brunetti, E. Drioli, and G. Barbieri, “Hydrogen separation from H2/N2 and
H2/CO mixtures with Co-Polyimide Hollow Fiber Module,” Sep. Sci. Technol., vol. 46, no.
1, pp. 1–13, 2010.
[134] S. Maus, J. Hapke, C. N. Ranong, E. Wüchner, G. Friedlmeier, and D. Wenger, “Filling
procedure for vehicles with compressed hydrogen tanks,” Int. J. Hydrogen Energy, vol. 33,
no. 17, pp. 4612–4621, Sep. 2008.
[135] K. L. Kadam, E. C. Rydholm, and J. D. McMillan, “Development and validation of a
kinetic model for enzymatic saccharification of lignocellulosic biomass,” Biotechnol. Prog.,
vol. 20, pp. 698–705, 2004.
[136] N. Leksawasdi, E. L. Joachimsthal, and P. L. Rogers, “Mathematical modelling of ethanol
production from glucose / xylose mixtures by recombinant Zymomonas mobilis,”
Biotechnol. Lett., vol. 23, pp. 1087–1093, 2001.
[137] J. Wang and W. Wan, “Kinetic models for fermentative hydrogen production: A review,”
Int. J. Hydrogen Energy, vol. 34, no. 8, pp. 3313–3323, 2009.
[138] K. Belafibako et al., “Integration of biohydrogen fermentation and gas separation processes
to recover and enrich hydrogen,” Int. J. Hydrogen Energy, vol. 31, no. 11, pp. 1490–1495,
2006.
[139] X. Wu, G. Li, H. Yang, and H. Zhou, “Study on extraction and separation of butyric acid
from clostridium tyrobutyricum fermentation broth in PEG/Na2SO4 aqueous two-phase
system,” Fluid Phase Equilib., vol. 403, pp. 36–42, Oct. 2015.
[140] D. Wu, H. Chen, L. Jiang, J. Cai, Z. Xu, and P. Cen, “Efficient separation of butyric acid by
Page 183
Hydrogen Production through Gasification and Dark Fermentation 183
an aqueous two-phase system with calcium chloride,” Chinese J. Chem. Eng., vol. 18, no.
4, pp. 533–537, 2010.
[141] J. Lefranc, “Process for the extraction of butyric acid and its homologues,” 163,571, 1928.
[142] ALIBABA, “International Prices,” 2015. .
[143] ICIS Pricing, “International Chemical Prices,” 2010. .
[144] M. S. Peters, K. D. Timmerhaus, and R. E. West, Materials Transfer, Handling, and
Treatment Equipment-Design and Costs. 2004.
[145] McKinsey & Company, “A portfolio of power-trains for Europe: a fact-based analysis - The
role of Battery Electric Vehicles, Plug-in Hybrids and Fuel Cell Electric Vehicles,” 2010.
[146] Federación Nacional de Biocombustibles de Colombia (Fedecombustibles), “Statistics of
the fuel ethanol price,” 2016. .
[147] J. Moncada, M. M. El-Halwagi, and C. A. Cardona, “Techno-economic analysis for a
sugarcane biorefinery: Colombian case,” Bioresour. Technol., vol. 135, pp. 533–543, 2013.
[148] Á. Martín and F. A. Mato, “Hint: An educational software for heat exchanger network
design with the pinch method,” Educ. Chem. Eng., vol. 3, no. 1, pp. e6–e14, Jun. 2008.
[149] X. Meng, W. de Jong, N. Fu, and A. Verkooijen, “Biomass gasification in a 100 kWth
steam-oxygen blown circulating fluidized bed gasifier: Effects of operational conditions on
product gas distribution and tar formation,” Biomass and Bioenergy, vol. 35, no. 7, pp.
2910–2924, 2011.
[150] L. Ingurume, N. Plangintza, and S. Arrantza, Análisis de ciclo de vida y huella de carbono,
First. 2009.
[151] D. M. Young and H. Cabezas, “Designing sustainable processes with simulation: The waste
reduction (WAR) algorithm,” Comput. Chem. Eng., vol. 23, no. 10, pp. 1477–1491, 1999.
[152] M. L. Espinoza, “Influencia de tres variables en la obtención de propiedades físico-
químicas de la oleorresina del Pinus tecunimanii,” Universidad Nacional Agraria La
Molina, 2005.
[153] F. Munalula and M. Meincken, “An evaluation of South African fuelwood with regards to
calorific value and environmental impact,” Biomass and Bioenergy, vol. 33, no. 3, pp. 415–
420, Mar. 2009.
[154] A. Friedl, E. Padouvas, H. Rotter, and K. Varmuza, “Prediction of heating values of
biomass fuel from elemental composition,” Anal. Chim. Acta, vol. 544, no. 1–2, pp. 191–
198, Jul. 2005.
[155] A. Demirbaş, “Calculation of higher heating values of biomass fuels,” Fuel Energy Abstr.,
vol. 38, no. 4, p. 240, Apr. 1997.
[156] C. A. Ortega. N, Flores. L, “Evaluation of physicochemical properties and thermal in stems
coffee and its economic analysis for the production of solid pellets as biofuel.,” Ing. Recur.
Nat. y del Ambient., vol. 10, pp. 79–91, 2011.
Page 184
184 Hydrogen Production through Gasification and Dark Fermentation
[157] L. Wei et al., “Absorption-enhanced steam gasification of biomass for hydrogen
production: Effect of calcium oxide addition on steam gasification of pyrolytic volatiles,”
Int. J. Hydrogen Energy, vol. 39, no. 28, pp. 15416–15423, 2014.
[158] K. Z. K. Shaari and M. Awang, Engineering Application of Computational Fluid Dynamics,
Springer I. 2015.
[159] T. Wongsiriamnuay, N. Kannang, and N. Tippayawong, “Effect of operating conditions on
catalytic gasification of bamboo in a fluidized bed,” Int. J. Chem. Eng., vol. 2013, 2013.
[160] R. W. Sykes, E. L. Gjersing, C. L. Doeppke, and M. F. Davis, “High-Throughput Method
for Determining the Sugar Content in Biomass with Pyrolysis Molecular Beam Mass
Spectrometry,” Bioenergy Res., vol. 8, no. 3, pp. 964–972, 2015.
[161] a. Martinez, M. E. Rodriguez, M. L. Wells, S. W. York, J. F. Preston, and L. O. Ingram,
“Detoxification of dilute acid hydrolysates of lignocellulose with lime,” Biotechnol. Prog.,
vol. 17, no. 2, pp. 287–293, 2001.
[162] V. P. Soudham, D. G. Raut, I. Anugwom, T. Brandberg, C. Larsson, and J. P. Mikkola,
“Coupled enzymatic hydrolysis and ethanol fermentation: ionic liquid pretreatment for
enhanced yields,” Biotechnol Biofuels, vol. 8, p. 135, 2015.
[163] D. I. C. Wang, G. C. Avgerinos, I. Biocic, S.-D. Wang, H.-Y. Fang, and F. E. Young,
“Ethanol from Cellulosic Biomass [and Discussion],” Philos. Trans. R. Soc. B Biol. Sci.,
vol. 300, no. 1100, pp. 323–333, 1983.
[164] S. Chimtong et al., “Isolation and Characterization of Endocellulase-Free Multienzyme
Complex from Newly Isolated Thermoanaerobacterium hermosaccharolyticum Strain NOI-
1,” J. Microbiol. Biotechnol., vol. 21, no. 3, pp. 284–292, 2011.
[165] C. T. Gray and H. Gest, “Biological Formation of Molecular Hydrogen,” Science (80-. ).,
vol. 148, no. 0036–8075 (Print), pp. 186–192, 1965.
[166] S. Li et al., “High efficiency hydrogen production from glucose/xylose by the ldh-deleted
Thermoanaerobacterium strain,” Bioresour. Technol., vol. 101, no. 22, pp. 8718–8724,
2010.
[167] R. D. Schwartz and F. A. Keller, “Acetic acid production by Clostridium thermoaceticum in
pH-controlled batch fermentations at acidic pH,” Applied and Environmental Microbiology,
vol. 43, no. 6. pp. 1385–1392, 1982.
[168] D. I. C. Wang, R. Flelshchaker, and G. Wang, “A novel route to the production of acetic
acid by fermentation,” AIChE Symp., vol. 181, pp. 74–105, 1978.
[169] V. Hernández, J. M. Romero-García, J. A. Dávila, E. Castro, and C. A. Cardona, “Techno-
economic and environmental assessment of an olive stone based biorefinery,” Resour.
Conserv. Recycl., vol. 92, pp. 145–150, Nov. 2014.
[170] J. a. Ruiz, M. C. Juárez, M. P. Morales, P. Muñoz, and M. a. Mendívil, “Biomass
gasification for electricity generation: Review of current technology barriers,” Renew.
Sustain. Energy Rev., vol. 18, pp. 174–183, 2013.
[171] B. Ruggeri, T. Tommasi, and G. Sassi, “Energy balance of dark anaerobic fermentation as a
tool for sustainability analysis,” Int. J. Hydrogen Energy, vol. 35, no. 19, pp. 10202–10211,
Page 185
Hydrogen Production through Gasification and Dark Fermentation 185
2010.
[172] D. M. Young and H. Cabezas, “Designing sustainable processes with simulation: the waste
reduction (WAR) algorithm,” Comput. Chem. Eng., vol. 23, no. 10, pp. 1477–1491, Dec.
1999.
[173] D. Bowen, F. Lau, R. R. Zabransky, R. Slimane, and S. Doong, “Techno-economic analysis
of hydrogen production by gasification of biomass,” 2003.
[174] N. Sadhwani, S. Adhikari, and M. R. Eden, “Biomass gasification using carbon dioxide:
Effect of temperature, CO2/C ratio and the study of reactions influencing the process,” Ind.
Eng. Chem. Res., p. acs.iecr.5b04000, 2016.
[175] I. Ahmed and A. K. Gupta, “Syngas yield during pyrolysis and steam gasification of
paper,” Appl. Energy, vol. 86, no. 9, pp. 1813–1821, Sep. 2009.
[176] N. Gao and A. Li, “Modeling and simulation of combined pyrolysis and reduction zone for
a downdraft biomass gasifier,” Energy Convers. Manag., vol. 49, no. 12, pp. 3483–3490,
2008.
[177] S. Jarungthammachote and a. Dutta, “Thermodynamic equilibrium model and second law
analysis of a downdraft waste gasifier,” Energy, vol. 32, pp. 1660–1669, 2007.
[178] A. K. Sharma, “Equilibrium and kinetic modeling of char reduction reactions in a
downdraft biomass gasifier: A comparison,” Sol. Energy, vol. 82, pp. 918–928, 2008.
[179] M. Puig-Arnavat, J. C. Bruno, and A. Coronas, “Review and analysis of biomass
gasification models,” Renew. Sustain. Energy Rev., vol. 14, no. 9, pp. 2841–2851, 2010.
[180] I. Dincer and M. A. Rosen, Exergy. Energy, Environment And Sustainable Development,
Second Edi. Ontario, Canada, 2013.
[181] Y. Wu, W. Yang, and W. Blasiak, “Energy and Exergy Analysis of High Temperature
Agent Gasification of Biomass,” pp. 2107–2122, 2014.
[182] L. F. Pellegrini and S. de Oliveira, “Exergy analysis of sugarcane bagasse gasification,”
Energy, vol. 32, no. 4, pp. 314–327, 2007.
[183] M. Asadullah, “Barriers of commercial power generation using biomass gasification gas: A
review,” Renew. Sustain. Energy Rev., vol. 29, pp. 201–215, 2014.


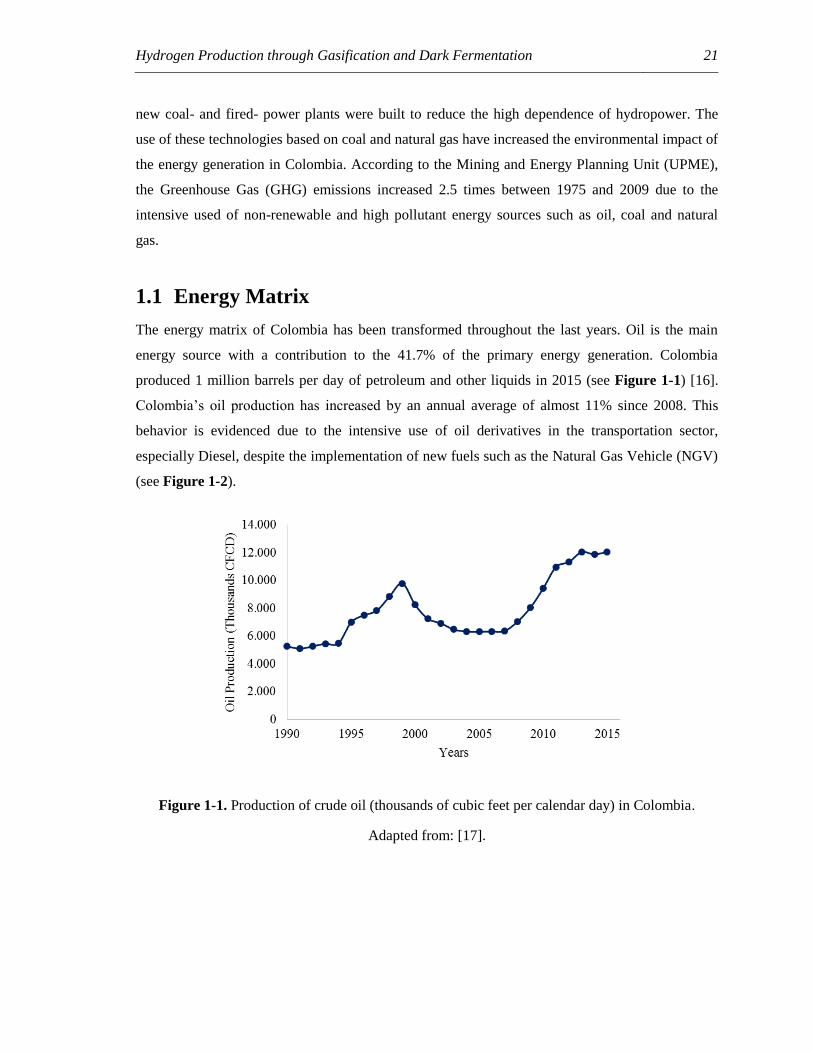

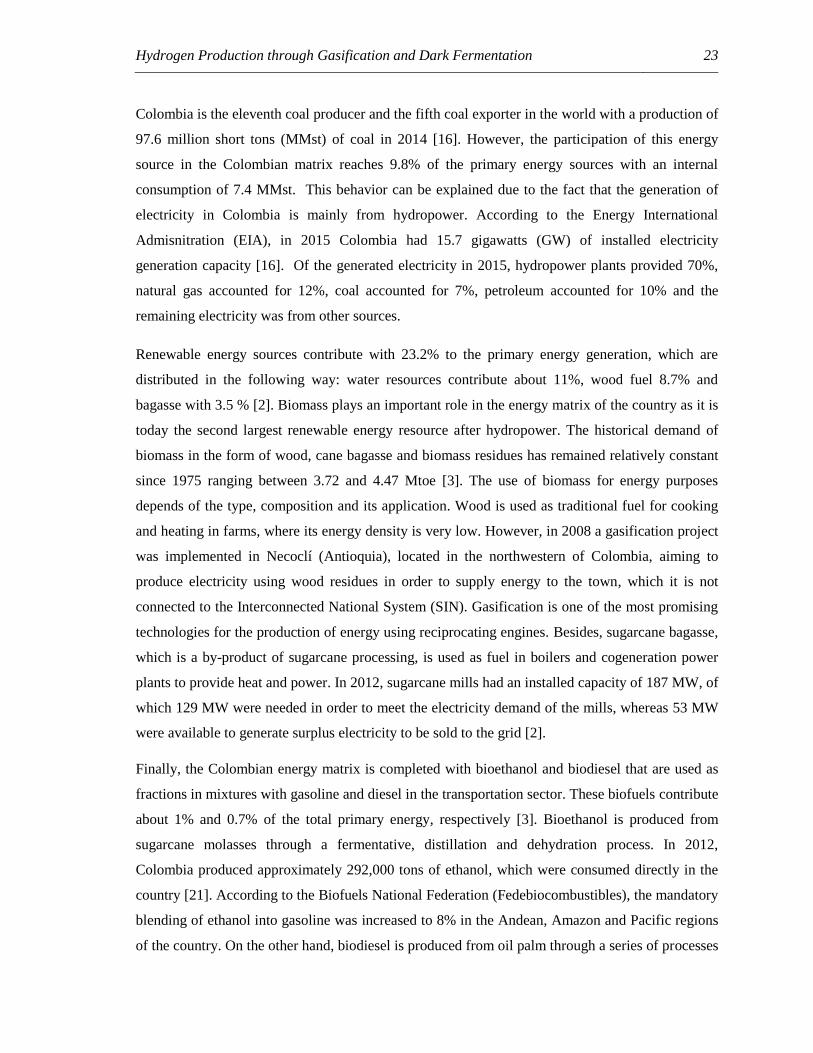
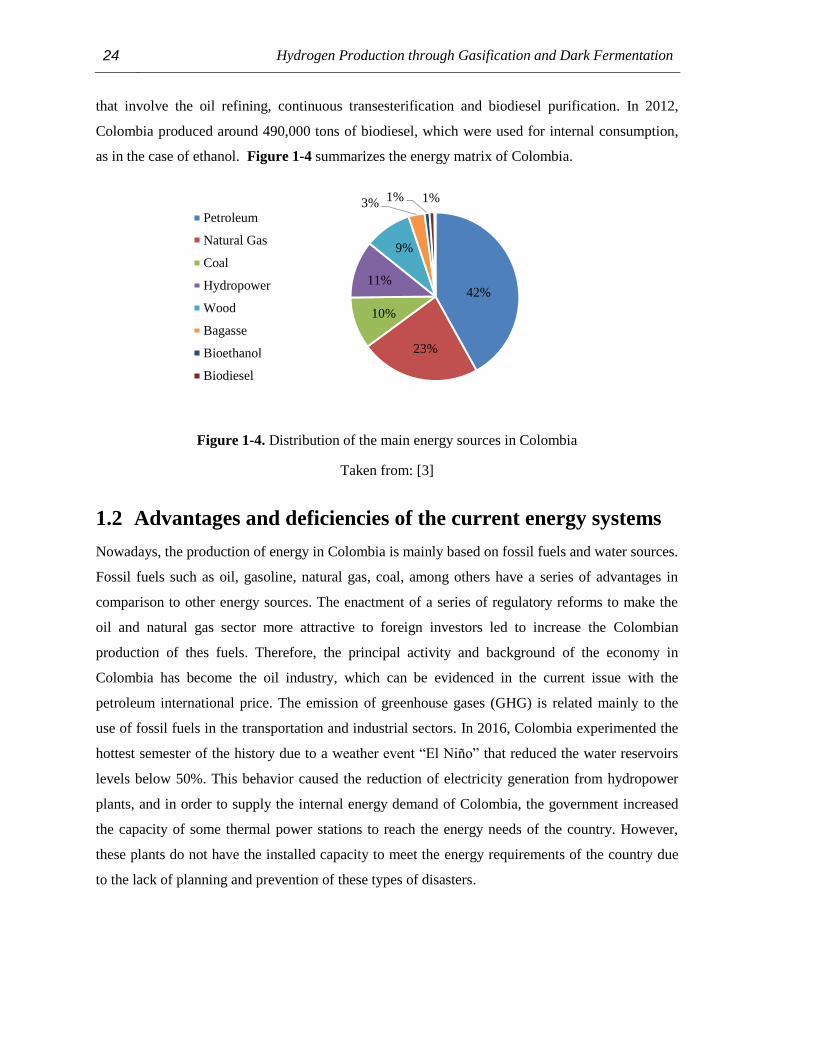

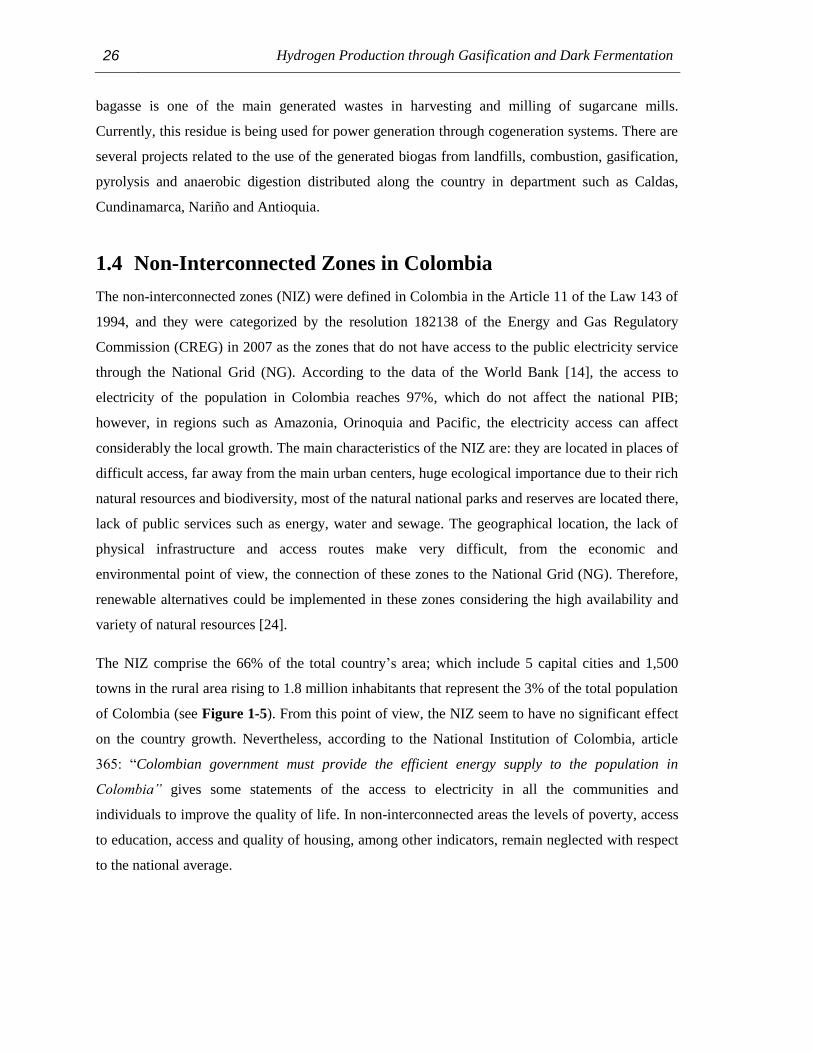
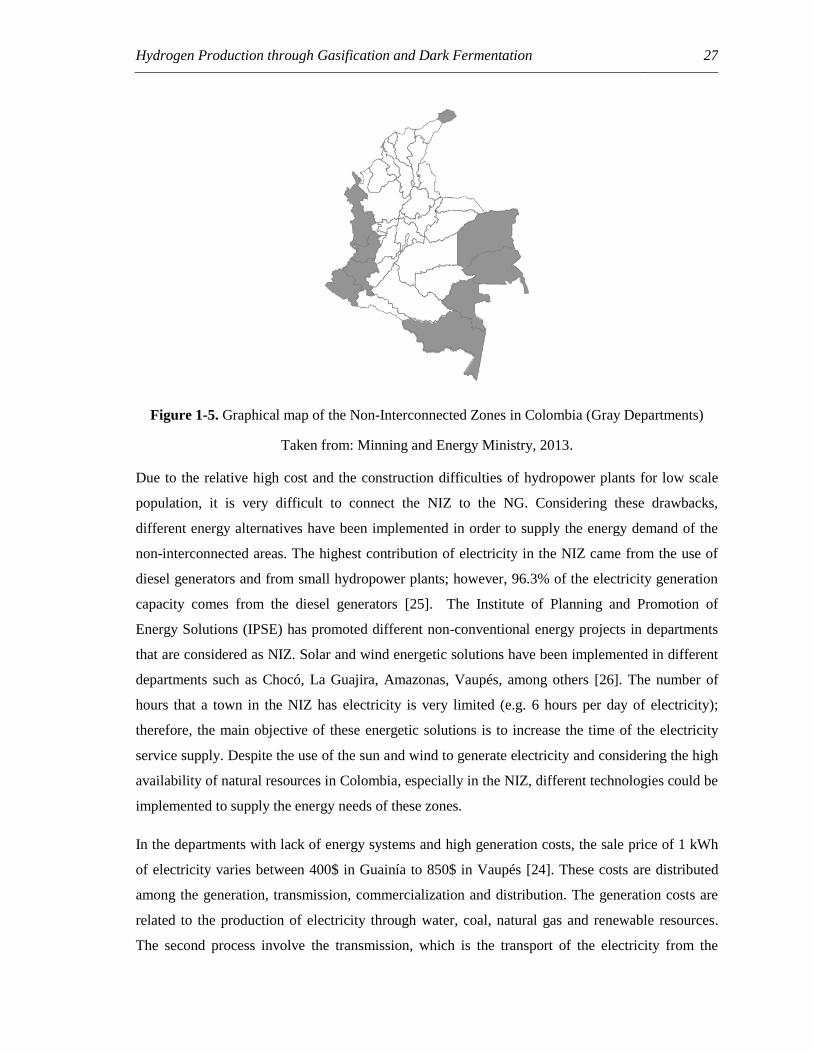

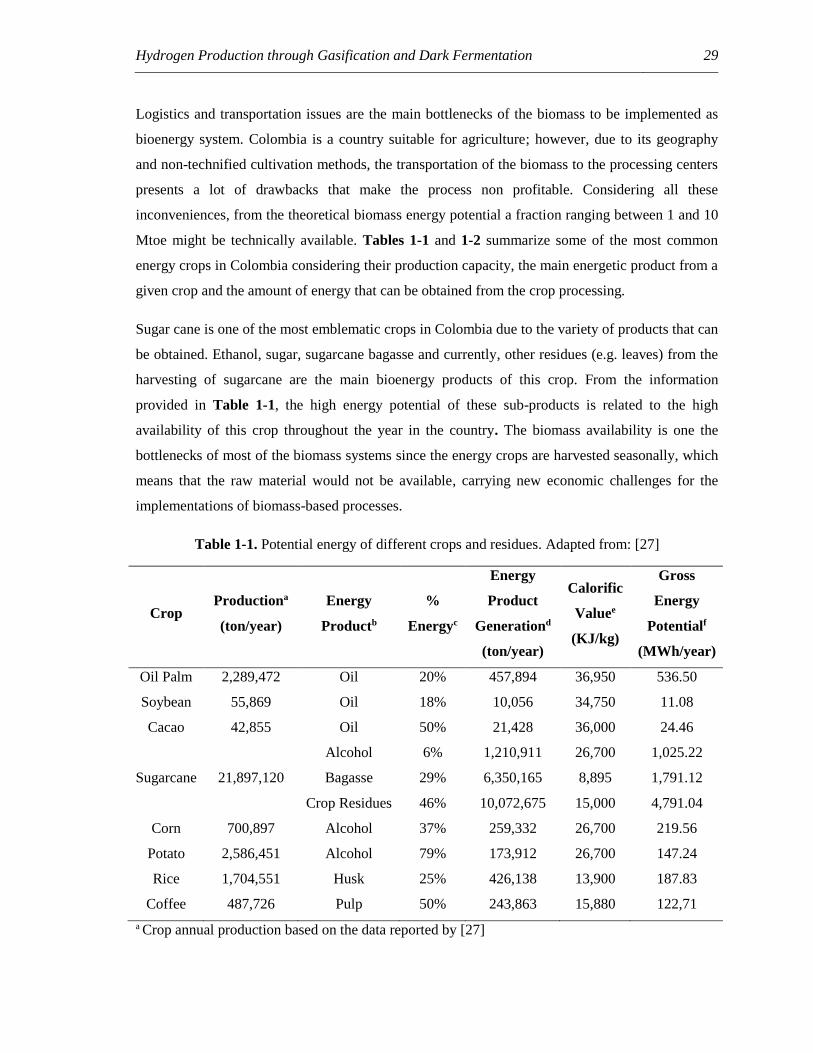
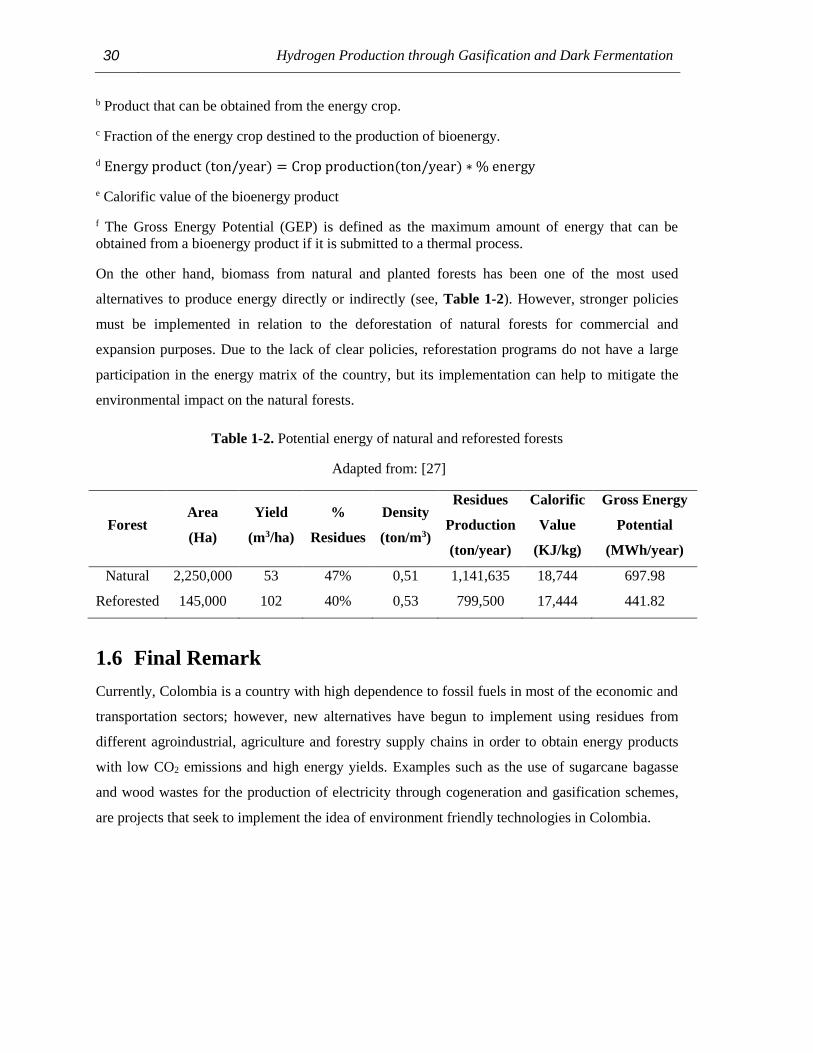
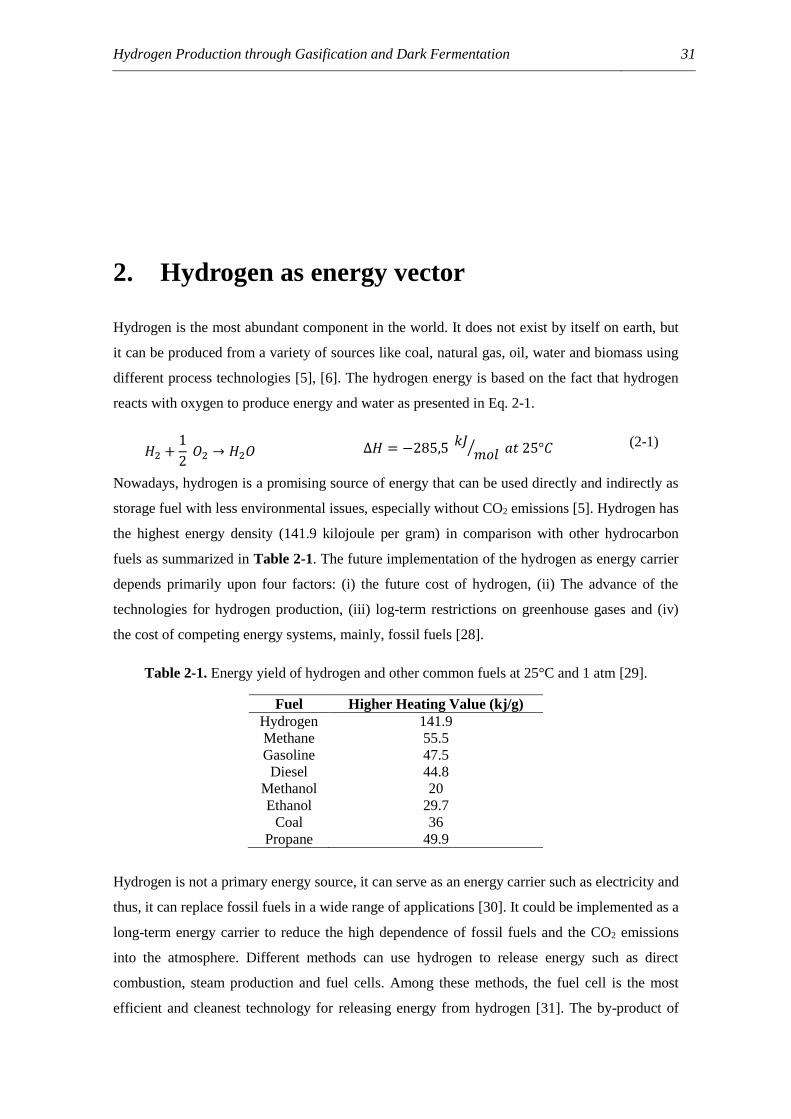


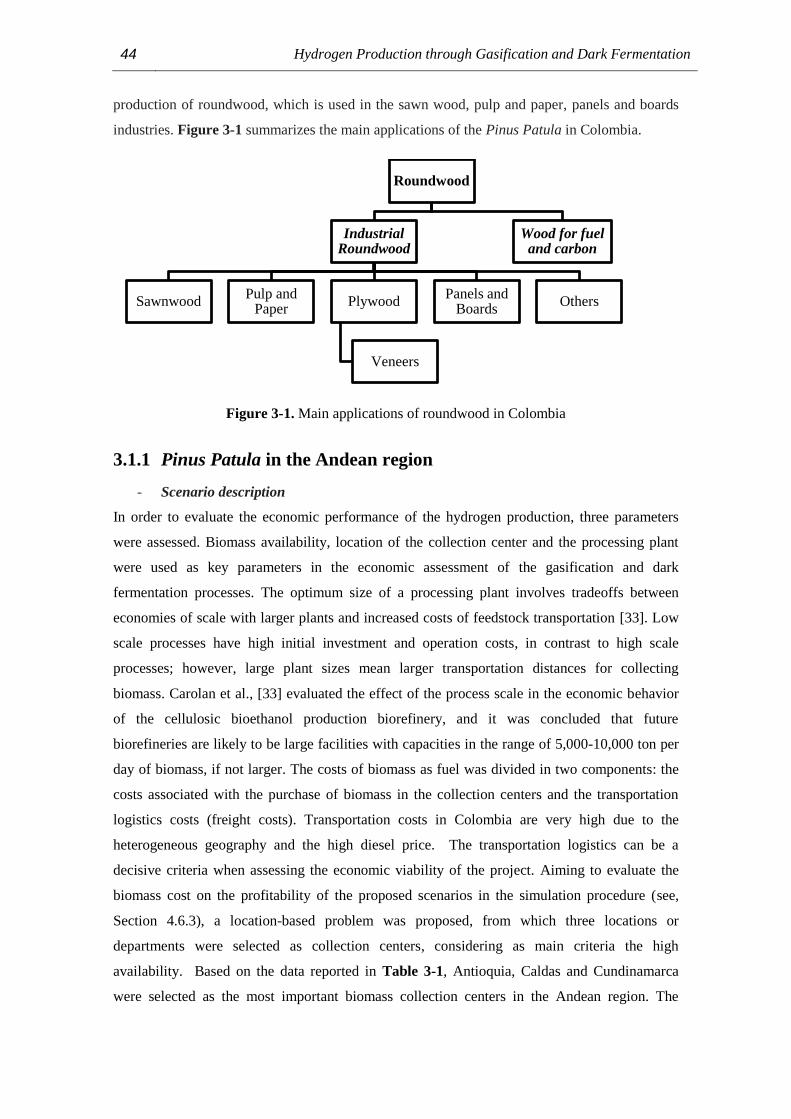


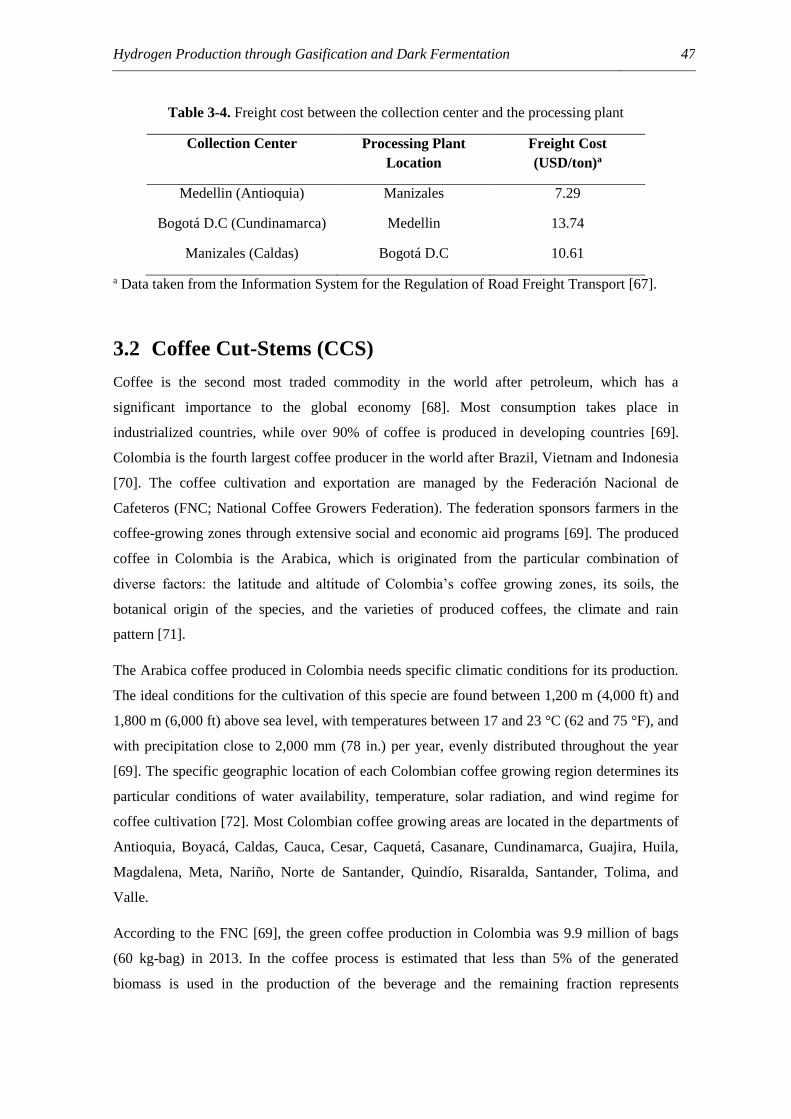


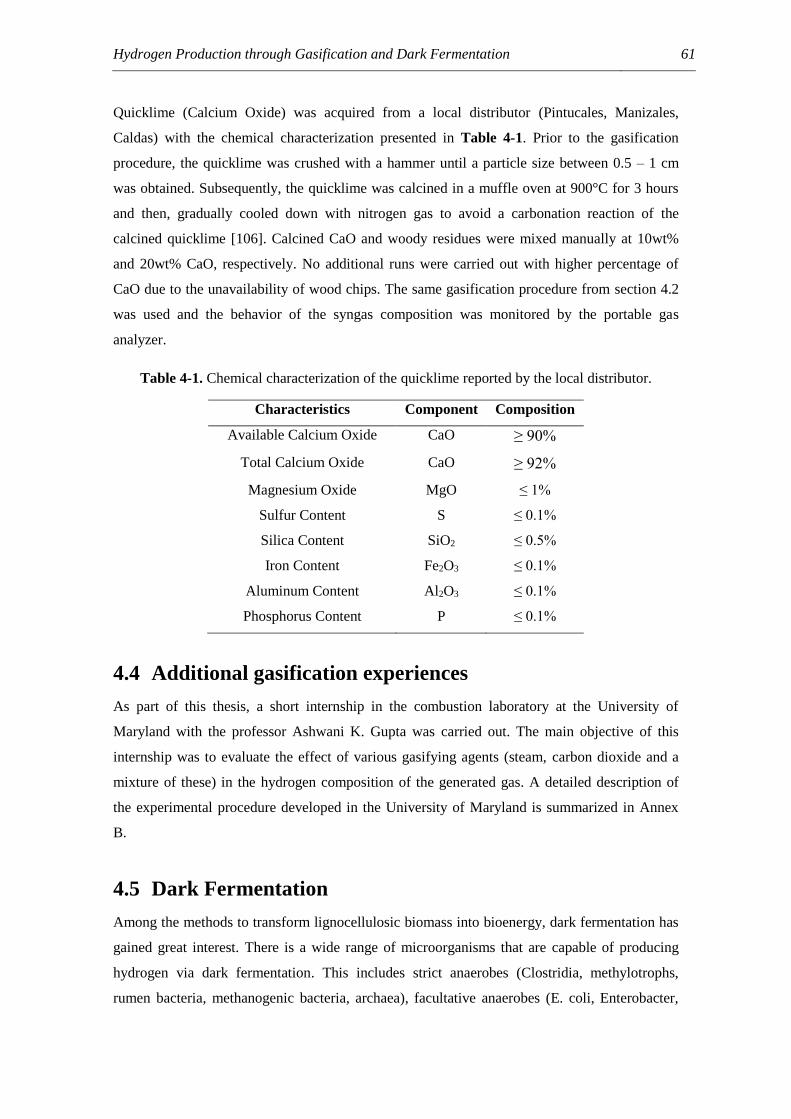


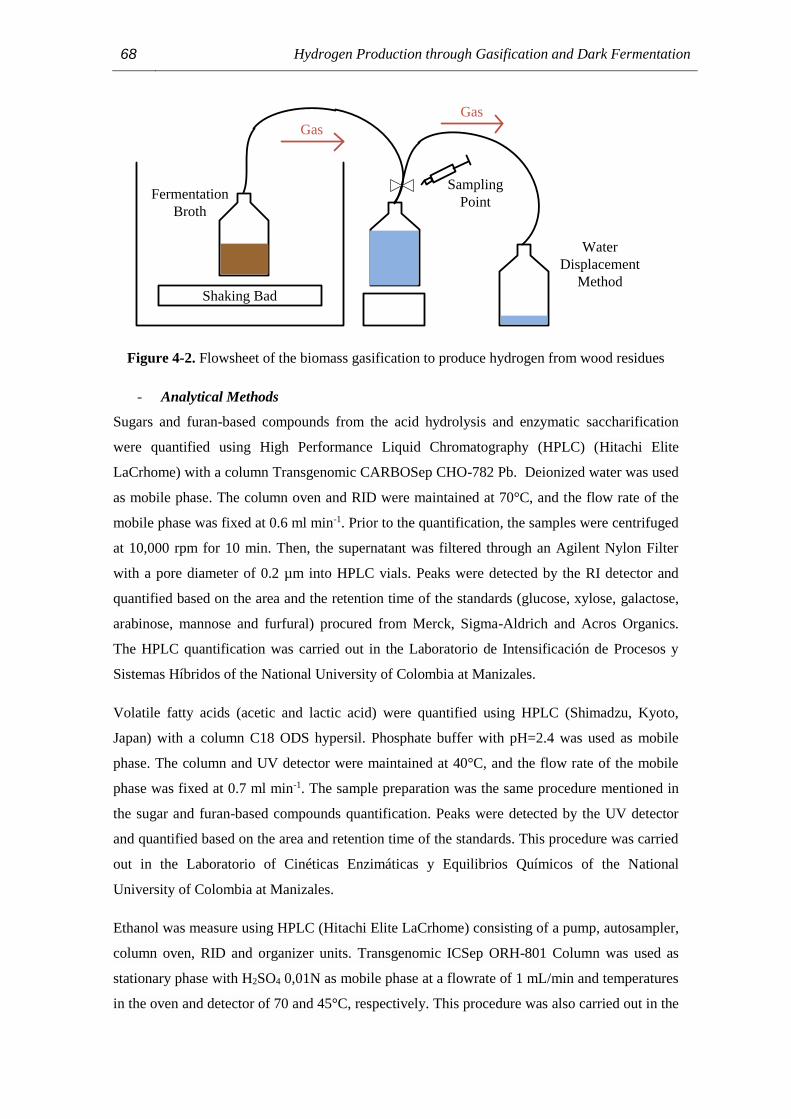

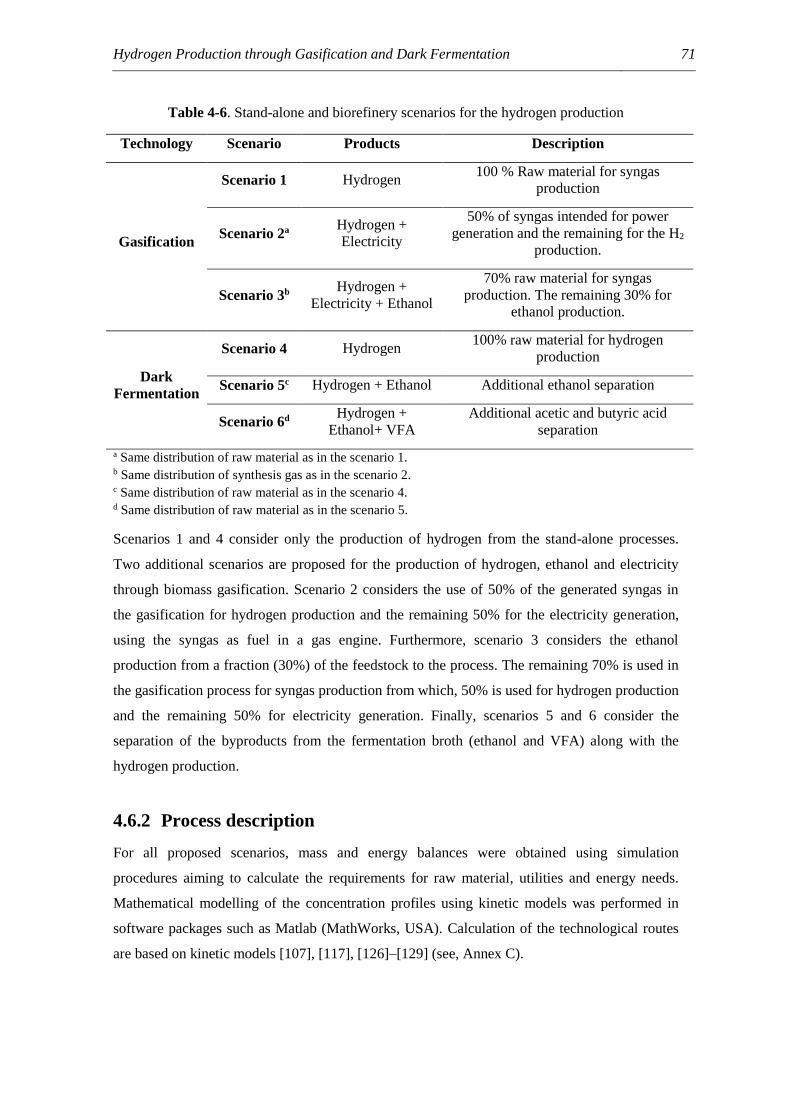
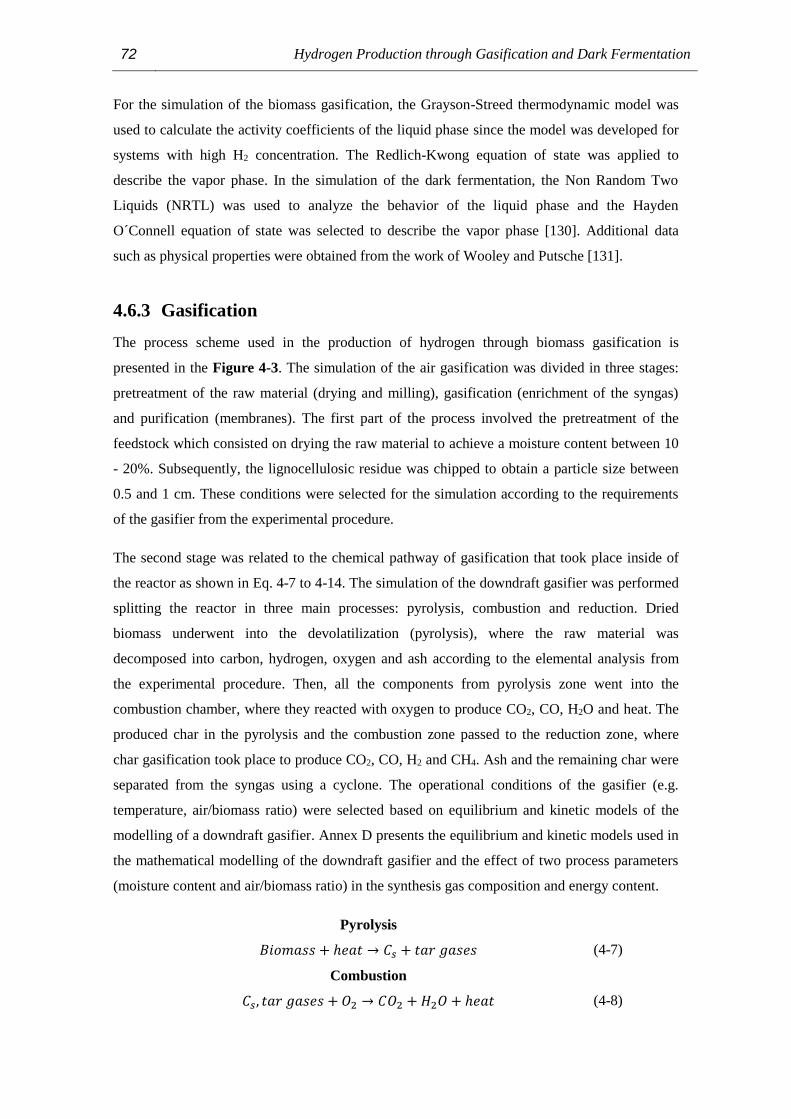

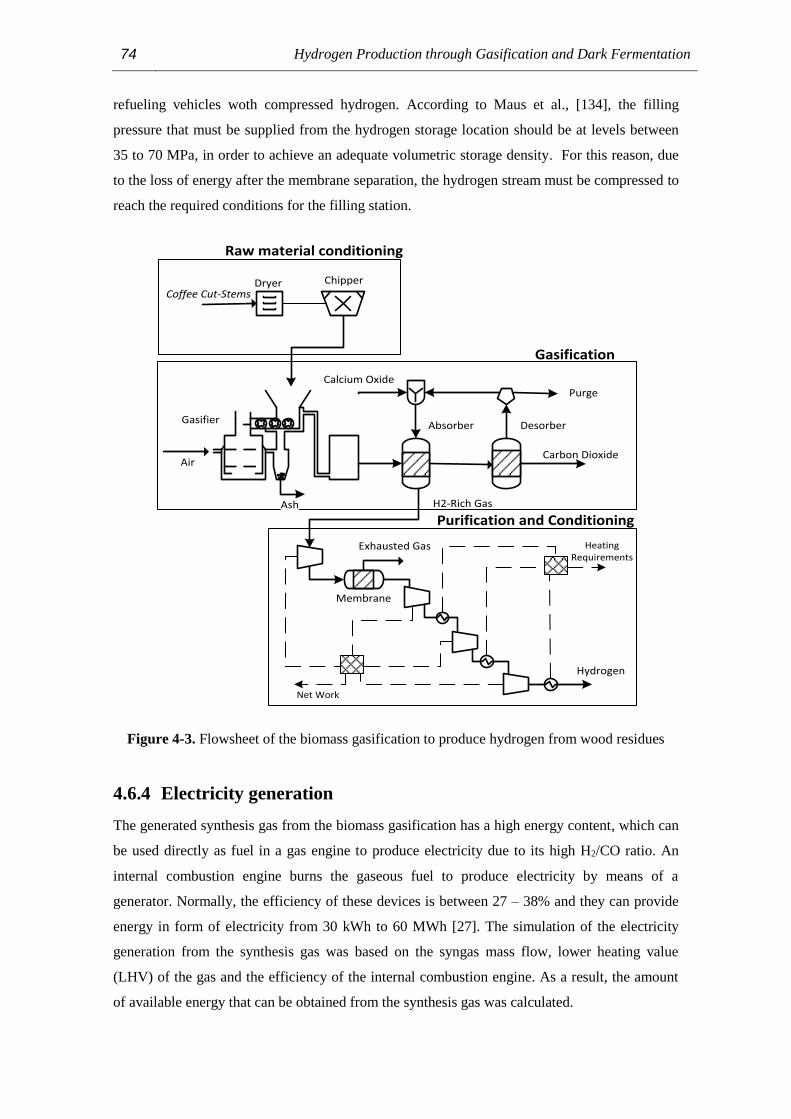

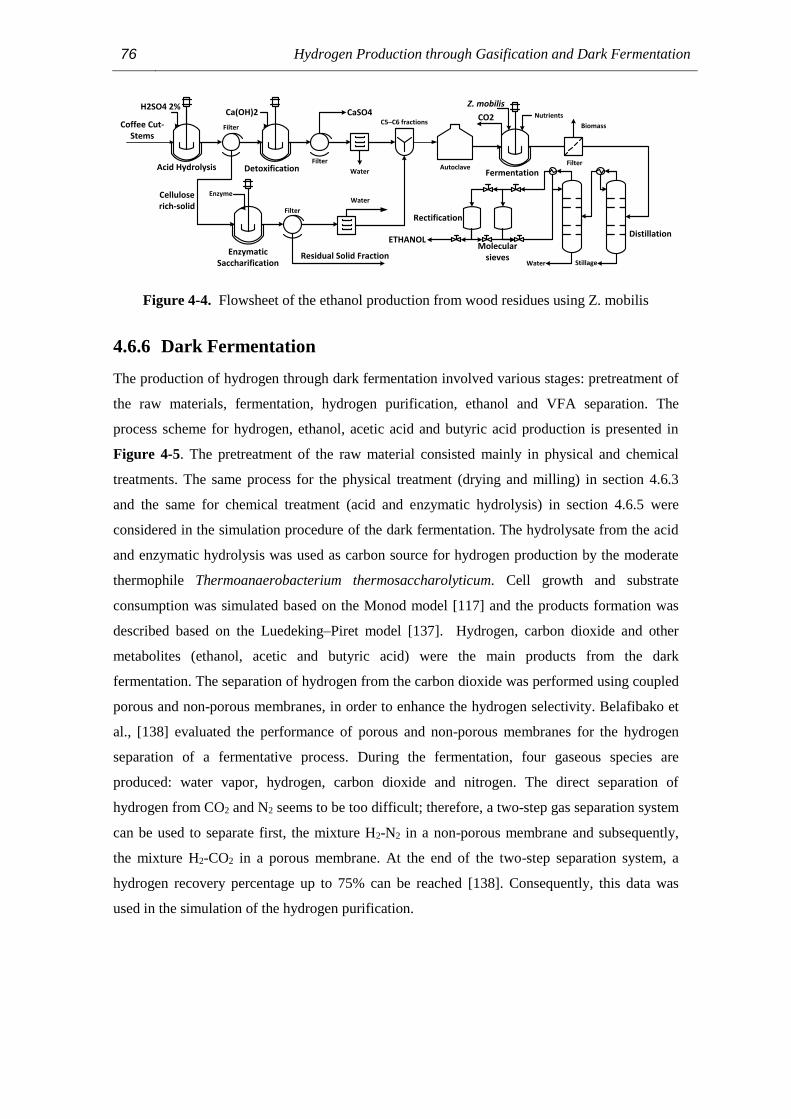


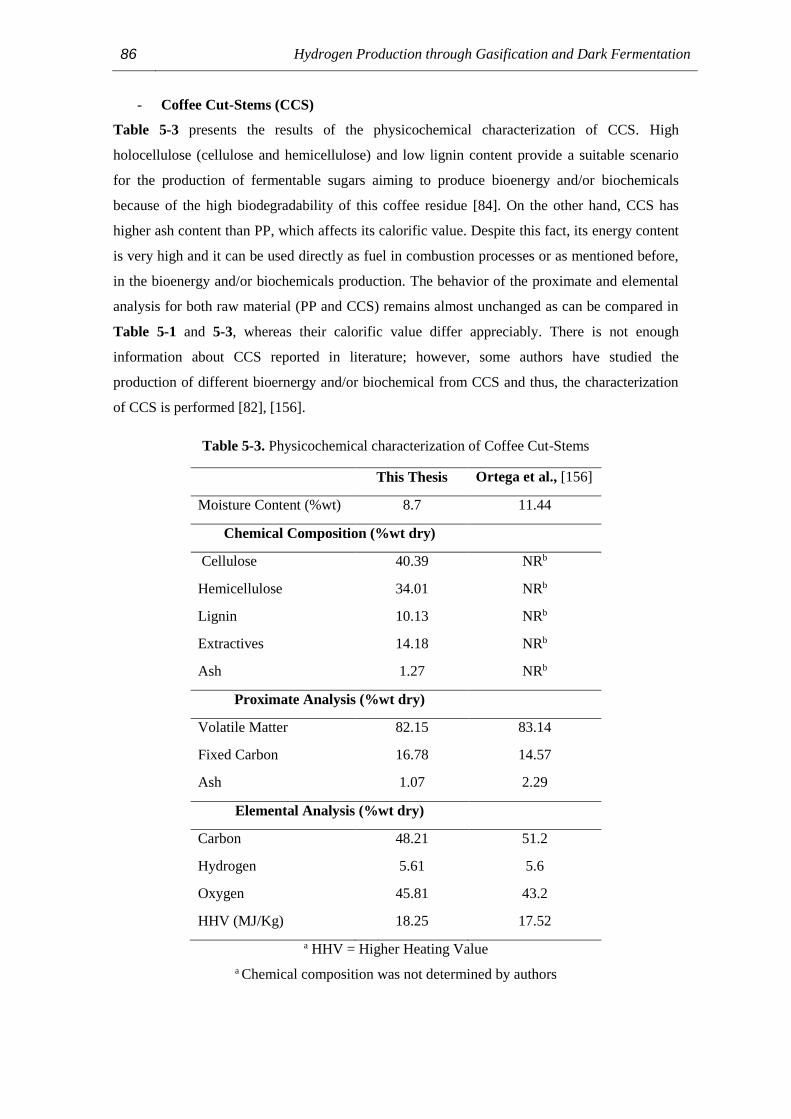


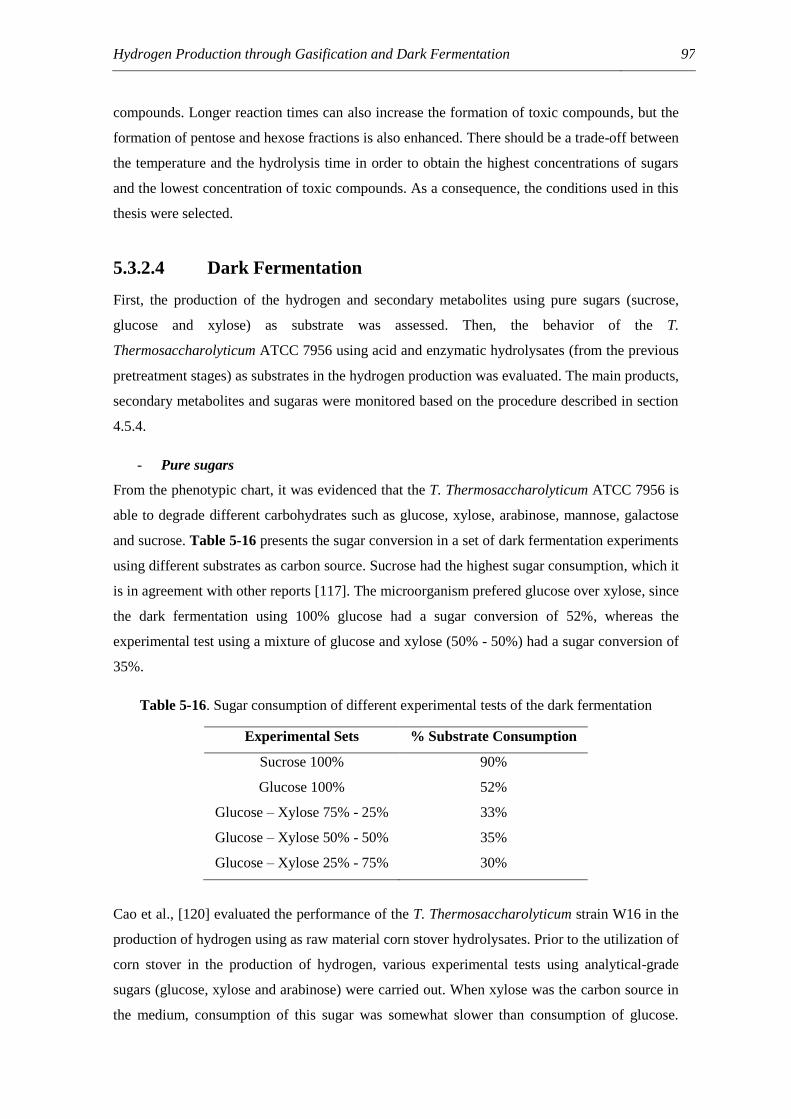

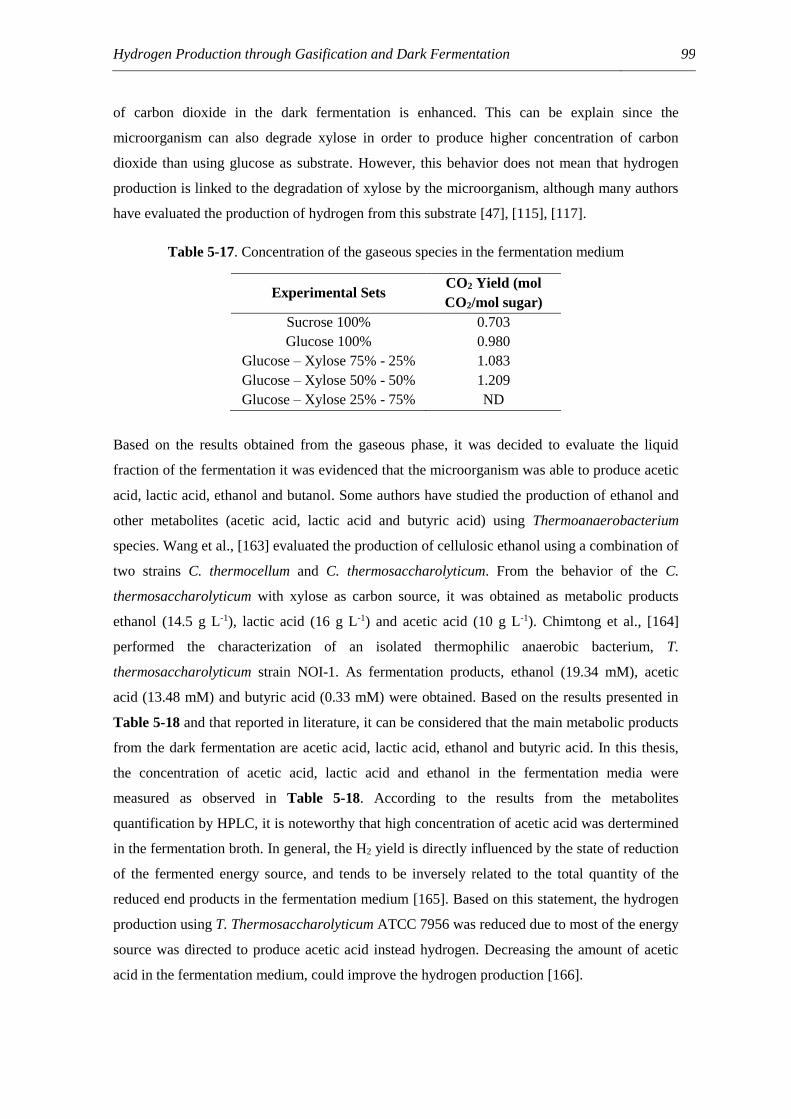

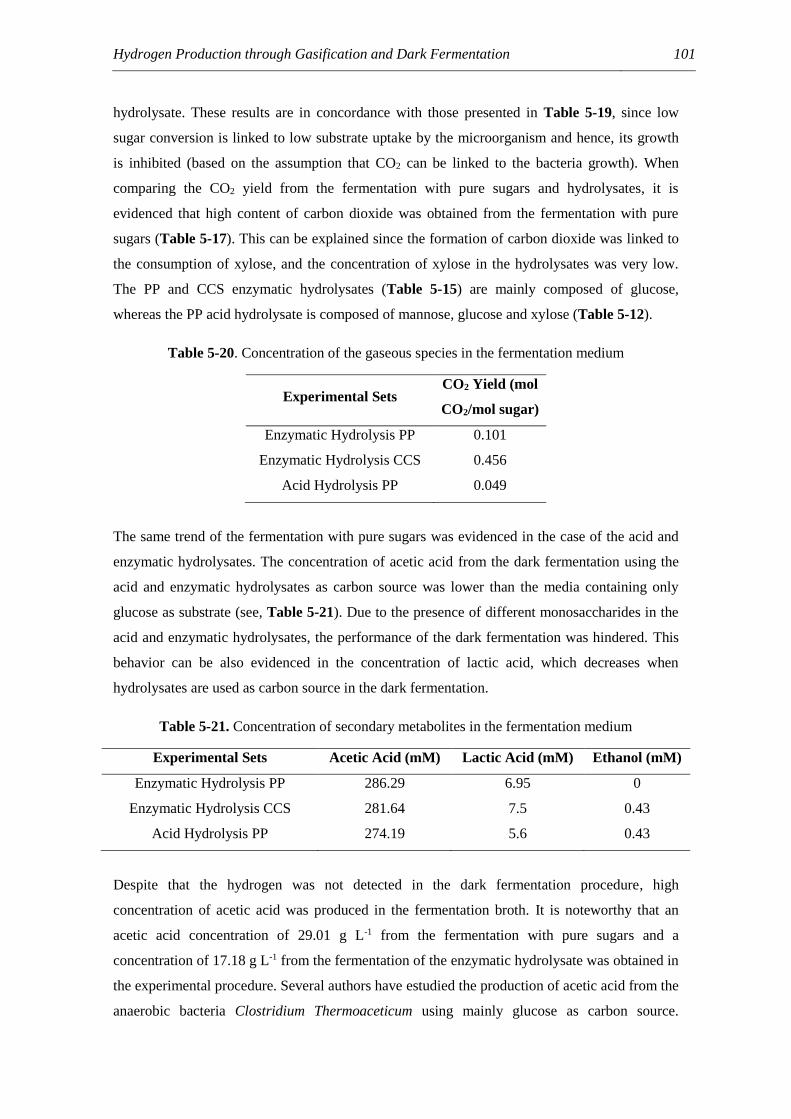
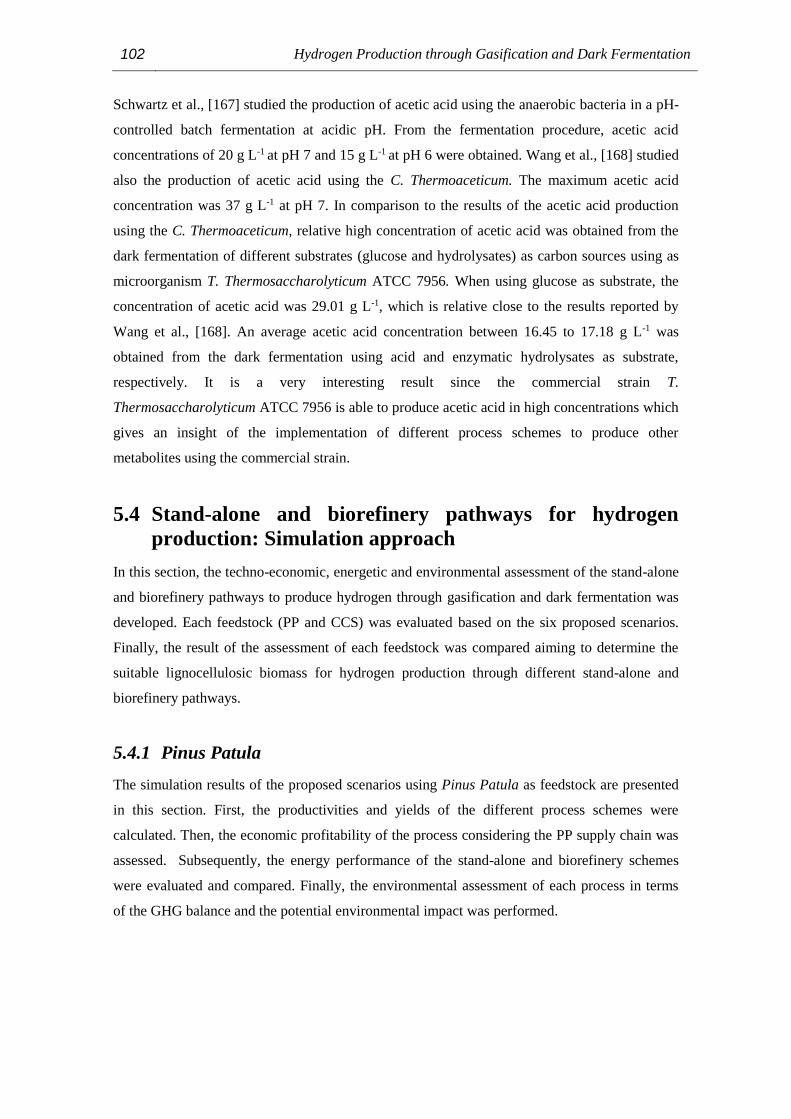


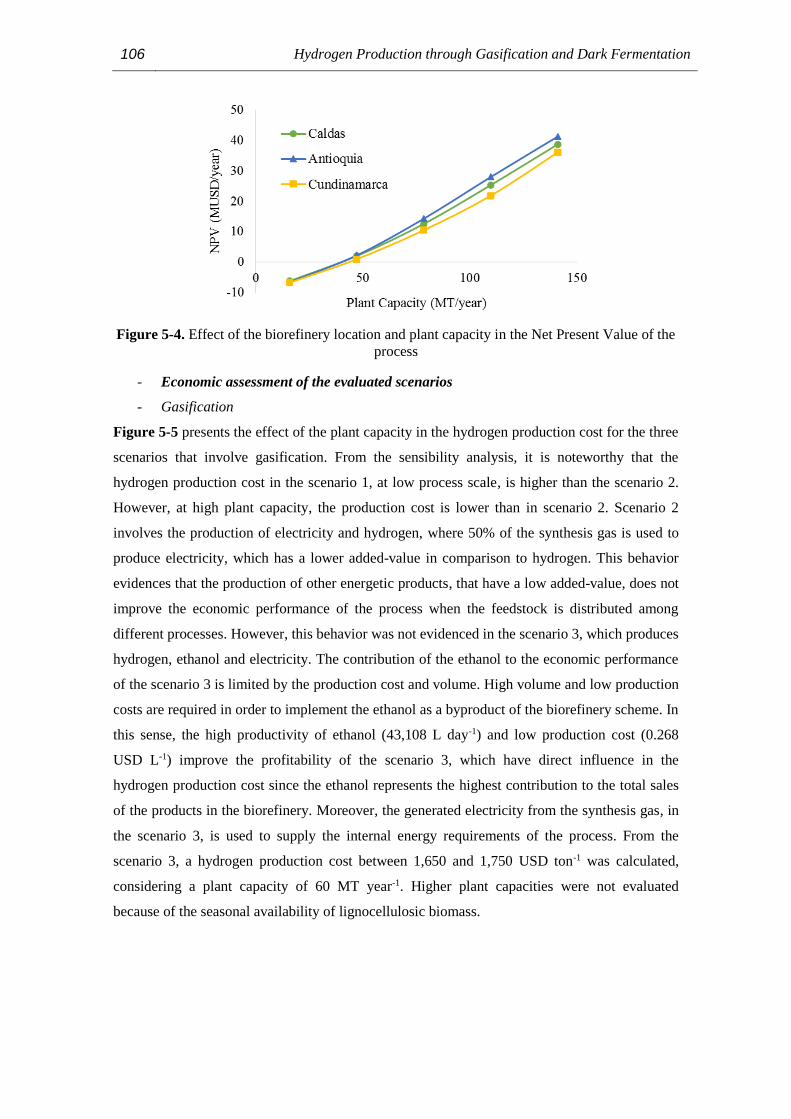
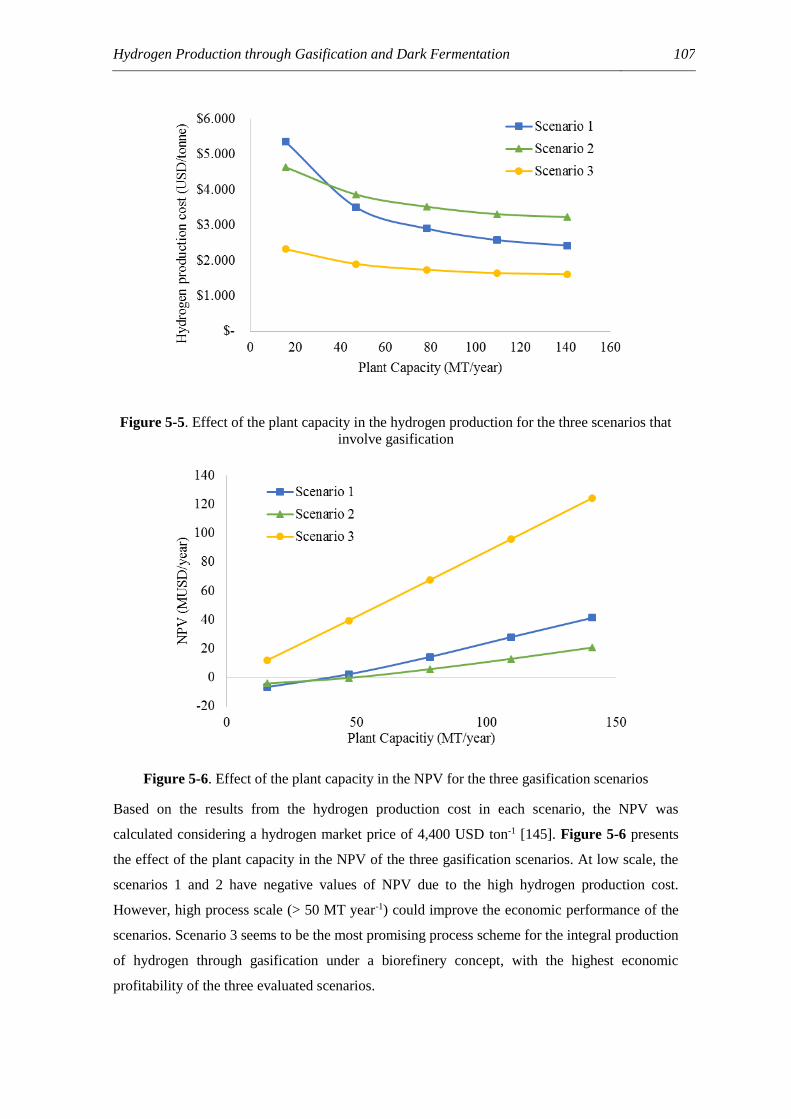
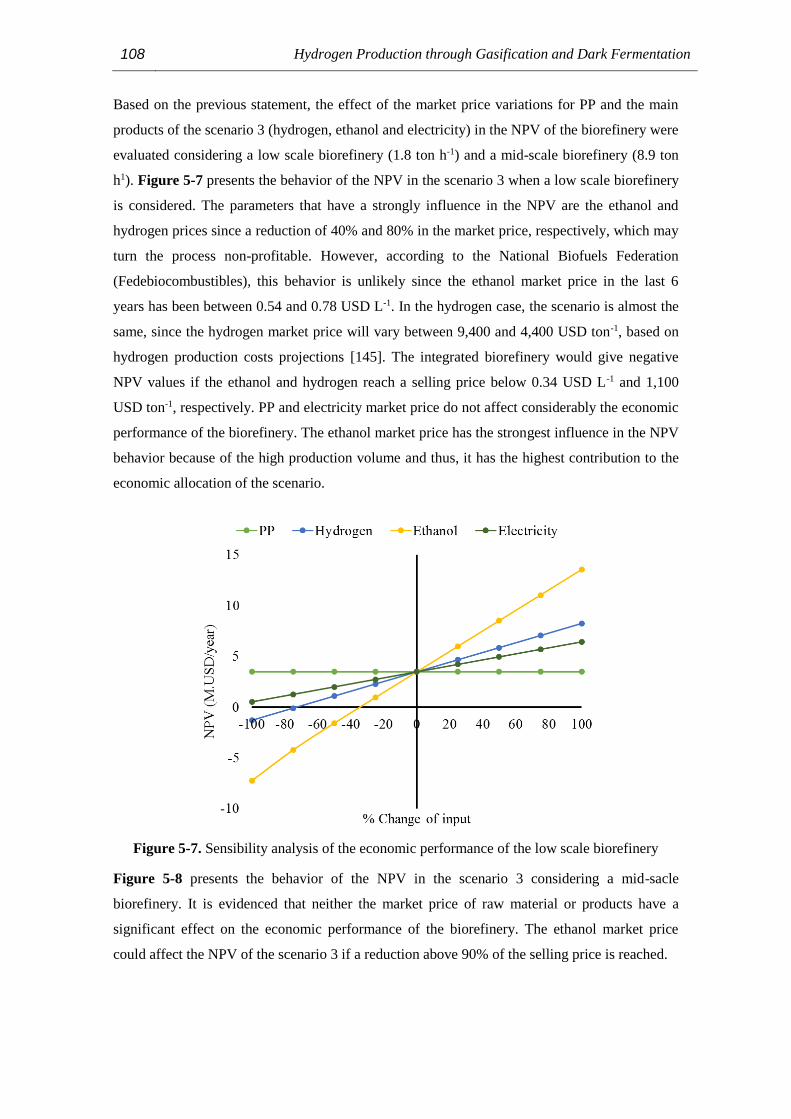


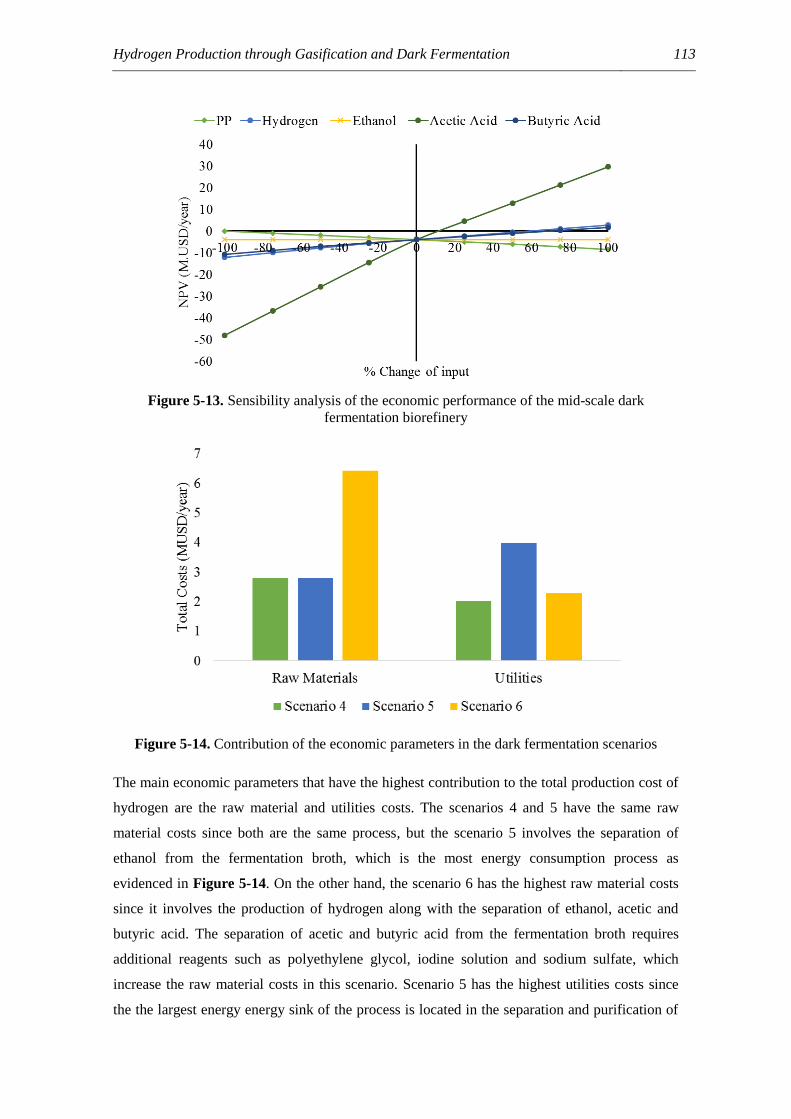


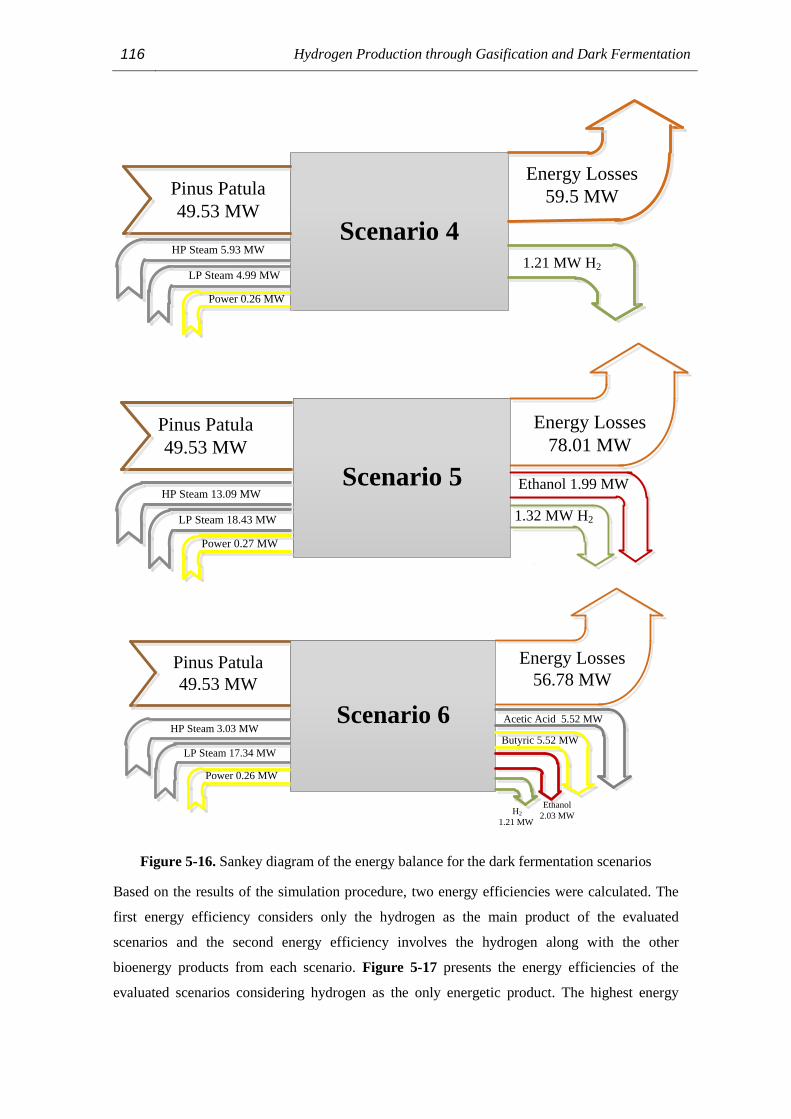
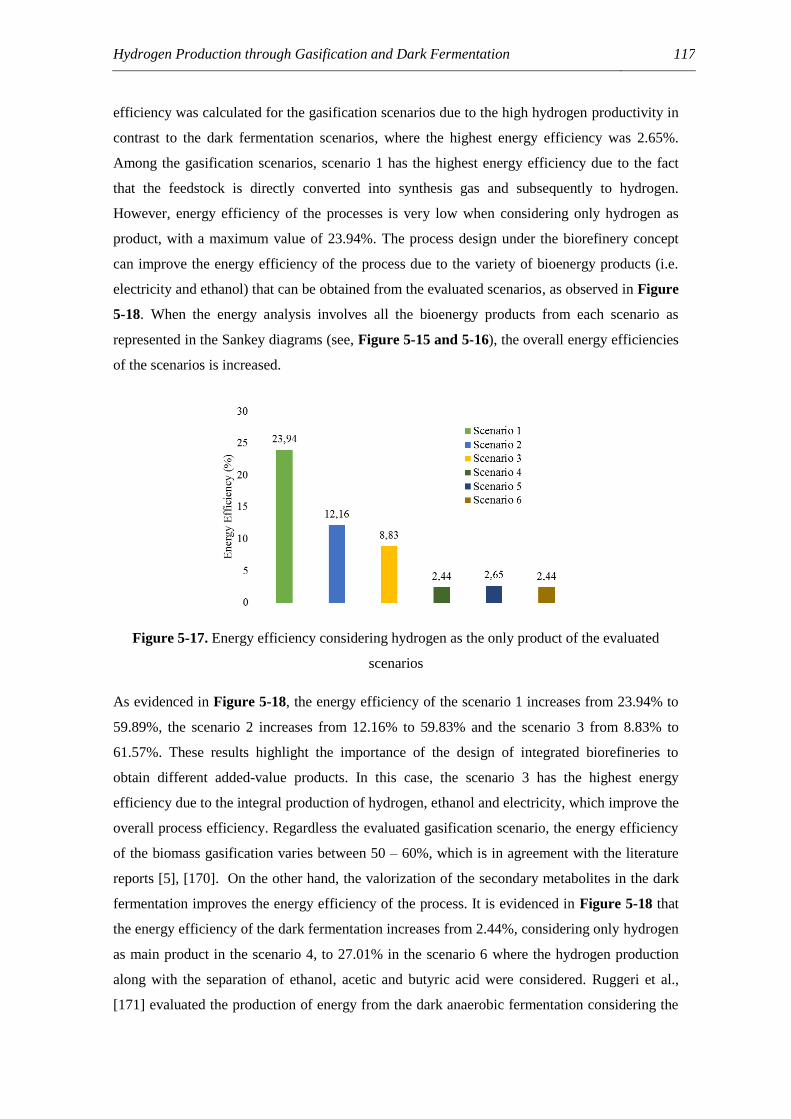


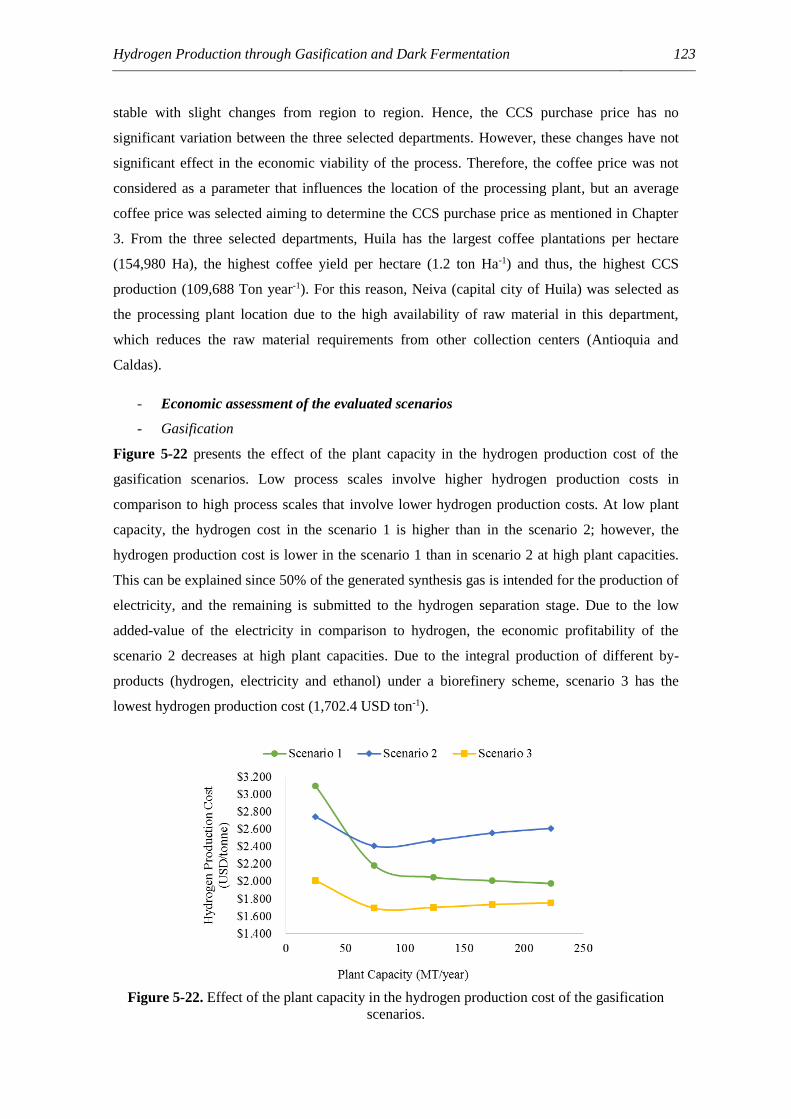
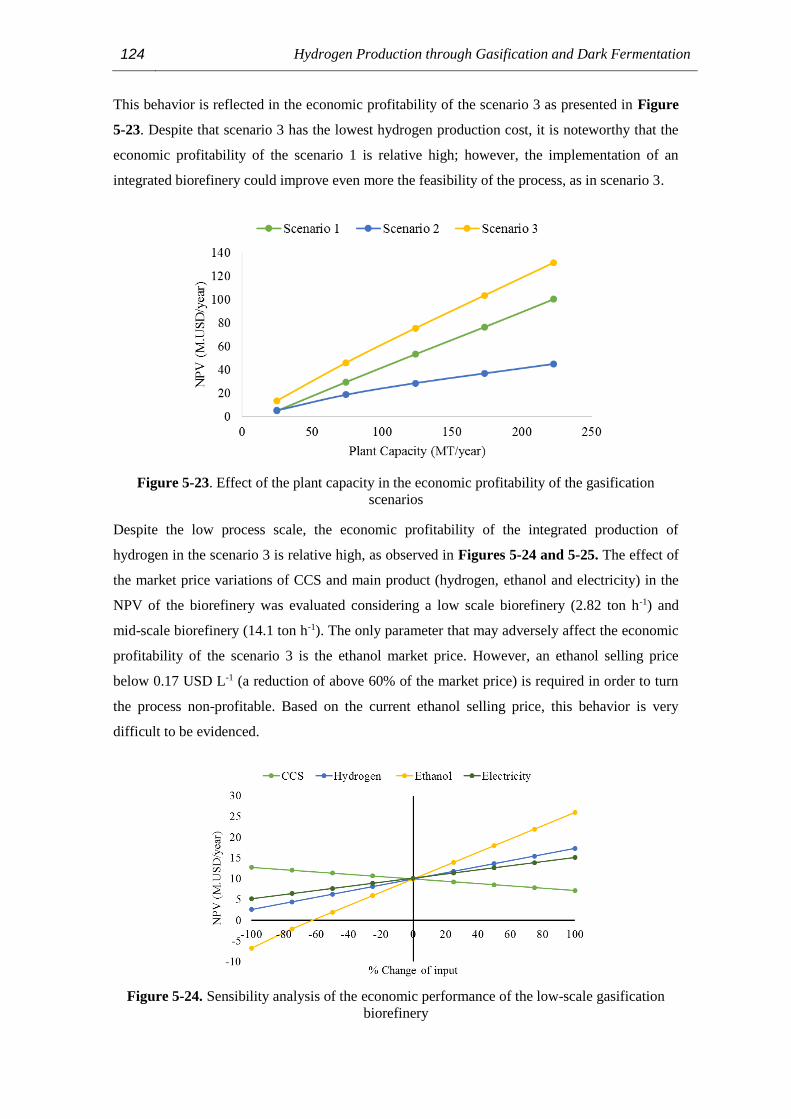
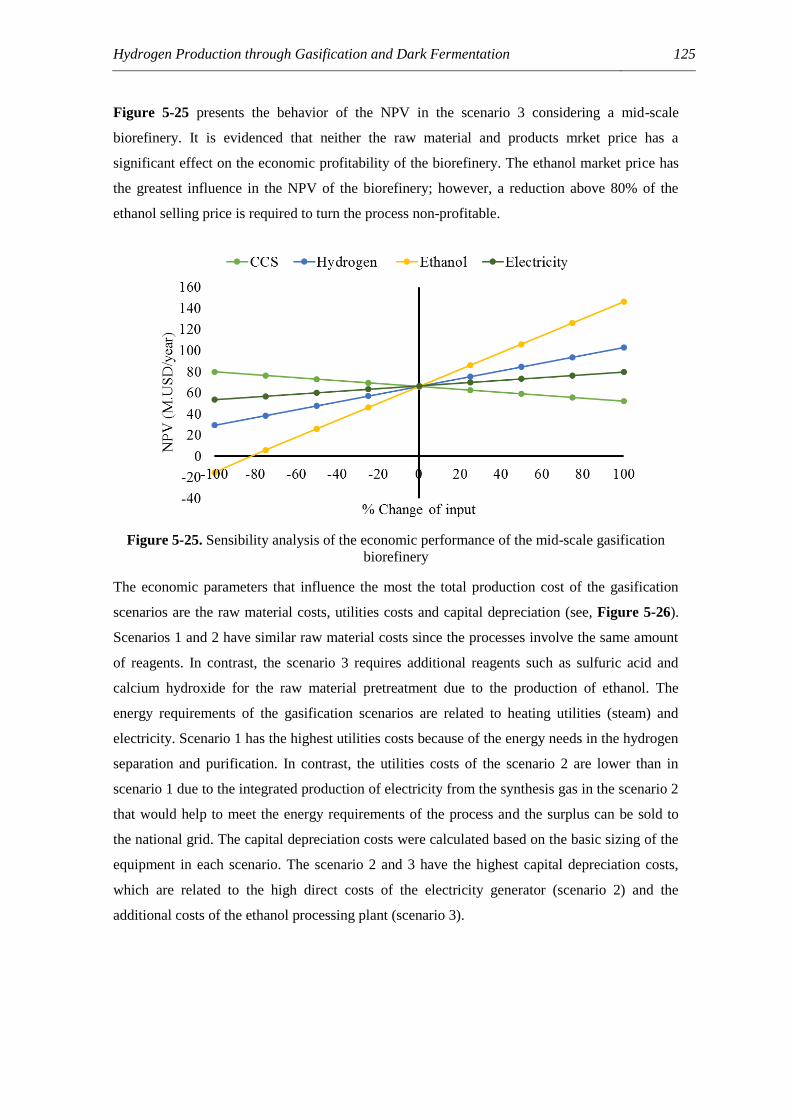


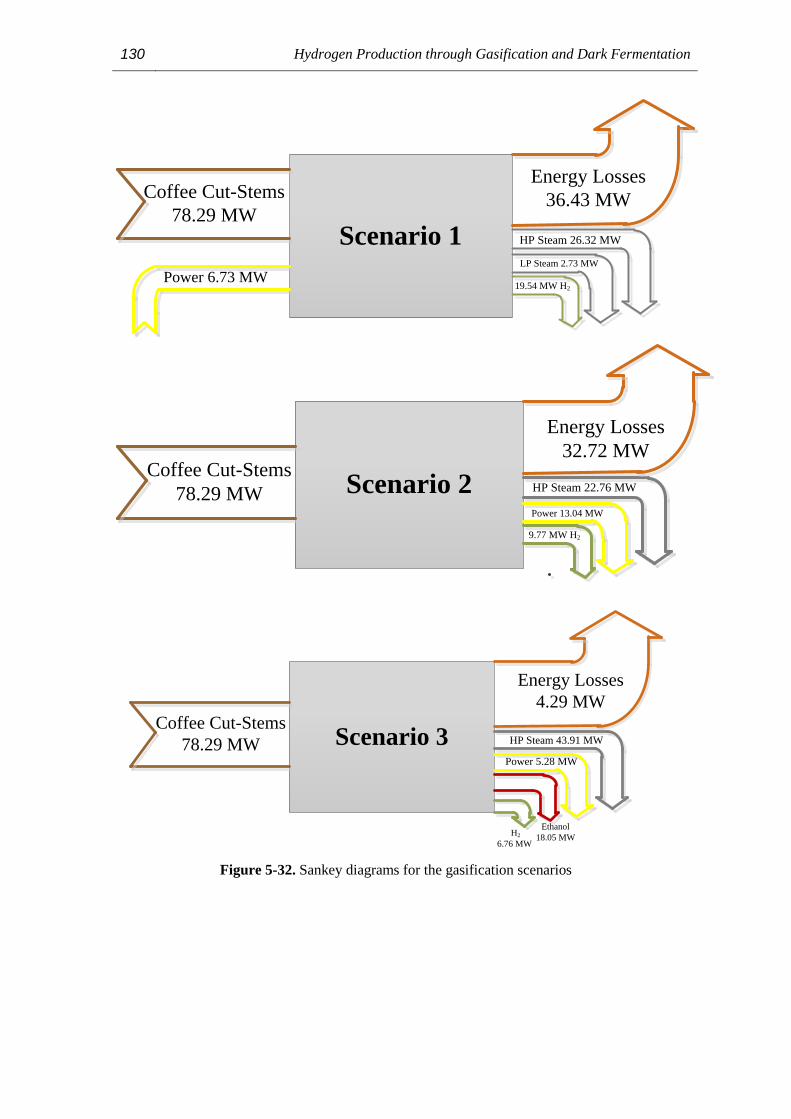
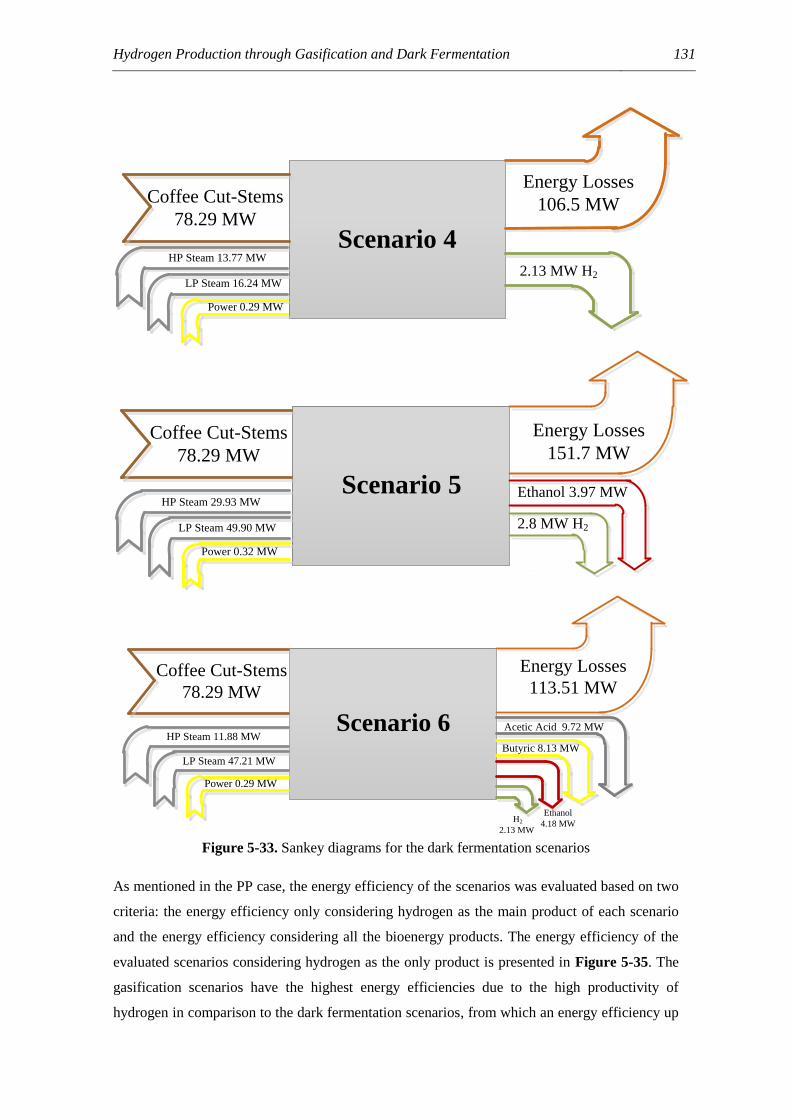
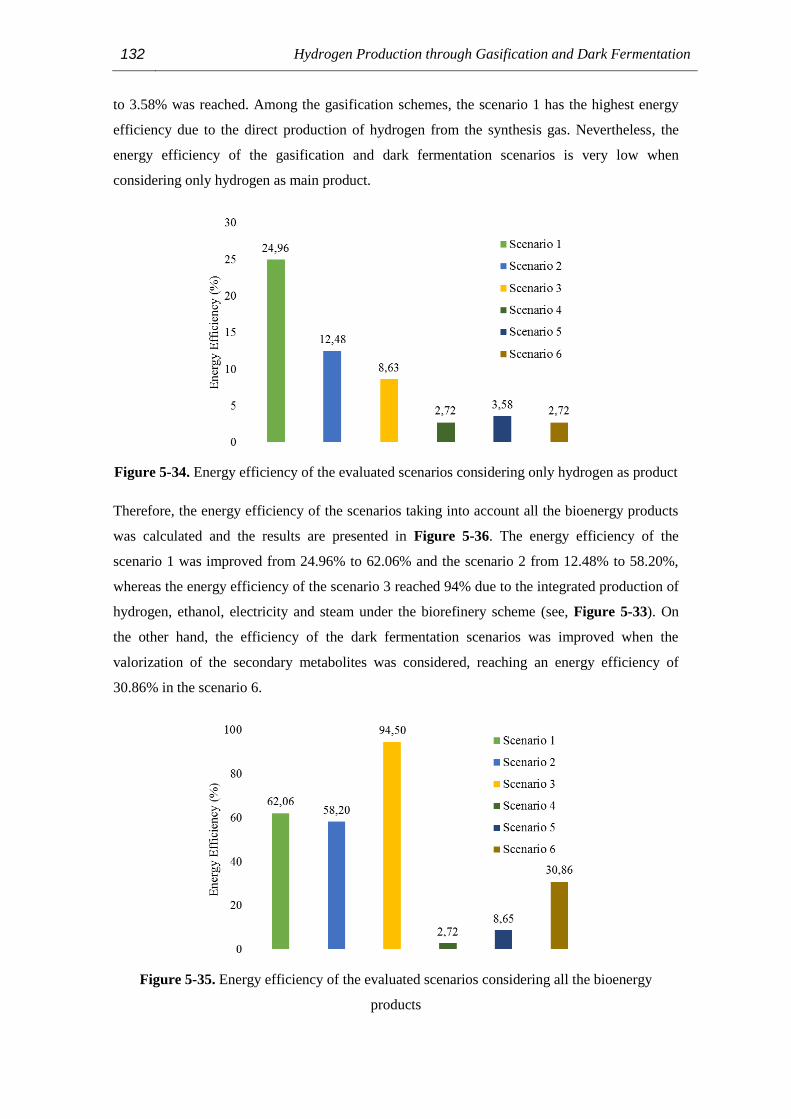
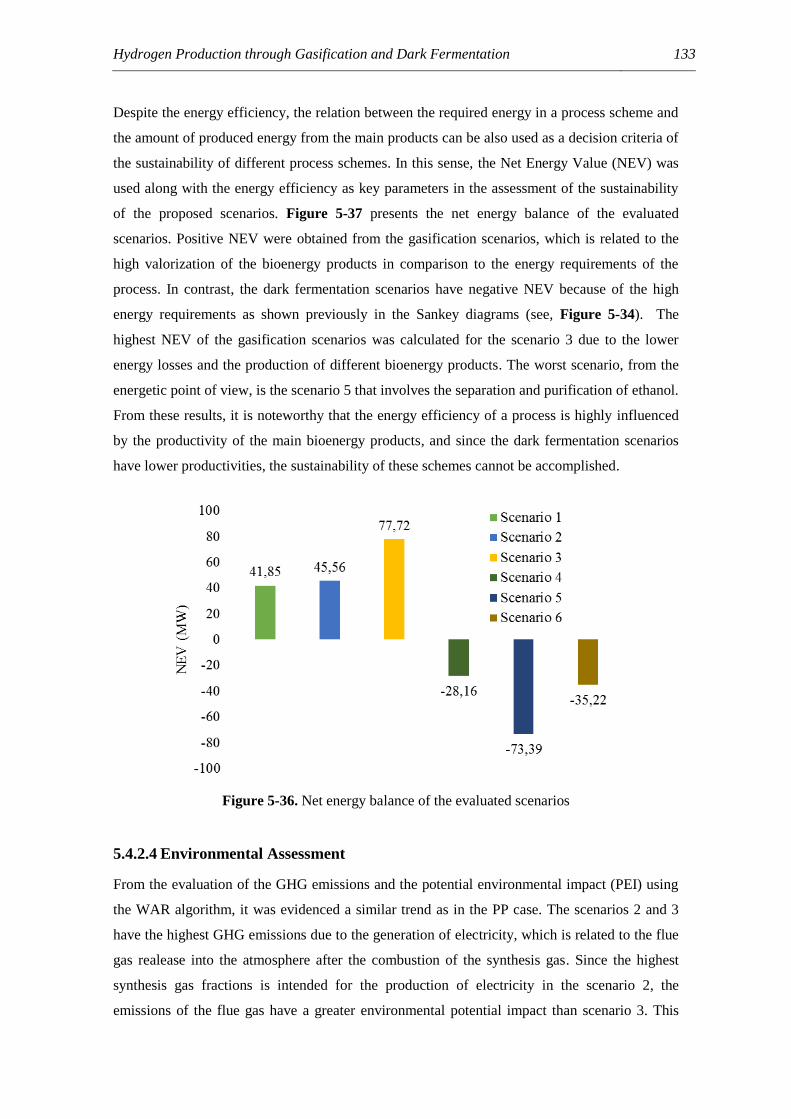


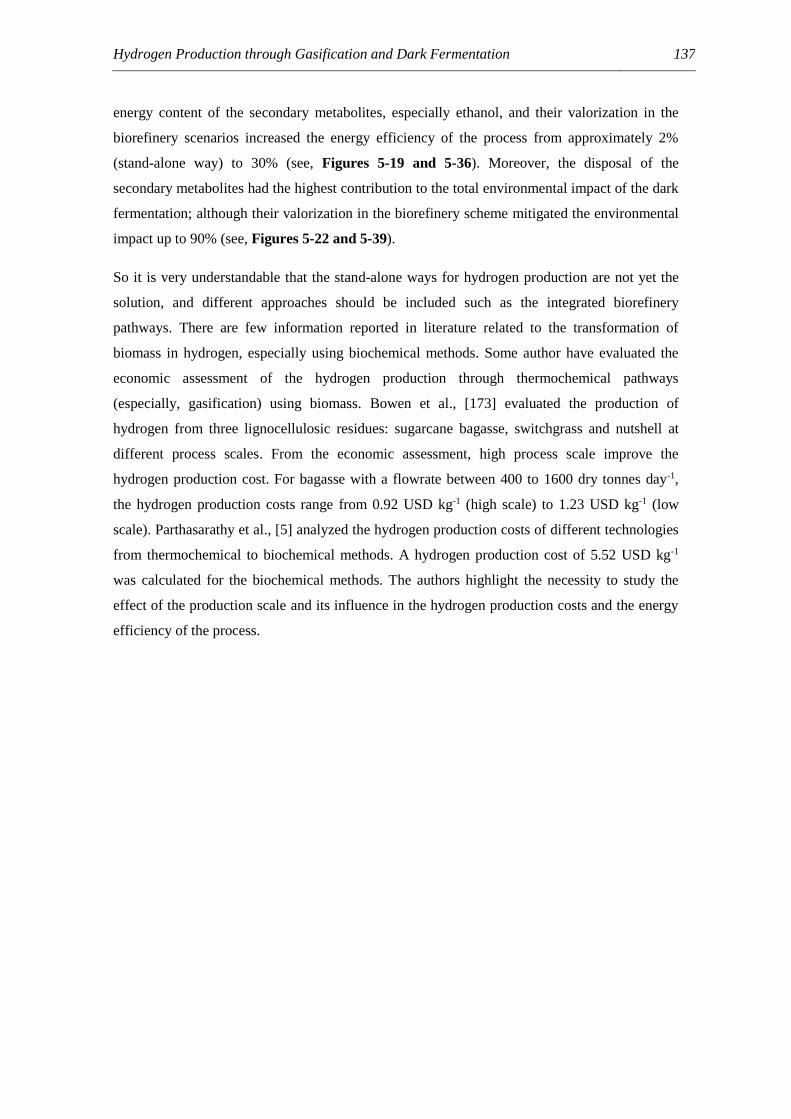


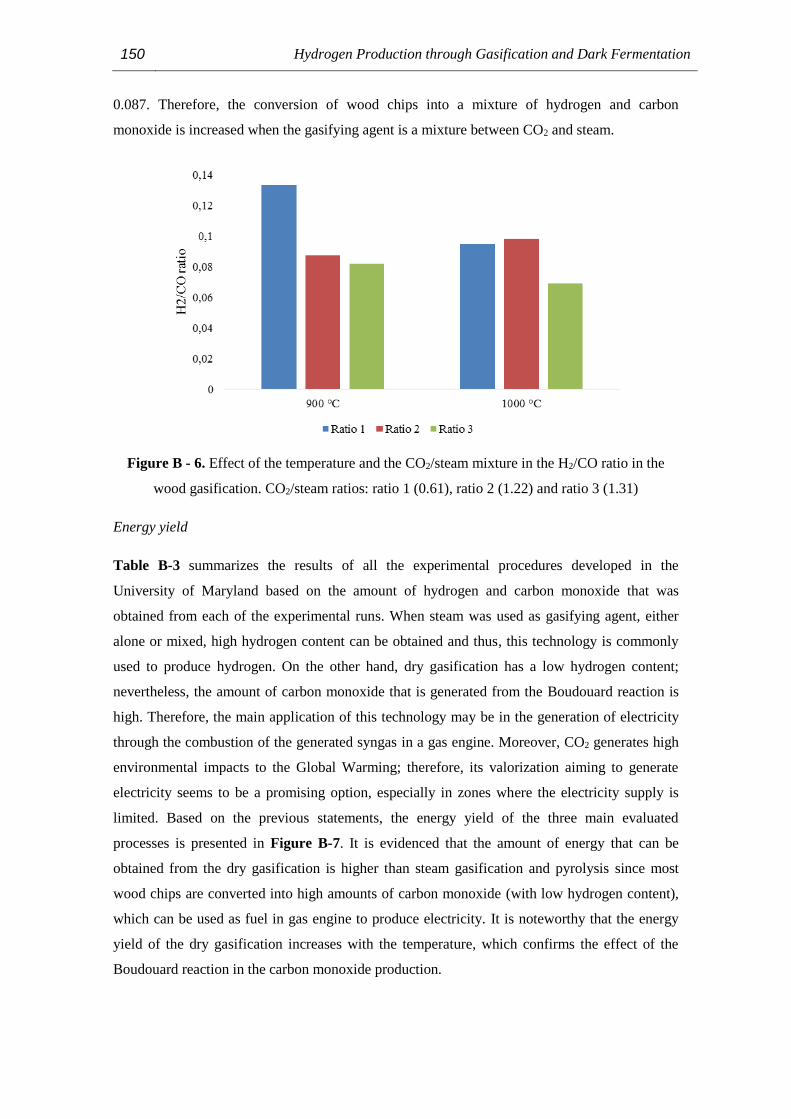


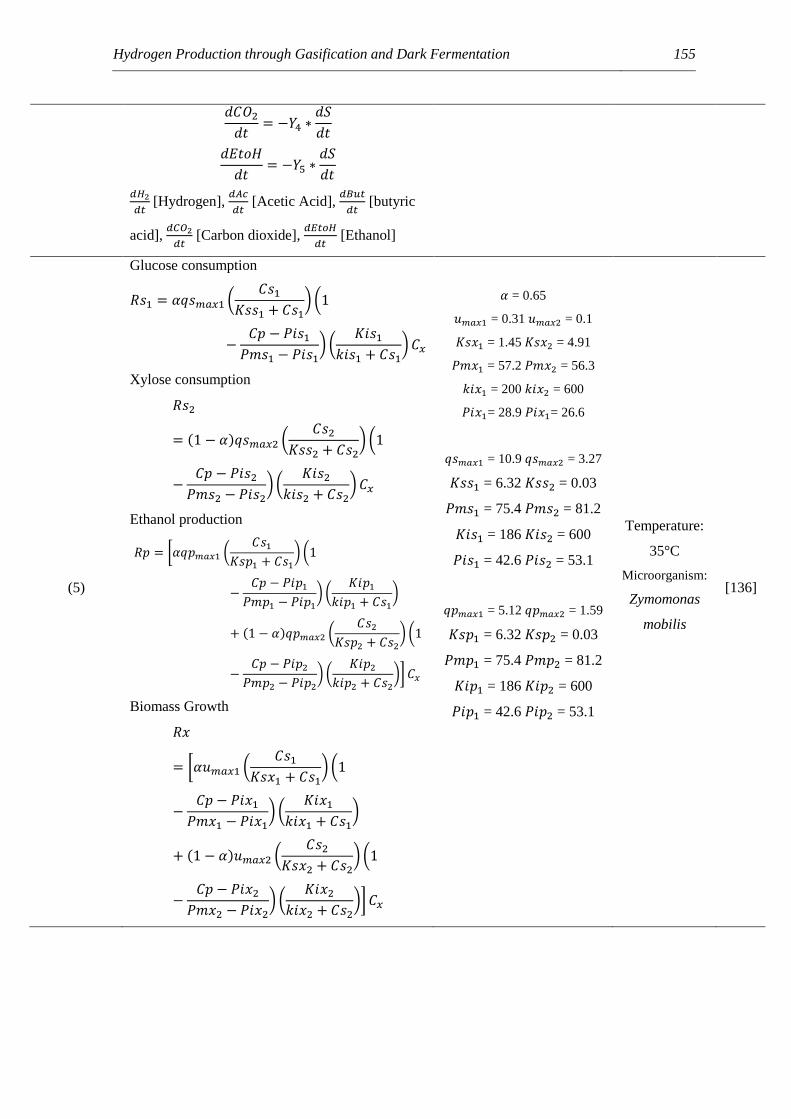


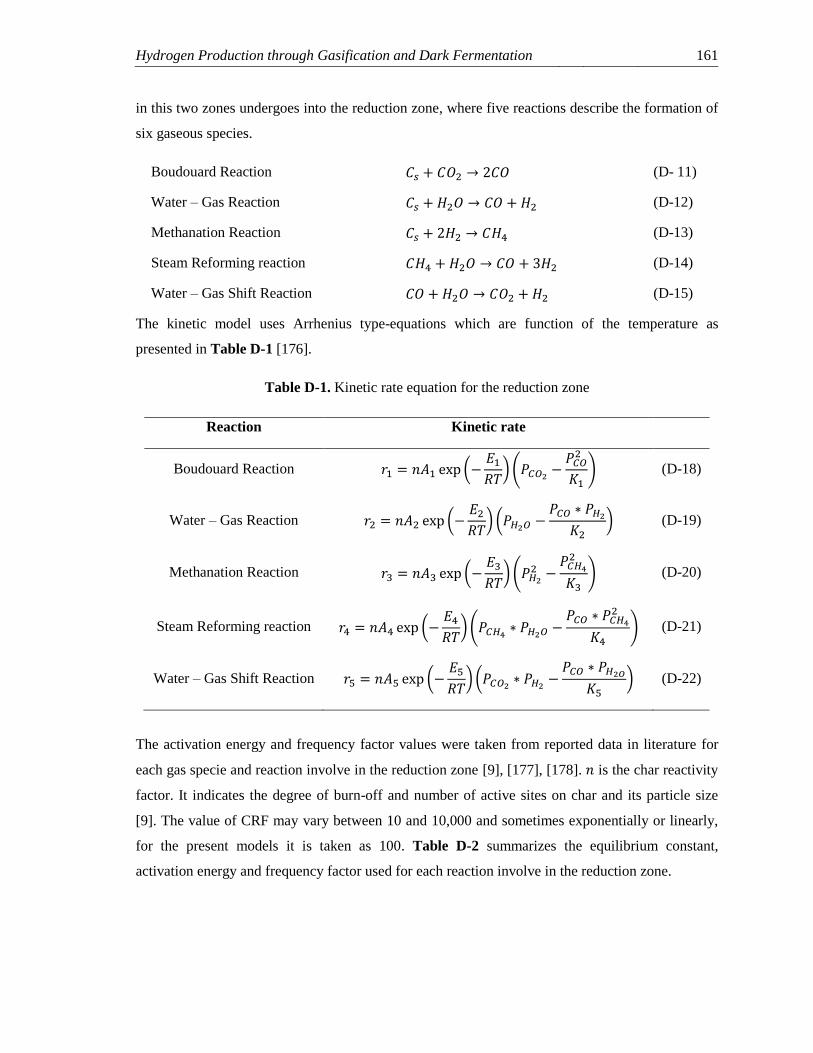


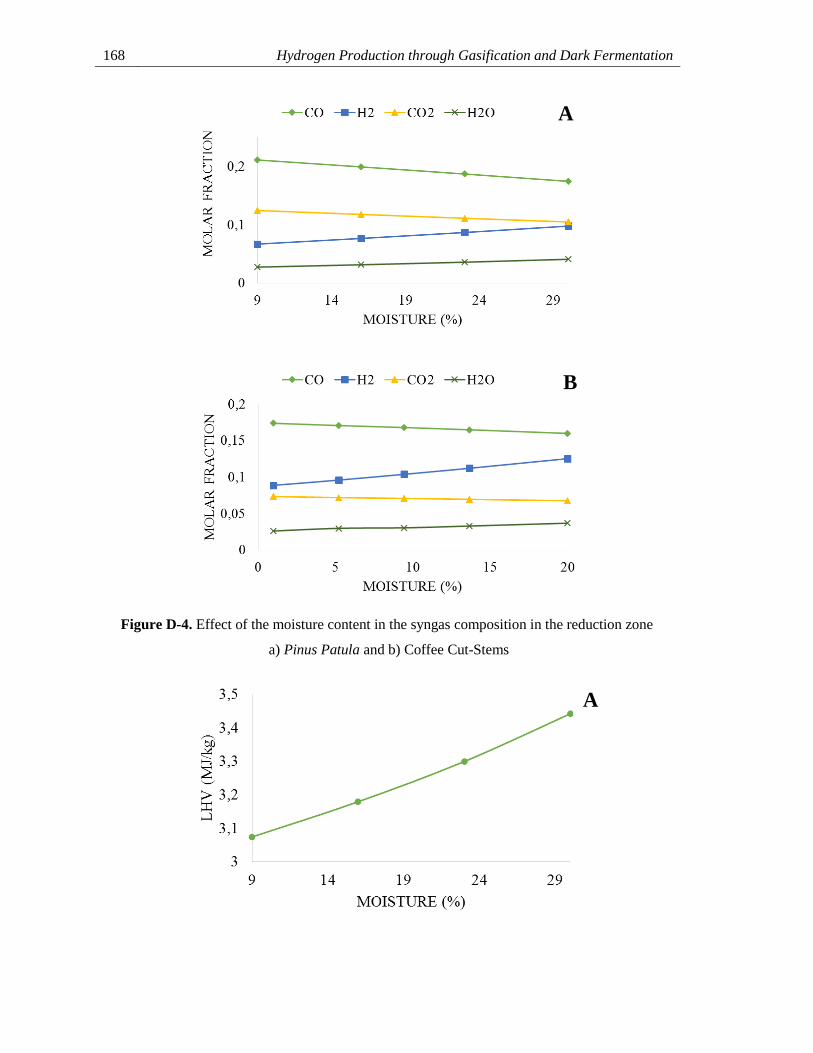

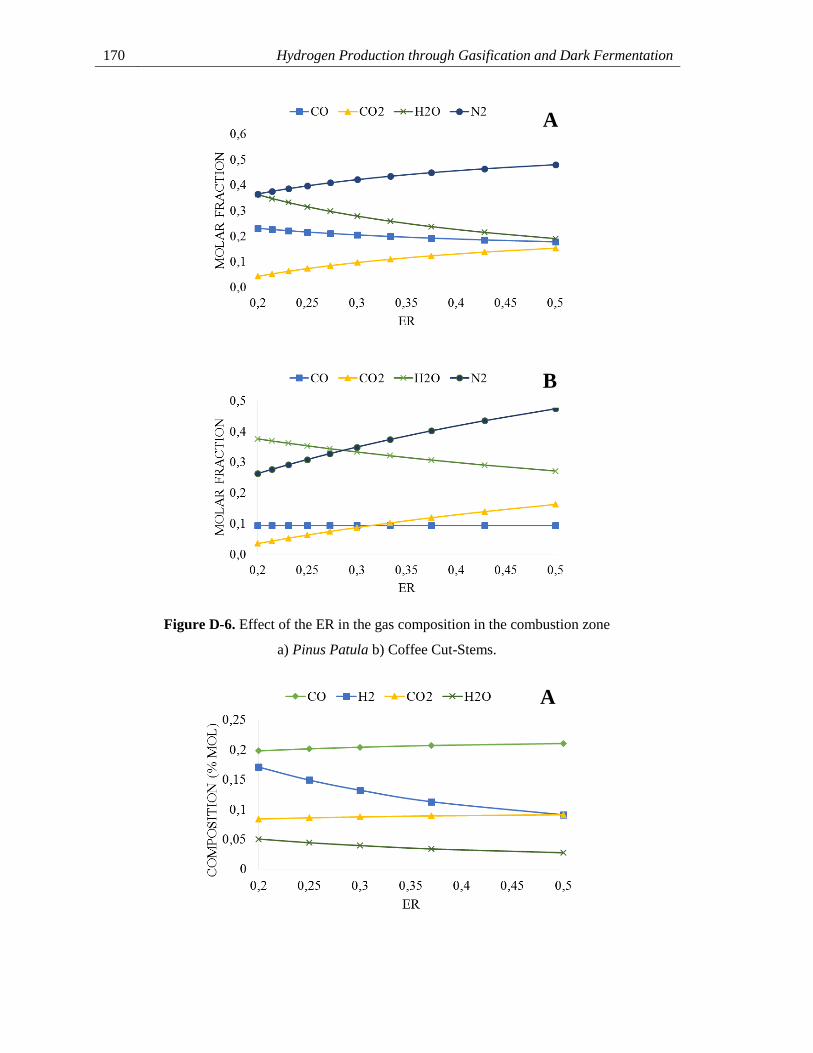
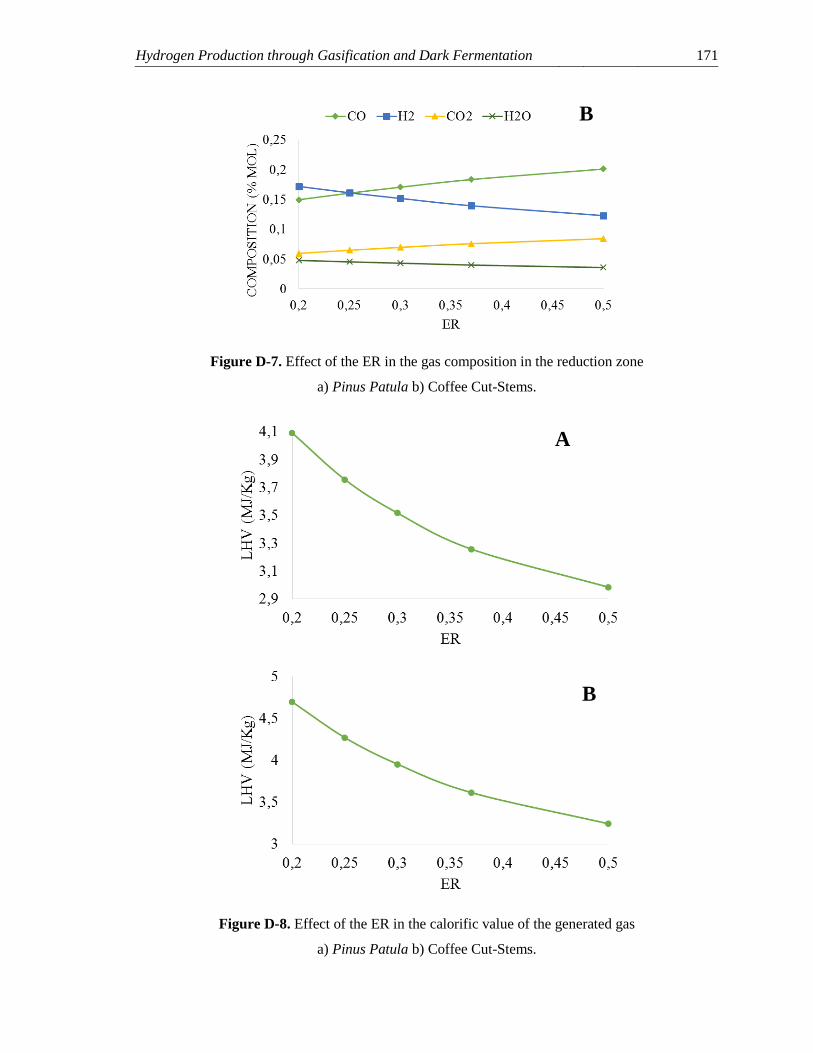
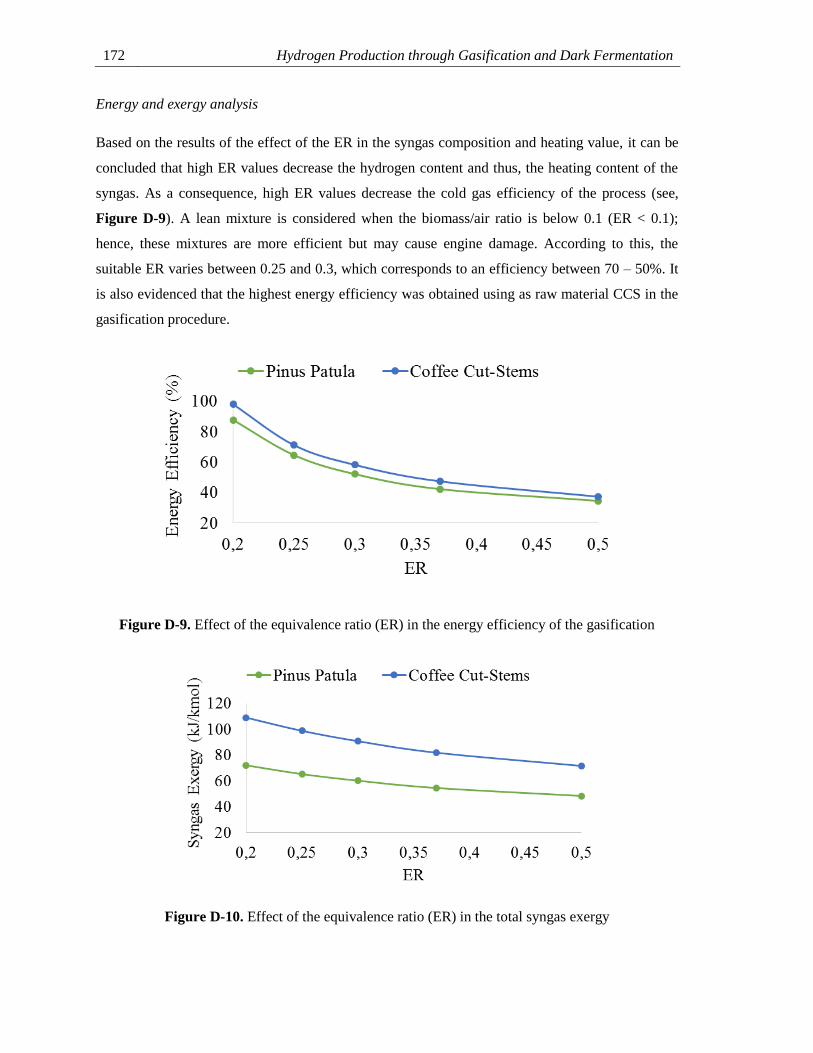


![BIOMASS GASIFICATION WITH CHP PRODUCTION A Review of … · BIOMASS GASIFICATION WITH CHP PRODUCTION ... oxygen production in photosynthesis) [2]. ... The paper presents researches](https://static.documents.pub/doc/80x56/5e82ae440702e43581596523/biomass-gasification-with-chp-production-a-review-of-biomass-gasification-with-chp.jpg)