Hydrogenation Mechanism of Carbon Dioxide and Carbon Monoxide
on the Ru(0001) Surface: A Density Function Theory Study
Shi-Tong Zhang, Hong Yan,* Min Wei,* David G. Evans, and Xue Duan
State Key Laboratory of Chemical Resource Engineering, Beijing University of Chemical
Technology, Beijing 100029, China
* Corresponding authors. Tel: +86-10-64412131; Fax: +86-10-64425385.
E-mail: [email protected] (Hong Yan); [email protected] (Min Wei).
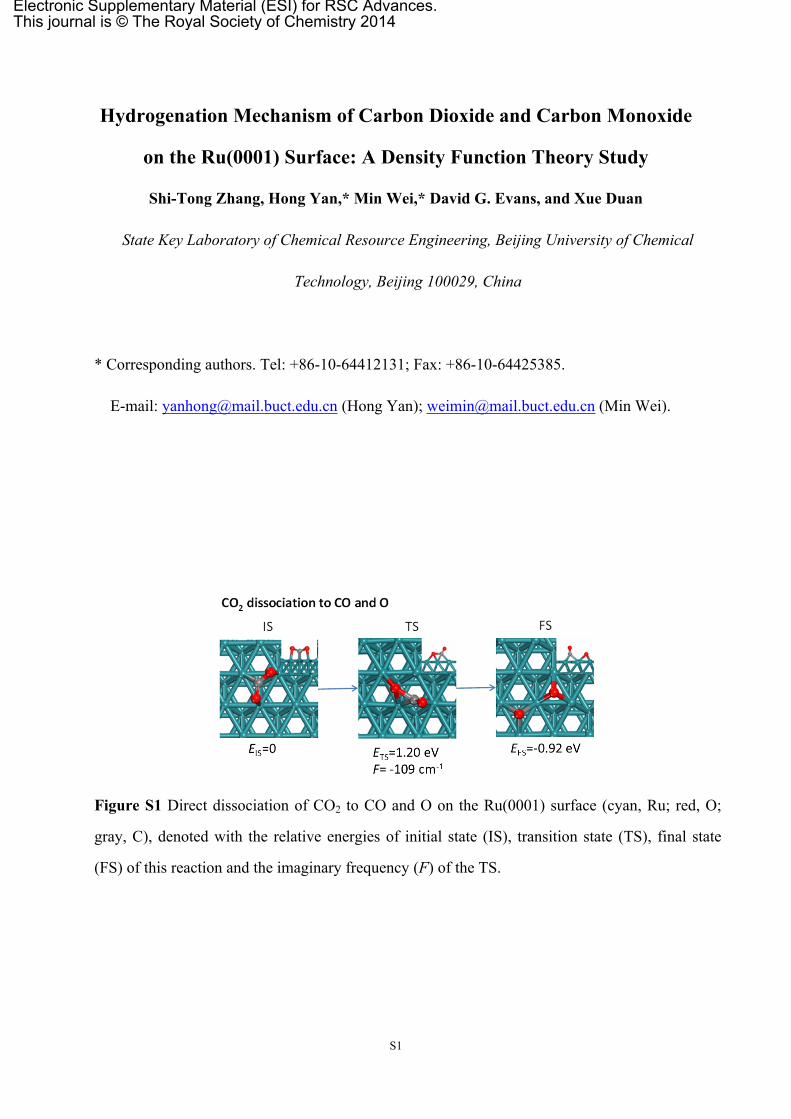
Figure S1 Direct dissociation of CO2 to CO and O on the Ru(0001) surface (cyan, Ru; red, O;
gray, C), denoted with the relative energies of initial state (IS), transition state (TS), final state
(FS) of this reaction and the imaginary frequency (F) of the TS.
S1
Electronic Supplementary Material (ESI) for RSC Advances.This journal is © The Royal Society of Chemistry 2014
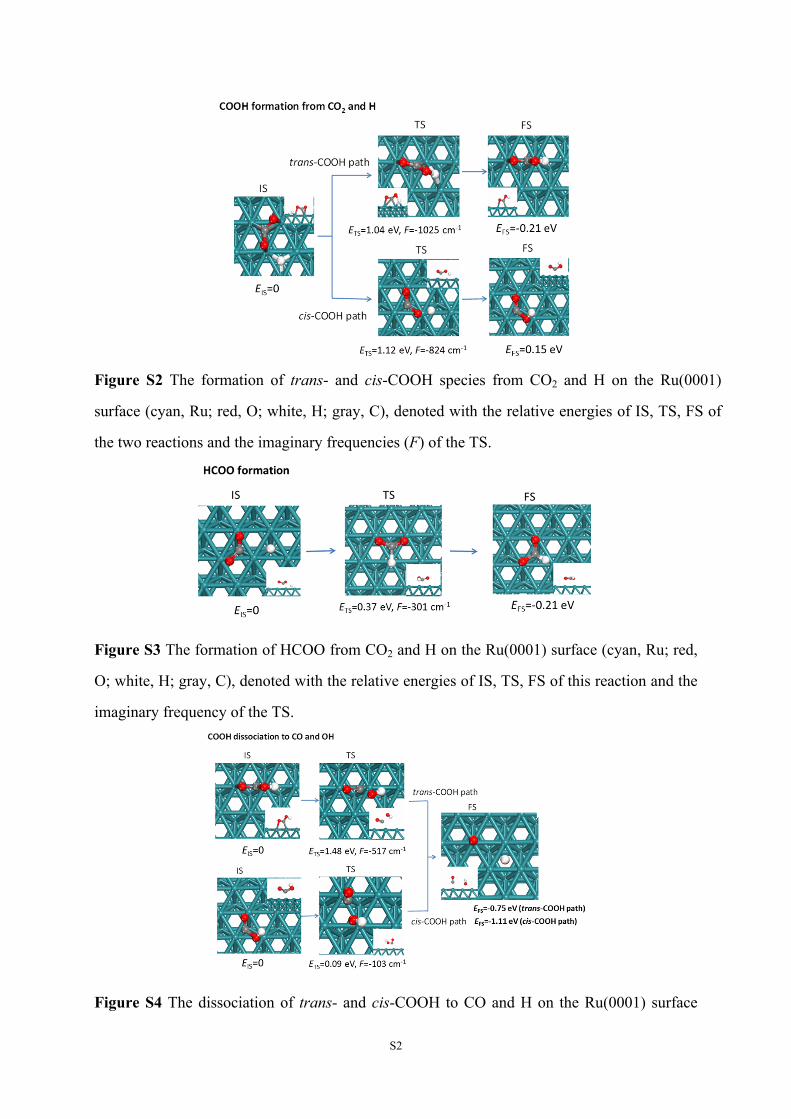
Figure S2 The formation of trans- and cis-COOH species from CO2 and H on the Ru(0001)
surface (cyan, Ru; red, O; white, H; gray, C), denoted with the relative energies of IS, TS, FS of
the two reactions and the imaginary frequencies (F) of the TS.
Figure S3 The formation of HCOO from CO2 and H on the Ru(0001) surface (cyan, Ru; red,
O; white, H; gray, C), denoted with the relative energies of IS, TS, FS of this reaction and the
imaginary frequency of the TS.
Figure S4 The dissociation of trans- and cis-COOH to CO and H on the Ru(0001) surface
S2
(cyan, Ru; red, O; white, H; gray, C), denoted with the relative energies of IS, TS, FS of the
two reactions and the imaginary frequencies of the TS.
Figure S5 The formation of HCOOH from CO and H on the Ru(0001) surface (cyan, Ru; red,
O; white, H; gray, C), denoted with the relative energies of IS, TS, FS of the two reactions
and the imaginary frequencies of the TS.
Figure S6 Direct dissociation of CO to C and O on the Ru(0001) surface (cyan, Ru; red, O;
gray, C), denoted with the relative energies of IS, TS, FS of this reaction and the imaginary
frequency of the TS.
S3
Figure S7 The formation of COH from CO and H on the Ru(0001) surface (cyan, Ru; red, O;
white, H; gray, C), denoted with the relative energies of IS, TS, FS of this reaction and the
imaginary frequency of the TS.
Figure S8 The formation of CHO from CO and H on the Ru(0001) surface (cyan, Ru; red, O;
white, H; gray, C), denoted with the relative energies of IS, TS, FS of this reaction and the
imaginary frequency of the TS.
Figure S9 The dissociation of COH to C and OH on the Ru(0001) surface (cyan, Ru; red, O;
white, H; gray, C), denoted with the relative energies of IS, TS, FS of this reaction and the
imaginary frequency of the TS.
S4
Figure S10 The dissociation of CHO to CH and O on the Ru(0001) surface (cyan, Ru; red, O;
white, H; gray, C), denoted with the relative energies of IS, TS, FS of this reaction and the
imaginary frequency of the TS.
Figure S11 The formation of CHOH from COH and H on the Ru(0001) surface (cyan, Ru;
red, O; white, H; gray, C), denoted with the relative energies of IS, TS, FS of this reaction and
the imaginary frequency of the TS.
Figure S12 The formation of CHOH from CHO and H on the Ru(0001) surface (cyan, Ru;
red, O; white, H; gray, C), denoted with the relative energies of IS, TS, FS of this reaction and
the imaginary frequency of the TS.
S5
Figure S13 The formation of CH2OH from CHOH and H on the Ru(0001) surface (cyan, Ru;
red, O; white, H; gray, C), denoted with the relative energies of IS, TS, FS of this reaction and
the imaginary frequency of the TS.
Figure S14 The formation of CH3OH from CH2OH and H on the Ru(0001) surface (cyan, Ru;
red, O; white, H; gray, C), denoted with the relative energies of IS, TS, FS of this reaction and
the imaginary frequency of the TS.
Figure S15 The TS of CH (a), CH2 (b), CH3 (c), and CH4 (d) formation (cyan, Ru; red, O;
white, H; gray, C), denoted with the relative energies and the imaginary frequency of the TS.
S6
Figure S16 CC coupling reactions on the Ru(0001) surface (cyan, Ru; red, O; white, H; gray,
C), denoted with the relative energies of IS, TS, FS of the eight reactions and the imaginary
frequencies of the TS.
The Theory for Kinetic Analysis: According to experimental observations, dissociatively
adsorbed H is in equilibrium with H2 in the gas phase:
H2(g)+2* 2H*
and
(1)2
*0H
2H/0
2
ppeK RTG 0
where K0 is the standard equilibrium constant; G0 is the standard difference of Gibbs free
S7
energy; p0 is the standard pressure, and θH and θ* are the coverages of adsorbed hydrogen and
free surfaces site, respectively.
According to our calculations, the H adsorption energy is about -0.80 e V with respect to
H2 in gas state. Therefore it can be estimated that the standard equilibrium constant K0 is
about 1 when T > 300K. The value of θH/θ* can be viewed as a function of the hydrogen
partial pressure. Assuming that the methane desorption is irreversible, the formation of
methane from C and H can be described as
(i)C*+H* CH*+*k1
k-1
(ii)CH*+H* CH2*+*k2
k-2
(iii)CH2*+H* CH3*+*k3
k-3
(iv)CH3*+H* CH4(g)+*k4
At steady state, we can obtain
(2)4332211 rrrrrrrr net
(3)H1
iCHii kr
and
(4)*iCHii kr
where ri (r-i) is the forward (reverse) reaction rate of each hydrogenation step; rnet is the net
reaction rate; ki (k-i) is the forward (reverse) reaction rate constant, and is the coverage of iCH
surface species CHi (i=0, 1, 2, 3). The formation of CH4 from CH3 and H (step iv) requires the
highest barrier in the sequence hydrogenation of C steps. Combining Eqs. (2)(4), we can
obtain
(5)43 rr
S8
and thus
(6)net3 rrr 3
Similarly, we have
(7)netrrr 22
and
(8)net1 rrr 1
Eqs. (6)(8) suggest that the hydrogenation reactions are in quasi-equilibrium state on the
Ru(0001) surface. As a result, the coverages of C, CH, CH2 and CH3 on the surface have the
following relationship:
(9))/(
HC
*CH RTEi
iii e
and therefore,
(10)3 2, 1,,)/(
*
HC
)/(CH itee i
CRTE
i
iRTE ii
i
where θ* is the coverage of free surface site; t represents θH/θ*; Ei is the relative stability of
CHi with reference to the C atom and equal to the energy difference between adsorbed CHi
and C. It should be noted that the ratio of H to free surface site coverage, t, is related to the H2
partial pressure: (K0 is the standard equilibrium constant for H2 dissociation 00 ppKt2H
on Ru surface; p0 is the standard pressure; is the H2 partial pressure). If varies in the 2Hp
2Hp
range 1100 atm, the value of t can be estimated between 1 and 10. Assuming that does 2Hp
not change significantly during the reaction, t can be expected to be a constant.
For the CC coupling reactions, the reaction rates can be expressed as
(11)yii kr CHCH x
S9
The reaction rates of C−C coupling reactions can be calculated using transition-state theory,
which are expressed as
(12)311 jieAr
ji
ia
ji
RTE ,,CHCH)/(
CHCH,
and the net reaction rate of the sequence carbon hydrogenation reactions is
(13)313
3
24 ieArrrr RTE
iia ,HCH
)/(net
,
where A1 and A2 are the pre-exponential factors (which are usually assumed to be 1013 s1);1
Ea,i is the energy barrier; T is the temperature.
References:
(1) J. Chen and Z. P. Liu, J. Am. Chem. Soc., 2007, 130, 7929.
S10