Prepared in cooperation with the Municipio Autónomo de Ponce and the Puerto Rico Department of Natural and Environmental Resources Hydrogeology and Hydrology of the Punta Cabullones Wetland Area, Ponce, Southern Puerto Rico, 2007– 08 Scientific Investigations Report 2014 – 5102 U.S. Department of the Interior U.S. Geological Survey
Transcript
Prepared in cooperation with the Municipio Autónomo de Ponce and the Puerto Rico Department of Natural and Environmental Resources
Hydrogeology and Hydrology of the Punta Cabullones Wetland Area, Ponce, Southern Puerto Rico, 2007– 08
Scientific Investigations Report 2014 – 5102
U.S. Department of the InteriorU.S. Geological Survey
Cover photograph. One of the channels in the Cabullones study area showing a USGS surface-water and quality station. Healthy mangrove is observed along the margins of the channel. (By Jesús Rodríguez-Martínez, December 18, 2007.)
Hydrogeology and Hydrology of the Punta Cabullones Wetland Area, Ponce, Southern Puerto Rico, 2007– 08
By Jesús Rodríguez-Martínez and Luis R. Soler-López
Prepared in cooperation with the Municipio Autónomo de Ponce and the Puerto Rico Department of Natural and Environmental Resources
Scientific Investigations Report 2014 – 5102
U.S. Department of the InteriorU.S. Geological Survey
U.S. Department of the InteriorSALLY JEWELL, Secretary
U.S. Geological SurveySuzette M. Kimball, Acting Director
U.S. Geological Survey, Reston, Virginia: 2014
For more information on the USGS—the Federal source for science about the Earth, its natural and living resources, natural hazards, and the environment—visit http://www.usgs.gov or call 1–888–ASK–USGS.
For an overview of USGS information products, including maps, imagery, and publications, visit http://www.usgs.gov/pubprod
To order this and other USGS information products, visit http://store.usgs.gov
Any use of trade, firm, or product names is for descriptive purposes only and does not imply endorsement by the U.S. Government.
Although this information product, for the most part, is in the public domain, it also may contain copyrighted materials as noted in the text. Permission to reproduce copyrighted items must be secured from the copyright owner.
Suggested citation:Rodríguez-Martínez, Jesús, and Soler-López, Luis, 2014, Hydrogeology and hydrology of the Punta Cabullones wetland area, Ponce, southern Puerto Rico, 2007– 08: U.S. Geological Survey Scientific Investigations Report 2014– 5102, 58 p., http://dx.doi.org/10.3133/sir20145102.
Purpose and Scope ..............................................................................................................................2Previous Investigations........................................................................................................................5
Description of the Study Area .....................................................................................................................5Methods of Study ...........................................................................................................................................8
Drilling and Installation of Piezometers, Well Points, and Shallow Auger Test Holes ..............9Installation of Surface-Water Stations ..........................................................................................10Collection of Meteorological Data ...................................................................................................10Estimation of Hydraulic Conductivity ...............................................................................................10Estimation of Evapotranspiration Rates .........................................................................................11
Study Area Climate ......................................................................................................................................12Surface Water .............................................................................................................................................15
Water Temperature ...................................................................................................................16pH..................................................................................................................................................20Dissolved Oxygen.......................................................................................................................20Specific Conductance and Salinity .........................................................................................20
Groundwater Quality ..........................................................................................................................23Stable Isotopic Composition .............................................................................................................29Groundwater Occurrence ................................................................................................................33Groundwater Movement ...................................................................................................................34Changes in Sea Stage and Barometric Pressure ..........................................................................34Variations in Groundwater Density: Conversion of Saline-Water Heads
Into Equivalent Freshwater Heads .....................................................................................39Hydraulic Conductivity .......................................................................................................................46
Groundwater/Surface-Water Relations ...................................................................................................47Origin of Salinity in Water ..........................................................................................................................47Evapotranspiration Estimates ....................................................................................................................48Water Budget ...............................................................................................................................................50Summary and Conclusions .........................................................................................................................51References ....................................................................................................................................................53Appendix 1.....................................................................................................................................................55Appendix 2.....................................................................................................................................................57
iv
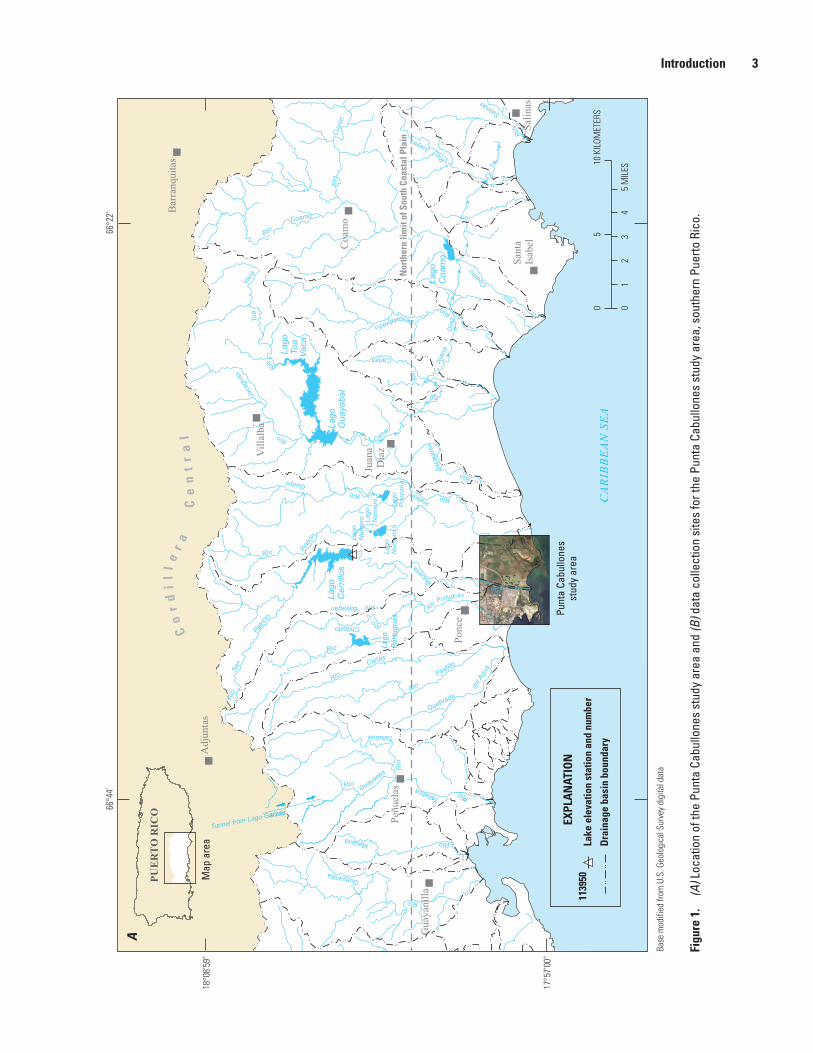
Figures 1. Maps showing location of the Punta Cabullones study area and data collection
sites for the Punta Cabullones study area, southern Puerto Rico ........................................3 2. Orthophoto showing defined subareas within the Punta Cabullones study area
and the main land-cover types within the wetland subarea used for evapotranspiration estimates .....................................................................................................6
3. Map showing generalized surface geology of the Punta Cabullones study area as defined by Glover and others ................................................................................................7
4. Graph showing monthly rainfall and corresponding percentage of total rainfall during 2008 in the Punta Cabullones area, southern Puerto Rico ......................................12
5. Boxplot showing monthly statistics of air temperature in the Punta Cabullones study area during 2008 as measured at station 50113610, southern Puerto Rico ...........13
6. Boxplots showing wind magnitude and direction during 2008 at station 50113610, southern Puerto Rico .................................................................................................................13
7. Boxplot showing monthly distribution of hourly solar radiation during 2008 as measured at station 50113610, southern Puerto Rico .....................................................14
8. Boxplot showing monthly distribution of barometric pressure during 2008 as measured at station 50113610, southern Puerto Rico .....................................................14
9. Graphs showing variation of daily mean water stage at station 50113615 and station 50113625 during 2008 .....................................................................................................15
10. Graph showing variation of daily mean water stage at stations 50113625 and 50113615 and the daily mean tidal fluctuation at station 50114730 during 2008 ...............16
11. Graphs showing selected partial records during 2008 of tidal stage at Ponce Harbor (station 50114730), daily mean water stage at station 50113615, and water stage at station 50113615, southern Puerto Rico ..............................................................................17
12. Graph showing temporal variation in hourly and discrete water-temperature measurements at station 50113615 and in hourly air temperatures at station 50113610, January 2008–March 2009, southern Puerto Rico .................................19
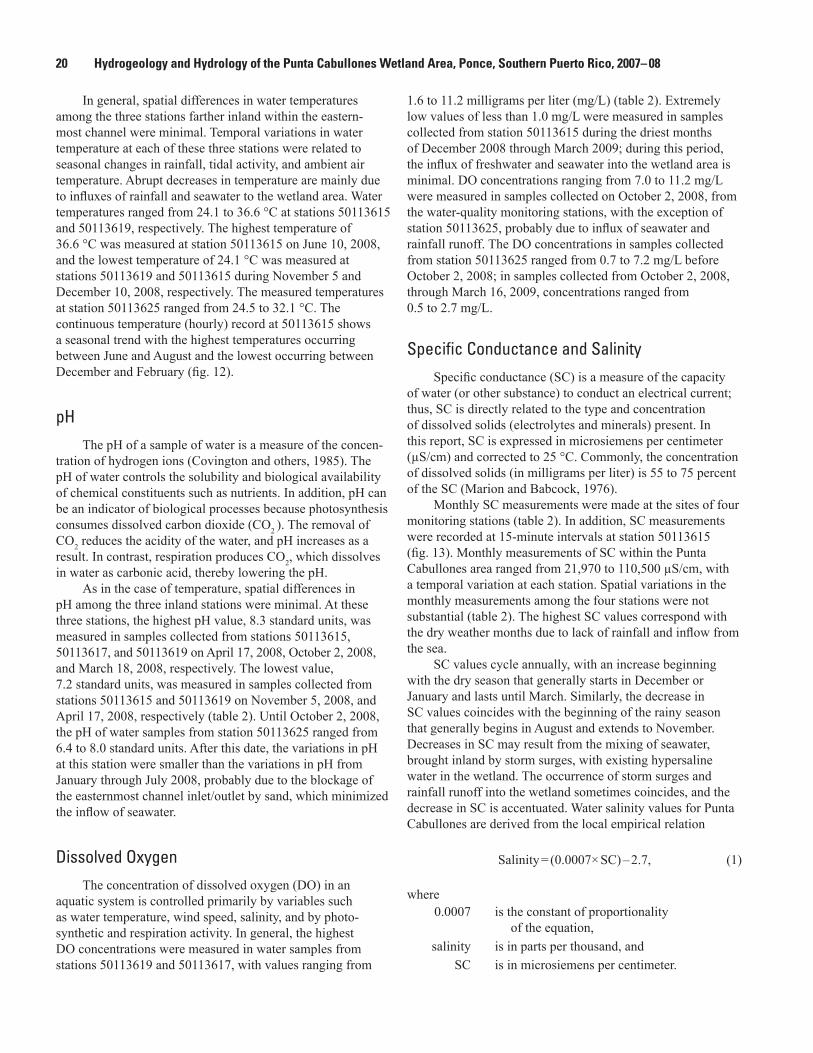
13. Graph showing temporal variation of specific conductance as measured at station 50113615, November 2007–May 2008, southern Puerto Rico .............................21
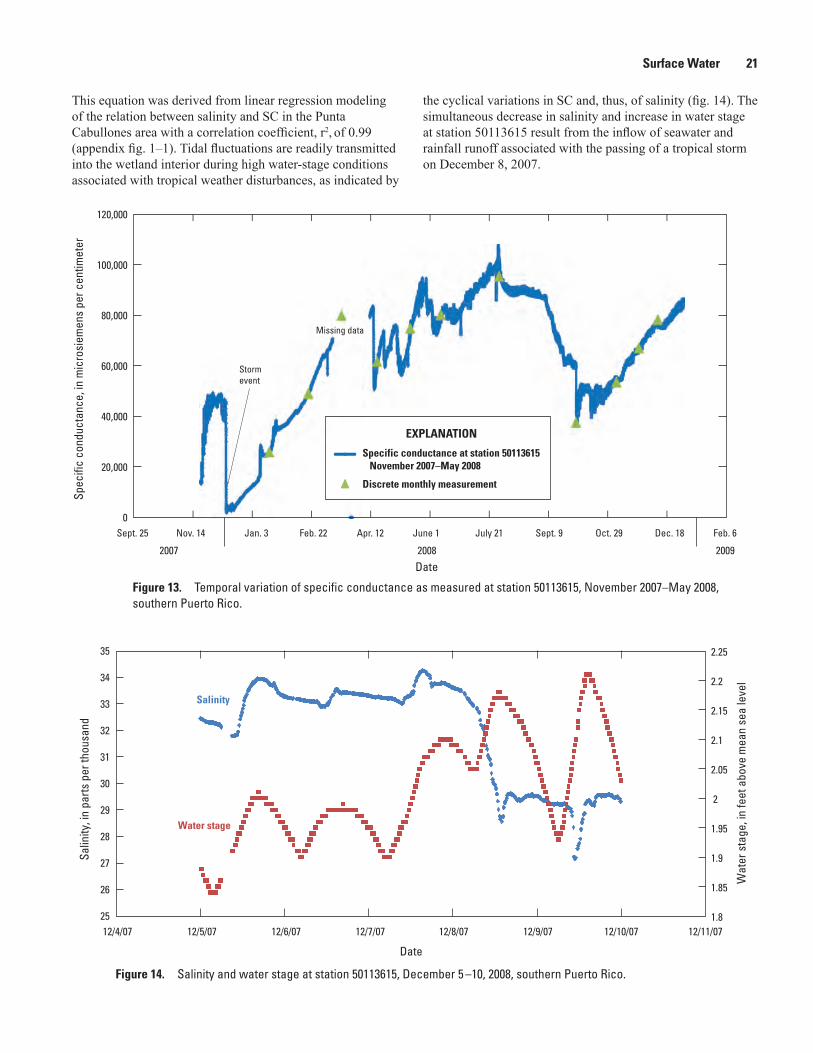
14. Graph showing salinity and water stage at station 50113615, December 5 –10, 2008, southern Puerto Rico .........................................................................21
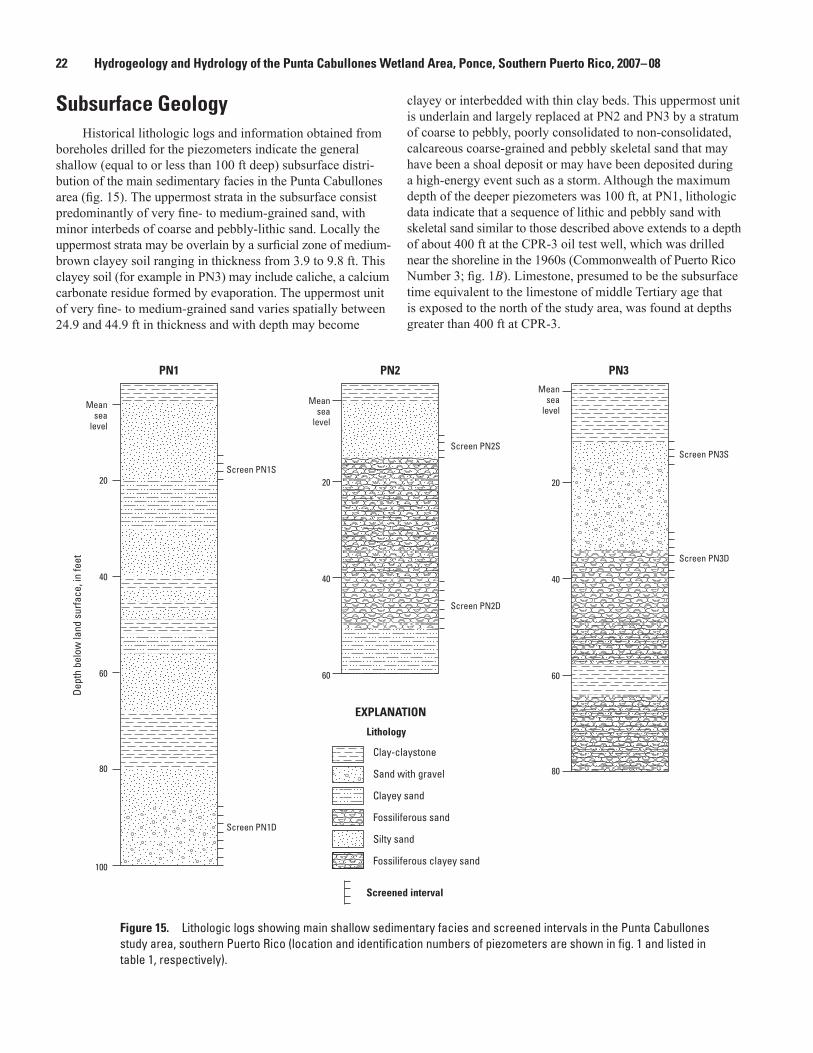
15. Lithologic logs showing main shallow sedimentary facies and screened intervals in the Punta Cabullones study area, southern Puerto Rico ................................22
16. Orthophotos showing spatial distribution of groundwater salinity in the Punta Cabullones wetland subarea at a depth of 20 feet below land surface and depths between 20 and 100 feet below land surface, March 26 –28, 2008, southern Puerto Rico ..............................................................................24
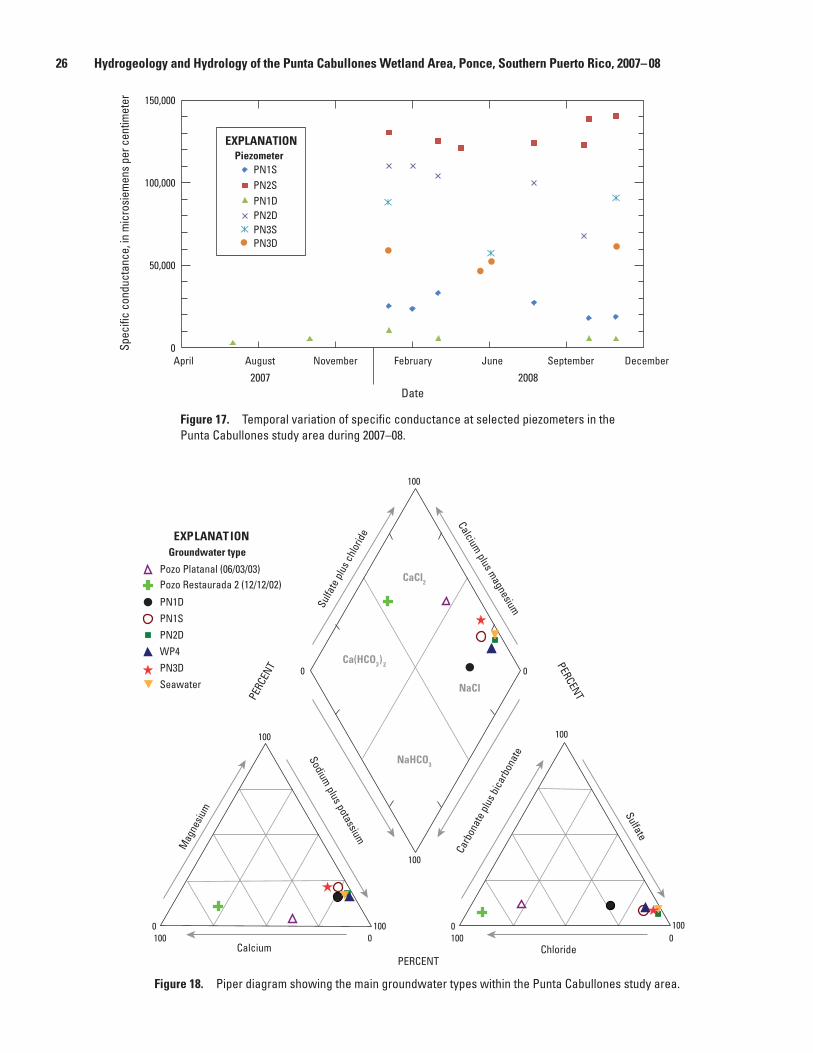
17. Graph showing temporal variation of specific conductance at selected piezometers in the Punta Cabullones study area during 2007–08 ......................................26
18. Piper diagram showing the main groundwater types within the Punta Cabullones study area ....................................................................................................26
19. Graphs showing air temperature measured at station 50113610 and groundwater temperatures and groundwater levels at PN1S and PN1D and at PN2S and PN2D, and groundwater temperature at PN1S and PN1D, southern Puerto Rico .......................28
20. Graph showing deuterium and oxygen-18 concentrations in the groundwater, surface water, and rainfall within the Punta Cabullones study area, southern Puerto Rico .................................................................................................................30
v
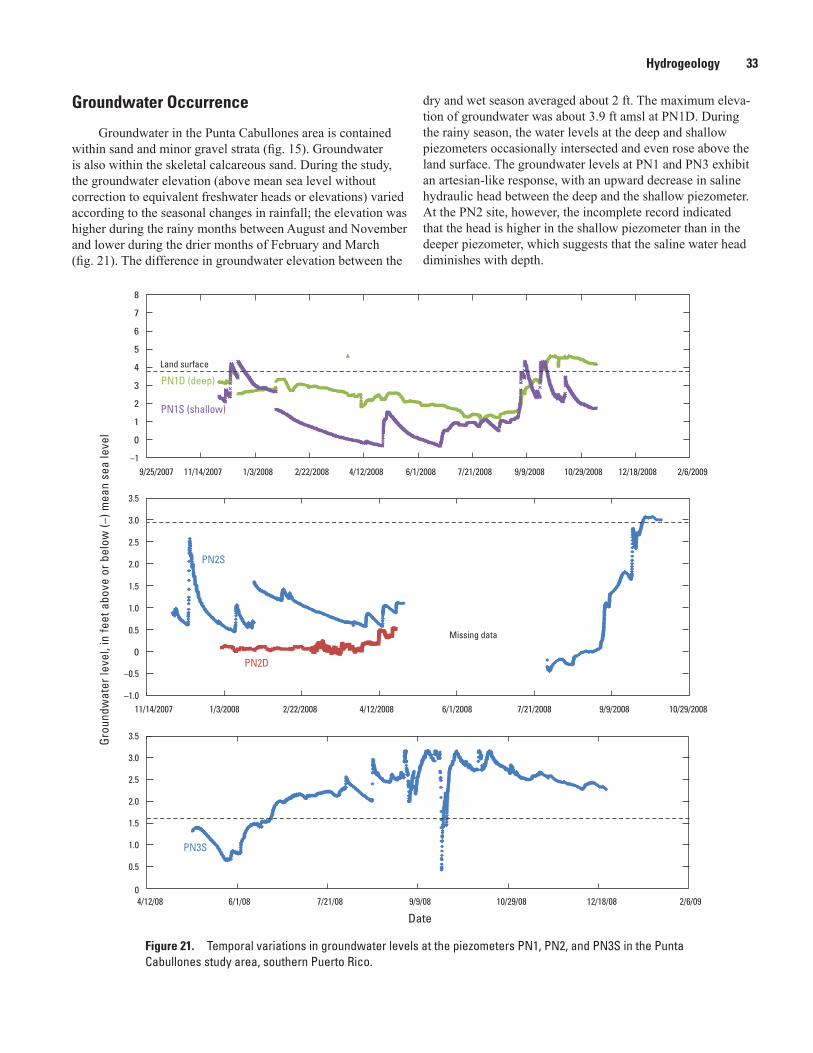
21. Graphs showing temporal variations in groundwater levels at the piezometers PN1, PN2, and PN3S in the Punta Cabullones study area, southern Puerto Rico ...........33
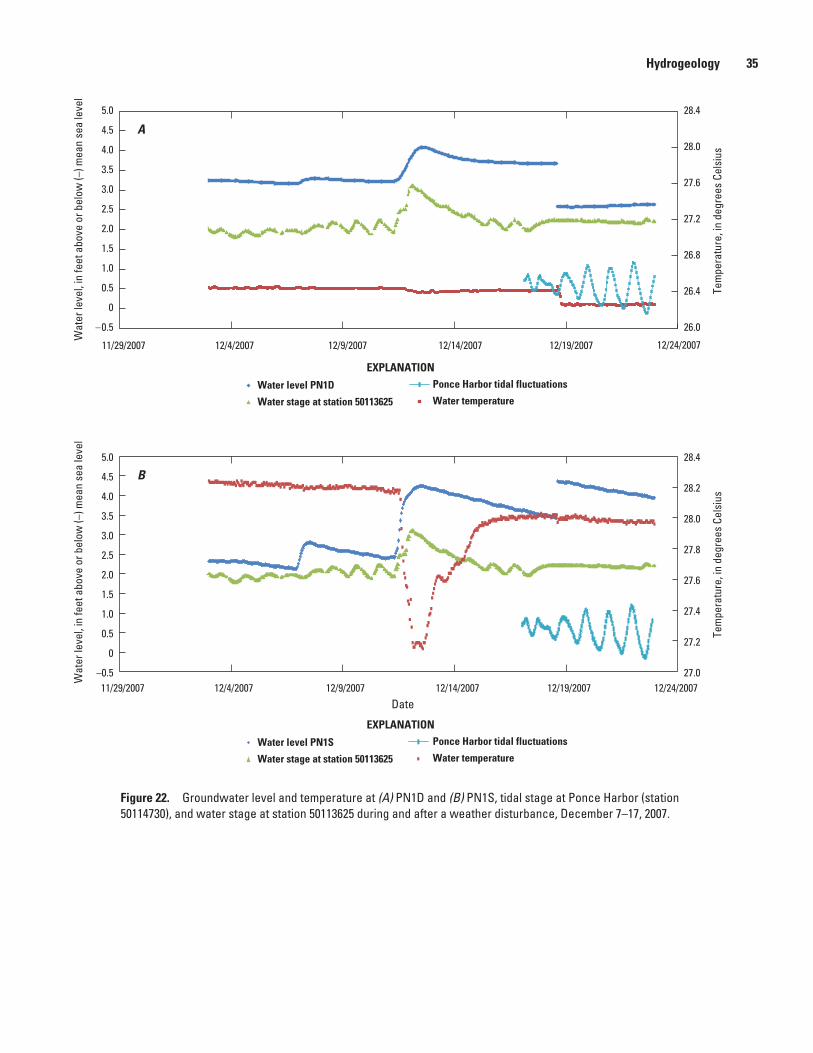
22. Graphs showing groundwater level and temperature at PN1D and PN1S, tidal stage at Ponce Harbor (station 50114730), and water stage at station 50113625 during and after a weather disturbance, December 7–17, 2007 .........................................35
23. Graphs showing relation of the groundwater level and temperature at PN2S, tidal stage at Ponce Harbor (station 50114730), and water stage at station 50113615 during a time period that included a weather disturbance on December 10, 2007, during dry and fair weather prior to a weather disturbance on September 21, 2008, and during dry weather in January 2008 ......................................36
24. Graph showing groundwater levels and water temperature at PN3S, tidal stage at Ponce Harbor (station 50114730), and water stage at station 50113615 during a period that included a rainfall event on June 2, 2008 ...........................................................37
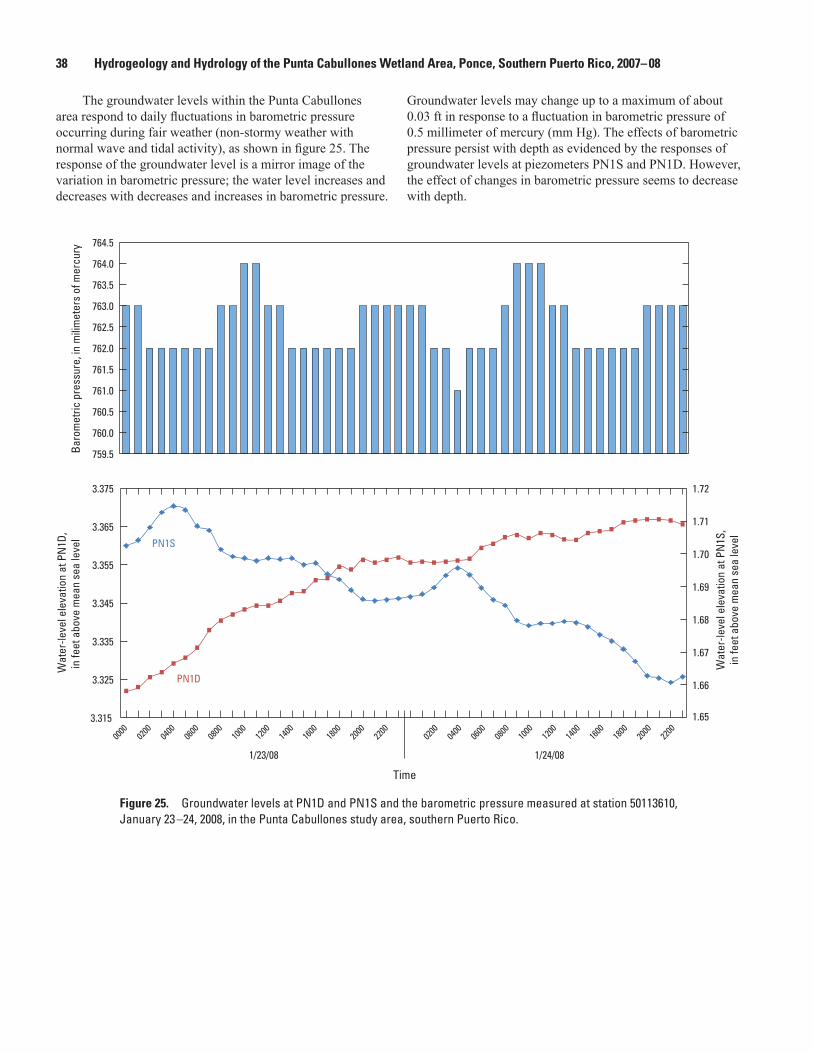
25. Graphs showing groundwater levels at PN1D and PN1S and the barometric pressure measured at station 50113610, January 23 –24, 2008, in the Punta Cabullones study area, southern Puerto Rico .......................................................................38
26. Graph showing specific conductance and water density in the Punta Cabullones study area, southern Puerto Rico ............................................................39
27. Graphs showing temporal and spatial variation of groundwater density in the Punta Cabullones study area, southern Puerto Rico .....................................................40
28. Orthophotos showing potentiometric surface of the Punta Cabullones wetland subarea in equivalent freshwater heads during the wet season corresponding to a depth less than 20 feet below land surface and greater than 20 feet below land surface, and during the dry season corresponding to a depth less than 20 feet below land surface and greater than 20 feet below land surface ........................41
29. Graph showing salinity, deuterium concentration, and age since recharge of groundwater samples collected during March 26 –27, 2008, at selected wells within the Punta Cabullones study area, southern Puerto Rico ...............................45
30. Block diagram showing proposed convective-cell-type groundwater flow in the Punta Cabullones area, southern Puerto Rico ............................................................45
31. Graphs showing chloride and sulfate concentrations, the chloride/bromide ratio as a function of chloride concentration, and delta deuterium and salinity from selected surface-water and groundwater sites in the Punta Cabullones study area, southern Puerto Rico ............................................................................................47
32. Graph showing daily variation in the potential evaporation, estimated by using two variants of the Penman semi-empirical equation, for the fan-delta and coastal alluvial plain subareas of the Punta Cabullones study area, southern Puerto Rico .................................................................................................................48
1–1. Graph showing specific conductance and salinity for surface water and groundwater in the Punta Cabullones study area. ................................................................55
1–2. Graph showing specific conductance and density for groundwater and surface water in Punta Cabullones used to estimate equivalent freshwater heads .....................55
2–1. Graph showing grain-size distribution with depth in auger hole #1 in the Punta Cabullones study area ....................................................................................................56
2– 2. Graph showing grain-size distribution with depth in auger holes #3 and #6 in the Punta Cabullones study area .........................................................................................57
2– 3. Graph showing grain-size distribution with depth in auger holes #7 and #8 in the Punta Cabullones study area .........................................................................................58
quality stations, and water-stage stations used in the Punta Cabullones study, 2007– 08 ...........................................................................................................................................9
2. Selected surface-water-quality parameters measured at the Cabullones wetland between January 2008 and March 2009 .................................................................................18
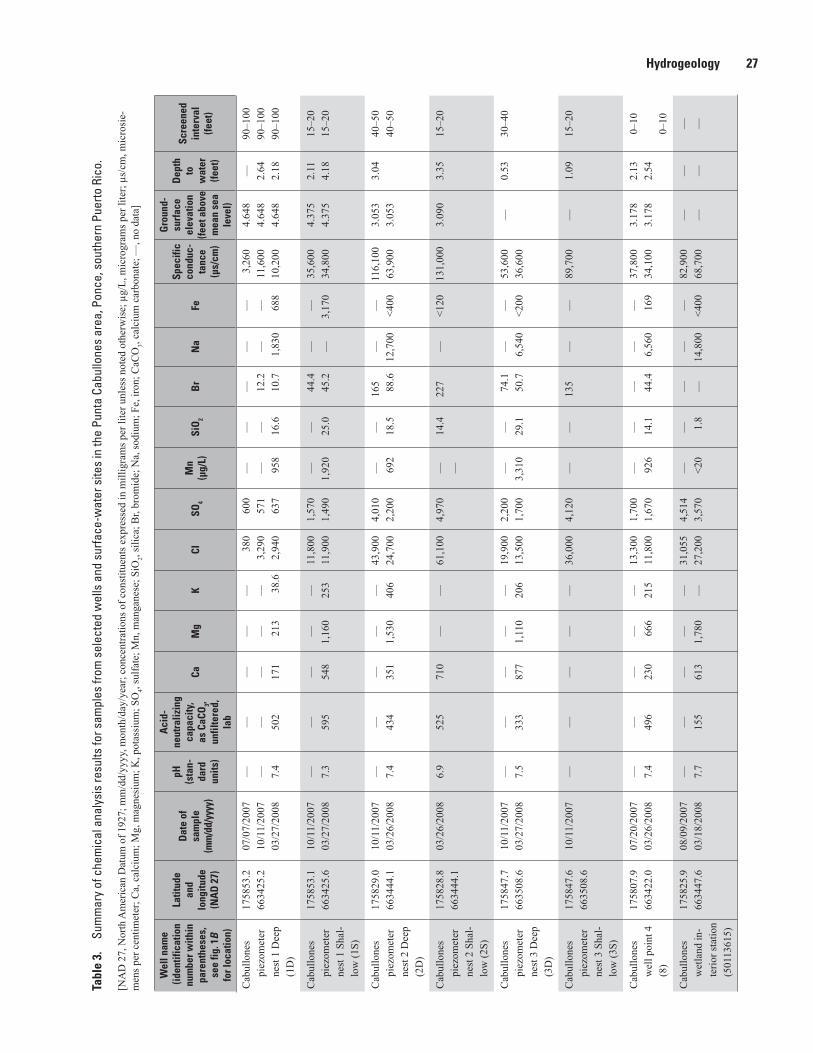
3. Summary of chemical analysis results for samples from selected wells and surface-water sites in the Punta Cabullones area, Ponce, southern Puerto Rico ..........27
4. Delta oxygen-18 and delta deuterium concentrations in samples from selected wells and surface-water sites, and in monthly rainfall composites from the Bucaná meteorological station, Punta Cabullones study area, 2007–08 ..........................31
5. Selected physical characteristics of groundwater used to determine the specific conductance and density relation for the Punta Cabullones study area, 2007–08 .........................................................................................................................................39
6. Average horizontal hydraulic conductivity values at selected boreholes in the Punta Cabullones study area computed using the Alyamani and Sen Method ...............46
7. Estimated annual evapotranspiration values within the Punta Cabullones wetland subarea based on land-cover types ........................................................................49
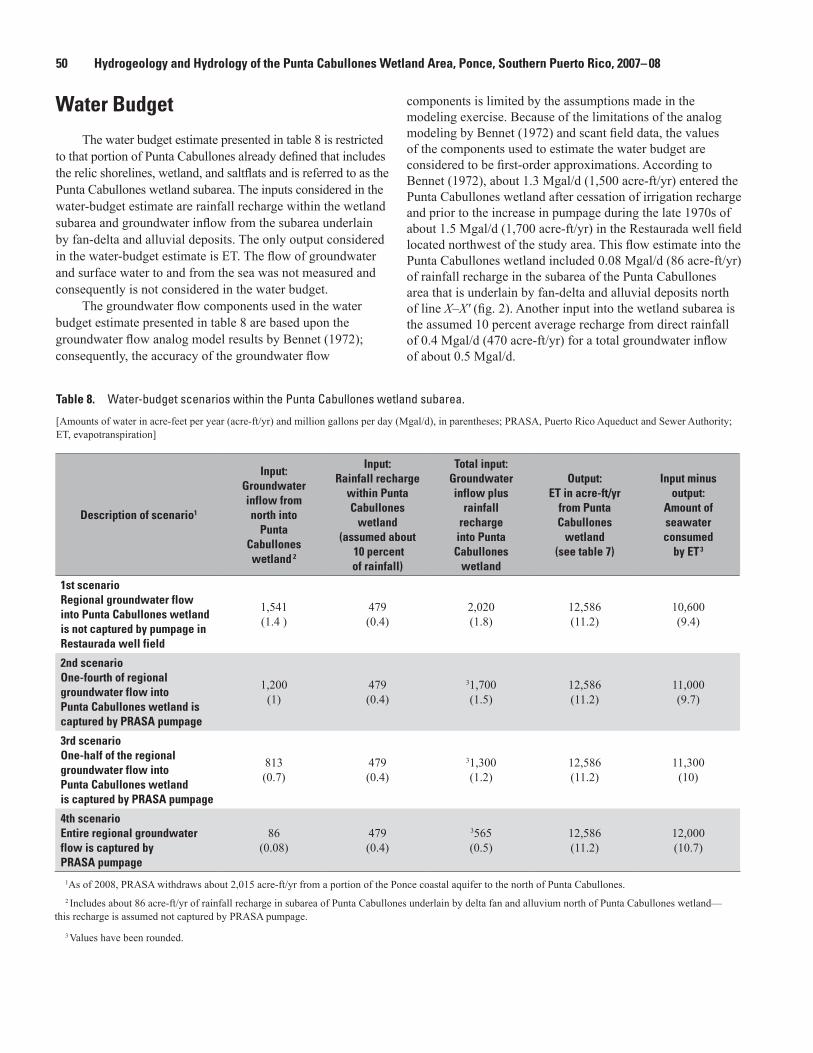
8. Water-budget scenarios within the Punta Cabullones wetland subarea .........................50
vii
Conversion Factors and Datums
SI to Inch/Pound
Multiply By To obtain
Length
centimeter (cm) 0.3937 inch millimeter (mm) 0.03937 inch meter (m) 3.281 foot (ft) kilometer (km) 0.6214 mile (mi)kilometer (km) 0.5400 mile, nautical (nmi) meter (m) 1.094 yard (yd)
Area
square meter (m2) 0.0002471 acre square kilometer (km2) 247.1 acresquare meter (m2) 10.76 square foot (ft2)
Volume
cubic meter (m3) 6.290 barrel (petroleum, 1 barrel = 42 gal)cubic meter (m3) 264.2 gallon (gal) cubic meter (m3) 0.0002642 million gallons (Mgal) cubic meter (m3) 35.31 cubic foot (ft3)cubic meter (m3) 1.308 cubic yard (yd3) cubic meter (m3) 0.0008107 acre-foot (acre-ft)
Flow rate
cubic meter per second (m3/s) 70.07 acre-foot per day (acre-ft/d) cubic meter per year (m3/yr) 0.000811 acre-foot per year (acre-ft/yr) meter per day (m/d) 3.281 foot per day (ft/d)meter per year (m/yr) 3.281 foot per year ft/yr) cubic meter per second (m3/s) 22.83 million gallons per day (Mgal/d) kilometer per hour (km/h) 0.6214 mile per hour (mi/h)
Density
gram per cubic centimeter (g/cm3) 62.4220 pound per cubic foot (lb/ft3) Hydraulic conductivity
meter per day (m/d) 3.281 foot per day (ft/d)
viii
Inch/Pound to SI
Multiply By To obtain
Length
inch 2.54 centimeter (cm)inch 25.4 millimeter (mm)foot (ft) 0.3048 meter (m)foot (ft)mile (mi)
121.609
inchkilometer (km)
Area
acre 4,047 square meter (m2)acre 0.4047 hectare (ha)acre 0.4047 square hectometer (hm2) square mile (mi2) 2.590 square kilometer (km2)
acre-foot per year (acre-ft/yr) 1,233 cubic meter per year (m3/yr)foot per day (ft/d) 0.3048 meter per day (m/d)foot per year (ft/yr) 0.3048 meter per year (m/yr)cubic foot per second (ft3/s) 0.02832 cubic meter per second (m3/s)cubic foot per day (ft3/d) 0.02832 cubic meter per day (m3/d)million gallons per day (Mgal/d) 0.04381 cubic meter per second (m3/s)inch per year (in/yr) 25.4 millimeter per year (mm/yr)
Specific capacity
gallon per minute per foot [(gal/min)/ft)]
0.2070 liter per second per meter [(L/s)/m]
Hydraulic conductivity
foot per day (ft/d) 0.3048 meter per day (m/d)
Vertical coordinate information is referenced to local mean sea level.
Horizontal coordinate information is referenced to the North American Datum of 1927 (NAD 27).
Elevation, as used in this report, refers to the distance above the vertical datum.
Temperature in degrees Celsius (°C) may be converted to degrees Fahrenheit (°F) as follows:
°F = 1.8 × °C + 32
Specific conductance is given in microsiemens per centimeter at 25 degrees Celsius (µS/cm at 25 °C)
Concentrations of chemical constituents in water are given either in milligrams per liter (mg/L) or micrograms per liter (µg/L)
ix
Abbreviations2H deuterium18O oxygen-18
amsl above mean sea level
bp barometric pressure
CFCs chlorofluorocarbons
CO2 carbon dioxide
EFH equivalent freshwater head
ET evapotranspiration
GMWL global meteoric water line
K hydraulic conductivity
PRASA Puerto Rico Aqueduct and Sewer Authority
PRDNER Puerto Rico Department of Natural and Environmental Resources
SC specific conductance
USBR U.S. Bureau of Reclamation
USGS U.S. Geological Survey
VSMOW Vienna standard mean oceanic water
Acknowledgments
The authors acknowledge the assistance provided by functionaries of the Municipal Government of Ponce, in particular Mr. José Valenzuela, in facilitating the access to the study area.
The authors also acknowledge the assistance provided by Sigfredo Torres-González of the U.S. Geological Survey Caribbean Water Science Center in helping estimate the evapotranspiration rates in the Punta Cabullones study area.
Hydrogeology and Hydrology of the Punta Cabullones Wetland Area, Ponce, Southern Puerto Rico, 2007– 08
By Jesús Rodríguez-Martínez and Luis R. Soler-López
AbstractThe U.S. Geological Survey, in cooperation with
the Municipio Autónomo de Ponce and the Puerto Rico Department of Natural and Environmental Resources, conducted a study of the hydrogeology and hydrology of the Punta Cabullones area in Ponce, southern Puerto Rico. (Punta Cabullones is also referred to as Punta Cabullón.) The Punta Cabullones area is about 9 square miles and is an ecological system made up of a wetland, tidal flats, saltflats, mangrove forests, and a small fringing reef located a short distance offshore. The swales or depressions between successive beach ridges became development avenues for saline to hypersaline wetlands. The Punta Cabullones area was designated by the U.S. Fish and Wildlife Service as a coastal barrier in the 1980s because of its capacity to act as a buffer zone to ameliorate the impacts of natural phenomenon such as storm surges. Since 2003, Punta Cabullones has been set aside for preservation as part of the mitigation effort mandated by Federal and State laws to compensate for the potential environmental effects that might be caused by the construction of the Las Américas Transshipment Port.
Total rainfall measured during 2008 within the Punta Cabullones area was 36 inches, which is slightly greater than the long-term annual average of 32 inches for the coastal plain near Ponce. Two evapotranspiration estimates, 29 and 37 inches, were obtained for the subarea of the Punta Cabullones area that is underlain by fan-delta and alluvial deposits by using two variants of the Penman semi-empirical equation.
The long-term water stage and chemical character of the wetland in Punta Cabullones are highly dependent on the seasonal and annual variations of both rainfall and sea-wave activity. Also, unseasonal short-term above-normal rainfall and sea-wave events resulting from passing storms may induce substantial changes in the water stage and the chemical char-acter of the wetland. In general, tidal fluctuations exert a minor role in modifying the water quality and stage of the wetland in Punta Cabullones. The role of the tidal fluctuations becomes
important during those times when the outlets/inlets to the sea are not blocked by a sand bar and is allowed to freely flow into the wetland interior. The salinity of the wetland varies from brackish to hypersaline. The hypersaline conditions, including the occurrence of saltflats, within the Punta Cabullones wetland area result from a high evapotranspiration rate. The hypersaline conditions are further enhanced by a sand bar that blocks the inlet/outlet of the wetland’s easternmost channel, particularly during the dry season.
Groundwater in Punta Cabullones mostly is present within beds of silisiclastic sand and gravel. During the study period, the depth to groundwater did not exceed 4 feet below land surface. The movement and direction of the groundwater flow in Punta Cabullones are driven by density variations that in turn result from the wide range of salinities in the groundwater. The salinity of the groundwater decreases within the first 60 to 100 feet of depth and decreases outward from a mound of hypersaline groundwater centered on piezometer nest PN2. The main groundwater types within the Punta Cabullones area vary from calcium-bicarbonate type in the northernmost part of the study area to a predominantly sodium-potassium-chloride groundwater type southward. According to stable-isotope data, groundwater within the study area is both modern meteoric water and seawater highly affected by evaporation. The chemical and stable-isotopic character of local groundwater is highly influenced by evapotranspiration because of its shallow depth.
Equivalent freshwater heads indicate groundwater moves away from a mound centered on piezometer nest PN2, in a pattern similar to the spatial distribution of groundwater salinity. Vertical groundwater flow occurs in Punta Cabullones due to local differences in density. In the wetland subarea of Punta Cabullones, groundwater and surface water are hydraulically coupled. Locally, surface-hypersaline water sinks into the aquifer, providing recharge and serving as a mechanism to redistribute salt throughout the study area. The evapotranspiration in the wetland subarea is estimated at about 11 million gallons per day (Mgal/d) that is equivalent to about
2 Hydrogeology and Hydrology of the Punta Cabullones Wetland Area, Ponce, Southern Puerto Rico, 2007– 08
12,586 acre-feet per year. The balance of evapotranspiration, in excess of the about 0.5 Mgal/d of groundwater flow within the wetland, is supplied by saline to hypersaline surface water that may include seawater and meteoric water highly affected by evaporation with dissolved salts. In one of the extreme scenarios in which no groundwater is intercepted by pumpage at the Restaurada well field, the amount of saline to hypersaline water in the wetland consumed by evapotrans-piration is about 10.5 Mgal/d. In the opposite extreme in which the entire regional groundwater flow is intercepted by pumpage in the Restaurada well field, the entire evapotrans-piration requirement is met by saline to hypersaline water. Hydrologic, isotopic, and chemical data indicate that all of, or a large portion of, the historical groundwater flow to Punta Cabullones is being captured by the Puerto Rico Aqueducts and Sewer Authority pumpage at the Restaurada well field at a rate of about 2 Mgal/d. As a consequence, seawater intrusion into the aquifer at the Punta Cabullones area seems to be occurring, while the current pumpage at the Restaurada well field is sustained by storage depletion of the aquifer.
IntroductionThe Punta Cabullones wetland (hereinafter referred to
as Punta Cabullones) area, with an extent of about 9 square miles (mi2) is a unique coastal ecological system located in the Municipio of Ponce, southern Puerto Rico (fig. 1A). The Punta Cabullones study area consists of wetlands, saltflats, patches of mangrove forests, and a small barrier reef (fig. 1B). Punta Cabullones is a natural coastal barrier that is protected under the Coastal Barrier Resources Act; the barrier provides protection against sea-wave activity, particularly storm surges, and it acts as a wildlife refuge for local and migratory bird species (U.S. Fish and Wildlife Service, 1982).
The Municipio of Ponce chose to create a wetland reserve from the Punta Cabullones area as part of the wetlands mitigation effort required by Federal and State agencies to compensate for the negative effect of dredging the Ponce Bay to build the Las Américas Transshipment Port. The Las Américas Transshipment Port is a major infrastructure development that portends the conversion of the Ponce Port into a major transnational center for storing, advanced-stage manufacturing, and the export-import of goods.
Until the 1970s, land to the north of Punta Cabullones was cultivated with sugar cane, whereas most of the Punta Cabullones area has been historically considered unsuitable for agricultural use because of the poor quality of the soil. The poor quality is due mainly to the high salt content of the soil resulting from the effects of a high evapotranspiration (ET) rate on the shallow water table and surface-water bodies within the study area. The local water table is close to the land
surface and, after a rainfall event, may rise to the soil surface making it difficult to grow traditional crops. As of 2007, a low-intensity cattle-breeding operation is the only agricultural-related activity in the Punta Cabullones area.
The Punta Cabullones area was used during a large part of the 20th century as a disposal site for industrial and domestic wastes. In 2007, about one-third of the Punta Cabullones area was still covered by material such as glass bottles, scrap metal, and mounds of a limestone-derived material that is a byproduct of the cement industry. In addition, mining of gravel and sand throughout several decades during the 20th century partially removed, and in places completely obliterated, the beach ridges that once existed in the Punta Cabullones area.
In order to develop a management plan for the natural resources of the Punta Cabullones area, the Municipio Autónomo de Ponce and the Puerto Rico Department of Natural and Environmental Resources (PRDNER) requested the U.S. Geological Survey (USGS) to conduct a study of the hydro geology and hydrology as well as the factors that control the spatial and temporal changes in the chemical and physical properties of the groundwater and surface water. The results of this study help advance the understanding of coastal processes, and in particular the groundwater flow movement in a coastal setting.
Purpose and ScopeThe purpose of this study was to define the local
hydro geology of the relatively shallow water-bearing units (maximum depth not exceeding 100 feet [ft]) below land surface and hydrology, as well as to relate the seasonal variations and occurrence of episodic rainfall events, ET, and fluctuations in water stage with changes in sea-level stage and in chemical and physical properties of the wetland and aquifer within the Punta Cabullones area. The study was performed within a geographic area of about 9 mi2 in the coastal zone of the Municipio of Ponce, southern Puerto Rico (figs. 1A and 1B). Data were collected mostly from February 2007 to December 2008, with some surface-water data collection extended to April 2009 at select stations. The specific objectives of this study were to
1. Define the hydrogeology of the study area including the groundwater/surface-water interaction and estimate a water budget for the study area,
2. Determine if the source of local groundwater is from precipitation, regional groundwater flow, or seawater, or possibly a combination of some or all of these, and
3. Determine the temporal and spatial changes in the stage, chemical constituents, and isotopic and physical properties of the water in the wetland and shallow aquifer within the Punta Cabullones area.
Introduction 3
PUE
RTO
RIC
O
Lago
Po
rtugu
és
CAR
IBBE
AN S
EA
Figu
re 1
A.
(A) L
ocat
ion
of th
e Pu
nta
Cabu
llone
s st
udy
area
and
(B) d
ata-
colle
ctio
n si
tes
for t
he P
unta
Cab
ullo
nes
stud
y ar
ea, s
outh
ern
Puer
to R
ico.
Punt
a Ca
bullo
nes
stud
y ar
ea
0 01
23
45
MIL
ES
510
KIL
OMET
ERS
Base
mod
ified
from
U.S
. Geo
logi
cal S
urve
y di
gita
l dat
a
Bar
ranq
uita
s
Coa
mo
Salin
asSa
nta
Isab
el
Juan
aDίa
z
Ponc
e
Gua
yani
lla
Vill
alba
Adj
unta
s
Peñu
elas
Nor
ther
n lim
it of
Sou
th C
oast
al P
lain
Lake
ele
vatio
n st
atio
n an
d nu
mbe
r
EXPL
AN
ATIO
N11
3950
Dra
inag
e ba
sin
boun
dary
66°4
4'
Map
are
a
66°2
2'
18°0
8'59
"
17°5
7'00
"
A
C o
r d
i l
l e
r a
C e
n t
r a
l
Figu
re 1
. (A
) Loc
atio
n of
the
Punt
a Ca
bullo
nes
stud
y ar
ea a
nd (B
) dat
a co
llect
ion
site
s fo
r the
Pun
ta C
abul
lone
s st
udy
area
, sou
ther
n Pu
erto
Ric
o.
4 Hydrogeology and Hydrology of the Punta Cabullones Wetland Area, Ponce, Southern Puerto Rico, 2007– 08
Punt
a C
aren
ero
Cal
eta
de C
abul
lóne
s
Cost
a Ca
ribe
Reso
rt
Roc
a A
hoga
do
Cay
o F
rios
Punt
a C
abul
lóne
s
Car
ibbe
an S
ea
Río Bucaná
Río Inabón
Cem
ent
indu
stry
w
aste
6
66°3
7'00
"
18°0
0'30
"
17°5
9'30
"
17°5
8'30
"
17°5
7'30
"
66°3
6'00
"66
°35'
00"
66°3
4’00
”66
°33’
00”
Orth
opho
to b
ase
from
the
U.S.
Arm
y Co
rps
of E
ngin
eers
, Pon
ce a
nd P
laya
de
Ponc
e, 1
:24,
000,
200
7La
mbe
rt co
nfor
mal
con
ic p
roje
ctio
n, N
orth
Am
eric
an D
atum
of 1
927
00.
51.
01.
52.
0 KI
LOM
ETER
S
00.
51
MIL
E
EXPL
AN
ATIO
N
Stag
e m
easu
rem
ent
st
atio
n—2
indi
cate
s
nonc
ontin
ous
wat
er-
qu
ality
mon
itor
Piez
omet
er n
est w
ith id
entif
ier
Wel
l poi
nt w
ith id
entif
ier
Met
eoro
logi
cal s
tatio
n
Oil
expl
orat
ory
wel
l
Cont
inuo
us-r
ecor
d st
age-
mea
sure
men
t sta
tion—
1 in
dica
tes
cont
inuo
us
wat
er-q
ualit
y m
onito
r
Wat
er-q
ualit
y m
onito
ring
stat
ion
Test
hol
e w
ith id
entif
ier
11
11
22
22
7
11 1111
5 5
997
1515
1313
4 4
121216 1617 1722
88
82
CPR-
3CP
R-3
1010
1010
5011
3625
5011
3625
5011
3625
5011
3625
5011
3619
5011
3619
5011
3610
Rest
aura
daw
ell f
ield
5011
3610
5011
3610
5011
3617
5011
3617
5011
3615
5011
3615
5011
3619
5011
4730
5011
4730
1414
Play
ade
Ponc
e
Buca
ná
CIT
Y O
F PO
NC
E
CPR-
3CP
R-3
52
7
Agr
icul
tura
l wel
l with
iden
tifie
r4
1
2
5
6
7
8
9
10
1112
131415
161750
1136
15 5011
3617
5011
3619
5011
3619
5011
3619
5011
3619
5011
3625
66°3
4'30
"66
°35'
00"
17°5
8'30
"
17°5
8'00
"
11
Lim
its o
f stu
dy a
rea
CPR-
3CP
R-3
00.
20.
30.
40.
10.
5 KI
LOM
ETER
00.
10.
20.
3 M
ILE
Figu
re 1
B.
(A) L
ocat
ion
of th
e Pu
nta
Cabu
llone
s st
udy
area
and
(B) d
ata-
colle
ctio
n si
tes
for t
he P
unta
Cab
ullo
nes
stud
y ar
ea, s
outh
ern
Puer
to R
ico.
—Co
ntin
ued
B Figu
re 1
. (A
) Loc
atio
n of
the
Punt
a Ca
bullo
nes
stud
y ar
ea a
nd (B
) dat
a co
llect
ion
site
s fo
r the
Pun
ta C
abul
lone
s st
udy
area
, sou
ther
n Pu
erto
Ric
o.—
Cont
inue
d
Description of the Study Area 5
Previous InvestigationsThere is sparse information available on the geologic
and hydrogeologic character of the Punta Cabullones area. Kaye (1959) ascribed the existing marked beach ridges in a lunate pattern at the Punta Cabullones area to a rapidly prograding coast and, based on analyses of aerial photos, estimated the prograding rate at about 5 ft per year between 1936 and 1951.
As part of an analog-modeling study, Bennet (1972) documented the occurrence of shallow brackish and saline water overlying deeper freshwater along the margins of the Río Bucaná in the western part of the Punta Cabullones area. In the late 1970s, infiltration from the still-prevalent flood irrigation method in the south coast area of Puerto Rico was the main recharge source to the aquifer; approximately 30 percent of the applied water was estimated to recharge the aquifer. In 2007, with no irrigation in the study area, a maximum of 10 percent of the rainfall is estimated to recharge the aquifer at a rate of 3 to 4 inches per year (in/yr). According to Bennet (1972), plans by the Puerto Rico Aqueduct and Sewer Authority (PRASA) to substantially increase the groundwater withdrawals from the South Coast aquifer in the Ponce area during the late 1970s would have deprived the Punta Cabullones area of fresh groundwater from the regional flow, even if recharge from flood irriga-tion was maintained. He concluded that cessation of fresh groundwater flow from the regional flow would result in seawater intrusion, rendering useless the portion of the South Coast aquifer south of the Restaurada well field in an estimated 40 years (fig. 1B). Bennet (1972) also concluded that if recharge from flood irrigation was eliminated and PRASA’s plan to increase pumpage implemented, seawater intrusion into the aquifer would be accelerated.
A study by Rodríguez-Martínez and others (2005) was conducted almost three decades after flood irrigation and the associated recharge to the aquifer had ceased and PRASA had increased the daily withdrawals from the aquifer by 1.5 million gallons per day (Mgal/d) to a total of about 2 Mgal/d. The study by Rodríguez-Martínez and others (2005) was restricted to the area north of Punta Cabullones, although electrical-resistivity surveys conducted immediately north of the Punta Cabullones area qualitatively indicated the presence of brackish and saline groundwater overlying fresh groundwater.
Description of the Study Area
The Punta Cabullones study area, with an areal extent of about 9 mi2, is located within the fan-delta and alluvial coastal plain of the municipio of Ponce (fig. 1B). The area is bordered to the east by the Río Inabón, to the west by the Costa Caribe Resort, to the northwest by Highway 52, to the south by the Caribbean Sea, and to the north by an east-west line between Highway 52 and Río Inabón (fig. 1B). The tidal gage station 50114730 and the Restaurada well field are not located within the boundaries of the study area, but data collected at these sites are important to the analysis presented in this report. The coastal area of the Punta Cabullones area consists of a series of channels, lagoons, saltflats, patches of mangrove forests, and a near-shore fringe reef; thus, it is referred to as the Punta Cabullones wetland subarea (fig. 2). That part of the Punta Cabullones study area north of the wetland subarea lies within the upper coastal fan-delta and alluvial plain (fig. 2). A series of ditches within the study area is a remnant of a more complex system built in the past century to enhance drainage of surface water and shallow groundwater and for flood irriga-tion of sugarcane fields. The coastal area of the municipio of Ponce in southern Puerto Rico lies within the South Coastal Plain, which is warmer and drier than the rest of the island. This difference in climate is due to a rain shadow effect caused by the east-west trending Cordillera Central mountain range on the prevailing northeast trade wind (Calvesbert, 1970).
Punta Cabullones is mostly underlain by beach-eolian sand deposits of Quaternary age that are interspersed by mangrove-swamp deposits also of Quaternary age (Glover and others, 1977; fig. 3). These deposits have been replaced northward by delta-fan and alluvial deposits of Quaternary age, referred to by Glover and others (1977) as piedmont alluvial plain deposits. Fringing reefs of small extent are located at less than 164 ft offshore. The Quaternary-age deposits are underlain by silisiclastic and carbonate rocks of middle Tertiary age that are assumed to be time equivalent to the carbonate and terrigenous units of the same age exposed north of the study area.
The beach-eolian deposits consist primarily of siliceous-terrigenous fine-grained sand with a minor component of very fine to coarse pebbly sand that locally becomes predominant. These sediments have been transported from the interior inland by fluvial processes and deposited along the shoreline
6 Hydrogeology and Hydrology of the Punta Cabullones Wetland Area, Ponce, Southern Puerto Rico, 2007– 08
XX’
Nor
ther
nmos
t lim
it of
the
Punt
a Ca
bullo
nes
wet
land
sub
area
Heal
thy
man
grov
e fo
rest
with
free
-flow
ing
seaw
ater
(498
,071
.28
m2 )
Saltf
lat w
ith s
catte
red
vege
tatio
n
Land
with
was
tes
of c
emen
t ind
ustry
(444
,703
.41
m2 )
Chan
nel w
ith p
redo
min
ant h
yper
salin
e co
nditi
ons
resu
lting
from
th
e lim
ited
influ
x of
sea
wat
er d
ue to
occ
asio
nal s
and
bars
at i
ts
m
outh
; dw
arf m
angr
oves
bor
der t
he c
hann
el (1
09,8
19.8
1 m
2 ) Ch
anne
l bor
dere
d by
mod
erat
ely
heal
thy
man
grov
es w
ith
outle
t/inl
et m
ost o
f the
tim
e fre
e of
san
d ba
rs; f
ree
influ
x of
seaw
ater
occ
urrin
g re
gula
rly (5
3,22
5.82
m2 )
SFSV
SFSV
SFSV
EXPL
AN
ATIO
N
MFS
W
MFS
W
MFS
W
LWCI
LWCI
LWCI
CRBO
CRBO
COSW
COSW
XX’
Figu
re 2
. De
fined
sub
area
s w
ithin
the
Punt
a Ca
bullo
nes
stud
y ar
ea a
nd th
e m
ain
land
-cov
er ty
pes
with
in th
e w
etla
nd s
ubar
ea u
sed
for e
vapo
trans
pira
tion
estim
ates
.
00.
20.
30.
40.
10.
5 KI
LOM
ETER
00.
10.
20.
3 M
ILE
FAN
-DEL
TA
AN
D C
OA
STA
L A
LLU
VIA
L P
LAIN
66°3
4'66
°35'
17°5
9'
17°5
8'
Orth
opho
to b
ase
from
the
U.S.
Arm
y Co
rps
of E
ngin
eers
, Pla
ya d
e Po
nce,
1:2
4,00
0, 2
007
Lam
bert
conf
orm
al c
onic
pro
ject
ion,
Pue
rto R
ico
datu
m
Figu
re 2
. De
fined
sub
area
s w
ithin
the
Punt
a Ca
bullo
nes
stud
y ar
ea a
nd th
e m
ain
land
-cov
er ty
pes
with
in th
e w
etla
nd s
ubar
ea u
sed
for e
vapo
trans
pira
tion
estim
ates
.
Introduction 7
EXPLANATION
Beach deposits (Holocene)—Sand, gravel, and shell fragments; mostly unconsolidated, but includes calcite-cemented beach rock north of Punta Cabullones. Locally contains concentrations of magnetite
Reefs (Holocene)—Composed chiefly of coral and coralline algae; partly overlain on the protected or back-reef side by sand composed of coral and coralline algae and by irregularly distributed whole and broken coral heads
Fan-delta and coastal alluvial plain deposits—Sand, silt, and gravel, unconsolidated, thickness unknown like Qp, but contains a moderate accumulation of salt
Qps
Swamp deposits (Holocene)—Clay, silt, and organic material; chiefly covered by mangrove trees
Qp
Qc
Qb
Qs
Qps
Qp
Qc
Qb
Qs
52
RIO INABÓN
RIO
BUCA
NA
RIO
BUCA
NA
Vayas
Playa
Bucana
Capitanejo
66°33'66°34'66°35'66°36'
17°59'
17°58'
0
Base modified from U.S. Geological Survey Playa de Ponce and Santa Isabel, 1977
0.5 1.5 KILOMETERS1
0 0.25 0.5 0.75 MIILE
Map area
PUERTO RICO
Caleta de Cabullónes
PuntaCabullónes
Cayos Frios
Figure 3. Generalized surface geology of the Punta Cabullones study area as defined by Glover and others (1977).
Qs
Figure 3. Generalized surface geology of the Punta Cabullones study area as defined by Glover and others (1977).
8 Hydrogeology and Hydrology of the Punta Cabullones Wetland Area, Ponce, Southern Puerto Rico, 2007– 08
by sea-current activity. Occasional flooding by the Río Inabón and above-normal sea-wave activity may cause high rates of deposition and erosion as well as reworking of previously deposited sediment along the shoreline and inland within the study area. The occurrence of localized lobes of coarse gravel of limited aerial extent also may be the result of these irregular high-energy events. The minor carbonate component in these deposits is provided by sea-wave mechanical abrasion of the small fringing reefs offshore and erosion of limestone of middle Tertiary age exposed north of the study area. These ridges, left behind as the coast has prograded due to a greater influx of sediment during a high sea-level stand, may be considered approximate locations of pre-existing shorelines. In the Punta Cabullones area, the low-lying swales described above accumulate organic matter and finer grained material such as clay and silt. An undetermined amount of the material removed by rainfall runoff from the mounds of the cement industry wastes deposited in the area makes its way into these low-lying features and the wetland.
The land-surface elevation averages 30 ft above mean sea level (amsl) along the northern border of the study area and gently slopes southward to the Caribbean Sea over a distance of about 3 miles. In its coastal portion, the Punta Cabullones area is characterized by a series of beach ridges in a lunate pattern that resulted from progradation of the shoreline, assumed to have started since the end of the Pleistocene (about 11,000 to 12,000 years ago). Low-lying swales, also with a lunate pattern, generally occur between consecutive beach ridges. These features function as permanent or intermittent saline to hypersaline wetlands and lagoons that serve as feeding grounds for various bird species and permanent or temporary habitats for some fish and crustacean species, among others (Stapor, 1982). These swales also partially function as routing channels for the seawater inflow and backflow induced by tidal fluctuations. These low-lying features are recipients of almost all of the rainfall runoff within the Punta Cabullones area. The margins of these low-lying swales are generally covered with mangroves and other types of vegetation tolerant or well suited to these normally saline to hypersaline settings. Prior to mining by the construction industry, the difference in elevation between a beach ridge and the contiguous low-lying swale could reach 7 ft (Kaye, 1959). At present, only minor portions of the beach ridges and coupled low-lying swales remain; as a result, most of the Punta Cabullones area is featureless, except for residual 3- to 5-ft-high waste mounds left by the cement industry (fig. 1B). Isolated patches of the beach ridges remain and have elevations ranging from 2 to 4 ft amsl.
By using aerial photographs, Kaye (1959) estimated that the shoreline at Punta Cabullones advanced about 75 ft during the 15-year period between 1936 and 1951 for an average progradation rate of 5 ft/yr. Kaye (1959) also estimated that as of 1951 the inland extent from the shore of the beach-eolian ridges was about 6,396 ft. By using the average progradation rate of 5 ft, Kaye (1959) estimated a time span of 1,280 years for the advance of the shoreline to its position of 1958. Kaye
(1959) noted differences between the shape of the existing shoreline during 1951 and the shapes of older shorelines and attributed differences to the development of two small reefs, which cause the waves to diffract and refract, thus affecting the sedimentation pattern along the shoreline. Similar beach-ridge complexes elsewhere have been documented as being the result of climatic events such as El Niño (Craigh, 1992; Goy and others, 2002).
The Punta Cabullones area consists of a series of interconnected environments such as wetlands, ephemeral and permanent lagoons, mangrove swamps, tidal flats, and saltflats created as a result of elimination of almost all of the beach ridges and low-lying swales by the sand-mining industry (fig. 1B). A series of small islets with mangrove thickets and fringing reefs occurs at a short distance offshore. A small fringing reef, about 300 ft in length and about 200 ft from the shoreline, partially encloses a back-reef lagoon. During storms, this back-reef lagoon is hydraulically connected with the low-lying swales through a channel that extends inland. In the absence of high-wave activity, the mouth of the inland channel is frequently blocked by the accumulation of sand, and the back-reef lagoon becomes either partially or completely isolated from the low-lying swales.
The effect of the existing Toa Vaca and Cerrillos reservoirs combined with the construction (as of 2008) of the Portugués reservoir on the amount of sediment being supplied to the shoreline of Punta Cabullones is unknown (Soler-López, 2004, 2011). The Toa Vaca reservoir lies within the municipality of Villalba about 15 miles (mi) northeast of the Punta Cabullones area. This reservoir was constructed during 1972 in the upper part of the Rio Jacaguas basin that discharges into the Caribbean Sea about 2 mi east of Río Inabón. The Cerrillos reservoir was constructed during 1991 in the upper part of the Río Cerrillos basin about 5 mi northwest of the Punta Cabullones area within the municipality of Ponce. The Río Cerrillos, also known as Río Bucaná in its coastal reach, discharges into the Caribbean Sea about 1 mi west of the Punta Cabullones area. The Portugués reservoir is about 7 mi northwest of the Punta Cabullones area.
Methods of StudyIn order to accomplish the objectives of the study, data
on the shallow subsurface geology, stable isotopic and main chemical constituents of surface water and groundwater, and hydraulic properties of the shallow aquifer were collected within the Punta Cabullones area. Data were also obtained on the seasonal variation of climatic conditions and on the physical properties characterizing surface water and groundwater. Use was also made of information from previous studies in Cabullones and other similar settings in the world to calculate properties such as evapotranspiration used to estimate the water budget of the study area. The means and methods used to obtain these data are listed and described below.
Methods of Study 9
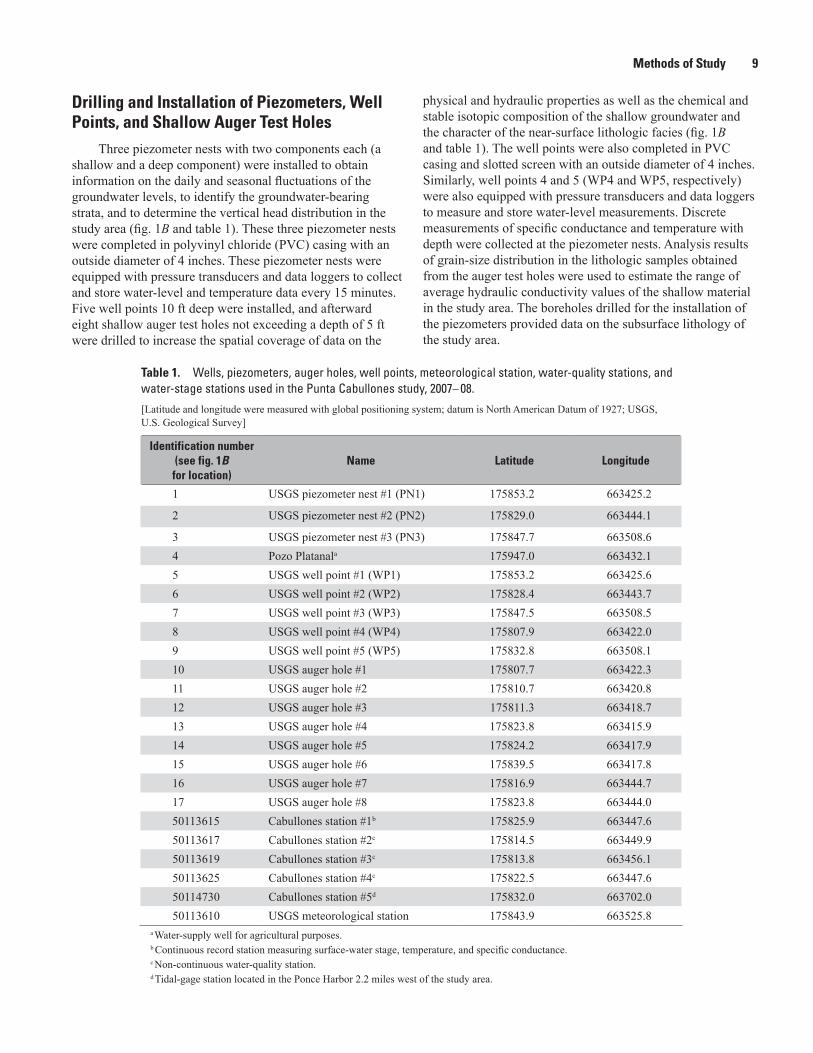
Drilling and Installation of Piezometers, Well Points, and Shallow Auger Test Holes
Three piezometer nests with two components each (a shallow and a deep component) were installed to obtain information on the daily and seasonal fluctuations of the groundwater levels, to identify the groundwater-bearing strata, and to determine the vertical head distribution in the study area (fig. 1B and table 1). These three piezometer nests were completed in polyvinyl chloride (PVC) casing with an outside diameter of 4 inches. These piezometer nests were equipped with pressure transducers and data loggers to collect and store water-level and temperature data every 15 minutes. Five well points 10 ft deep were installed, and afterward eight shallow auger test holes not exceeding a depth of 5 ft were drilled to increase the spatial coverage of data on the
physical and hydraulic properties as well as the chemical and stable isotopic composition of the shallow groundwater and the character of the near-surface lithologic facies (fig. 1B and table 1). The well points were also completed in PVC casing and slotted screen with an outside diameter of 4 inches. Similarly, well points 4 and 5 (WP4 and WP5, respectively) were also equipped with pressure transducers and data loggers to measure and store water-level measurements. Discrete measurements of specific conductance and temperature with depth were collected at the piezometer nests. Analysis results of grain-size distribution in the lithologic samples obtained from the auger test holes were used to estimate the range of average hydraulic conductivity values of the shallow material in the study area. The boreholes drilled for the installation of the piezometers provided data on the subsurface lithology of the study area.
Table 1. Wells, piezometers, auger holes, well points, meteorological station, water-quality stations, and water-stage stations used in the Punta Cabullones study, 2007– 08.
[Latitude and longitude were measured with global positioning system; datum is North American Datum of 1927; USGS, U.S. Geological Survey]
Identification number (see fig. 1B
for location)Name Latitude Longitude
1 USGS piezometer nest #1 (PN1) 175853.2 663425.2
2 USGS piezometer nest #2 (PN2) 175829.0 663444.1
3 USGS piezometer nest #3 (PN3) 175847.7 663508.64 Pozo Platanala 175947.0 663432.15 USGS well point #1 (WP1) 175853.2 663425.66 USGS well point #2 (WP2) 175828.4 663443.77 USGS well point #3 (WP3) 175847.5 663508.58 USGS well point #4 (WP4) 175807.9 663422.09 USGS well point #5 (WP5) 175832.8 663508.110 USGS auger hole #1 175807.7 663422.311 USGS auger hole #2 175810.7 663420.812 USGS auger hole #3 175811.3 663418.713 USGS auger hole #4 175823.8 663415.914 USGS auger hole #5 175824.2 663417.915 USGS auger hole #6 175839.5 663417.816 USGS auger hole #7 175816.9 663444.717 USGS auger hole #8 175823.8 663444.050113615 Cabullones station #1b 175825.9 663447.650113617 Cabullones station #2c 175814.5 663449.950113619 Cabullones station #3c 175813.8 663456.150113625 Cabullones station #4c 175822.5 663447.650114730 Cabullones station #5d 175832.0 663702.050113610 USGS meteorological station 175843.9 663525.8
a Water-supply well for agricultural purposes.b Continuous record station measuring surface-water stage, temperature, and specific conductance.c Non-continuous water-quality station.d Tidal-gage station located in the Ponce Harbor 2.2 miles west of the study area.
10 Hydrogeology and Hydrology of the Punta Cabullones Wetland Area, Ponce, Southern Puerto Rico, 2007– 08
Groundwater samples were collected periodically at piezometers and well points to determine the spatial and temporal stable isotopic (deuterium [2H] and oxygen-18 [18O]) and major ion composition of the groundwater. One round of groundwater sampling was done specifically to determine the concentration of chlorofluorocarbons (CFCs) in order to estimate the age of groundwater and delineate probable groundwater flow paths. Groundwater-quality and stable-isotope data from groundwater and surface water were also used in conjunction with CFC concentration data from groundwater to generally define any groundwater/surface-water interaction and overall groundwater movement within the study area. The groundwater occurrence and movement considered in this study and discussed in this report is that of shallow groundwater-bearing units whose depths do not exceed 100 ft. It is reasonable to assume that groundwater at greater depths will exert little, if any, influence on the hydrogeology and hydrology of the wetlands in the Punta Cabullones area. This assumption is based on prior work by Bennett (1972) indicating that ET is the most influencing factor in the groundwater system of the study area; the depth of influence of ET is limited to a depth not exceeding 10 ft below land surface. In addition, resistivity surveys conducted in the northern part of the Punta Cabullones area indicate the occurrence of saline to hypersaline water at shallow depths overlying either brackish or freshwater (Rodriguez-Martínez and others, 2005).
Installation of Surface-Water Stations
Surface-water stage data were collected at two sites in the study area; one is within the wetland interior (station 50113615), and the other (station 50113625) is near the outlet of one of the two main channels of the wetland system (fig. 1B). Additionally, at station 50113615, specific conductance and water temperature were measured hourly. A tidal-gage station (50114730) located within the Ponce Harbor, about 2 mi west of the study area, was used to measure sea-level fluctuations caused by tides and storm surges and to correlate these changes to water levels of the wetland and shallow aquifer in the study area. Physical properties of the water within the wetland, such as specific conductance, temperature, pH, salinity, dissolved oxygen, and percent
oxygen saturation, were measured monthly at surface-water stations 50113615, 50113617, 50113619, and 50113625 (fig. 1B). Water samples from surface-water station 50113615 were collected twice, once each during the dry and wet season, to determine the stable isotopic (2H and 18 O) and major ion composition of the surface water.
Collection of Meteorological Data
Meteorological station 50113610 was installed within the premises of the Costa Caribe Resort to collect hourly measure-ments of temperature, rainfall, solar radiation, wind speed and direction, relative humidity, and barometric pressure (fig. 1B). The meteorological data were used to estimate the ET in that subarea of the Punta Cabullones study area underlain by fan-delta and coastal plain alluvial deposits north of the line X–X' (fig. 2).
Estimation of Hydraulic Conductivity
Conventional hydraulic tests within the Punta Cabullones area were not conducted due to budget and logistic constraints. In substitution, a series of proven empirical methods that relate selected statistical parameters of the grain-size distribution of the aquifer material with the hydraulic conductivity were used to obtain values of hydraulic conductivity (K ).
The empirical formulas developed by Slitcher (1899), the U.S. Bureau of Reclamation (USBR), Odong (2008), Vukovic and Soro (1992), Kozeny and Carman (1956), and Alyamani and Sen (1993) were considered to estimate the hydraulic conductivity based on various statistical parameters of the grain-size distributions of sediments collected from shallow auger holes drilled within Punta Cabullones to depths not exceeding 5 ft below land surface (presented in table 1 and fig. 1B with ID numbers 10 thru 17). The grain-size distribu-tion was obtained for sequential samples of sediment collected from land surface to the depth of the water table (Friedman, 1967). Values of kinematic viscosity, a property that measures how easily a fluid flows and that varies with temperature, were used to convert the K values obtained into hydraulic conduc-tivity estimates (Kozeni and Carman, 1956; Alyamani and Sen, 1993). Kinematic viscosity values of 0.94 square foot per second (ft2/s) and 1.16 ft2/s were used to obtain the hydraulic
Methods of Study 11
conductivity of freshwater and of the hypersaline water representative of Punta Cabullones, respectively, except in the method by Alyamani and Sen (1993). These kinematic values are based on a temperature of 20 degrees Celsius (°C), while the value of 1.2 ft2/d for the hypersaline water in the study area was derived from an average temperature of 26 °C and average salinity of about 50 parts per thousand. The method by Alyamani and Sen (1993) does not consider the properties of the moving fluid and consequently does not require a value of kinematic viscosity in its estimation of horizontal K.
The method of Alyamani-Sen was preferred over the other methods of analysis because, in general, the K values obtained with this method emphasized the importance of the finer-grained, lower portion of the grain-size distribution curve as an important factor in the K estimate (Odong, 2008). Another advantage of the Alyamani-Sen method over the other methods is that it is based on a larger portion of the particle-size distri-bution and particle shape for the sample(s) being considered (Odong, 2008). The K values obtained with the Alyamani-Sen method are assumed to be more accurate for the type of sediments collected from the auger holes in Punta Cabullones than those values obtained with the other methods. The sediments collected from the auger holes in Punta Cabullones are predominantly loose and moderately to well sorted.
The Alyamani-Sen method emphasizes the important role that an increasing amount of fine-grained material has in reducing the K value of a sediment sample. With the Alyamani-Sen method, emphasis is placed on grain sizes with diameters of d50 and d10 and I0, the zero-intercept of the grain-size distribution curve. The d50 and d10 are those grain diameters in a sediment sample, obtained from a grain-size distribution curve, larger than the 50 and 90 cumulative percent weight, respectively, of the total grains in the sample. The value obtained with the Alyamani-Sen method is in essence that of the intrinsic permeability of the porous medium because it does not consider the moving fluid properties.
Estimation of Evapotranspiration Rates
The temporal variation in ET for that part of the study area underlain by fan-delta and alluvial deposits was estimated
for the time period between March 2007 and March 2008 by using two variants of the Penman semi-empirical equation (Custodio and Llamas, 1996). One of the variants of the Penman semi-empirical equation, presented as Penman 1, uses latitudinal annual means for meteorological parameters, such as solar radiation and temperature, as well as a non-dimensional reduction coefficient. The reduction coefficient values were obtained by Penman for each month of the year from tests in surfaces covered by ray-grass in southeastern England (Snyder and others, 2010). The other variant of the Penman semi-empirical equation, presented as Penman 2, uses meteorological data collected at a meteorological station to estimate potential ET (for details see Custodio and Llamas, 1996). Both variants of the Penman semi-empirical equation result in an evaporation rate from an assumed free-water surface, which is then multiplied by a crop coefficient to obtain an ET rate that is based on the type of vegetation present in the area of interest (Snyder and others, 2010). An average crop coefficient value of 0.8 accounts for an assumed equally distributed mix of grass, low shrub, and wild-growing cotton cover and was used as the crop coefficient for this portion of the study area.
Available methodologies to estimate ET, such as the Penman semi-empirical method, are based on freshwater (Beven, 1979) and consequently are of no use in brackish to hypersaline environments such as the wetlands, saltflats, and mangrove forests of the Punta Cabullones wetland subarea (fig. 2). Estimated ET values for brackish to hypersaline settings in Puerto Rico are non-existent. In the case of the Punta Cabullones wetland subarea (includes wetland and salt-flats; figs. 1B and 2), ET estimates were obtained from similar land-cover types in other tropical brackish to hypersaline settings to estimate a long-term average ET. In order to further refine the ET estimate for the Punta Cabullones wetland area, the long-term seasonal rainfall patterns were divided into wet and dry periods. Each subarea with a different land-cover type was assigned an average salinity corresponding to wet and dry periods. An annual ET rate for each land cover type present in the study area was then estimated. The wet period includes the months between August and October for a total of 92 days, while the dry period spans the remaining 9 months of the year for a total of 273 days (assuming a year of 365 days).
12 Hydrogeology and Hydrology of the Punta Cabullones Wetland Area, Ponce, Southern Puerto Rico, 2007– 08
Study Area ClimateDuring 2008, rainfall in the Punta Cabullones area
followed the long-term seasonal pattern of the south coast of Puerto Rico. The wettest period is between August and October, and the driest months are February and March. Total rainfall measured during 2008 at the Bucaná meteorological station (50113610; fig. 1B) was 36 inches, which is slightly above the long-term annual average of 32 inches for the coastal plain near Ponce (fig. 4; Rodríguez-Martínez and others, 2005). The wettest month in 2008 was September with about 22 inches of rainfall, which was 60 percent of the total annual rainfall (fig. 4). More than half of the September 2008 rainfall fell during September 21 and 22.
The 2008 monthly values of mean, median, maximum, and minimum temperatures calculated by using daily values were 25.7, 25.7, 33.9, and 14.6 °C, respectively (fig. 5). The monthly minimum temperature of 14.6 °C during 2008 was measured in December. The monthly mean temperature ranged from 23.7 °C during January to 27.7 °C during July and August. The monthly maximum temperature ranged from 27.5 °C in
January to 30.8 °C in July. The monthly minimum temperature ranged from 14.6 °C during December to 21.7 °C during July.
The estimated 2008 mean and median wind speeds were 8 and 7 miles per hour (mi/h), respectively. The 2008 maximum and minimum wind speeds were 26 and 2 mi/h, respectively (fig. 6A). The monthly mean wind speeds during 2008 ranged from 6 mi/h in November to 9 mi/h in July with minimum and maximum wind gusts of 16 and 26 mi/h occurring during November and April, respectively. The monthly median wind speed ranged from 5 mi/h in November to 8 mi/h in June and July. The monthly minimum wind speeds ranged from 2 mi/h during the months of September, October, November, December, and January to 3 mi/h in June and July.
The predominant wind direction in Punta Cabullones during 2008 varied from northeast to southeast (fig. 6B). This predominant direction is the result of the easterly trade winds originating in the Atlantic Ocean. Other less frequent wind directions at Punta Cabullones are west, northwest, and due north. Occasionally, winds with a strong northern component are associated with cold fronts that originate in northern North America.
0 10 20 30 40 50 60 70 80 90 100
0 2 4 6 8 10 12 14 16 18 20 22
Jan.
Feb.
Mar.
Apr.
May
June
July
Aug.
Sept.
Oct.
Nov.
Dec.
2008
Percentage of annual rainfall
Monthly rainfall in inches
Monthly rainfall in inches
EXPLANATION
Percentage of annual rainfall
Figure 4. Monthly rainfall and corresponding percentage of total rainfall during 2008 in the Punta Cabullones area, southern Puerto Rico.
Figure 4. Monthly rainfall and corresponding percentage of total rainfall during 2008 in the Punta Cabullones area, southern Puerto Rico.
Study Area Climate 13
0
5
10
15
20
25
30
Win
d sp
eed,
in m
iles
per h
our
0
50
100
150
200
250
300
350
400
Jan. Feb. Mar. Apr. May June
2008July Aug. Sept. Oct. Nov. Dec.
Win
d di
rect
ion,
in a
ngle
s cl
ockw
ise
from
zero
A
B
EXPLANATION Maximum value
Minimum value
75th percentile
50th percentile (median)Mean
25th percentile
Figure 6. Wind (A) magnitude and (B) direction during 2008 at station 50113610, southern Puerto Rico.
Figure 5. Monthly statistics of air temperature in the Punta Cabullones study area during 2008 as measured at station 50113610, southern Puerto Rico.
Figure 6. Wind (A) magnitude and (B) direction during 2008 at station 50113610, southern Puerto Rico.
0
5
10
15
20
25
30
35
40
Jan. Feb. Mar. Apr. May June
2008July Aug. Sept. Oct. Nov. Dec.
Tem
pera
ture
, in
degr
ees
Cels
ius
Figure 5. Monthly statistics of air temperature in the Punta Cabullones study area during 2008 as measured at station 50113610, southern Puerto Rico.
EXPLANATION Maximum value
Minimum value
75th percentile
50th percentile (median)
25th percentile
14 Hydrogeology and Hydrology of the Punta Cabullones Wetland Area, Ponce, Southern Puerto Rico, 2007– 08
0
200
400
600
800
1,000
1,200
1,400
Jan. Feb. Mar. Apr. May June July2008
Aug. Sept. Oct. Nov. Dec.
Ho
urly
sol
ar ra
diat
ion,
in w
atts
per
squ
are
met
er
Figure 7. Monthly distribution of hourly solar radiation during 2008 as measured at station 50113610, southern Puerto Rico.
EXPLANATION Maximum value
Minimum value
75th percentile
50th percentile (median)Mean
25th percentile
745
750
755
760
765
770
Jan. Feb. Mar. Apr. May June
2008July Aug. Sept. Oct. Nov. Dec.
Ba
rom
etric
pre
ssur
e, in
mili
met
ers
EXPLANATION
Maximum value
Minimum value
75th percentile
50th percentile (median)Mean
25th percentile
Figure 8. Monthly distribution of barometeric pressure during 2008 as measured at station 50113610, southern Puerto Rico.
In 2008, the monthly hourly mean solar radiation ranged from 223 watts per square meter (w/m2) in December to 307 w/m2 in April (fig. 7). The monthly hourly median solar radiation ranged from16 w/m2 in December to 36 w/m2 in April and May. The monthly hourly maximum ranged from 996 w/m2 in January to 1,426 w/m2 in April, while the monthly hourly minimum ranged from 3 to 8 w/m2 in April and September, respectively.
The barometric pressure (bp) stayed within the range of 758 to 764 millimeters (mm; 29.84 to 30.07 inches) much of the time in 2008, except during a few occasions (fig. 8). The extreme lows in bp of 756 mm (29.76 inches) on September 3 and October 15 and 16 were associated with the passage of tropical storms near the south coast of Puerto Rico (fig. 8).
Figure 7. Monthly distribution of hourly solar radiation during 2008 as measured at station 50113610, southern Puerto Rico.
Figure 8. Monthly distribution of barometric pressure during 2008 as measured at station 50113610, southern Puerto Rico.
Surface Water 15
Surface WaterThe seasonal variations in rainfall and ET are the main
controlling factors in the long-term water quality and stage of the wetland in Punta Cabullones; however, short-term influence in the water quality and stage of the wetland in Punta Cabullones is exerted by episodic high-energy events such as storms that introduce substantial amounts of freshwater and seawater. The diurnal tidal fluctuations are of short range, and as a result, their influence on the water quality and stage of the wetland is minor and limited to areas close to the shoreline. However, when the wetland channels are open to the sea, usually during and after storms, the tidal effect extends farther into the wetland.
Surface-Water StageThe wetland in the Punta Cabullones area consists of a series
of elongated and semi-curved temporary ponds that generally follow the orientation of the low-lying swales formed between consecutive beach ridges (fig. 1B). The main water body of the wetland has two inlet/outlet channels to the sea. The westernmost
inlet/outlet channel remains open throughout the year. The entrance to the easternmost inlet/outlet channel is generally blocked by a sand bar and only remains open for several days when a storm event occurs, allowing the inflow of seawater.
Continuous surface-water stage data were collected from stations 5011615 and 50113625 within the Punta Cabullones area, and tidal-gage data were collected from station 50114730, located in Ponce Harbor about 1.25 mi west of the Río Bucaná (figs. 1B, 9, and 10). The Ponce Harbor stage data include normal tidal fluctuations as well as the water stage associated with storm events passing along or in the vicinity of the Puerto Rico south coast. The water stage at station 50113625, located near the mouth of one of the inlet/outlet channels connecting the wetland to the sea, varied from slightly less than 2 to 3.50 ft amsl. The water stage measured at station 50113615, located within the interior of the wetland’s easternmost channel, ranged from 0.96 to 4.75 ft amsl. The lowest stages occurred during April (fig. 9). The highest water stages at the two stations were measured during the months that are normally wet and include most of the hurricane season (June through December).
Figure 9. Variation of daily mean water stage at (A) station 50113615 and (B) station 50113625 during 2008 (see figure1B for location).
Figure 9. Variation of daily mean water stage at (A) station 50113615 and (B) station 50113625 during 2008 (see fig. 1B for location).
16 Hydrogeology and Hydrology of the Punta Cabullones Wetland Area, Ponce, Southern Puerto Rico, 2007– 08
Figure 10. Variation of daily mean water stage at stations 50113625 and 50113615 and the daily mean tidal fluctuation at station 50114730 during 2008 (see figure 1B for station locations).
Ponce Harbor daily mean tidal range at station 50114730
Missingdata
Missingdata
Missingdata
Figure 10. Variation of daily mean water stage at stations 50113625 and 50113615 and the daily mean tidal fluctuation at station 50114730 during 2008 (see fig. 1B for station locations).
During the study period, the maximum tidal range at the Ponce Harbor, as measured at station 50114730, was slightly above 1.0 ft (fig. 10). The tidal cycle was predominantly diurnal, with one daily minimum and maximum. On occa-sions, secondary maximums and minimums were measured.
The daily mean water stage at station 50113625 generally follows the pattern of the daily mean tidal range measured and recorded at station 50114730 (fig. 10). (The daily mean tidal range was used as a surrogate for the hourly data collected at station 50114730 to minimize the clustering of data in the plots.) Similarly, except during the dry months of February through April, the daily mean water stage at station 50113615 exhibits a minor response to the effects of the daily mean tidal cycle (fig. 10). The minor response of the stage at station 50113615 is explained by its location within the wetland interior, the small tidal range in the area, and the formation of a sand bar at the easternmost inlet/outlet channel that during normal weather conditions, particularly during the dry months, is able to minimize and even completely impede the inflow of seawater into the wetland. The sea only flows freely into the wetland during and after storm events when the sand bar is not present; at those times, the fluctuations in water stage at station 50113615 are the same or similar to the tidal fluctua-tions (fig. 11).
Surface-Water QualitySamples were collected from four monitoring stations
(50113615, 50113617, 50113619, and 50113625) each month between January 2008 and March 2009 for analyses of water temperature, pH, dissolved oxygen, salinity, and specific conductance (fig. 1B; table 2). In addition, temperature and specific conductance were measured and recorded at 15-minute intervals at station 50113615 (fig. 1). Salinity values at station 50113615 were also derived through a linear regression analysis from the local empirical relation between salt content and specific conductance.
Water TemperatureTemperatures were higher at the three stations located
within the eastern channel (stations 50113615, 50113617, and 50113619) than the temperatures measured at station 50113625, which is located near the sea and near the inlet/outlet of the easternmost channel (table 2). Of these four stations, 50113625 is the most affected by ocean surges and tidal fluctuations. Figure 12 shows the continuous and discrete monthly temperature measurements at station 50113615 as well as the hourly air temperature measured at the meteoro-logical station (50113610).
Figure 11. Selected partial records during 2008 of (A) tidal stage at Ponce Harbor (station 50114730), (B) daily mean water stage at station 50113615, and (C) water stage at station 50113615, southern Puerto Rico.
Figure 11. Selected partial records during 2008 of (A) tidal stage at Ponce Harbor (station 50114730), (B) daily mean water stage at station 50113615, and (C) water stage at station 50113615, southern Puerto Rico.
18 Hydrogeology and Hydrology of the Punta Cabullones Wetland Area, Ponce, Southern Puerto Rico, 2007– 08
Table 2. Selected surface-water-quality parameters measured at the Cabullones wetland between January 2008 and March 2009.
[pH measurements are in standard units; T, temperature in degrees Celsius; SC, specific conductance in microsiemens per centimeter at 25 degrees Celsius; SAL, salinity in parts per thousand; DO, dissolved oxygen in milligrams per liter]
Table 2. Selected surface-water-quality parameters measured at the Cabullones wetland between January 2008 and March 2009. —Continued
[pH measurements are in standard units; T, temperature in degrees Celsius; SC, specific conductance in microsiemens per centimeter at 25 degrees Celsius; SAL, salinity in parts per thousand; DO, dissolved oxygen in milligrams per liter]
Figure 12. Temporal variation in hourly and discrete water-temperature measurements at station 50113615 and in hourly air temperatures at station 50113610, January 2008–March 2009, southern Puerto Rico. Figure 12. Temporal variation in hourly and discrete water-temperature measurements at station 50113615 and in hourly air temperatures at station 50113610, January 2008–March 2009, southern Puerto Rico.
20 Hydrogeology and Hydrology of the Punta Cabullones Wetland Area, Ponce, Southern Puerto Rico, 2007– 08
In general, spatial differences in water temperatures among the three stations farther inland within the eastern-most channel were minimal. Temporal variations in water temperature at each of these three stations were related to seasonal changes in rainfall, tidal activity, and ambient air temperature. Abrupt decreases in temperature are mainly due to influxes of rainfall and seawater to the wetland area. Water temperatures ranged from 24.1 to 36.6 °C at stations 50113615 and 50113619, respectively. The highest temperature of 36.6 °C was measured at station 50113615 on June 10, 2008, and the lowest temperature of 24.1 °C was measured at stations 50113619 and 50113615 during November 5 and December 10, 2008, respectively. The measured temperatures at station 50113625 ranged from 24.5 to 32.1 °C. The continuous temperature (hourly) record at 50113615 shows a seasonal trend with the highest temperatures occurring between June and August and the lowest occurring between December and February (fig. 12).
pHThe pH of a sample of water is a measure of the concen-
tration of hydrogen ions (Covington and others, 1985). The pH of water controls the solubility and biological availability of chemical constituents such as nutrients. In addition, pH can be an indicator of biological processes because photosynthesis consumes dissolved carbon dioxide (CO2 ). The removal of CO2 reduces the acidity of the water, and pH increases as a result. In contrast, respiration produces CO2, which dissolves in water as carbonic acid, thereby lowering the pH.
As in the case of temperature, spatial differences in pH among the three inland stations were minimal. At these three stations, the highest pH value, 8.3 standard units, was measured in samples collected from stations 50113615, 50113617, and 50113619 on April 17, 2008, October 2, 2008, and March 18, 2008, respectively. The lowest value, 7.2 standard units, was measured in samples collected from stations 50113615 and 50113619 on November 5, 2008, and April 17, 2008, respectively (table 2). Until October 2, 2008, the pH of water samples from station 50113625 ranged from 6.4 to 8.0 standard units. After this date, the variations in pH at this station were smaller than the variations in pH from January through July 2008, probably due to the blockage of the easternmost channel inlet/outlet by sand, which minimized the inflow of seawater.
Dissolved OxygenThe concentration of dissolved oxygen (DO) in an
aquatic system is controlled primarily by variables such as water temperature, wind speed, salinity, and by photo-synthetic and respiration activity. In general, the highest DO concentrations were measured in water samples from stations 50113619 and 50113617, with values ranging from
1.6 to 11.2 milligrams per liter (mg/L) (table 2). Extremely low values of less than 1.0 mg/L were measured in samples collected from station 50113615 during the driest months of December 2008 through March 2009; during this period, the influx of freshwater and seawater into the wetland area is minimal. DO concentrations ranging from 7.0 to 11.2 mg/L were measured in samples collected on October 2, 2008, from the water-quality monitoring stations, with the exception of station 50113625, probably due to influx of seawater and rainfall runoff. The DO concentrations in samples collected from station 50113625 ranged from 0.7 to 7.2 mg/L before October 2, 2008; in samples collected from October 2, 2008, through March 16, 2009, concentrations ranged from 0.5 to 2.7 mg/L.
Specific Conductance and SalinitySpecific conductance (SC) is a measure of the capacity
of water (or other substance) to conduct an electrical current; thus, SC is directly related to the type and concentration of dissolved solids (electrolytes and minerals) present. In this report, SC is expressed in microsiemens per centimeter (µS/cm) and corrected to 25 °C. Commonly, the concentration of dissolved solids (in milligrams per liter) is 55 to 75 percent of the SC (Marion and Babcock, 1976).
Monthly SC measurements were made at the sites of four monitoring stations (table 2). In addition, SC measurements were recorded at 15-minute intervals at station 50113615 (fig. 13). Monthly measurements of SC within the Punta Cabullones area ranged from 21,970 to 110,500 µS/cm, with a temporal variation at each station. Spatial variations in the monthly measurements among the four stations were not substantial (table 2). The highest SC values correspond with the dry weather months due to lack of rainfall and inflow from the sea.
SC values cycle annually, with an increase beginning with the dry season that generally starts in December or January and lasts until March. Similarly, the decrease in SC values coincides with the beginning of the rainy season that generally begins in August and extends to November. Decreases in SC may result from the mixing of seawater, brought inland by storm surges, with existing hypersaline water in the wetland. The occurrence of storm surges and rainfall runoff into the wetland sometimes coincides, and the decrease in SC is accentuated. Water salinity values for Punta Cabullones are derived from the local empirical relation
Salinity = (0.0007× SC) – 2.7, (1)
where 0.0007 is the constant of proportionality
of the equation, salinity is in parts per thousand, and SC is in microsiemens per centimeter.
Surface Water 21
This equation was derived from linear regression modeling of the relation between salinity and SC in the Punta Cabullones area with a correlation coefficient, r2, of 0.99 (appendix fig. 1–1). Tidal fluctuations are readily transmitted into the wetland interior during high water-stage conditions associated with tropical weather disturbances, as indicated by
the cyclical variations in SC and, thus, of salinity (fig. 14). The simultaneous decrease in salinity and increase in water stage at station 50113615 result from the inflow of seawater and rainfall runoff associated with the passing of a tropical storm on December 8, 2007.
0
20,000
40,000
60,000
80,000
100,000
120,000
Date
Missing data
Stormevent
Sept. 25 Apr. 12 June 1 July 21 Sept. 9 Oct. 29 Dec. 18 Feb. 6Nov. 14 Jan. 3
2009
Feb. 22
20082007
Figure 13. temporal variation of specific conductance as measured at station 50113615, November 2007–May 2008, southern Puerto Rico.
Specific conductance at station 50113615 November 2007–May 2008
Discrete monthly measurement
EXPLANATION
Spec
ific
cond
ucta
nce,
in m
icro
siem
ens
per c
entim
eter
Figure 14. Salinity and water stage at station 50113615, December 5–10, 2008, southern Puerto Rico.
Figure 13. Temporal variation of specific conductance as measured at station 50113615, November 2007–May 2008, southern Puerto Rico.
Figure 14. Salinity and water stage at station 50113615, December 5 –10, 2008, southern Puerto Rico.
22 Hydrogeology and Hydrology of the Punta Cabullones Wetland Area, Ponce, Southern Puerto Rico, 2007– 08
Subsurface GeologyHistorical lithologic logs and information obtained from
boreholes drilled for the piezometers indicate the general shallow (equal to or less than 100 ft deep) subsurface distri-bution of the main sedimentary facies in the Punta Cabullones area (fig. 15). The uppermost strata in the subsurface consist predominantly of very fine- to medium-grained sand, with minor interbeds of coarse and pebbly-lithic sand. Locally the upper most strata may be overlain by a surficial zone of medium-brown clayey soil ranging in thickness from 3.9 to 9.8 ft. This clayey soil (for example in PN3) may include caliche, a calcium carbonate residue formed by evaporation. The uppermost unit of very fine- to medium-grained sand varies spatially between 24.9 and 44.9 ft in thickness and with depth may become
clayey or interbedded with thin clay beds. This uppermost unit is underlain and largely replaced at PN2 and PN3 by a stratum of coarse to pebbly, poorly consolidated to non-consolidated, calcareous coarse-grained and pebbly skeletal sand that may have been a shoal deposit or may have been deposited during a high-energy event such as a storm. Although the maximum depth of the deeper piezometers was 100 ft, at PN1, lithologic data indicate that a sequence of lithic and pebbly sand with skeletal sand similar to those described above extends to a depth of about 400 ft at the CPR-3 oil test well, which was drilled near the shoreline in the 1960s (Commonwealth of Puerto Rico Number 3; fig. 1B). Limestone, presumed to be the subsurface time equivalent to the limestone of middle Tertiary age that is exposed to the north of the study area, was found at depths greater than 400 ft at CPR-3.
Figure 15. Lithologic logs showing main shallow sedimentary facies and screened intervals in the Punta Cabullones study area, southern Puerto Rico. The location and identification numbers of piezometers are shown in figure 1 and presented in table 1, respectively.
Dept
h be
low
land
sur
face
, in
feet
PN1 PN2 PN3
Clay-claystone
Screen PN3S
Screen PN3D
Screen PN2S
Meansea
level
Meansea
level
Meansea
level
Screen PN2D
Screen PN1S
Screen PN1D
EXPLANATION
Lithology
Sand with gravel
Clayey sand
Fossiliferous sand
Silty sand
Fossiliferous clayey sand
Screened interval
20
40
60
80
100
20
40
60
20
40
60
80
Figure 15. Lithologic logs showing main shallow sedimentary facies and screened intervals in the Punta Cabullones study area, southern Puerto Rico (location and identification numbers of piezometers are shown in fig. 1 and listed in table 1, respectively).
Hydrogeology 23
The sequence of rock types in samples collected from the boreholes drilled for the piezometers and those registered in the historical log of oil test well CPR-3, as well as the current spatial distribution of surficial lithologic facies and ecotones within Punta Cabullones, results from a prograding coastline in a high sea-level stand. A transition occurs from predomi-nantly marine conditions (middle to inner carbonate platform), to a mixed marine-terrestrial environment (near-shore settings such as a back-reef lagoon, tidal-mud flats, tidal inlets, and beach deposits), and then to a final phase in which terrestrial conditions predominate with more of a fluvial-type deposition, such as interfan alluvial deposits, toward the northernmost part of the study area.
HydrogeologyThe main groundwater type within the Punta Cabullones
area varies from a calcium-bicarbonate type in the northern-most part to a predominantly sodium-potassium-chloride type southward. The stable isotopic composition provides evidence that most of the salinity within the Punta Cabullones area is due to high evaporation of meteoric water with dissolved paleosalts. The stable isotopic composition also indicates that the role of modern seawater in the formation of these saltflats, although locally important, is secondary to that of dissolved paleosalts.
Groundwater flow within the relic shorelines area of Punta Cabullones is driven by density differences caused by the high salinity. The highly dense hypersaline groundwater and surface water may induce a convective-cell-type move-ment of groundwater with distinctive vertical flow compo-nents—upward and downward groundwater flows.
Groundwater occurs within beds composed predomi-nantly of silisiclastic sands and gravels with minor amounts of calcium carbonate. Depth to groundwater is generally less than 4 ft below land surface. Salinity decreases downward, at least to a depth of 100 ft below land surface. Evapotranspiration accounts for most of the groundwater withdrawn within the Punta Cabullones area.
Groundwater Quality
The temporal and spatial distribution of salinity serves as an overall first indicator of the groundwater quality within the Punta Cabullones study area. Salinity contours and profiles indicate a decrease in salinity with depth at all of the piezo-meter nests (figs. 16 and 17). Salinity generally decreases with distance from the center of a hypersaline mound. The influx of seawater and freshwater reduces the hyper-salinization effect of ET in the study area. In all three piezometer nests, the salinity is lower in the deepest piezometer than in the shallow piezometer in each nest. The decrease in salinity from the shallow to the deep piezometers could result from the higher ET effect on the shallow aquifer and surficial sediments laden with paleosalts.
Historical groundwater-quality data for the Punta Cabullones area are limited to SC values included in the report by Bennet (1972). These SC values ranged from 2,000 to 7,000 µS/cm in test holes located within 1,500 ft of the coastline and generally penetrating to depths just below the water table. SC values during 2008 at these same depths below the water table and approximately at the same distance from the coast generally exceeded 20,000 µS/cm. These high SC values probably result from seawater intrusion induced by reduction in regional groundwater flow caused by an increased and sustained groundwater withdrawal north of the study area since the 1970s (fig. 1B).
Water samples were collected from select wells and surface-water sites within the Punta Cabullones area for major ion composition analysis (table 3). The main groundwater type in the southern portion of the Punta Cabullones area (Punta Cabullones wetland and saltflats subarea) is characterized as a sodium-potassium-chloride type. In the northern portion (fan-delta and alluvial deposits) of the study area, the predominant groundwater type is a calcium-bicarbonate type (fig, 18). The sodium-potassium-chloride type is representative of the saline to hypersaline groundwater in the Punta Cabullones wetland area, whereas the calcium-bicarbonate type corresponds to the freshwater of the regional groundwater flow system in the northern part of the study area.
24 Hydrogeology and Hydrology of the Punta Cabullones Wetland Area, Ponce, Southern Puerto Rico, 2007– 08
Punta Carenero
Caleta de Cabullónes
Roca Ahogado
Playade
Ponce
Playade
Ponce
Punta Cabullónes
Caribbean Sea
Río
Buc
aná
BucanáBucaná
1
0 0.5 1.0 1.5 KILOMETERS
0 0.50.25 0.75 MILE
Orthophoto base from the U.S. Army Corps of Engineers, Ponce and Playa de Ponce, 1:24,000, 2007Lambert conformal conic projection, Puerto Rico datum
Restauradawell field
52
66°37'
17°59'30"
17°58'30"
17°57'30"
66°36' 66°35' 66°34'
75
5050
100100
75
5050
(81)
(30)
(73)
(7)
(79)
(73)
(105)
(120)
(93)
1111
99
77
1515
1313
44
12121616
1717
22
1414
1155
881010
Figure 16A. Spatial distribution of groundwater salinity in the Punta Cabullones wetland subarea at (A) a depth of 20 feet below land surface and (B) depths between 20 and 100 feet below land surface, March 26–28, 2008, southern Puerto Rico.
50EXPLANATION
Well type and identifier—Number in parentheses is salinity value, in parts per thousandApproximate line of equal salinity—In parts per thousand
50
Piezometer nest
Well point 722 (81)(120)Agricultural well 4Test hole121 (7)
A
Figure 16. Spatial distribution of groundwater salinity in the Punta Cabullones wetland subarea at (A) a depth of 20 feet below land surface and (B) depths between 20 and 100 feet below land surface, March 26 –28, 2008, southern Puerto Rico.
Hydrogeology 25
Punta Carenero
Caleta de Cabullónes
Roca Ahogado
Playade
Ponce
Playade
Ponce
Punta Cabullónes
Caribbean Sea
Río
Buc
aná
BucanáBucaná
1
0 0.5 1.0 1.5 KILOMETERS
0 0.50.25 0.75 MILE
Orthophoto base from the U.S. Army Corps of Engineers, Ponce and Playa de Ponce, 1:24,000, 2007Lambert conformal conic projection, Puerto Rico datum
Hwy. 1
Restauradawell field
52
66°37'
17°59'30"
17°58'30"
17°57'30"
66°36' 66°35' 66°34'
2020
1010
(2.2)
(5)
(25)
1111
99
771515
1313
44
12121616
1717
221414
1155
881010
Figure 16B. Spatial distribution of groundwater salinity in the Punta Cabullones wetland subarea at (A) a depth of 20 feet below land surface and (B) depths between 20 and 100 feet below land surface, March 26–28, 2008, southern Puerto Rico.
50EXPLANATION
Well type and identifier—Number in parentheses is salinity value, in parts per thousandApproximate line of equal salinity—In parts per thousand
50
Piezometer nest
Well point 7 Agricultural well 422 (2.2)(25)Test hole121 (5)
B
Figure 16. Spatial distribution of groundwater salinity in the Punta Cabullones wetland subarea at (A) a depth of 20 feet below land surface and (B) depths between 20 and 100 feet below land surface, March 26 –28, 2008, southern Puerto Rico.—Continued
26 Hydrogeology and Hydrology of the Punta Cabullones Wetland Area, Ponce, Southern Puerto Rico, 2007– 08
Figure 17. Temporal variation of specific conductance at selected piezometers in the Punta Cabullones study area during 2007–2008.
0
50,000
100,000
150,000
Spec
ific
cond
ucta
nce,
in m
icro
siem
ens
per c
entim
eter
PN1S
EXPLANATIONPiezometer
PN2SPN1DPN2DPN3SPN3D
April August November February June September December
2007 2008Date
Figure 17. Temporal variation of specific conductance at selected piezometers in the Punta Cabullones study area during 2007–08.
Figure 18. Piper diagram showing the main groundwater types within the Punta Cabullones study area.
Groundwater level at PN2SGroundwater level at PN2D
Groundwater temperature at PN2SGroundwater temperature at PN2D
Air temperature
Figure 19. Air temperature measured at station 50113610 and groundwater temperatures and groundwater levels at (A) PN1S and PN1D and at (B) PN2S and PN2D and (C) groundwater temperature at PN1S and PN1D, southern Puerto Rico.
A
B
20
21
22
23
24
25
26
27
28
29
30
31
–1
0
1
2
3
4
5
6
Figure 19. Air temperature measured at station 50113610 and groundwater temperatures and groundwater levels at (A) PN1S and PN1D and at (B) PN2S and PN2D, and (C) groundwater temperature at PN1S and PN1D, southern Puerto Rico.
Hydrogeology 29
Figure 19. Air temperature measured at station 50113610 and groundwater temperatures and groundwater levels at (A) PN1S and PN1D and at (B) PN2S and PN2D and (C) groundwater temperature at PN1S and PN1D, southern Puerto Rico.—Continued
C
1516171819202122232425262728293031
March 8, 2008
Tem
pera
ture
, in
degr
ees
Cels
ius
Date
Air temperature
PN1SGroundwater temperature
EXPLANATION
PN1D
Figure 19. Air temperature measured at station 50113610 and groundwater temperatures and groundwater levels at (A) PN1S and PN1D and at (B) PN2S and PN2D, and (C) groundwater temperature at PN1S and PN1D, southern Puerto Rico.— Continued
The variation during 2008 in the groundwater tempera-ture within the Punta Cabullones area is shown in figures 19A and 19B. At piezometer PN1D, the average groundwater temperature was higher than the average air temperature throughout most of the dry season (January 2008 through early May 2008). However, during the rest of 2008, the water temperature at PN1D was lower than the air temperature. Also, the groundwater temperatures at PN1S and PN1D either respond slightly or do not respond at all to the diurnal fluctuations of air temperature during a typical dry day such as March 8, 2008 (fig. 19C ). The groundwater temperature decreases with depth at PN1 and is generally higher at the shallow piezometer, PN1S, than at the deep piezometer, PN1D; this difference in temperature could be caused by the decreasing effect with depth of the sun’s heat and the higher influx of cooler regional groundwater flow at PN1D than at PN1S (fig. 19A). At PN1, the average difference in ground-water temperature between the shallow and deep piezometers during dry weather may reach 2 °C.
The partial record of water temperature data for PN2 indicates that the difference in the average groundwater temperature between the deep and shallow piezometers is less than 1 °C during dry months or months with little rain (fig. 19B ). Note that the difference in temperature with depth between the shallow and deep piezometers at PN2, as measured and registered in the pressure transducers and data loggers, is less than at PN1 (figs. 19A and 19B). The difference in groundwater temperature between the shallow and deep piezometers from monthly discrete measurements with depth at PN1 and PN2 ranges from 0.9 to 1.3 °C. The complex interaction of various factors such as the cooling effects of sea breezes on the air and the differences in heat capacity
among freshwater, saline water, air, and land may explain the occurrence of a higher temperature at PN1 than that of the air measured at station 50113610 (fig. 19C ). During the rainy months, the average water temperature at PN2S could be lower than the air temperature because of the cooling effects of recharging rainfall (fig. 19B).
Stable Isotopic Composition
The stable isotopes of oxygen and hydrogen occur naturally, and the ratios are used mainly as tracers of ground-water source areas and as indicators of surface and shallow groundwater evaporation. Isotopic fractionation is the process by which the stable isotopic content of a substance changes as a result of evaporation, condensation, freezing, melting, and biological processes (Clark and Fritz, 1999). The condensation-precipitation history of the atmospheric water controls the 18O and 2H content of precipitation. As a result, there are strong continental trends in the average annual isotopic composition of precipitation and a strong seasonal variation in the time-averaged isotopic composition of precipitation at a given location. The ratios 18O/16O and 2H/1H are expressed as δ18O (delta 18O) and δ2H (delta deuterium; shortened as δD), respectively, and are reported as per mil (‰) normalized with respect to Vienna Standard Mean Oceanic Water (VSMOW). The δ18O and δD obtained from global precipitation surveys correlate according to the relation δ2H(‰)=8 δ18 O +10, known as the global meteoric water line (GMWL) (Clark and Fritz, 1997). Linear correlations between δ18O and δ2H with coef-ficients slightly different from that of the GMWL are obtained from isotopic surveys of local precipitation.
30 Hydrogeology and Hydrology of the Punta Cabullones Wetland Area, Ponce, Southern Puerto Rico, 2007– 08
The δ18O and δD of soil water, shallow groundwater, and surface water become increasingly positive with respect to VSMOW when affected by evaporation. Evaporation preferentially removes the light isotopes, 16O and 1H, while the remaining liquid water becomes enriched in 18O and 2H. The evaporation effect is expressed as a departure from the global and local meteoric water lines.
Samples collected for stable isotope analysis at the Punta Cabullones area included monthly rainfall composites from the Bucaná meteorological station (50113610), groundwater, and surface water and seawater from the Caribbean Sea (table 4; fig. 20). Groundwater isotopic-composition data were also obtained for the Platanal well, located north of the study area and representative of the regional groundwater flow system. The stable isotopic data collected and analyzed during this study indicate temporal and spatial variations in the δ18O and δD in the groundwater, surface water, and precipitation. The exception is the seawater samples, in which the temporal variations in the δ18O and δD are minimal. The isotopic data indicate that the surface water within Punta Cabullones is a mixture of seawater and meteoric water strongly affected by evaporation as indicated by its significant offset from the local meteoric water line. The correlation plots of the δ18O and δD indicate a predominant meteoric-water origin for the groundwater at PN1D and Platanal well, whereas the water at PN1S originates mostly as a varying mixture of meteoric water, which is slightly to moderately affected by evaporation, and modern seawater. According to the isotopic-composition data, the contribution of meteoric water at PN2S and PN2D
is subordinate to that of modern seawater. The groundwater at PN3S originates as a mixture of modern seawater with a subordinate amount of meteoric water highly affected by evaporation. Groundwater at PN3D might also originate as modern seawater but is mixed with a higher fraction of meteoric water than the groundwater at PN3S. The meteoric water at PN1S and PN1D may originate as local direct rainfall or regional groundwater flow from north of the study area as is the case in the Platanal well; however, the meteoric water present at the other piezometers and well points likely originate solely from local direct rainfall.
The temporal variations in the δ18O and δD in precipitation result from the differences in the origin and evolution of the vapor source producing the rain (Clark and Fritz, 1997). In the case of the Punta Cabullones area and Puerto Rico in general, the precipitation highly enriched in the lighter isotopes (16O and 1H) originates or results mostly from cold fronts moving east from as far away as the continental United States and Canada. In some cases, the precipitation highly enriched in the lighter isotopes of oxygen and hydrogen may be associated with the passage of tropical disturbances originating near the equatorial coast of Africa. In this last case, the enrichment in the lighter isotopes may result from the cooling effects that the air mass experiences at high altitudes (Clark and Fritz, 1997). A groundwater sample was collected from PN1S after rainfall associated with a cold front that affected Puerto Rico on December 7, 2008. The δ18O and δD of –8.31 and –52.54 ‰, respectively, in the sample attest to the recharging effect that a rainfall event of considerable magnitude could have on the aquifer.
y=7.6914x+9.9622 R2=0.99136
Trendline equation for rainfallRainfall tr
endline
y=4.6604x+1.1217 R2=0.99662
Trendline equationfor surface water
Surface-water trendline
–80
–70
–60
–50
–40
–30
–20
–10
0
10
20
30
40
50
Del
ta d
eute
rium
, in
part
s pe
r mil
–12 –10 –8 –6 –4 –2 0 2 4 6 8 10
Figure 20. Deuterium and oxygen-18 concentrations in the groundwater, surface water, and rainfall within the Punta Cabullones study area, southern Puerto Rico. Data values are listed in Table 4.
Delta oxygen-18, in parts per mil
PN1S
EXPLANATIONSelected site
PN1D PN2S PN2D PN3S PN3D
PlatanalWP4
SeawaterMonthly rainfall composites
Surface water
Figure 20. Deuterium and oxygen-18 concentrations in the groundwater, surface water, and rainfall within the Punta Cabullones study area, southern Puerto Rico (data values are listed in table 4).
Hydrogeology 31
Table 4. Delta oxygen-18 and delta deuterium concentrations in samples from selected wells and surface-water sites, and in monthly rainfall composites from the Bucaná meteorological station, Punta Cabullones study area, 2007–08.
[Concentrations shown are per mil, normalized with respect to VSMOW]
Table 4. Delta oxygen-18 and delta deuterium concentrations in samples from selected wells and surface-water sites, and in monthly rainfall composites from the Bucaná meteorological station, Punta Cabullones study area, 2007–08.—Continued
[Concentrations shown are per mil, normalized with respect to VSMOW]
Hydrogeology 33
Groundwater Occurrence
Groundwater in the Punta Cabullones area is contained within sand and minor gravel strata (fig. 15). Groundwater is also within the skeletal calcareous sand. During the study, the groundwater elevation (above mean sea level without correction to equivalent freshwater heads or elevations) varied according to the seasonal changes in rainfall; the elevation was higher during the rainy months between August and November and lower during the drier months of February and March (fig. 21). The difference in groundwater elevation between the
dry and wet season averaged about 2 ft. The maximum eleva-tion of groundwater was about 3.9 ft amsl at PN1D. During the rainy season, the water levels at the deep and shallow piezometers occasionally intersected and even rose above the land surface. The groundwater levels at PN1 and PN3 exhibit an artesian-like response, with an upward decrease in saline hydraulic head between the deep and the shallow piezometer. At the PN2 site, however, the incomplete record indicated that the head is higher in the shallow piezometer than in the deeper piezometer, which suggests that the saline water head diminishes with depth.
Figure 21. Temporal variations in groundwater levels at the piezometers PN1, PN2, and PN3S in the Punta Cabullones study area, southern Puerto Rico.
34 Hydrogeology and Hydrology of the Punta Cabullones Wetland Area, Ponce, Southern Puerto Rico, 2007– 08
Isotopic data presented in figure 20 indicate that modern seawater does not significantly affect the groundwater at PN1 and has a minimal to moderate affect at PN2. Seawater is present at PN3 at a depth within 40 ft below land surface, which could indicate that the basal seawater interface does extend beyond PN3 but may not have fully reached the PN1 site by the time of this study (2008–2009). At present, no subsurface hydrologic data indicate that the seawater interface is below a depth of 100 ft below land surface at piezometers PN1 and PN2. Groundwater flow modeling studies by Bennet (1972) predicted that elimination of furrow irrigation, which was the main recharge source to the aquifer, and the subse-quent increase of groundwater withdrawal for public supply north of the Punta Cabullones area during the 1970s would cause a major landward shift of the basal seawater zone with an accompanying depletion of the fresh groundwater zone and cessation of offshore groundwater discharge. As of 2008, available water-quality and isotopic data do not conclusively indicate whether complete interception of the shoreward groundwater flow has occurred and only meteoric water in storage is available, or if groundwater flow is still entering the Punta Cabullones area. Isotopic data collected during this study indicate that meteoric water still predominates at the Platanal well and is a major component at piezometer PN1. Isotopic data also indicate that a minor seawater component is moving toward piezometer PN1, either by storm runoff or as a result of seawater intrusion. At the Platanal well, the concentrations of dissolved solids and chloride have increased from 561 to 995 micrograms per liter (µg/L) and from 150 to 287 µg/L, respectively, from 1964 to 2011 (J.M. Rodríguez, U.S. Geological Survey, written commun., 2013). Additional field work would be needed to confirm if localized seawater intrusion is occurring.
Groundwater MovementThe general direction of the regional groundwater flow
in the Ponce coastal area, which includes Punta Cabullones, is southward toward the coast (Bennet, 1972; Rodriguez-Martinez and others, 2005). Stable-isotopic, chemical, and hydraulic-head data indicate that fresh groundwater from the regional flow system to the north of the study area could still be entering the Punta Cabullones area. However, the ground-water movement within the Punta Cabullones wetland—within the relic shorelines, saltflats, and mangroves area—is complex and cannot be defined with the simple form of Darcy’s equation that assumes constant density (Fan and others, 1997). Due to variations in salinity, both vertically and horizontally, groundwater flow within the Punta Cabullones area is assumed to be mainly driven by density variations. In addition to high ET, other factors within the study area that may add to the complexity of groundwater flow include changes in sea stage resulting from barometric pressure variations, tidal fluctuations, and storm surges. Groundwater flow in the Punta Cabullones area may also be affected by spatial and temporal variations in rainfall recharge.
Changes in Sea Stage and Barometric Pressure
In general, the magnitude of the response of the ground-water levels within the Punta Cabullones area to the marine tides and related abnormal sea-wave activity depends on the distance from the shoreline and from any of the wetland channels within the study area. In particular, the effects of sea tides on the groundwater levels are even greater if the nearby channel’s connection to the sea is not blocked by sediment. The attenuation of the marine tide within a channel that is well connected to the shore is substantially less than that through the aquifer-mineral matrix; the attenuation of the tidal signal increases as the permeability of the aquifer decreases. Piezometer nest PN1 is located farthest inland and highest above mean sea level of any of the piezometers used for this study and is near a poorly connected channel to the sea. At piezometers PN1D and PN1S, the groundwater level increased by 1.6 ft and 1 ft, respectively, as a response to the increase in sea stage induced by a weather disturbance that passed near the south coast in December 2007 (fig. 22). The maximum response of the water level at PN1S and PN1D to the tidal fluctuation registered at the Ponce Harbor (and mimicked at station 50113625) after the passage of that weather disturbance was an increase of about 0.1 ft. This slight sensitivity of the groundwater level at PN1 to tidal fluctuations may be explained by the water head in this piezometer nest being higher than the maximum tidal ranges occurring in the Punta Cabullones area. The minimal changes in water temperature at PN1S and PN1D suggest that the minor fluctuations of the water level could be minor pulses caused by backwater effects induced during the rising tide component (flood flow) and that actual seawater does not make its way to PN1 as indicated by isotopic and chemical data already discussed.
The effect on the groundwater level at PN2S of the same weather disturbance on December 10, 2007, was an increase in groundwater level of about 2 ft (fig. 23A). The response of groundwater at PN2S to tides during high sea-stage events is stronger than at PN1S, with groundwater level changes up to 0.2 ft (fig. 23A). This stronger response at piezometer PN2S than at piezometer PN1S could result from the hydraulic continuum established between the aquifer and the nearby channel during above-normal wave activity. This hydraulic connection allows the tidal fluctuation to be transmitted along the channel toward piezometer PN2S. This stronger response to tidal fluctuations at piezometer PN2S than at piezometer PN1S during high-water events could also be due to the fact that piezometer PN2S is at a lower elevation than PN1S; thus, the water level at PN2S is at a lower elevation. During fair weather, or when the inlet/outlet to the sea of the nearest channel is blocked by a sand bar, the response of the groundwater level at PN2S to tides, as at PN1S, is minimal (fig. 23B and 23C).
Figure 22. Groundwater level and temperature at (A) PN1D and (B) PN1S, tidal stage at Ponce Harbor(station 50114730), and water stage at station 50113625 during and after a weather disturbance, December 7–December 17, 2007.
Figure 22. Groundwater level and temperature at (A) PN1D and (B) PN1S, tidal stage at Ponce Harbor (station 50114730), and water stage at station 50113625 during and after a weather disturbance, December 7–17, 2007.
36 Hydrogeology and Hydrology of the Punta Cabullones Wetland Area, Ponce, Southern Puerto Rico, 2007– 08
Water level at PN2STidal stage at Ponce Harbor Water stage at station 50113615 Water temperature
Wat
er le
vel,
in fe
et a
bove
or b
elow
(–) m
ean
sea
leve
l
Figure 23. Relation of the groundwater level and temperature at PN2S, tidal stage at Ponce Harbor (station 50114730), and water stage at station 50113615 (A) during a time period that included a weather disturbance on December 10, 2007, (B) during dry and fair weather prior to a weather disturbance on September 21, 2008, and (C) during dry weather in January 2008.
A
Figure 23. Relation of the groundwater level and temperature at PN2S, tidal stage at Ponce Harbor (station 50114730), and water stage at station 50113615 (A) during a time period that included a weather disturbance on December 10, 2007, (B) during dry and fair weather prior to a weather disturbance on September 21, 2008, and (C) during dry weather in January 2008.
Hydrogeology 37
The strongest response of the groundwater level to tidal fluctuations during normal weather conditions and high-energy events was registered at PN3S (fig. 24). Piezometers PN2 and PN3 are almost at the same distance from the coastline, but PN3 was installed near two channels that are well connected to the sea, as shown in figure 1B.
Measurable rapid changes in the temperature of ground-water at a particular site may indicate the sudden influx of surface water (figs. 22–24). In a coastal setting, temperature fluctuations may indicate subsurface inflow or surface infiltration of seawater as well as recharge from rainfall. Minor cyclical fluctuations in temperature occur at the piezometers
30.5
30.2
30.1
30.3
30.4
29.9
29.85/2/08 5/12/08 5/22/08 6/1/08
Date6/11/08 6/21/08 7/1/08
30.0
0
0.2
0.4
0.6
Wat
er le
vel,
in fe
et a
bove
mea
n se
a le
vel
Tem
pera
ture
, in
degr
ees
Cels
ius
0.8
1.0
1.2
1.4
1.6
1.8
2.0
2.2
2.4
Water level at PN3S
Ponce Harbor tidal stage
EXPLANATION
Water stage at station 50113615Groundwater temperature
Figure 24. Groundwater levels and water temperature at PN3S, tidal stage at Ponce Harbor (station 50114730), and water stage at station 50113615 during a period that included a rainfall event on June 2, 2008.
PN2S and PN3S and usually coincide with the response of groundwater levels to tidal fluctuations. Such in-phase (or near in-phase) occurrences of temperature and groundwater level fluctuations attest to the regular influx of water from tides. At piezometer nest PN1, temperature fluctuations caused by the tidal cycle are extremely small or absent and are not usually discernible from those caused by other factors, such as the normal daily variations in solar radiation. However, the decreases in temperature at piezometer PN1 and at the other piezometers that are caused by rainfall recharge are substantially greater than decreases in temperature caused by tidal fluctuation or any other factor.
Figure 24. Groundwater levels and water temperature at PN3S, tidal stage at Ponce Harbor (station 50114730), and water stage at station 50113615 during a period that included a rainfall event on June 2, 2008.
38 Hydrogeology and Hydrology of the Punta Cabullones Wetland Area, Ponce, Southern Puerto Rico, 2007– 08
759.5
760.0
760.5
761.0
761.5
762.0
762.5
763.0
763.5
764.0
764.5
Baro
met
ric p
ress
ure,
in m
ilim
eter
s of
mer
cury
1/23/08 1/24/08
Time
1.65
1.66
1.67
1.68
1.69
1.70
1.71
1.72
3.315
3.325
3.335
3.345
3.355
3.365
3.375
Wat
er-le
vel e
leva
tion
at P
N1D
,in
feet
abo
ve m
ean
sea
leve
l
Wat
er-le
vel e
leva
tion
at P
N1S
, in
feet
abo
ve m
ean
sea
leve
l 02
0004
0006
0008
0010
0012
0014
0016
0018
0020
0022
0000
0002
0004
0006
0008
0010
0012
0014
0016
0018
0020
0022
00
Figure 25. Groundwater levels at PN1D and PN1S and the barometric pressure measured at station 50113610, January 23–24, 2008, in the Punta Cabullones study area, southern Puerto Rico.
PN1D
PN1S
Figure 25. Groundwater levels at PN1D and PN1S and the barometric pressure measured at station 50113610, January 23 –24, 2008, in the Punta Cabullones study area, southern Puerto Rico.
The groundwater levels within the Punta Cabullones area respond to daily fluctuations in barometric pressure occurring during fair weather (non-stormy weather with normal wave and tidal activity), as shown in figure 25. The response of the groundwater level is a mirror image of the variation in barometric pressure; the water level increases and decreases with decreases and increases in barometric pressure.
Groundwater levels may change up to a maximum of about 0.03 ft in response to a fluctuation in barometric pressure of 0.5 millimeter of mercury (mm Hg). The effects of barometric pressure persist with depth as evidenced by the responses of groundwater levels at piezometers PN1S and PN1D. However, the effect of changes in barometric pressure seems to decrease with depth.
Hydrogeology 39
Variations in Groundwater Density: Conversion of Saline-Water Heads Into Equivalent Freshwater Heads
Hydrometers with variable specific conductance values were used to originally determine groundwater densities within the study area. The following empirical relation between SC and density of groundwater was obtained by linear regression modeling and was used to obtain the density values of groundwater within the Punta Cabullones study area:
Specific conductance, in microsiemens per centimeter
Figure 26. Specific conductance and water density in the Punta Cabullones study area, southern Puerto Rico. Data are listed in table 5.
Table 5. Selected physical characteristics of groundwater used to determine the specific conductance and density relation for the Punta Cabullones study area, 2007–08 (see figure 26).
[°F, degrees Fahrenheit; µs/cm, microsiemens per centimeter; g/cm3, grams per centimeter]
where density is in grams per cubic centimeter, SC is in microsiemens per centimeter
(µS/cm), and R2 is the coefficient of correlation
(fig. 26; table 5; appendix fig. 1–2).
Figure 26. Specific conductance and water density in the Punta Cabullones study area, southern Puerto Rico (data are listed in table 5).
40 Hydrogeology and Hydrology of the Punta Cabullones Wetland Area, Ponce, Southern Puerto Rico, 2007– 08
Temporal variations in groundwater density at various piezometers within the study area are shown in figure 27. The groundwater densities correspond to the screened interval of each piezometer and range from about 1.1 gram per cubic centimeter (g/cm3) at piezometer PN1D to about 2.2 g/cm3 at piezometer PN2S. In general, groundwater density is higher in the shallow piezometers than in the deep piezometers because specific conductance and salinity are greater near land surface and decrease with depth.
The following equation obtained from Guo and Langevin (2002) was used to convert saline-water heads into equivalent freshwater heads to account for the density variations in the groundwater of the Punta Cabullones area:
hf = ( ρ/ρf ) h – [(ρ – ρf ) /ρf ] Z, (3)
where hf is the equivalent freshwater head, in feet
above mean sea level, ρf is the freshwater density, in grams per
cubic centimeter, ρ is the density of the saline water, in
grams per cubic centimeter, h is the total head of saline water, in
feet above mean sea level, and Z is the elevation of the head-measuring
point, in feet above mean sea level.
1
1.05
1.1
1.15
1.2
1.25
Grou
ndw
ater
den
sity
, in
gram
s pe
r cub
ic c
entim
eter
0
0.5
1.0
1.5
2.5
2.0
Date
PN1D
PN3D
PN2D
PN1S
PN3S
PN2S
4/28/2
007
6/17/2
007
8/6/20
07
9/25/2
007
11/14
/2007
9/9/20
08
7/21/2
008
6/1/20
08
4/12/2
008
2/22/2
008
1/3/20
08
0
0.2
0.4
0.6
0.8
1.0
1.2
1.4
1.6
1.8
WP4
WP5WP2
WP1
0
0.5
1.0
1.5
2.5
2.0
Date
4/28/2
007
6/17/2
007
8/6/20
07
9/25/2
007
11/14
/2007
9/9/20
08
7/21/2
008
6/1/20
08
4/12/2
008
2/22/2
008
1/3/20
08
Figure 27. Temporal and spatial variation of groundwater density in the Punta Cabullones study area, southern Puerto Rico.
Figure 1–2 in appendix 1 presents the estimated equivalent freshwater heads for the Punta Cabullones area. A potentio-metric surface, expressed in equivalent freshwater equivalent heads, and groundwater flow directions were then calculated for the Punta Cabullones area (fig. 28). The reliability of groundwater flow directions rests on the assumption that the elevations of the various wells used as data points are nearly the same (W.E. Sanford, U.S. Geological Survey, written commun., 2010). This condition is met in the Punta Cabullones area where the difference in elevation between the highest and lowest well does not exceed 1.98 ft. In addition, the reliability of the estimated potentiometric surface and resulting groundwater flow directions could be compromised if the relation described below does not apply to high salinity values, such as those in the Punta Cabullones area. Also, given the substantial varia-tion with depth of groundwater density, (fig. 27), the estima-tion of vertical hydraulic gradients in the Punta Cabullones area is not feasible with the data currently available (W.E. Sanford, U.S. Geological Survey, written commun., 2010).
The configurations of the potentiometric-surface maps and the inferred general groundwater flow directions based on equivalent freshwater heads (EFHs) are similar for the shallow and deep piezometers during both the dry and wet seasons. The EFHs in an area near piezometer PN2 are the highest in the Punta Cabullones area. This finding implies a predominant outward groundwater flow from the area around piezometer PN2. The patterns of the distribution of EFHs and estimated groundwater flow directions are similar to that of salinity
Figure 27. Temporal and spatial variation of groundwater density in the Punta Cabullones study area, southern Puerto Rico.
Hydrogeology 41
Punta Carenero
Caleta de Cabullónes
Roca Ahogado
Playade
Ponce
Playade
Ponce
Punta Cabullónes
Caribbean Sea
Río
Buc
aná
BucanáBucaná
1
0 0.5 1.0 1.5 KILOMETERS
0 0.50.25 0.75 MILE
Orthophoto base from the U.S. Army Corps of Engineers, Ponce and Playa de Ponce, 1:24,000, 2007Lambert conformal conic projection, Puerto Rico datum
Restauradawell field
52
66°37'
17°59'30"
17°58'30"
17°57'30"
66°36' 66°35' 66°34'
1111
99
77
1515
1313
44
12121616
1717
22
1414
55
55
1010
(2.3)
(5.3)
(13.3)
(4.0)
Figure 28A. Potentiometric surface of the Punta Cabullones wetland subarea in equivalent freshwater heads during the wet season (Oct. 10, 2008) corresponding to a depth (A) less than 20 feet below land surface and (B) greater than 20 feet below land surface and during the dry season (March 26–28, 2008) corresponding to a depth (C) less than 20 feet below land surface and (D) greater than 20 feet below land surface.
(2.5)
1155
881010
EXPLANATIONWell type and identifier—Number in parentheses is equivalent freshwater, in feet
Piezometer nest
Well point 7 Agricultural well 422Test hole121(13.3) (5.3)(4.0)
Approximate potentiometric contour—Shows equivalent freshwater heads, in feet above mean sea level. Contour interval 5 feet
505
A
Figure 28. Potentiometric surface of the Punta Cabullones wetland subarea in equivalent freshwater heads during the wet season (October 10, 2008) corresponding to a depth (A) less than 20 feet below land surface and (B) greater than 20 feet below land surface, and during the dry season (March 26 –28, 2008) corresponding to a depth (C) less than 20 feet below land surface and (D) greater than 20 feet below land surface.
42 Hydrogeology and Hydrology of the Punta Cabullones Wetland Area, Ponce, Southern Puerto Rico, 2007– 08
Punta Carenero
Caleta de Cabullónes
Roca Ahogado
Playade
Ponce
Playade
Ponce
Punta Cabullónes
Caribbean Sea
Río
Buc
aná
BucanáBucaná
1
0 0.5 1.0 1.5 KILOMETERS
0 0.50.25 0.75 MILE
Orthophoto base from the U.S. Army Corps of Engineers, Ponce and Playa de Ponce, 1:24,000, 2007Lambert conformal conic projection, Puerto Rico datum
Restauradawell field
52
66°37'
17°59'30"
17°58'30"
17°57'30"
66°36' 66°35' 66°34'
1111
99
77
1515
1313
44
12121616
1717
22
1414
(6.8)(19.6)
(41.7)
10102020
3030
4040
Figure 28B. Potentiometric surface of the Punta Cabullones wetland subarea in equivalent freshwater heads during the wet season (Oct. 10, 2008) corresponding to a depth (A) less than 20 feet below land surface and (B) greater than 20 feet below land surface and during the dry season (March 26–28, 2008) corresponding to a depth (C) less than 20 feet below land surface and (D) greater than 20 feet below land surface.
1155
881010
EXPLANATIONWell type and identifier—Number in parentheses is equivalent freshwater, in feet
Piezometer nest
Well point 7 Agricultural well 422Test hole121(41.7) (6.8)(19.6)
Approximate potentiometric contour—Shows equivalent freshwater heads, in feet above mean sea level. Contour interval 10 feet
5010
B
Figure 28. Potentiometric surface of the Punta Cabullones wetland subarea in equivalent freshwater heads during the wet season (October 10, 2008) corresponding to a depth (A) less than 20 feet below land surface and (B) greater than 20 feet below land surface, and during the dry season (March 26 –28, 2008) corresponding to a depth (C) less than 20 feet below land surface and (D) greater than 20 feet below land surface. —Continued
Hydrogeology 43
Punta Carenero
Caleta de Cabullónes
Roca Ahogado
Playade
Ponce
Playade
Ponce
Punta Cabullónes
Caribbean Sea
Río
Buc
aná
BucanáBucaná
1
0 0.5 1.0 1.5 KILOMETERS
0 0.50.25 0.75 MILE
Orthophoto base from the U.S. Army Corps of Engineers, Ponce and Playa de Ponce, 1:24,000, 2007Lambert conformal conic projection, Puerto Rico datum
Restauradawell field
52
66°37'
17°59'30"
17°58'30"
17°57'30"
66°36' 66°35' 66°34'
1111
99
77
1515
1313
44
12121616
1717
22
1414
(1.3)
(8.7)
(5.2)(1.7)
(2.4)
22
5588
Figure 28C. Potentiometric surface of the Punta Cabullones wetland subarea in equivalent freshwater heads during the wet season (Oct. 10, 2008) corresponding to a depth (A) less than 20 feet below land surface and (B) greater than 20 feet below land surface and during the dry season (March 26–28, 2008) corresponding to a depth (C) less than 20 feet below land surface and (D) greater than 20 feet below land surface.
1155
881010
EXPLANATIONWell type and identifier—Number in parentheses is equivalent freshwater, in feet
Piezometer nest
Well point 7 Agricultural well 422Test hole121(8.7) (1.7)(5.2)
Approximate potentiometric contour—Shows equivalent freshwater heads, in feet above mean sea level. Contour interval 3 feet
505
C
Figure 28. Potentiometric surface of the Punta Cabullones wetland subarea in equivalent freshwater heads during the wet season (October 10, 2008) corresponding to a depth (A) less than 20 feet below land surface and (B) greater than 20 feet below land surface, and during the dry season (March 26 –28, 2008) corresponding to a depth (C) less than 20 feet below land surface and (D) greater than 20 feet below land surface. —Continued
44 Hydrogeology and Hydrology of the Punta Cabullones Wetland Area, Ponce, Southern Puerto Rico, 2007– 08
Punta Carenero
Caleta de Cabullónes
Roca Ahogado
Playade
Ponce
Playade
Ponce
Punta Cabullónes
Caribbean Sea
Río
Buc
aná
BucanáBucaná
1
0 0.5 1.0 1.5 KILOMETERS
0 0.50.25 0.75 MILE
Orthophoto base from the U.S. Army Corps of Engineers, Ponce and Playa de Ponce, 1:24,000, 2007Lambert conformal conic projection, Puerto Rico datum
Restauradawell field
52
66°37'
17°59'30"
17°58'30"
17°57'30"
66°36' 66°35' 66°34'
1111
99
77
1515
1313
44
12121616
1717
22
14141010
99
88
(9.9)
(6.8)(5.5)
Figure 28D. Potentiometric surface of the Punta Cabullones wetland subarea in equivalent freshwater heads during the wet season (Oct. 10, 2008) corresponding to a depth (A) less than 20 feet below land surface and (B) greater than 20 feet below land surface and during the dry season (March 26–28, 2008) corresponding to a depth (C) less than 20 feet below land surface and (D) greater than 20 feet below land surface.
1155
881010
EXPLANATIONWell type and identifier—Number in parentheses is equivalent freshwater, in feet
Piezometer nest
Well point 7 Agricultural well 422 (9.9) (5.5)Approximate potentiometric contour—Shows equivalent freshwater heads, in feet above mean sea level. Contour interval 1 foot
5010Test hole121 (6.8)
D
Figure 28. Potentiometric surface of the Punta Cabullones wetland subarea in equivalent freshwater heads during the wet season (October 10, 2008) corresponding to a depth (A) less than 20 feet below land surface and (B) greater than 20 feet below land surface, and during the dry season (March 26 –28, 2008) corresponding to a depth (C) less than 20 feet below land surface and (D) greater than 20 feet below land surface. —Continued
Hydrogeology 45
distribution in groundwater shown in figure 16. In general, the computed EFHs are higher in the deep piezometers than in the shallow piezometers during the dry season, except at piezo meter PN2. At and near piezometer PN2, a temporary downward vertical gradient may form during the dry season as a result of the extremely high densities (salinity) of the surface water and shallow groundwater system. However, the true nature of the horizontal and vertical groundwater flow movements in Punta Cabullones appear to be rather complex considering the temporal and spatial variations in groundwater density (A. Provost and W.E. Sanford, U.S. Geological Survey, written commun., 2010; fig. 27). The difference between the regional groundwater flow pattern, in which the Platanal well and piezometer nest PN1 were completed, and the groundwater flow pattern within the Punta Cabullones area is evident when comparing groundwater age, salinity, and deuterium concentrations (fig. 29) determined for groundwater samples collected during the dry season from March 26 through March 28, 2008. An increase in age, salinity, and relative deuterium enrichment occurs within the regional groundwater flow system southward from the Platanal well to piezometers PN1D and PN1S. In contrast, southward from piezometer PN1D, the trend of increased groundwater age with salinity and relative deuterium enrichment is not present. For example, the water from piezometer PN2D is the second youngest after that of Platanal well while having the highest salinity. This lack of relation between groundwater age,
–14
–12
–10
–8
–6
–4
–2
0
2
0
5
10
15
20
25
30
35
40
45
0 5 10 15 20 25 30 35 40 45
Deut
eriu
m, i
n pa
rts p
er m
illio
n
Salin
ity, i
n pa
rts p
er th
ousa
nd
Age, in years
Salinity
EXPLANATION
Deuterium
PN1D
PN1S
WP4
PN2D
Platanal
PN2D WP4
PN1S
Figure 29. Salinity, deuterium concentration, and age since recharge of groundwater samples collected during March 26–27, 2008, at selected wells within the Punta Cabullones study area, southern Puerto Rico.
salinity, and deuterium depletion may indicate the occurrence of multiple downward and horizontal groundwater flow paths driven by salinity differences south of piezometer PN1. The occurrence of these vertical and horizontal flow paths may result in a convective-cell type of groundwater flow typical of coastal aquifers with groundwater of varying density (fig. 30; Cooper and others, 1964).
------ ? -------
----------
----------
? --------
----------
-
Water table
Upwarddensity-driven
groundwater flow
Downwarddensity-drivengroundwater flow
SaltwaterSaltwater
Freshwater
Upwardregional
groundwaterflow
Transition zone
Caribbean Sea
CaribbeanSea
Figure 30. Block diagram showing proposed convective-cell type groundwater flow in the Punta Cabullones area, southern Puerto Rico.
Figure 29. Salinity, deuterium concentration, and age since recharge of groundwater samples collected during March 26 –27, 2008, at selected wells within the Punta Cabullones study area, southern Puerto Rico.
Figure 30. Block diagram showing proposed convective-cell-type groundwater flow in the Punta Cabullones area, southern Puerto Rico.
46 Hydrogeology and Hydrology of the Punta Cabullones Wetland Area, Ponce, Southern Puerto Rico, 2007– 08
Table 6. Average horizontal hydraulic conductivity (Kh) values at selected boreholes in the Punta Cabullones study area computed using the Alyamani and Sen Method (1993).
[I0 is the zero intercept of a grain-size distribution curve. It approximates the smallest grain size in a sediment sample; d50 and d10 are the grain sizes in a sediment sample larger than the 50 and 10 cumulative percent weight, respectively, of the total grains]
Auger hole (identification number within parentheses,
see fig. 1B for location)
Depth interval, in millimeters
below land surface
I0 d50 d10 Kh, in meters per day for depth
interval
Result of Kh × fraction of total depth of
corresponding interval
Weighted average Kh, in meters per day In millimeters
Figures 2–1, 2–2, and 2–3 in appendix 2 show the grain-size distribution, and table 6 presents the K values obtained from the Alyamani-Sen method discussed in the section on methods. The K values obtained with the Alyamani and Sen method (1993) ranged from a minimum of 44.67 feet per day (ft/d) at test hole 12 (auger hole 3) to a maximum of 584 ft/d at test hole 16 (auger hole 7). The only distinctive spatial pattern in the K variation is that the lowest values are those for the auger holes
nearest to the shore line. Values of K of similar orders of magni-tude were obtained for beach sands in Cape Cod, Massachusetts, from the analysis of tidal load effects (Urish and McKenna, 2004).
The K values presented here are permeability estimates for the uppermost 3 – 4 ft of the sediment and, thus, may be assumed representative of only the shallow near-surface sediment and not the deeper water-bearing units in the Punta Cabullones area. Furthermore, disturbances of the sediment samples during retrieval could have caused slight departures from the in situ K values.
Origin of Salinity in Water 47
Groundwater/Surface-Water RelationsThe groundwater is near the land surface in the Punta
Cabullones area and seems to be well connected with the surface water. However, the nature of the groundwater/surface-water relation is complex and seems to be highly influenced by the density variations in both groundwater and surface water and external factors such as the sea-wave and tidal activity as well as the localized recharge mounds resulting from precipitation. Water from the wetland, because of its high density, may migrate downward into the aquifer, particularly in the vicinity of piezometer nest PN2 (fig. 1B) as indicated by the higher salinity at PN2S and the nearby wetland than found at PN2D. Dry-season salinities derived from the specific conductance data collected at station 50113615, specifically when the channel inlet/outlet to the sea is blocked by a sand bar, and at the wetland branch nearest to PN2 generally average about 65 parts per thousand, which is about twice that of the average salinity of the nearby Caribbean Sea. The recharge contribution of this hypersaline surface water to the aquifer is unknown. This downward movement into the aquifer of hypersaline surface water adds complexity to the groundwater movement in the Punta Cabullones study area and may provide a mechanism by which salt is transported from areas of higher salinity to those of less salinity and, thus, this mechanism may play an important role in the salt balance of an area with high evaporation such as Punta Cabullones. Rodríguez-Rodríguez and others (2005) used this model, referred to as the brine-reflux model, to explain in part the high density groundwater flow in a closed basin in the locality of Fuente de Piedra in Spain.
Origin of Salinity in WaterStable-isotopic concentration data and geochemical
indicators or indexes such as the chloride versus sulfate and chloride/bromide ratio versus chloride indicate that salinity within the study area originates from paleosalts dissolved in meteoric water and modern seawater or a variable mixing between these two end members (figs. 20 and 31; Kim and others, 2003). The data indicate that the main source of salinity at PN3 is the mixing of modern seawater and paleosalts in meteoric water, enhanced by evaporation. At PN1, the data indicate that the main source of salinity may be paleosalts dissolved in modern meteoric water, with seawater playing a secondary role. The dissolution of paleosalts by modern meteoric water as a source of salinity is indicated by the relation between salinity and deuterium concentration presented in figure 31C, in which delta deuterium values for hypersaline water correspond to modern meteoric water. Although not discussed in this report, the recharge of the aquifer by hypersaline surface water may be another indirect mechanism to make salt available for the preservation of the saltflats (Rodríguez-Rodríguez and others, 2005).
–600
1.01.0
10
100
1,000
Freshwater/seawatermixing line
10 100 1,000 10,000 100,000
10 20 30 40 50 60 70 80 90
–50
–40
–30
–20
–10
0
10
20
30
40
50
Salinity, in parts per thousand
Chloride, in milligrams per liter
Surface water
EXPLANATIONSelected site
Caribbean SeaWP1PN1SPN1D
PN2DWP4PN3SPN3D
Delta
deu
teriu
m, i
n pa
rts p
er m
ilCh
lorid
e/br
omid
e ra
tio
GroundwaterSeawaterRestaurada 2 well (2007 data)Platanal well (2007 data)
EXPLANATIONSelected site
Selected site
Figure 31. (A) chloride and sulfate concentrations, (B) the chloride/bromide ratio as a function of chloride concentration, and (C) delta deuterium and salinity from selected surface-water and groundwater sites in the Punta Cabullones study area, southern Puerto Rico.
0
Sulfa
te, i
n m
illig
ram
s pe
r lite
r
1,000
2,000
3,000
4,000
5,000
6,000
0 10,000 20,000
Chloride, in milligrams per liter30,000 40,000 50,000 60,000
Figure 31. (A) Chloride and sulfate concentrations, (B) the chloride/bromide ratio as a function of chloride concentration, and (C) delta deuterium and salinity from selected surface-water and groundwater sites in the Punta Cabullones study area, southern Puerto Rico.
48 Hydrogeology and Hydrology of the Punta Cabullones Wetland Area, Ponce, Southern Puerto Rico, 2007– 08
Evapotranspiration EstimatesThe ET estimate obtained with the Penman 1 variant of
the Penman semi-empirical method was 29 inches (fig. 32; for method details, see Custodio and Llamas, 1996). The ET estimate obtained with the Penman 2 variant of the Penman semi-empirical method was 37 inches (fig. 32). The ET esti-mate obtained with the Penman 2 variant was based on average daily values of meteorological parameters measured at the USGS Bucaná meteorological station 50113610 (for method details, see Custodio and Llamas, 1996). Both variants of the Penman semi-empirical equation result in an evaporation rate from an assumed free-water surface, which is then multiplied by a crop coefficient to obtain an ET rate that is based on the type of vegetation present in the area of interest (Snyder and others, 2010). An average crop coefficient value of 0.8 accounts for an assumed equally distributed mix of grass, low shrub, and wild-growing cotton cover and was used as the crop coefficient for this portion of the study area. These two estimated values for ET are either equal or very close to the measured rainfall of 35 inches during 2008 and the long-term annual mean rainfall of 31 inches estimated for the Ponce coastal zone by
Bennet (1972). The proximity between the calculated ET and various rainfall values is expected considering rainfall is the only available source of water for ET in a semi-arid setting, such as the Ponce coastal zone, where ET in areas with high solar radiation and unlimited water can potentially reach 80 in/yr (Ramos-Ginés, 1994; Rodríguez-Martínez and others, 2005). These ET values closely approximate the estimate of 31 in/yr by Giusti (1978) for the Ponce lower coastal zone. The minor differences of the ET estimates from the annual and long-term average annual rainfall may be caused by the use of climatic-parameter values from other areas, such as the reduc-tion coefficients from southeast England and the assumption of a uniformed evaporation surface. Another limiting factor when using the Penman semi-empirical method is the varying nature of the crop coefficient with time. According to the Penman semi-empirical equation, the estimated ET for that part of the study area within the coastal fan-delta and alluvial deposits north of Punta Cabullones follows a similar seasonal variation to that of air temperature, with the highest values occurring during the summer months between June and August and the lowest values occurring during the winter months between December and February (fig. 32).
0
0.05
0.10
0.15
0.20
0.25
0.30
0.35
0.40
Estim
ated
eva
potra
nspi
ratio
n, in
inch
es p
er d
ay
Date
Penman 2
Penman 1
March April May June July August September October November
2007 2008December January February March
Figure 32. Daily variation in the potential evaporation, estimated by using two variants of the Penman semi-empirical equation, for the fan-delta and coastal alluvial plain subareas of the Punta Cabullones study area, southern Puerto Rico.Figure 32. Daily variation in the potential evaporation, estimated by using two variants of the Penman semi-empirical equation, for the fan-delta and coastal alluvial plain subareas of the Punta Cabullones study area, southern Puerto Rico.
Evapotranspiration Estimates 49
Table 7. Estimated annual evapotranspiration (ET) values within the Punta Cabullones wetland subarea based on land-cover types.
[m2, square meter; m3/yr, cubic meter per year; acre-ft/yr, acre feet per year; —, no data or not applicable]
Land- cover type
(see location
and description
in fig. 2)
Areal extent, in m2
Direct rainfall
expressed as a
volumetric rate,
in m3/yr
Recharge from direct rainfall
(assuming 10 percent of
annual rainfall recharges
aquifer)
Net direct rainfall on land surface
after recharge
ET during wet months
August – October (92 days)
ET during rest of year(273 days)
Total ET Total ET,in
acre-ft/yr
In cubic meters
SFSV 7,195,401.71 5,849,920 584,992 5,264,928 a4,633,838 a' 7,660,944 12,294,782 9,967
MFSW 498,071.28 404,936 — — b 633,319 b'1,879,307 2,512,626 2,036
LWCI 444,703.41 361,547 — 361,547 c 361,547 — 361,547 293
CRBO 109,819.81 88,954 — — d 65,672 c'164,892 230,564 187
COSW 53,225.82 43,113 — — e 31,829 d ' 94,449 125,738 102
Total 8,301,222 — — — — — 15,525,257 12,586
ET rates (meters per day): a 0.007, b 0.014, c entire rainfall assumed to evaporate, d 0.0065, e 0.0065 a' 0.0039, b' 0.014, c ' 0.0055, d ' 0.0065
The ET daily rates for the different land covers in the wetland subarea are presented in table 7. The ET rate commonly used elsewhere for subareas with healthy mangrove stands in normal seawater similar to those in Punta Cabullones is 0.67 inches per day (in/d; Twilley and Chen, 1998). This ET rate of 0.67 in/d was used throughout the entire year for the healthy mangrove stands in Punta Cabullones because the average seawater salinity remains constant throughout the year within the subarea where these stands are located. An average ET rate of 0.22 in/d was used for those channels within Punta Cabullones that are generally blocked from the sea during the dry period (Kokya and Kokya, 2008). An ET rate of 0.25 in/d was used for these same channels during the wet period, when these channels are opened to the sea and readily accessible to the tidal and storm-surge effects (Kokya and Kokya, 2008). An ET rate of 0.28 in/d, as determined for a prevalent average salinity of about 22 parts per thousand (Kampf and others,
2005), was used for the thin-layer saltflats throughout the wet months, when the groundwater normally intercepts the land surface and ponding of the rainfall occurs. An ET rate of 0.15 in/d was used for the saltflats during the remaining months of the year when evapotranspiration is mostly from the shallow hypersaline groundwater where the salinity exceeds that of the seawater (Kampf and others, 2005).
The total annual ET in the Punta Cabullones wetland subarea is estimated to be 12,586 acre-feet per year. This ET estimate, when normalized by the areal extent, is equivalent to a water column with a height of 75 inches throughout the Punta Cabullones wetland subarea. The difference in magnitude of the ET values between the two subareas of the study area may be explained by the availability in the wetland subarea of a relatively unlimited supply of saline to hypersa-line surface water and groundwater that also contributes to the water requirements of ET.
50 Hydrogeology and Hydrology of the Punta Cabullones Wetland Area, Ponce, Southern Puerto Rico, 2007– 08
Table 8. Water-budget scenarios within the Punta Cabullones wetland subarea.
[Amounts of water in acre-feet per year (acre-ft/yr) and million gallons per day (Mgal/d), in parentheses; PRASA, Puerto Rico Aqueduct and Sewer Authority; ET, evapotranspiration]
Description of scenario1
Input: Groundwater inflow from north into
Punta Cabullones wetland 2
Input: Rainfall recharge
within Punta Cabullones
wetland (assumed about
10 percent of rainfall)
Total input: Groundwater inflow plus
rainfall recharge
into Punta Cabullones
wetland
Output: ET in acre-ft/yr
from Punta Cabullones
wetland (see table 7)
Input minus output:
Amount of seawater consumed
by ET3
1st scenarioRegional groundwater flow into Punta Cabullones wetland is not captured by pumpage in Restaurada well field
1,541(1.4 )
479(0.4)
2,020(1.8)
12,586(11.2)
10,600(9.4)
2nd scenario One-fourth of regional groundwater flow into Punta Cabullones wetland is captured by PRASA pumpage
1,200(1)
479(0.4)
31,700(1.5)
12,586(11.2)
11,000(9.7)
3rd scenario One-half of the regional groundwater flow into Punta Cabullones wetland is captured by PRASA pumpage
813(0.7)
479(0.4)
31,300(1.2)
12,586(11.2)
11,300(10)
4th scenario Entire regional groundwater flow is captured by PRASA pumpage
86(0.08)
479(0.4)
3565(0.5)
12,586(11.2)
12,000(10.7)
1As of 2008, PRASA withdraws about 2,015 acre-ft/yr from a portion of the Ponce coastal aquifer to the north of Punta Cabullones.2 Includes about 86 acre-ft/yr of rainfall recharge in subarea of Punta Cabullones underlain by delta fan and alluvium north of Punta Cabullones wetland—
this recharge is assumed not captured by PRASA pumpage.
3 Values have been rounded.
Water Budget
The water budget estimate presented in table 8 is restricted to that portion of Punta Cabullones already defined that includes the relic shorelines, wetland, and saltflats and is referred to as the Punta Cabullones wetland subarea. The inputs considered in the water-budget estimate are rainfall recharge within the wetland subarea and groundwater inflow from the subarea underlain by fan-delta and alluvial deposits. The only output considered in the water-budget estimate is ET. The flow of groundwater and surface water to and from the sea was not measured and consequently is not considered in the water budget.
The groundwater flow components used in the water budget estimate presented in table 8 are based upon the groundwater flow analog model results by Bennet (1972); consequently, the accuracy of the groundwater flow
components is limited by the assumptions made in the modeling exercise. Because of the limitations of the analog modeling by Bennet (1972) and scant field data, the values of the components used to estimate the water budget are considered to be first-order approximations. According to Bennet (1972), about 1.3 Mgal/d (1,500 acre-ft/yr) entered the Punta Cabullones wetland after cessation of irrigation recharge and prior to the increase in pumpage during the late 1970s of about 1.5 Mgal/d (1,700 acre-ft/yr) in the Restaurada well field located northwest of the study area. This flow estimate into the Punta Cabullones wetland included 0.08 Mgal/d (86 acre-ft/yr) of rainfall recharge in the subarea of the Punta Cabullones area that is underlain by fan-delta and alluvial deposits north of line X–Xʹ (fig. 2). Another input into the wetland subarea is the assumed 10 percent average recharge from direct rainfall of 0.4 Mgal/d (470 acre-ft/yr) for a total groundwater inflow of about 0.5 Mgal/d.
Summary and Conclusions 51
The four water-budget scenarios presented in table 8 assume that the entire groundwater flow entering and generated within the wetland subarea is available and, thus, used up by ET. The water-budget scenarios differ in the percentage of regional groundwater flow that is intercepted by the Restaurada well field. The two extreme scenarios are the first and fourth scenarios, which assume that the regional groundwater flow is not intercepted or is entirely intercepted, respectively, by PRASA pumpage at the Restaurada well field. Even in the first scenario, in which no regional groundwater flow is assumed to be intercepted by pumpage, the available groundwater does not entirely meet the ET needs in the wetland subarea, and the excess ET requirements within the wetland subarea are satisfied by surface saline to hypersaline water, which may include seawater and meteoric water with dissolved salts affected by evaporation. The amount of surface saline and hypersaline water that satisfies the ET requirements within the wetland subarea increases as a major interception of the regional groundwater flow by the Restaurada well field pumpage is considered. The other extreme case, represented by the fourth scenario, assumes that all of the regional groundwater flow is intercepted by pumpage at the Restaurada well field. In this case, ET requirements within the wetland subarea are met by the estimated 0.5 Mgal/d, which consists of 0.08 Mgal/d of groundwater flow coming from the adjoining subarea underlain by delta-fan and alluvial deposits and 0.4 Mgal/d of groundwater flow generated by direct-rainfall recharge within the wetland itself, and by surface saline to hypersaline water.
Hydrologic, isotopic, and geochemical data collected during the study indicate that fresh groundwater is still present beneath the Punta Cabullones wetland subarea despite the long-term well-field pumpage that, according to Bennet (1972) and the previous estimated water balance, should exceed the groundwater flow into this subarea. The increase in SC in the most seaward parts of the study area indicates that seawater intrusion could be occurring in response to the total or partial interception of groundwater inflow into the area by pumpage. However, the collected data are insufficient to indicate if the fresh groundwater in some areas beneath the Punta Cabullones wetland subarea is from still existing but reduced groundwater inflow, active rainfall recharge, or remnants of storage being continuously decreased by the Restaurada well field pumpage and replaced by seawater. The assumption of groundwater being used entirely to meet the ET requirements, made while estimating the water budget, may not be valid; ET is mostly satisfied by surface saline to hypersaline water, and fresh to brackish groundwater flow persists locally at depth, below the salinization and ET effects. Additional work in the form of geophysical surveys, test hole drilling, and isotopic and chemical analyses within the Punta Cabullones wetland subarea and the coastal plain to the north is needed to define the long-term effect that the Restaurada well field pumpage has had on the regional groundwater flow, particularly to determine the extent of seawater intrusion into the coastal aquifer.
Summary and ConclusionsThe Punta Cabullones area is a unique coastal ecological
system located in the Municipio of Ponce in southern Puerto Rico. This ecological system is made up of a wetland, saltflats, patches of mangrove forests with associated swamps, and an offshore fringe reef. The Municipio of Ponce opted to conserve the Punta Cabullones area as part of the wetlands mitigation effort required by Federal and State agencies in compensation for the effect of dredging the Ponce Bay to build the Las Américas Transshipment Port.
In order to develop a management plan for the Punta Cabullones area, the U.S. Geological Survey (USGS), in cooperation with the Municipio of Ponce and the Puerto Rico Department of Natural and Environmental Resources (PRDNER), conducted a study of the area’s hydrogeology and hydrology as well as factors that control the spatial and temporal changes in the chemical and physical properties of the surface water and groundwater within the Punta Cabullones study area.
Total rainfall measured during 2008 within the Punta Cabullones area was 36 inches, which is slightly greater than the long-term annual average of 31 inches for the coastal plain near Ponce. Punta Cabullones is mostly underlain by beach-eolian sand deposits of Quaternary age that are interspersed by mangrove-swamp deposits also of Quaternary age. The deposits of Quaternary age are underlain by sedimentary rocks of middle Tertiary age assumed to be time equivalent to the carbonate and terrigenous units of the same age exposed north of the study area. By the middle of the 20th century, Punta Cabullones had an average progradation rate of 5 feet per year, the highest of any coast in Puerto Rico.
The wetland in Punta Cabullones consists of a series of elongated and semi-curved ponds that generally follow the low-lying swales formed between consecutive beach ridges. The main water body of the wetland has two inlet/outlet channels to the sea. The westernmost inlet/outlet channel remains open throughout the year. The entrance to the easternmost inlet/outlet channel is blocked by a sand bar most of the time and remains open only during storm events and a few days afterward, allowing the free inflow of seawater. The water stage of the wetland in the interior of the easternmost channel, as measured at surface-water station 50113615, ranged from 0.96 to 4.75 feet (ft) above mean sea level. During the study period, the maximum tidal range at the Ponce Harbor, as measured at tidal-gage station 50114730, was slightly above 1.0 ft.
Spatial differences in temperature within the interior of the easternmost channel were minimal. Temporal variations in temperature within the interior of the easternmost channel were related to seasonal changes in rainfall, tidal activity, and ambient air temperature. During the study period, the water temperature ranged from 24.6 to 36.6 degrees Celsius (°C) within the wetland interior. The temperature of the water at station 50113625, the closest station to the sea and mouth of
52 Hydrogeology and Hydrology of the Punta Cabullones Wetland Area, Ponce, Southern Puerto Rico, 2007– 08
the easternmost channel, ranged from 24.5 to 32.1 °C, with temporal variations due to seasonal changes in rainfall, tidal activity, and ambient air temperature.
Spatial differences in pH among the wetland innermost stations were minimal. At the three innermost stations, the pH ranged from 7.2 to 8.3 standard units. At station 50113625, the pH ranged from 6.4 to 8.0 standard units.
Spatial variations in dissolved oxygen concentration within the wetland interior were not substantial; however, the temporal variations were of considerable magnitude. Within the wetland interior, the dissolved oxygen concentration ranged from less than 1 to 11.2 milligrams per liter. The lowest values are indicative of near-anoxic conditions that result from the shallowing and stagnation of the water during the dry weather months and blockage of the easternmost channel mouth by a sand bar.
Monthly measurements of specific conductance (SC) of the wetland water ranged from 21,970 to 110,500 micro-siemens per centimeter with a major temporal variation at each station. Spatial variations in SC were not substantial throughout the wetland. The monthly measurements and continuous record of SC of the wetland water show the same general temporal variations that result from the alternation of the wet and dry annual seasons in Puerto Rico. The annual increase in SC begins with the onset of the dry season that generally occurs either during December or January. Similarly, the decrease in SC coincides with the duration of the rainy season, which generally extends from August to November.
In the Punta Cabullones wetland subarea, a general decrease in groundwater salinity occurs away from a central hypersaline mound. The salinity of groundwater is higher at shallow depths and decreases to a depth of about 100 ft. No data are available to indicate whether this decreasing trend in salinity persists at depths greater than 100 ft.
Throughout most of the study area, the groundwater average temperature was generally higher than the air temper-ature. The groundwater temperature was lower than the air temperature only during the rainy season of the year (August through November) and during major rainfall events. Also, the groundwater temperature either responded slightly or did not respond at all to the diurnal fluctuations of air temperature.
The high concentration values of constituents such as chloride, sodium, sulfate, and potassium as well as the relation between chloride and the ratio of chloride to bromide, in the groundwater indicate that salinity of the groundwater origi-nates from the dissolution of paleosalts in modern meteoric water and from modern seawater. In general, the main groundwater type changes seaward are a calcium-bicarbonate type, which is influenced by fresh to slightly saline ground-water in the northernmost portion of the Punta Cabullones study area, and a predominant sodium-potassium-chloride groundwater type within the wetland subarea (that includes the relic shorelines).
The stable isotopic data indicate that there is both a temporal and spatial variation in the isotopic compositions of oxygen-18 and deuterium (ratios of 18 O /16 O and 2 H /1H expressed as δ18 O and δ2D, respectively) in the groundwater, surface water, and precipitation. However, the temporal variations in the stable isotopic composition of the seawater from the Caribbean Sea were minimal. The δ18 O and δD data indicate a strong evaporation effect on the groundwater and surface water within Punta Cabullones manifested as a marked enrichment in the heavier oxygen and hydrogen isotopes. According to the stable isotope data, the groundwater within the Punta Cabullones area originates mostly from slightly to highly evaporated meteoric water with dissolved paleosalts and modern seawater.
The groundwater in the study area is predominantly contained within sand and gravel strata. Groundwater also is within the skeletal-calcareous sand facies locally present within the study area. In general, the difference in groundwater elevation between the wet and dry seasons decreases seaward. During the rainy season, the water levels at the deep and shallow piezometers occasionally intersected and even rose above the land surface.
The groundwater flow within Punta Cabullones, particu-larly within the wetland subarea, is complex and cannot be defined with the simple form of Darcy’s equation that assumes constant density. Due to spatial and temporal variations in salinity, groundwater flow within the Punta Cabullones area is reasonably assumed to be mainly driven by density varia-tions. Downward movement of surface- hypersaline water from the wetland into the aquifer may be of importance in inducing a convective type of groundwater flow in the study area. Processes within the study area that may add to the complexity of groundwater flow by enhancing density varia-tions, changing the groundwater level or physically driving groundwater flow include evapotranspiration, tidal fluctuations and above-normal sea-wave activity, rainfall recharge, and temporal variations in barometric pressure.
Hydraulic conductivity estimates for the surficial sands within the relic shorelines area were obtained from various empirical formulas based on statistical analyses. The hydraulic conductivity values obtained with the Alyamani and Sen method were considered to be the most represen tative for the sediments of Punta Cabullones and ranged from 44.67 to 584.29 ft/d.
The groundwater and surface water in the study area are intermingled. Surface hypersaline water in the wetland migrates downward into the aquifer due to density differences from that of groundwater. This difference is particularly evident in the vicinity of the piezometer nest PN2.
Two estimates for annual evapotranspiration rates, 29 and 37 inches, were obtained for the subarea of the Punta Cabullones area that is underlain by fan-delta and alluvial deposits by using two variants of the Penman semi-empirical
References 53
equation. The annual evapotranspiration rate estimated for the wetland subarea was 12,586 acre-feet per year that when normalized for the wetland subarea extent is equivalent to a water column with a height of 75 inches.
The balance of evapotranspiration, in excess of about 0.5 million gallons per day (Mgal/d) of groundwater flow within the wetland, is supplied by saline to hypersaline surface water that may include seawater and meteoric water highly affected by evaporation with dissolved salts. In one of the extreme scenarios in which no groundwater is intercepted by pumpage at the Restaurada well field, the amount of saline to hypersaline water in the wetland consumed by evapotranspira-tion is about 10.5 Mgal/d. In the opposite extreme in which the entire regional groundwater flow is intercepted by pumpage in the Restaurada well field, the entire evapotranspiration requirement is met by saline to hypersaline water. The water-budget estimates confirm that ET plays the dominant hydro-logic role within the Punta Cabullones area. The water-budget estimate also indicates that either all of or a large portion of the regional groundwater flow to Punta Cabullones had been captured by the increased pumpage at the Restaurada well field, which suggests that seawater is actively intruding the Punta Cabullones area and replacing the fresh groundwater.
ReferencesAlyamani, M.S., and Sen, Z., 1993, Determination of hydrau-
lic conductivity from complete grain-size distribution curves: Groundwater, v. 31, no. 4, p. 551–555.
Bennett, D.G., 1972, Ground water along Río Bucaná at Ponce, Puerto Rico and the effects of a proposed floodway on ground-water quality: Commonwealth of Puerto Rico Water-Resources Bulletin 11, 28 p.
Beven, K., 1979, A sensitivity analysis of the Penman- Monteith actual evapotranspiration estimates: Journal of Hydrology, v. 44, p. 169–190.
Calvesbert, R.J., 1970, Climate of Puerto Rico and U.S. Virgin Islands: U.S. Environmental Science Services Administra-tion, Climatography of the United States no. 60 –52.
Clark, I., and Fritz, P., 1997, Environmental isotopes in hydro-geology: New York, Lewis Publishers, 328 p.
Cooper, H.H., Jr., Kohout, F.A., Henry, H.R., and Glover, R.E., 1964, Seawater in coastal aquifers: U.S. Geological Survey Water-Supply Paper 1613-C, 84 p.
Covington, A.K., Bates, R.G., and Durst, R.A., 1985, Definitions of pH scales, standard reference values, measurement of pH, and related terminology: Pure and Applied Chemistry, v. 57, no. 3, p. 531–542.
Craigh, A.K., 1992, Peruvian beach ridges—Are they a reli-able ENSO indicator?, in Ortlieb, L., and Machare, J., eds., Paleo ENSO Records, International Symposium, Extended Abstracts, Lima, ORSTROM-CONCYTEC, p. 55–56.
Custodio Emilio, and Llamas, Manuel Ramón, 1996, Hidrología Subterránea (2d ed.): Ediciones Omega, S.A.-Platón, 26, Barcelona, p. 327–333.
Fan, Y., Duffy, C.J., and Oliver, D.S., Jr., 1997, Density- driven groundwater flow in closed desert basins: Journal of Hydrology, v. 196, no. 1–4, p. 139–184.
Friedman, G.M., 1967, Dynamic processes and statistical parameters for size frequency distribution of beach and river sands: Journal of Sedimentary Petrology, v. 37, p. 327–354.
Giusti, E.V., 1978, Hydrogeology of the karst of Puerto Rico: U.S. Geological Survey Professional Paper 1012, 68 p.
Glover, L., III, Pease, M.H., and Arnow, T., 1977, Surficial geologic map of the Playa de Ponce and Santa Isabel quadrangles, Puerto Rico: Miscellaneous Field Studies Map MF-886, 1 sheet.
Goy, Jose Luis, Zazo, Cari, and Dabrio, C.J., 2002, A beach-ridge progradation complex reflecting periodical sea-level and climate variability during the Holocene (Gulf of Alm-ería, Western Mediterranean), accessed June 27, 2013, at http://eprints.ucm.es/10862/1/2003_1_beach.pdf.
Guo, W., and Langevin, C.D, 2002, User’s guide to SEAWAT— A computer program for simulation of three-dimensional variable-density ground-water flow: U.S. Geological Survey Open-File Report 01– 434, 79 p.
Hollins, S., and Ridd, V.P., 1997, Evaporation over a tropical tidal salt flat: Mangroves and Salt Marshes, v. 1, p. 95–102.
Kampf, S.K., Tyler, S.W., Ortiz, C.A., Muñoz, J.F., and Adkins, P.L., 2005, Evaporation and land surface energy budget at the Salar de Atacama, northern Chile: Journal of Hydrology, v. 310, no. 1– 4, p. 236–252.
Kaye, C.A., 1959, Shoreline features and Quaternary shoreline changes, Puerto Rico: U.S. Geological Survey Professional Paper 317-B, 140 p.
Kim, Y., Lee, K-S., Koh, D-C., Lee, D-H., Lee, S-G., Park, W-B., Koh, G-W., and Woo, N-C., 2003, Hydrogeochemical and isotopic evidence of groundwater salinization in a coastal aquifer—A case study in Jeju volcanic island, Korea: Journal of Hydrology, v. 270, no. 3– 4, p. 282–294.
Kokya, B.A., and Kokya, T.A., 2008, Proposing a formula for evaporation measurement from salt water resources: Hydrological Processes, v. 22, no. 12.
54 Hydrogeology and Hydrology of the Punta Cabullones Wetland Area, Ponce, Southern Puerto Rico, 2007– 08
Kozeni, J., and Carman, P.C., 1956, Flow of gases through porous media: London, Butterworths Scientific Publications.
Marion, G.M., and Babcock, K.L., 1976, Predicting specific conductance and salt concentration in dilute aqueous solution: Soil Science, v. 122, no. 4, 16 p.
Odong, J., 2008, Evaluation of empirical formulae for deter-mination of hydraulic conductivity based on grain-size analysis: The Journal of American Science, v. 4, no. 1, 6 p.
Ramos-Ginés, Orlando, 1994, Hydrology, water quality, and potential alternatives for water-resources development in the Río Majada and Río Lapa basins near the Albergue Olímpico, southern Puerto Rico: U.S. Geological Survey Water-Resources Investigations Report 91– 4174, 35 p.
Rodríguez-Martínez, Jesús, 1996, Hydrogeology and ground-water/surface-water relations in the Bajura area of the Municipio of Cabo Rojo, southwestern Puerto Rico: U.S. Geological Survey Water-Resources Investigations Report 95– 4159, 31 p.
Rodríguez-Martínez, Jesús, Santiago-Rivera, Luis, Rodríguez, J.M., and Gómez-Gómez, Fernando, Surface-water, water-quality, and ground-water assessment of the Municipio of Ponce, Puerto Rico, 2002–2004: U.S. Geological Survey Scientific Investigations Report 2005–5243, 96 p.
Rodríguez-Rodríguez, Miguel, Benavente Herrera, José, and Moral Martos, Francisco, 2005, High density groundwater flow, major-ion chemistry and field experiments in a closed basin—Fuente de Piedra Playa Lake (Spain): American Journal of Environmental Sciences, v. 1, no. 2, p. 164 –171.
Slichter, C.S., 1899, Theoretical investigation of the motion of ground waters: U.S. Geological Survey, 19th Annual Report, v. 2, p. 295–384.
Snyder, R.L., Orang, M., Maytac, S., and Eching, S., Crop coefficients: University of California at Davis, accessed January 25, 2010, at http://biomet.ucdavis.edu/Evapotranspiration/CropCoef/Kc.pdf.
Soler-López, L.R., 2004, Sedimentation survey of Lago Toa Vaca, Puerto Rico, June–July 2002, U.S. Geological Survey Scientific Investigations Report 2004–5035, 32 p., 2 pls.
Soler-López, L.R., 2011, Sedimentation Survey of Lago Cerrillos, Ponce, Puerto Rico, April–May 2008: U.S. Geological Sur-vey Scientific Investigations Report 2011–5057, 20 p., 1 pl.
Stapor, F.W., 1982, Beach ridges and beach ridge coasts, in Schwartz, M.L., ed., Encyclopedia of Beaches and Coastal Environments, Encyclopedia of Earth Sciences, v. X, p. 160 –171.
Twilley, R.R., and Chen, R., 1998, A water budget and hydrol-ogy model of a basin mangrove forest in Rookery Bay, Flor-ida: Marine and Freshwater Research, v. 49, p. 309–323.
Urish, D.W., and Mckenna, T.E., 2004, Tidal effects on ground water discharge through a sandy marine beach: Groundwater, v. 42, no. 7, p. 971–982.
U.S. Fish and Wildlife Service, 2013, Coastal Barrier Resources Act (CBRA), accessed July 9, 2013, at http://www.fws.gov/CBRA/.
Vukovic, M., and Soro, A., 1992, Determination of hydraulic conductivity of porous media from grain-size composition: Water Resources Publications.
Figure 1–1. Specific conductance and salinity for surface water and groundwater in the Punta Cabullones study area.Data used in the linear regression modeling are included.
Figure 1–2. Specific conductance and density for surface water and groundwater in the Punta Cabullones study areaused to estimate equivalent freshwater heads.
40,000 60,000 80,000 100,000 120,000
Salin
ity, i
n pa
rts p
er th
ousa
nd
Specific conductance, in microsiemens per centimeter
Specific conductance, in microsiemens per centimeter
Figure 1–1. Specific conductance and salinity for surface water and groundwater in the Punta Cabullones study area.
Figure 1–2. Specific conductance and density for groundwater and surface water in Punta Cabullones used to estimate equivalent freshwater heads .
56 Hydrogeology and Hydrology of the Punta Cabullones Wetland Area, Ponce, Southern Puerto Rico, 2007– 08
0
10
20
30
40
50
60
70
80
90
100
0 0.01 0.02 0.03 0.04 0.05 0.06 0.07 0.08
Cum
ulat
ive
wei
ght,
in p
erce
nt fi
ner
than
indi
cate
d gr
ain
size
Grain size, in inches
0 to 7
Depth below land surface, in inches
EXPLANATION
Figure 2–1. Grain-size distribution with depth in auger hole #1 in the Punta Cabullones study area.
7 to 12
12 to 17
17 to 22
22 to 32
Figure 2–1. Grain-size distribution with depth in auger hole #1 in the Punta Cabullones study area.
Appendix 2
Appendix 2 57
Cum
ulat
ive
wei
ght,
in p
erce
nt fi
ner t
han
indi
cate
d gr
ain
size
Depth below land surface, in inches
0 0.01 0.02 0.03 0.04 0.05 0.06 0.07 0.08
Grain size, in inches
Figure 2–2. Grain-size distribution in auger holes #3 and #6 in the Punta Cabullones study area.
EXPLANATION
Depth below land surface, in inches
EXPLANATION
0 to 8
8 to 18
18 to 26
26 to 40
0 to 55 to 1212 to 1818 to 2626 to 2929 to 3333 to 38
0
10
20
30
40
50
60
70
80
90
100
110
0
10
20
30
40
50
60
70
80
90
100
Auger hole #3
Auger hole #6
Figure 2– 2. Grain-size distribution with depth in auger holes #3 and #6 in the Punta Cabullones study area.
Appendix 2
58 Hydrogeology and Hydrology of the Punta Cabullones Wetland Area, Ponce, Southern Puerto Rico, 2007– 08
Cum
ulat
ive
wei
ght,
in p
erce
nt fi
ner t
han
indi
cate
d gr
ain
size
0 0.01 0.02 0.03 0.04 0.05 0.06 0.07 0.08
Grain size, in inches
Figure 2–3. Grain-size distribution in auger holes #7 and #8 in the Punta Cabullones study area.
Depth below land surface, in inches
EXPLANATION
Depth below land surface, in inches
EXPLANATION
4 to 10
10 to 14
14 to 20
20 to 32
0 to 77 to 1515 to 2222 to 2828 to 3434 to 4242 to 55
Auger hole #7
Auger hole #8
0
10
20
30
40
50
60
70
80
90
100
0
20
40
60
80
100
Figure 2– 3. Grain-size distribution with depth in auger holes #7 and #8 in the Punta Cabullones study area.
Manuscript approved May 22, 2014
Prepared by the USGS Science Publishing Network Raleigh Publishing Service Center Edited by Kimberly A. Waltenbaugh Illustrations and layout by Caryl J. Wipperfurth
For more information concerning this report, contact:Director, Caribbean Water Science Center651 Federal Drive Suite 400-15Guaynabo, PR 00965(787) 749-4346http://pr.water.usgs.gov/