HYDROLOGIC DATA COLLECTION ACTIVITIES IN THE SOLOMON GULCH BASIN NEAR VALDEZ, ALASKA By Bruce B. Bigelow U.S. GEOLOGICAL SURVEY Open-File Report 88-719 Prepared in cooperation with the ALASKA POWER AUTHORITY Anchorage, Alaska 1988
Transcript
HYDROLOGIC DATA COLLECTION ACTIVITIES IN THE SOLOMON GULCH BASIN NEAR VALDEZ, ALASKA
By Bruce B. Bigelow
U.S. GEOLOGICAL SURVEY
Open-File Report 88-719
Prepared in cooperation with the
ALASKA POWER AUTHORITY
Anchorage, Alaska
1988
DEPARTMENT OF THE INTERIOR
DONALD PAUL HODEL, Secretary
U.S. GEOLOGICAL SURVEY
Dallas L. Peck, Director
For additional information Copies of this report can bewrite to: purchased from:
District Chief U. S. Geological SurveyU.S. Geological Survey Books and Open-File Reports SectionWater Resources Division Federal Center4230 University Dr., Suite 201 Box 25425Anchorage, Alaska 99508-4664 Denver, Colorado 80225
11
CONTENTSPage
Introduction............................................................ 1Data-collection sites and discharge records............................. 6
Solomon Gulch Tailrace near Valdez............................... 6Solomon Gulch Bypass near Valdez................................. 6Solomon Gulch at top of falls.................................... 10Solomon Gulch near Valdez........................................ 13
ILLUSTRATIONS
Figure 1. Map of Valdez area showing location of Solomon Lake andSolomon Gulch south of Port Valdez......................... 2
2. Map of Solomon Gulch downstream from Solomon Lake andlocation of U.S. Geological Survey data-collection sites... 3
3. Diagram of profile of Solomon Gulch and water diversionstructures................................................. 4
5. Copper Valley Electric Association powerhouse on SolomonGulch ..................................................... 7
6. Tailrace downstream from Copper Valley Electric Associationpowerhouse................................................. 7
7. Solomon Gulch Bypass......................................... 98. Discharge measurement in Solomon Gulch Bypass, just upstream
from mouth of tailrace..................................... 119. Survey rod indicating height of water surface at peak flow
on October 11, 1986, 100 feet upstream from the Alyeska Pipeline Service Company bridge over Solomon Gulch......... 11
TABLES
Table 1. Discharge records at Solomon Gulch Tailrace near Valdez,September 1986 through September 1987...................... 8
2. Discharge records at Solomon Gulch Bypass near Valdez,September 1986 through September 1987...................... 12
3. Discharge records at Solomon Gulch at top of falls nearValdez, September 1986 through September 1987.............. 14
4. Discharge records for Solomon Gulch near Valdez, September1986 through September 1987................................ 15
in
CONVERSION FACTORS
For readers who may prefer to use metric (International System) units rather than inch-pound units, the conversion factors for the terms used in this report are listed below:
Multiply inch-pound unit bv
inch (in.) 25.4 foot (ft) ' 0.3048 mile (mi) 1.609 acre-foot (acre-ft) 1,233 cubic foot per second (ft3/s) 0.028317
To obtain metric unit
millimeter (mm)meter (m)kilometer (km)cubic meter (m3 )cubic meter per second (m3 /s)
SEA LEVEL
In this report "sea level" refers to the National Geodetic Vertical Datum of 1929 (NGVD of 1929)-- a geodetic datum derived from a general adjustment of the first-order level nets of both the United States and Canada, formerly called "Sea Level Datum of 1929."
NOTE
A section entitled "Accuracy of Records" is included under the description of the individual sites for which discharge is computed. The accuracy of streamflow records depends primarily on: (1) the stability of the stage-discharge relation or, if the control is unstable, the frequency of discharge measurements; and (2) the accuracy of observations of stage, direct (current meter) measurements of discharge, and interpretation of the data.
The U.S. Geological Survey has historically used subjective terms to describe the degree of accuracy of streamflow records. The term "excellent" means that about 95 percent of the daily discharge figures are within 5 percent of the true value; "good" records are within 10 percent of true value; and "fair" records are within 15 percent. Records are rated "poor" when they do not meet the above criteria. Different degrees of accuracy may be attributed to different parts of a given record (e.g. "fair" when affected by ice, but otherwise "good").
IV
HYDRQLOGIC DATA COLLECTION ACTIVITIES IN THE
SOLOMON GULCH BASIN NEAR VALDEZ, ALASKA
by Bruce B. Bigelow
INTRODUCTION
In 1981, the Alaska Power Authority (APA) completed construction of a dam and spillway at the north end of Solomon Lake near Valdez (fig. 1). As part of the APA - U.S. Geological Survey cooperative program, the Survey began to collect streamflow data in the Solomon Gulch basin in September 1986. This report briefly describes the water diversion facilities, their effects on streamflow, and the data*collection activities.
Elevation of the dam on Solomon Lake is 695 ft and the spillway elevation is 685 ft (from construction plans). Water from the lake is diverted, by means of two 48-inch diameter penstocks (figs. 2-4), to a Copper Valley Electric Association (CVEA) powerplant near tidewater at Port Valdez. From the powerplant, water is diverted (by various routes; see fig. 4) to the Valdez Fisheries Development Association (VFDA) fish hatchery, which lies across the Valdez Marine Terminal Highway from the plant. The hatchery also receives water from Solomon Gulch via the Falls Creek Diversion, located about 600 ft upstream from the mouth.
Solomon Gulch flows northerly into Port Valdez from the mountains southeast and across Port Valdez from the city of Valdez (fig. 1). The headwaters of the gulch originate at the base of several small glaciers at altitudes of 3,000 to 4,000 ft and flow northerly for about 8 mi to Solomon Lake. Water diverted for power generation draws the lake level down and substantially reduces flow in the natural channel of Solomon Gulch during winter months. In spring, runoff from melting snow and ice begins to refill the lake, and in most years the lake begins to overtop the spillway by early July. Water then flows through a small lake and eventually rejoins the natural channel below the dam. Between the lake and tidewater at Port Valdez, the channel is very steep, is incised in near-vertical rock walls, and includes a series of waterfalls. The channel itself is mostly bedrock, although the more gently sloping parts of the streambed are covered by gravel- to boulder-sized material.
The Geological Survey collected daily streamflow data at a site near the mouth of Solomon Gulch from July to December 1948 and from October 1949 through September 1956. Regulation and diversion from the dam since 1982 have significantly altered the natural flow characteristics of Solomon Gulch. In September 1986, data collection was begun in an attempt to determine mean daily discharge at four sites below Solomon Lake and thus document the effects of regulation and diversion of water on the flow at various points in the system. Periodic discharge measurements and continuous records of water stage are being obtained at two of the sites, and daily discharge values are being computed for all four sites. Descriptions of the
147°30'00"
61°00'
Figure l.~Valdez area showing location of Solomon Lake and Solomon Gulch south of Port Valdez.
146°20'00" 146°17'30"
Port Valdez15225996 Solomon Gulch Taiirace
near Valdez
15226000 Solomon Gulch near Valdez Fish hatchery
Powerhouse *= *..Terminal Highway
15225998 Solomon Gulch Bypass near Valdez
»*> 15225997 Solomon Gulchat top of fails near Valdez'Wine
Pipeline bridgeSolomon Gulch Penstock
1 KILOMETER
-61°05'00'
Figure 2.-Solomon Gulch downstream from Solomon Lake and location of U.S. Geological Survey data-collection sites.
VE
RT
ICA
L E
XA
GG
ER
AT
ION
X 5
MIL
ES
UP
ST
RE
AM
FR
OM
MO
UT
H
Figu
re 3
.-P
rofi
le o
f S
olom
on G
ulch
and
wat
er d
iver
sion
str
uctu
res.
Solomon Lake Reservoir
EXPLANATION PS Penstocks
UPS Unaerated penstocks PAS Aerated penstocks WW Warm water
Figure 4.-- Schematic diagram of Solomon Gulch flow pattern.
data-collection sites follow, and the records for September 1986 and water year 1987 (October 1, 1986 through September 30, 1987) are included in tables in this report.
DATA-COLLECTION SITES AND DISCHARGE RECORDS
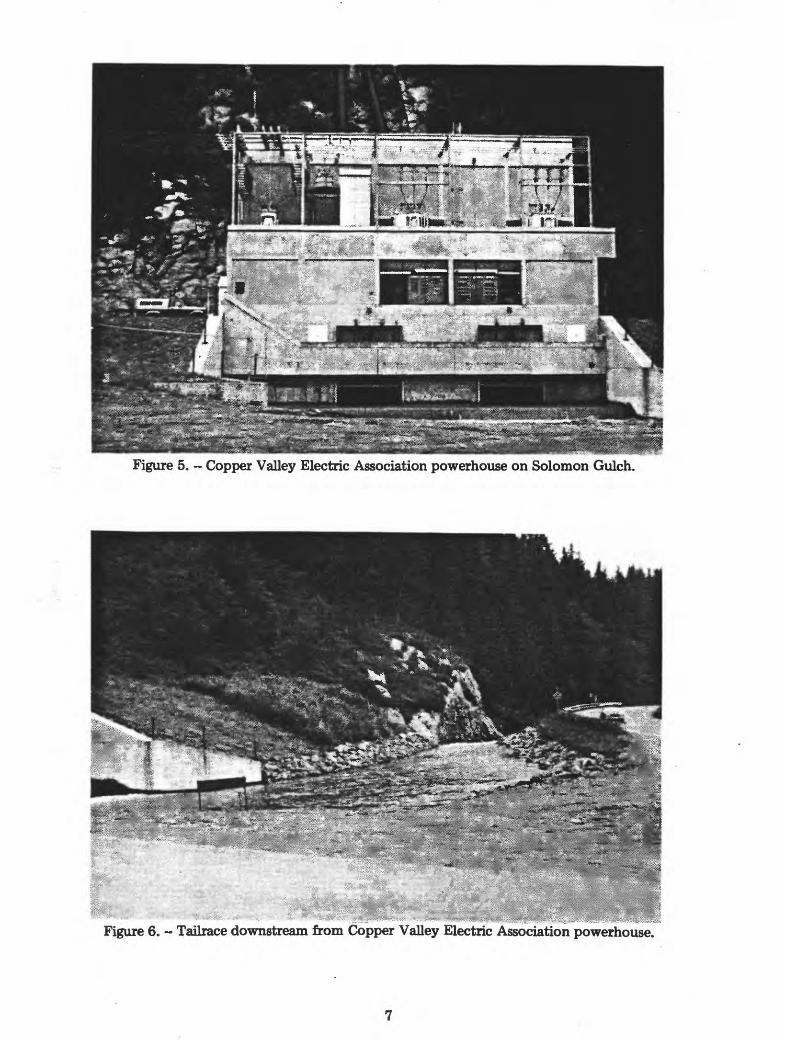
Solomon Gulch Tailrace near Valdez
(USGS Streamgaging Station No. 15225996)
Description of site: Location is at weir in the discharge pool downstream from the CVEA powerhouse, 350 ft upstream from mouth of the tailrace at Solomon Gulch. Elevation is about 40 ft above mean sea level; flow is not subject to tidal influence.
Stage measurement and discharge values: Continuous stage record is obtained with an electronic data recorder located on the powerhouse "catwalk" and a pressure transducer installed in the weir pool. The concrete weir 35 ft below the powerhouse (fig. 5) provides a stable control for the gage pool. Water discharged into the tailrace (fig. 6) has passed through one or both turbines for power generation. Discharge values here represent flow past the weir and do not include any of the diversions to the VFDA hatchery.
Stage-discharge relation and discharge measurements: A stage- discharge relation developed for this site is verified by ongoing direct measurements near the weir. Twenty-six measurements were-made between September 1986 and August 1988.
Accuracy of records: The weir is virtually free of debris and does not appear to be affected by backwater from snow or ice. Records of discharge from the powerplant are available for comparison. Records of discharge at this site (table 1) are generally considered good.
Solomon Gulch Bypass near Valdez
(USGS Streamgaging Station No. 15225998)
Description of site: Location is in a pool at base of the farthest downstream falls on Solomon Gulch (fig. 7), 100 ft upstream from Solomon Gulch Tailrace and 300 ft upstream from the mouth at Port Valdez. Elevation is about 25 ft above mean sea level, and flow is affected (backwater) by extreme high tides on Port Valdez.
Stage measurement and discharge values: A continuous record of water stage in the gage pool is provided by an analog recorder driven by a gas- purge manometer system; the orifice is installed in the pool and the recorder is located in the CVEA powerhouse. Large boulders at the outflow from the pool create an extremely stable control for the gage pool.
Figure 5. - Copper Valley Electric Association powerhouse on Solomon Gulch.
Figure 6. - Tailrace downstream from Copper Valley Electric Association powerhouse.
Table I.-Discharge records at Solomon Gulch Tailrace near Valdez, September 1986 through September 1987
Day
Day
Discharge, in cubic feet p«r second, September 1986
Mean values
Day Day Day Day Day
12345
131138140135136
6789
10
101808983
104
1112131415
135132130122134
1617181920
135136134134131
2122232425
126135135131121
2627262930
97129126130126
September total - 3716 Mean - 124 Maximum - 140 Minimum - 80 Acre-feet - 7370
Discharge, cubic feet per second, water year October 1966 to September 1987
Mean values
Oct. Nov. Dec. Jan. Feb. Max. Apr. May June July Aug. Sept.
12345
6789
10
1112131415
1617181920
2122232425
262728293031
Total
Mean
Maximum
Minimum
Acre-ft
130130134120121
12613112912494
767278112133
124114119125128
129124125126117
114117102106105102
3587
HE
134
72
7110
104113111114105
7674797881
8587828180
83899Z
114111
11712111910588
9110510910697
2697
96.6
121
74
5750
10184818288
6281857884
8691959492
9592
119119119
113120117124126
12612112612011697
3154
102
126
78
6260
89928391
109
11493929179
8289889187
8778796983
8991878375
8496107103121122
2846
91.8
122
75
5650
125124123124121
117107109111118
118118118116114
120117115125126
126122127128124
94112128 ---
3327
119
128
94
6600
129123109107107
110100104103109
112111111106106
10588828385
8079807783
889296939695
3049
98.4
129
77
6050
9896959384
938282
103109
106111113112110
1101071059990
867245424.8
3846
.004660
2437.80
81.3
113
.00
4840
77454175101
901091069894
105122137141151
139138151150152
150150145136143
148146144143139131
3797
122
152
41
7530
138138139145146
137139141141144
146140134126134
134142140136126
126140134131135
134139139141140 -
4125
137
146
126
8180
139140139137139
141140143138146
146138134134137
141140139133134
132141138139133
129138133132144147
4284
138
147
129
8500
139143133142147
146146139137136
136116126126125
120116105122170
191184178180184
188190187184188113
4637
150
191
105
9200
176167196199165
186186166199201
194190176187191
192201188183180
183179185156135
132124134134139
5288
176
201
124
10490
Water year 1987 Total 43428.80 Mean 119 Maximum 201 Minimum .00 Acre-feet 86140
8
Figure 7. - Solomon Gulch Bypass.
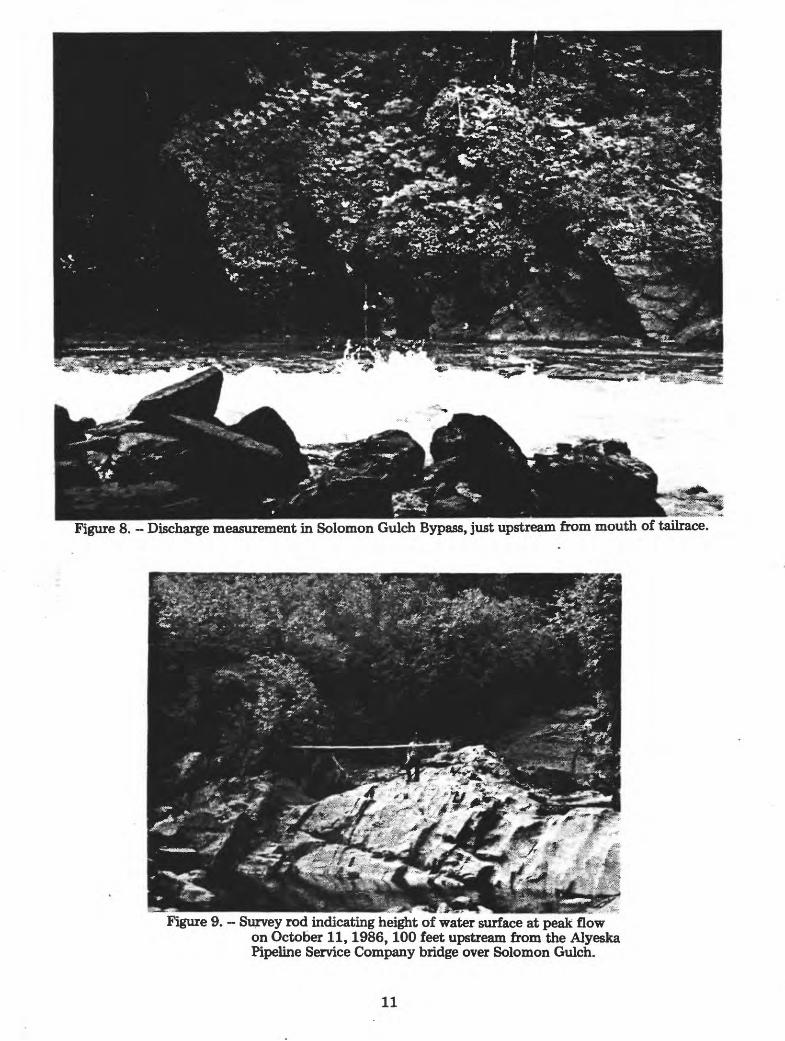
Discharge values here represent flow over the spillway of the dam on Solomon Lake plus any inflow between the dam and the gage, minus the Falls Creek Diversion. Because channel conditions almost always prevent direct measurement of discharge near the gage pool, values of discharge at this site are determined by measuring discharge in Solomon Gulch below its confluence with the powerhouse tailrace and subtracting the discharge at the tailrace (station No. 15225996, Solomon Gulch Tailrace) at the time of measurement.
Stage-discharge relation and discharge measurements: A stage- discharge relation was developed for this site and is verified by periodic current-meter measurements. Twenty-three measurements were made between September 1986 and August 1988. On July 29, 1988, a direct measurement was also made between the gage pool and the mouth of the tailrace (fig. 8). The results verified the computed discharge with 1.2 percent.
Accuracy of records: The stage-discharge relation (rating curve) for this site is subject to considerable deviation or shifting. During summer and fall, various types of debris -- leaves, twigs, and dead salmon -- lodge between the boulders and raise the level of water in the gage pool. In winter, the stage-discharge relation is affected by backwater caused by snow and ice on the boulder control. Records of discharge (table 2) are considered good, except for those during periods of ice effect, which are rated as fair to poor.
Solomon Gulch at Top of Falls
(USGS Streamgaging Station No. 15225997)
Description of site: Location is at the top of a series of falls; 100 ft downstream from the Alyeska Pipeline Service Company bridge, and 0. 3 mi upstream from the mouth at Fort Valdez. Elevation is 400 ft above mean sea level, from topographic map.
Stage measurement and discharge values: Water stage is not being recorded. Daily discharge values for this site are determined by adding values of the Falls Creek Diversion, provided by employees of the VFDA hatchery, to daily discharge values for the Solomon Gulch Bypass site (station No. 15225998). Water is diverted to the hatchery via the Falls Creek Diversion, located about 1,000 ft downstream from this site and about 300 ft upstream from the bypass gage site.
Profiles of the high-water marks for the flood of October 11, 1986, and channel geometry on the upstream side of the pipeline bridge were surveyed in July 1987. Computations from this indirect measurement survey indicate a peak flow of 3,280 ft3/8 through the bridge opening. Figure 9 shows the maximum height of the water surface about 100 ft upstream from the bridge. At peak stage of the flood, water was in contact with the bottom upstream bridge stringer.
Discharge measurements: Only two direct measurements of flow have been made at the "Top of Falls" site -- on September 24, 1987 and on July 29, 1988.
10
Figure 8. - Discharge measurement in Solomon Gulch Bypass, just upstream from mouth of tailrace.
Figure 9. - Survey rod indicating height of water surface at peak flowon October 11,1986,100 feet upstream from the Alyeska Pipeline Service Company bridge over Solomon Gulch.
11
Table 2. -Discharge records at Solomon Gulch Bypass near Valdez, September 1986 through September 1987
Day
123* 5
Day
Discharge, cubic f««t per second. September 1986
Maan values
Day Day Day Day
138148965933
September total - 2477.1 Maan - 82.6 Maximum - 604 Minimum - 7.8 Acra-faat - 4910
6789
10
2544
20318493
1112131415
3818108.88.5
1617181920
8.38.8
2362
604
2122232425
351164782011
2627282930
8.47.97.87.88.8
Day Oct.
Discharge, cubic faat par second, water year October 1986 to September 1987
Mean values
Nov. Dec. Jan. Feb. Mar. Apr. May June July Aug. Sept.
1 9.32 9.03 214 1845 94
6 327 128 119 10
10 828
11 214012 60313 57014 55515 247
16 11617 4818 2219 1220 11
21 2322 3623 1724 1525 11
26 1027 9.628 9.529 9.330 9.131 8.8
Total 5692.6
Mean 184
Maximum 2140
Minimum 8 . 8
Acre-ft 11290
9.113131413
1312121212
1212121212
1212121312
1212121111
1111111111 _
357.1
11.9
14
9.1
708
Water
1111111111
1111111111
9.59.59.59.59.5
9.59.59.59.59.5
8.58.58.58.08.0
7.57.58.59.5
1213
304.5
9.82
13
7.5
604
year 1987
1212121213
1314131412
11119.58.56.5
8.07.57.58.08.0
8.58.58.59.59.5
9.58.58.58.58.08.0
310.0
10.0
14
7.5
615
Total
8.07.57.57.57.0
7.06.56.56.56.0
6.06.05.55.55.5
5.05.05.05.04.5
5.56.57.58.59.5
101111
192.5
6.87
11
4.5
382
24234.2
1111121113
1314151617
1820212225
2627292319
161311109.3
9.08.58.48.29.09.1
474.5
15.3
29
8.2
941
Mean 66.4
8.68.58.48.89.0
8.78.58.49.39.6
8.78.88.76.86.7 .
6.67.99.59.59.5
9.68.36.76.76.7
6.78.4
111214 -
260.6
8.69
14
6.6
517
Maximum
1315151517
1617171717
1616171820
1820171717
1717151816
181617161717
519
16.7
20
13
1030
1618161616
1716151514
1414141414
1313131313
1314131312
1315151517
434
14.5
18
12
861
2140 Minimum 4.4
1313121212
116.76.66.46.2
6.48.5
14167183
216205222268369
349359360266262
331345309266250240
5094.8
164
369
6.2
10110
Acre-feet
197170157130201
330292197159148
142161164196183
127114987955
3623222641
504435324040
3689
119
330
22
7320
48070
214.4
2521520485
23413901040409329
19088683212
9.69.6
142317
111254168150
14694544722
6905.6
230
1520
4.4
13700
12
Accuracy of records: The direct discharge measurements indicate that computed discharges are from 5 to 10 percent low in the 150 to 200 ft s /s range. However, overall records of discharge at this site (table 3) are considered to be of fair to poor accuracy.
Solomon Gulch near Valdez
(USGS Streamgaging Station No. 15226000)
Description of site: Location is at mouth of Solomon Gulch at Port Valdez (sea level), 3.8 mi southeast of city of Valdez.
Discharge values: Neither discharge nor water stage are measured at this site. Computed discharge values represent the total flow for Solomon Gulch. This includes flow at Solomon Gulch Tailrace (station No. 15225996), Solomon Gulch Bypass (station No. 15225998), the Falls Creek Diversion, and all penstock diversions to the VFDA hatchery. Tables of daily diversion to the hatchery are provided by VFDA. However, because the hatchery discharges "used" water directly into Port Valdez, direct measurements of that discharge for verification are virtually impossible.
The average annual discharge of Solomon Gulch at its mouth for water years 1950-56 (7 years), before any regulation of flow, was 144 ft s /s; the computed mean discharge for water year 1987, adjusted for changes in storage in Solomon Lake, was 194 ft s /s, about 35 percent higher than the earlier, longer term average value. This higher value seems reasonable if it is compared to the nearest long-term station in a comparable environment, Power Creek near Cordova (USGS streamgaging station No. 15216000). The average discharge at Power Cre.ek for water years 1950-56 was 248 ft s /s. Mean discharge at Power Creek for the 1987 water year was 317 fts /s or 28 percenthigher than for the 7-year period.
In addition to the calculated "actual" daily flow values at the site,
the Geological Survey publishes an additional set of monthly flow values, adjusted to account for changes in storage in Solomon Lake. This is an attempt to "reconstruct" natural or unregulated runoff patterns for Solomon Gulch.
Accuracy of records: On the basis of comparison with Power Creek, and on the expected accuracy of records for other data-collection sites in the basin, records of discharge at the mouth of Solomon Creek (table 4) are considered good.
13
Day
Table 3. -Discharge records at Solomon Gulch at top of falls near Valdez, September 1986 ____________________through September 1987
Discharge, cubic feet per second, September 1986
Mean value*
Day
12345
138148965933
6789
10
2544
20318493
September total - 2481.2
Day Day Day Day
11121314IS
3818108.88.S
1617181920
8.38.8
2362
604
2122232425
351164782011
2627282930
8.49.08.88.89.8
Mean - 82.7 Maximum - 604 Minimum - 8.3 Acre-feet - 4920
Day Oct.
Discharge, cubic feet per second, water year October 1986 to September 1987
Mean values
Nov. Dec. Jan. Feb. Max. Apr. May June July Aug. Sept.
12345
6789
10
11121314
1516171819
2021222324
25262728293031
Total
Mean
Maximum
Minimum
Acre-ft
10102218494
32121110
828
2140603571557
249118492314
1224371816
12111111111010
5720
185
2140
10
11350
1014141514
1413131313
13131313
1414141415
1414141412
121212121212-~
396
13.2
15
10
785
1412121212
1212121212
11111111
1111111111
111010109.5
9.59.09.0
10111314
347.0
11.2
14
9.0
688
1414141314
1415141513
12121110
109.59.09.09.5
9.510101011
11111010109.59.5
353.5
11.4
15
9.0
701
9.59.09.09.08.5
8.58.08.08.07.5
7.57.57.07.0
7.06.5
. 6.56.56.5
6.07.08.09.0
10
11121313 ___---
236.0
8.43
13
6.0
468
1212131314
1516171819
20222324
2627283024
2017141214
15151414141515
552
17.8
30
12
1090
1515141515
1514141515
14141412
1212131111
1111131413
131312111214
---
397
13.2
15
11
787
1315151517
1617171717
16161718
2018201717
1717171518
16181718171818
524
16.9
20
13
1040
1719171717
1817151514
14141414
1413131313
1313141313
121315151618
443
14.8
19
12
879
1413121212
1217171717
171920
167
184216205222268
369349359360266
262331345309266250240
5167
167
369
12
10250
204177164137208
337299204166155
149168171203
19013412110586
6243302933
48575142394747
3906
126
337
29
7750
2811
2591530492
24114001050416330
191896934
1411111625
19131457
176
158154101564824
---
7037
235
1530
11
13960
Hater year 1987 Total 25078.5 Mean 68.7 Maximum 2140 Minimum 6.0 Acre-feet 49740
14
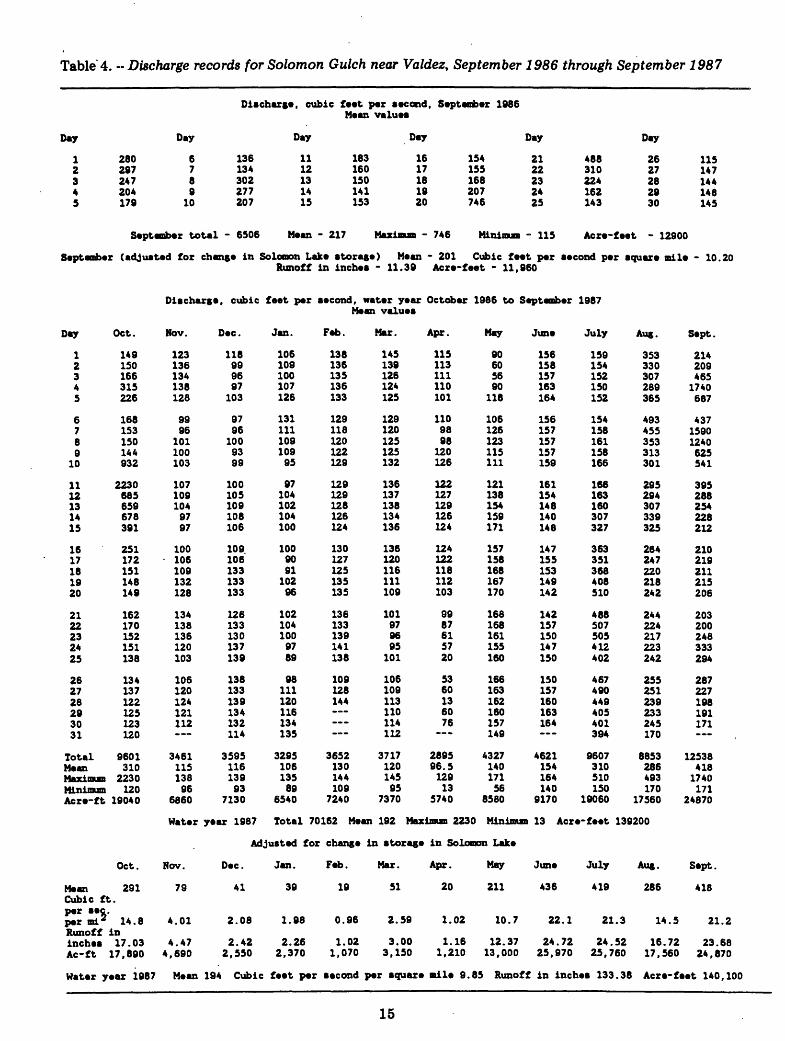
Table 4. - Discharge records for Solomon Gulch near Valdez, September 1986 through September 1987
Discharge, cubic feet per cond, September 1986 Mean values
D«y
12345
280297247204179
Day
6789
10
136134302277207
Day
1112131415
183160150141153
Day
1617181920
154155168207746
Day
2122232425
488310224162143
Day
2627282930
115147144148145
September total - 6506 M*an - 217 Maximum - 746 Minimum - 115 Acre-feet - 12900
September (adjusted for change in Solomon Lake storage) Mean - 201 Cubic feet per second per square mile - 10.20Runoff in inches - 11.39 Acre-feet - 11,960
Day
Discharge, cubic feet per second, water year October 1986 to September 1987Mean values
Oct. Nov. Dec. Jan. Feb. Mar. Apr. May June July Aug. Sept.
1 1492 ISO3 1664 3155 226
6 1687 1538 1509 144
10 932
11 223012 68513 65914 67815 391
16 25117 17218 15119 14820 149
21 16222 17023 15224 15125 138
26 13427 13728 12229 12530 12331 120
Total 9601Mean 310Maximum 2230Minimum 120Acre-ft 19040
123136134138128
9996
101100103
1071091049797
100106109132128
134138136120103
106120124121112
346111513896
6860
Hater
118999697103
97961009399
100105109108106
109106133133133
126133130137139
138133139134132114
359511613993
7130
year 1987
106109100107126
13111110910995
97104102104100
1009091
10296
1021041009789
98111120116134135
329510613589
6540
138136135136133
129118120122129
129129128126124
130127125135135
136133139141138
109128144
-=-
3652130144109
7240
145139126124125
129120125125132
136137138134136
136120116111109
101979695
101
106109113110114112
371712014595
7370
115113111110101
1109898120126
122127129126124
124122118112103
9987615720
5360136076 -
289596.512913
5740
Total 70162 Mean 192 Maximum 2230
Adjusted for
Oct.
Mean 291Cubic ft.per sec.per mi 2 14.8Runoff ininches 17.03Ac-ft 17.890
Nov.
79
4.01
4.474,690
Dec.
41
2.08
2.422,550
Jan.
39
1.98
2.262,370
change
Feb.
19
0.96
1.021,070
in storage
Mar.
51
2.59
3.003,150
90605690118
106126123115111
121138154159171
157158168167170
168168161155160
166163162160157149
432714017156
8580
Minimum
156158157163164
156157157157159
161154148140148
147155153149142
142157150147150
150157160163164 -
4621154164140
9170
159154152150152
154158161158166
166163160307327
363351368408510
488507505412402
467490449405401394
9607310510150
19060
353330307289365
493455353313301
295294307339325
264247220218242
244224217223242
255251239233245170
8853286493170
17560
2142094651740687
43715901240625541
395288254228212
210219211215206
203200248333294
287227198191171
125384181740171
24870
13 Acre-feet 139200
in Solomon Lake
Apr.
20
1.02
1.161,210
May
211
10.7
12.3713,000
June
436
22.1
24.7225,970
July
419
21.3
24.5225,760
Aug.
286
14.5
16.7217.560
Sept.
418
21.2
23.6824,870
Hater year 1987 Mean 194 Cubic feet per second per square mile 9.85 Runoff in inches 133.38 Acre-feet 140,100


![Valdez daily prospector. [Valdez, Alaska]. 1916-12-28 [p 4].](https://static.documents.pub/doc/80x56/615ac2044448c27f6d4bb2e7/valdez-daily-prospector-valdez-alaska-1916-12-28-p-4.jpg)


