HYGIENE AND NUTRITIONAL CONTENT OF THE NATIONAL SCHOOL NUTRITION PROGRAMME IN BLOEMFONTEIN, SOUTH AFRICA by Nthabiseng Nhlapo Dissertation submitted in fulfilment of the requirements for the degree of Master of Technology in Environmental Health School of Life Sciences Central University of Technology, Free State Supervisor: Dr. WH Groenewald (PhD: Food Science) Co-supervisor: Prof. JFR Lues (PhD: Food Science) October 2013
Transcript
HYGIENE AND NUTRITIONAL CONTENT OF THE
NATIONAL SCHOOL NUTRITION PROGRAMME IN
BLOEMFONTEIN, SOUTH AFRICA
by
Nthabiseng Nhlapo
Dissertation submitted in fulfilment of the requirements for the degree of
Master of Technology in Environmental Health
School of Life Sciences
Central University of Technology, Free State
Supervisor: Dr. WH Groenewald (PhD: Food Science)
Co-supervisor: Prof. JFR Lues (PhD: Food Science)
October 2013
ii
DECLARATION
I, the undersigned, hereby declare that the work contained in this dissertation is
my own original work, except for assistance which is acknowledged. I declare
further that I have not previously submitted this dissertation, in its entirety or
partially, at any other tertiary institution in respect of a qualification.
Nthabiseng Nhlapo Date
iii
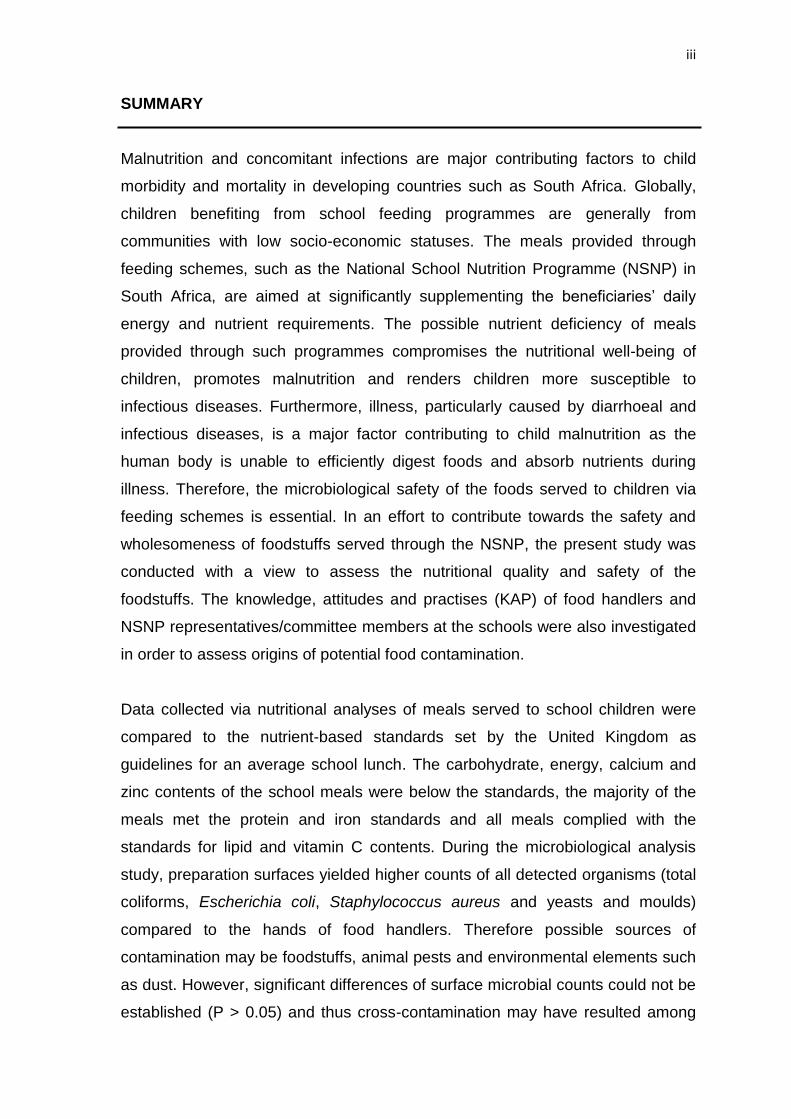
SUMMARY
Malnutrition and concomitant infections are major contributing factors to child
morbidity and mortality in developing countries such as South Africa. Globally,
children benefiting from school feeding programmes are generally from
communities with low socio-economic statuses. The meals provided through
feeding schemes, such as the National School Nutrition Programme (NSNP) in
South Africa, are aimed at significantly supplementing the beneficiaries’ daily
energy and nutrient requirements. The possible nutrient deficiency of meals
provided through such programmes compromises the nutritional well-being of
children, promotes malnutrition and renders children more susceptible to
infectious diseases. Furthermore, illness, particularly caused by diarrhoeal and
infectious diseases, is a major factor contributing to child malnutrition as the
human body is unable to efficiently digest foods and absorb nutrients during
illness. Therefore, the microbiological safety of the foods served to children via
feeding schemes is essential. In an effort to contribute towards the safety and
wholesomeness of foodstuffs served through the NSNP, the present study was
conducted with a view to assess the nutritional quality and safety of the
foodstuffs. The knowledge, attitudes and practises (KAP) of food handlers and
NSNP representatives/committee members at the schools were also investigated
in order to assess origins of potential food contamination.
Data collected via nutritional analyses of meals served to school children were
compared to the nutrient-based standards set by the United Kingdom as
guidelines for an average school lunch. The carbohydrate, energy, calcium and
zinc contents of the school meals were below the standards, the majority of the
meals met the protein and iron standards and all meals complied with the
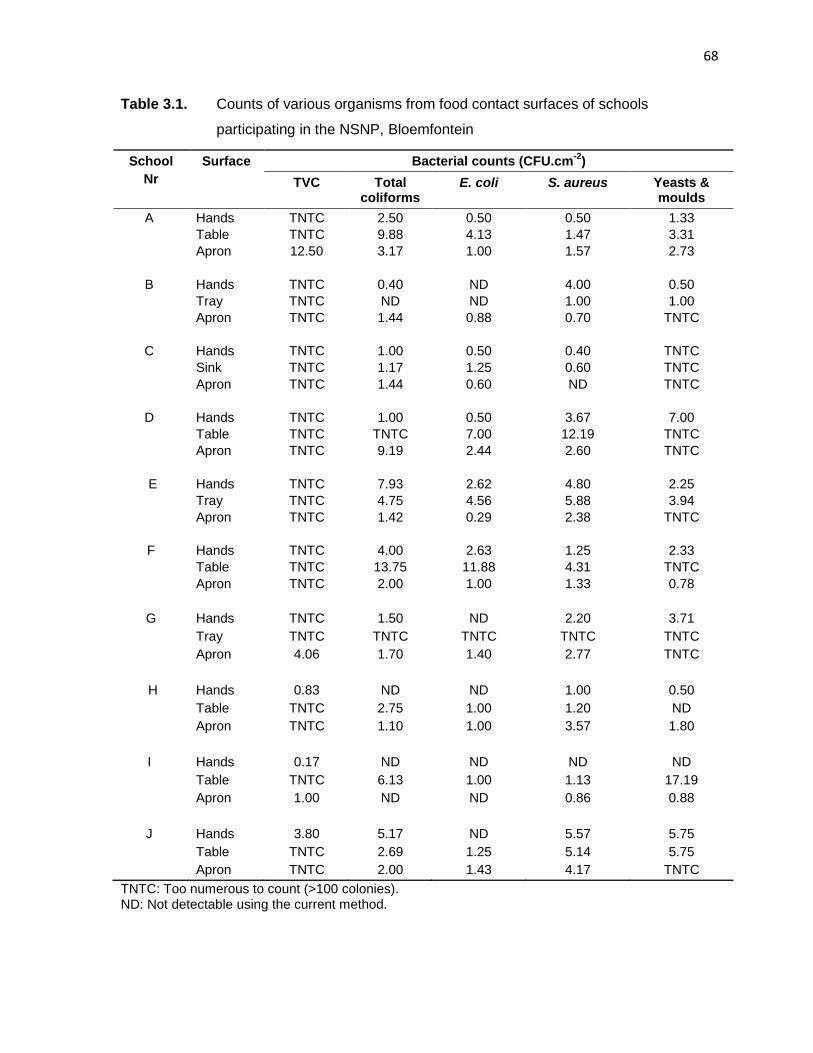
standards for lipid and vitamin C contents. During the microbiological analysis
study, preparation surfaces yielded higher counts of all detected organisms (total
coliforms, Escherichia coli, Staphylococcus aureus and yeasts and moulds)
compared to the hands of food handlers. Therefore possible sources of
contamination may be foodstuffs, animal pests and environmental elements such
as dust. However, significant differences of surface microbial counts could not be
established (P > 0.05) and thus cross-contamination may have resulted among
iv
surfaces, possibly augmented by shortfalls in cleaning regimes. The majority of
the participants of the questionnaire survey reportedly washed their hands and
cleaned all surfaces several times during the day with water and detergent. In
addition, a disinfectant was used by some of the food preparers during cleaning.
Furthermore, participants stated that their aprons were washed daily. These
claims were in agreement with the findings of the surface microbial study with
regards to the hands, however, they did not match the findings of the preparation
surfaces which contained the highest counts of total coliforms, E. coli and S.
aureus of the three surfaces analysed, and aprons responsible for the highest
yeast and mould counts.
Improper storage and food preparation methods, such as the application of high
temperatures, excessive exposure to UV light and oxygen, and high moisture
conditions, may result in the deterioration of nutrients. Storage conditions which
may permit pest infestation may also increase the risk of food-related illnesses
and risk could be further elevated by application of improper cleaning and
sanitation practices. In order for the NSNP to operate effectively, it is essential
that the national and provincial Departments of Basic Education, which are
responsible for the overall administration of the NSNP, and schools’ personnel
function in an integrated manner through support structures and effective
communication. Infrastructural limitations (lack of proper kitchen facilities and
ventilation) and shortage of resources while administering the NSNP were the
main challenges observed during the present study. Due to these hurdles,
adhering to food safety practices and maintaining nutritional quality of foods may
be a challenge. Continuous training in personal and general hygiene is also a
necessity in preserving food safety. Furthermore, nutritional quality of foodstuffs
may be preserved through proper storage practices and application of
preparation methods which minimize loss of nutrients.
v
ACKNOWLEDGEMENTS
The collaboration of the following individuals and organisations is sincerely
appreciated:
God for His unconditional love and countless blessings.
My father, Tello Ben Nhlapo, for his continued support and encouragement.
Dr. Willem Groenewald and Prof. Ryk Lues for their management, guidance,
support and mentorship.
Edmore Kativu and Sarel Marais for laboratory assistance and guidance.
The National Research Foundation (NRF) and Central University of
Technology, Free State (CUT) for financial assistance.
The Free State Department of Basic Education for approving and supporting
the study and assisting where needed.
My sister, brother and cousin for their support and patience.
My colleagues for their support.
The Unit for Applied Food Safety and -Biotechnology staff members for their
support, advice and encouragement.
vi
TABLE OF CONTENTS
Page no.
Title page i
Declaration ii
Summary iii
Acknowledgements v
Table of contents vi
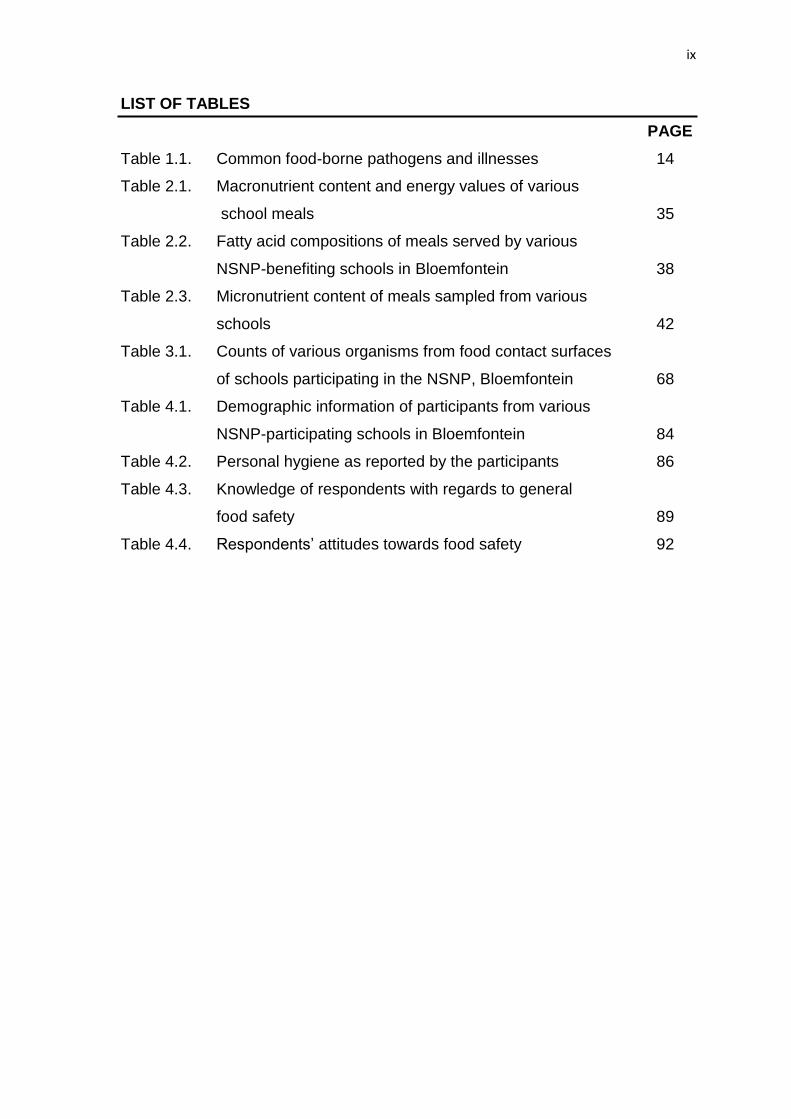
List of Tables ix
List of Figures x
List of Acronyms xi
Chapter 1: Introduction 1
1.1. Introduction to the South African National School Nutrition
Programme 2
1.2. Nutritional properties of the National School Nutrition Programme 5
1.2.1. Malnutrition 6
1.2.2. Nutrition during childhood and adolescence 10
1.3. Food safety aspects associated with the National School Nutrition
Programme 11
1.4. Rationale 16
1.4.1. Problem delineation 16
1.4.2. Aim and objectives 18
References 19
Chapter 2: Assessing the quality of food served under a school
feeding scheme: A nutritional analysis 24
2.1. Abstract 25
2.2. Introduction 26
2.3. Materials and methods 28
2.3.1. Sampling procedure 28
2.3.2. Gravimetric determination of moisture content 29
2.3.3. Analysis of soluble sugars by HPLC 29
2.3.4. Total carbohydrate determination 30
vii
2.3.5. Total lipid determination and fatty acids analysis
by GC-FID 30
2.3.6. Protein content determination 31
2.3.7. Analysis of Vitamins A and E 32
2.3.8. Vitamin C analysis 33
2.3.9. Determination of total ash and mineral content 33
2.3.10. Energy calculation 33
2.3.11. Analyses of data 33
2.4. Results and discussion 34
2.4.1. Carbohydrates 34
2.4.2. Lipids and fatty acids 36
2.4.3. Protein 39
2.4.4. Energy 40
2.4.5. Vitamins A and E 41
2.4.6. Vitamin C 41
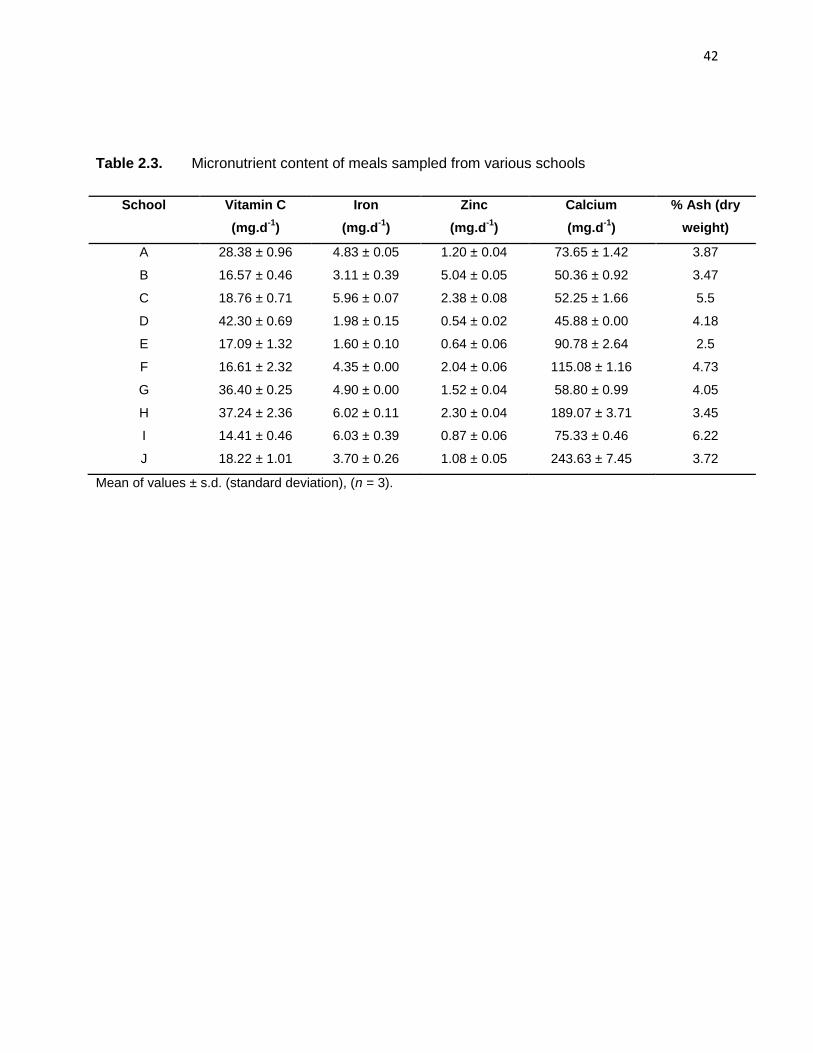
2.4.7. Ash and mineral content 44
2.5. Conclusions 48
References 50
APPENDICES 57
Appendix 1. Nutrient-based standards for an average school lunch 58
Appendix 2. Calibration curve regression of mono- and disaccharides
over a calibration range of 0.4–3.2 g.l-1 59
Appendix 3. Chromatograms of vitamins A and E standards 60
Chapter 3: The prevalence of microbiota on food contact
surfaces associated with a South African school
feeding scheme 61
3.1. Abstract 62
3.2. Introduction 63
3.3. Materials and methods 65
3.3.1. Sampling protocol 65
3.3.2. Microbial analysis 65
3.4. Results and discussion 67
viii
3.5. Conclusions 72
References 73
Chapter 4: Food safety knowledge, attitudes and practices of food
handlers and representatives of a school feeding
programme 78
4.1. Abstract 79
4.2. Introduction 81
4.3. Materials and methods 82
4.4. Results and discussion 83
4.4.1. Demographic characteristics of participants 83
1.1 INTRODUCTION TO THE SOUTH AFRICAN NATIONAL SCHOOL
NUTRITION PROGRAMME
The right to education is one of the basic human rights reserved in the Bill of Rights
contained in the Constitution of South Africa (Currie and De Waal, 2005). However,
due to poverty in communities across the country, the learning process in schools
tends to be hindered by factors such as malnutrition and hunger (PSC, 2008). In an
effort to avert these factors, the Integrated Nutrition Programme (INP) was
developed from the recommendations of a nutrition committee appointed in 1994 by
the residing Minister of Health to develop a nutrition strategy for South Africa. The
committee recommended an integrated approach to nutrition as a replacement for
the preceding fragmented food-based approach (Kloka, 2003).
The Primary School Nutrition Programme (PSNP), a school feeding scheme which
formed part of the Department of Health’s INP, was introduced nationwide in South
Africa in September 1994. This followed former President Nelson Mandela’s
announcement in his State of the Nation Address on the 24th of May 1994 that such
a nutritional feeding scheme would be implemented in every primary school where a
need was identified (Kloka, 2003; Noe, 2005; Ntuli, 2009). The PSNP was primarily
designed to improve active learning capacity by providing direct services to primary
school learners to alleviate the effects of malnutrition and was aimed to improve
educational outcomes by alleviating short-term hunger and improving school
attendance and participation (Meaker, 2008; Ntuli, 2009). Since the programme was
conceptualised to focus primarily on educational outcomes rather than on health
issues and since the then Department of Education (DoE) had been tasked with the
mandate of working directly with schools, responsibility for the programme was
transferred from the Department of Health (DoH) to the former DoE in 2004 to
improve its efficiency in schools (PSC, 2008).
Since its initiation, the PSNP catered for the most needy primary school learners,
i.e., learners from communities with low socio-economic status. However, following
the 2006 survey by the Fiscal and Finance Commission, it was confirmed that there
3
was a need to expand the programme to secondary schools (DBE, 2009). Upon its
extension to secondary schools, the PSNP was renamed the National School
Nutrition Programme (NSNP). Ntuli (2009) quotes the former KwaZulu-Natal
Member of the Executive Council (MEC) for education, Ms Ina Cronjé, as follows:
"Our idea as the department is to provide meals for all the poor schools regardless
whether it is a primary or secondary school. We want all the hungry learners to be
fed in our schools". In April 2009, the NSNP was successfully extended for the first
time to secondary schools (DBE, 2010a) and is currently administered by the
Department of Basic Education (DBE).
The DBE (2009) classifies the NSNP as one of the essential components of the
government’s Programme of Action, which was specifically assigned the
responsibility of addressing children’s ability to learn by providing them with
nutritious meals. The success thereof may contribute towards the country’s
realisation of the Millennium Development Goals (MDGs) which include reduction of
child mortality, achieving universal primary education and eradication of extreme
poverty and hunger by 2015 (PSC, 2008; Kimani-Murage et al., 2011). The following
are the objectives of the NSNP: to alleviate poverty and improve learning capacity of
children through school feeding; to generate and promote sustainable food
production and economic activities in school communities; to strengthen nutrition
education in schools; to increase attendance of learners and to obliterate school
dropout; to increase the pass rate; to reduce the unemployment rate, particularly
among women; to reduce the incidents of child mortality, mobility and the morbidity
rate; to empower poverty-stricken communities, particularly in the rural areas across
all nine provinces in South Africa; and to increase the transfer of skills and self-
reliance (PMG, 2007; Seoketsa, 2007; PSC, 2008). It is essential that this
programme is managed in such a manner that its aims and objectives are met in
order to abundantly benefit the learners served (Seoketsa, 2007).
The NSNP is funded through a provisional grant that is transferred to provinces
according to the Division of Revenue Act and directives from the DBE and National
4
Treasury (Grant Framework 2010/11) (DBE, 2010a; DBE, 2011). The DBE
coordinates and oversees the programme, ensuring adherence to policies and
relevant legislation through monitoring. The Provincial Education Departments are
tasked with the procurement of goods and services for the NSNP while adhering to
conditions stipulated by the Grant Framework (DBE, 2010a; DBE, 2011). Ntuli
(2009) explains that schools are funded according to a national system of ranking
and funding of schools referred to as a quintile (Q). The DBE ranks schools within
quintiles according to this system, taking into account the socio-economic
circumstances, such as inequality and poverty, of learners and schools. For
example, schools rated at the lowest quintiles (1 and 2) receive more funding based
on the Norms and Standards for Funding Schools (Ntuli, 2009). The schools
targeted are primary and secondary schools ranked in Q1 to Q3 (DBE, 2010a; DoE,
2009).
The provincial/district office and/or schools are allocated funds for the procurement
of equipment, utensils and foodstuffs (DoE, 2009). Food items are delivered to
schools by private contractors and further prepared on the school premises (Noe,
2005). At each participating school, the school principal is responsible for the overall
management and success of the programme. Operational responsibility for the
NSNP is assumed by an educator/administrator nominated by the school principal
as a NSNP school coordinator. The school coordinator supervises the daily activities
of the programme such as receiving and recording stock, maintaining and updating
records of all invoices, meals served and number of learners fed per day. Each
school has a nutrition committee comprising the NSNP school coordinator, school
management team, a school governing body (SGB) member, a food handler, and/or
a food gardener (DoE, 2009). The SGB provides support in addressing any
additional requirements of the programme and ensuring that the programme is
implemented effectively. He/she is also responsible for identifying unemployed
community members to be recruited as volunteer food handlers (VFHs) who will be
responsible for the preparation and serving of meals and for the maintenance of the
preparation area (PSC, 2008; DoE, 2009). The VFHs are required to handle
5
foodstuffs in a manner that preserves the safety and nutritional quality of foods
(DBE, 2009). The NSNP is further facilitated by other government departments such
as the Departments of Health and Agriculture, and a number of private companies
nationwide, such as Massmart Holdings Limited (DBE, 2011).
DBE (2010a) indicates some achievements of the programme during the financial
year 2009/10 as: supplying meals to approximately 7 million learners in over 20
thousand schools nationally; successful extension of the programme to Q1
secondary schools; improvement in the quality of meals (provincial menus included
vegetables and fruits); providing learners with cooked meals five days a week; and
the transfer of approximately R83 147 million to provincial departments to procure
equipment in preparation to extend the programme to Q2 secondary schools in April
2010 (DBE, 2010a). Furthermore, the number of VFHs increased when compared to
the previous financial year. Plans for the 2010/11 financial year included
strengthening monitoring, research, programme advocacy and partnerships to
ensure quality meals, and to prepare for the expansion of the programme to Q3
secondary schools in 2011 (DBE, 2010a).
The first issue of the NSNP Newsletter “Inside NSNP” reported that the programme
provided daily nutritious meals to a significant number of school learners nationally.
The DBE continues to encourage schools to promote healthy eating and food safety
through training workshops. This is achieved through activities such as the NSNP
Best School Awards, where the winning school and nominated schools receive
prizes, and the NSNP Newsletter (DBE, 2010b).
1.2 NUTRITIONAL PROPERTIES OF THE NATIONAL SCHOOL NUTRITION
PROGRAMME
According to Whitney and Rolfes (2008) and Insel et al. (2013), approximately 14%
of the world’s population experiences persistent hunger and 60% of deaths of
children globally may be attributed to poor nutrition. Furthermore, the prevalence is
greater and the consequences more severe in developing countries with the primary
6
cause being poverty. An estimated 1.3 billion people live in poverty in developing
countries and of these approximately 798 million suffer from chronic hunger
(Nnakwe, 2013).
Sound nutrition is a basic human right stipulated in South Africa’s Constitution,
through the Bill of Rights, and comprises more than simply the availability of food or
the consumption of a certain amount of nutrients per day. According to Kloka (2003),
nutrition security incorporates food security, health security and care security, where
security refers to sustainability with food and good nutrition being provided on a
continual basis. Furthermore, nutrition security entails physical and economic
access to a balanced diet and safe drinking water to all people at all times (Panda,
2010). Nutrition security is particularly vital throughout the school attending period
for providing children with opportunities to express their full innate potential in
physical and mental development (Panda, 2010). Therefore, the DBE has an
obligation to ensure that nutrition security is respected, protected, facilitated and
provided to those it serves through the NSNP.
Twenty-four workshops on menu planning, meal preparation, food safety and
hygiene were conducted by the DBE during the 2009/10 financial year to aid in
improvement of meal quality (DBE, 2010a). The workshops were compulsory and
were targeting provincial coordinators, VFHs and NSNP supervisors in six provinces
namely Free State, KwaZulu-Natal, Limpopo, Mpumalanga, Northern Cape and
North-West. Menus for the meals provided to learners follow the Food Based Dietary
Guidelines, which provide for a variety of food items inclusive of vegetables and
fruits (DBE, 2010a).
1.2.1. Malnutrition
Nutrition is defined as all the processes during which the body ingests, digests,
absorbs, transports, utilizes and excretes food components (Marotz et al., 1997).
According to Blake et al. (2010) and Insel et al. (2013), nutrients are constituents of
food that maintain these body processes which include providing building blocks to
7
replace body cells as they perish. Nutrients also provide the body with energy to
perform all body functions and processes which may involve any activities from
maintaining a heartbeat to participating in classroom activities (Blake et al., 2010).
Since the majority of foodstuffs contain numerous nutrients, nutrient deficiencies are
usually multiple; therefore a poor diet may affect the intake level of various nutrients
(Brown, 2002). Nutrients are regarded as essential since the human body is unable
to produce them or produce them in sufficient quantities to maintain body functions.
They should therefore be obtained from the food ingested (Blake et al., 2010).
Malnutrition is poor nutrition which results from both inadequate and excessive
intake of nutrients in the body (Brown, 2002). Roday (2007) defines malnutrition as
the significant deficiency (under-nutrition) or excess (over-nutrition) of a nutrient or
energy over time, while under-nutrition is most prevalent in poverty stricken
communities in developing countries. Chronic deficiency of a nutrient will impact the
body’s ability to function in the short-term and over time. Moreover, chronic
deficiencies, excesses and imbalances will affect long-term health. A study
conducted in Uganda by Acham et al. (2012) linked learning to the health and
nutrition of school children. Results from this study suggested poor school
achievements as an indicator of under-nutrition; in particular, school-aged children
deficient in iodine and iron exhibited diminished learning capacity when compared to
children replete with these minerals. The lack of nutrients encourages fortification of
food with vitamins and minerals such as with the fortified maize meal served by the
NSNP.
According to Wardlaw et al. (2004), children from low-income communities generally
experience more nutritional deprivation and overall illnesses, and are more severely
affected than children from less economically deprived communities. Poverty (the
inability to secure the minimum consumption requirements for life and health
efficiently) is therefore a major cause of hunger and malnutrition (Nnakwe, 2013).
Additionally, illnesses constitute one of the major factors contributing to child
malnutrition, particularly by causing diarrhoea and infectious diseases, as they
8
interfere with the body’s ability to utilize the nutrients consumed (Panda, 2010).
Conversely, malnutrition makes a child more susceptible to infectious diseases, and
the combination of malnutrition and infection is a major contributing factor to child
morbidity and mortality in developing countries (Wardlaw et al., 2004; Blake et al.,
2010). Figure 1.1 indicates the cyclical relationship between malnutrition and
infection. With a deficiency of energy, the person may develop the symptoms of
under-nutrition with an evident loss of body mass and becoming prone to infection
and disease. With the deficiency of a nutrient, the person may experience skin rash,
depression, hair loss, bleeding gums, muscle spasms, night blindness and/or other
symptoms. Symptoms such as diarrhoea, skin rash and fatigue are easily
overlooked as indicators of malnutrition because they resemble the symptoms of
other diseases (Whitney and Rolfes, 2008). Nutrition, in general, plays an important
role in preventing disease and promoting health.
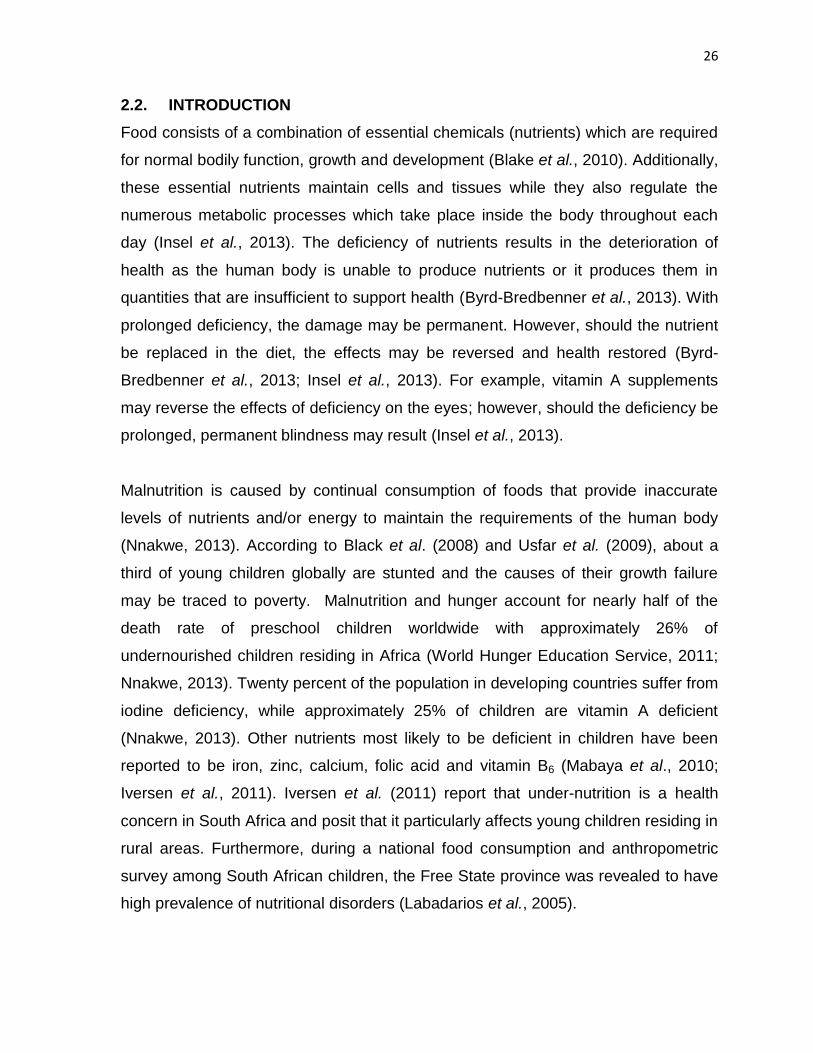
Micronutrient deficiencies are prevalent in South Africa and are affecting especially
vulnerable groups such as children and elderly people who are at a higher risk of
becoming inadequately nourished (Brown, 2002; Kloka, 2003). There is no single
food source which contains all the required nutrients. Adequate diets are achievable
by including foods that are quality sources of numerous nutrients and should include
fruits, vegetables, grains and dairy and meat products (Brown, 2002). In addition to
poor nutritional status, knowledge of nutrition among South African communities is
unsatisfactory and, even among those with relatively accurate knowledge, it is often
not applied (Walsh, 1995). The NSNP is therefore a key strategic programme in
decreasing the effects of malnutrition among school attending children in South
Africa (DBE, 2010a).
9
Figure 1.1. Cycle of infection and malnutrition (adapted from Macallan, 2009)
Malnutrition Infection
Increased metabolic
rate
Anorexia
Negative energy balance
Wasting
Acute phase response
Protein catabolism
Increased risk
Compromised barrier
defenses
Impaired humoral immunity
Increased severity
Impaired cellular immunity
10
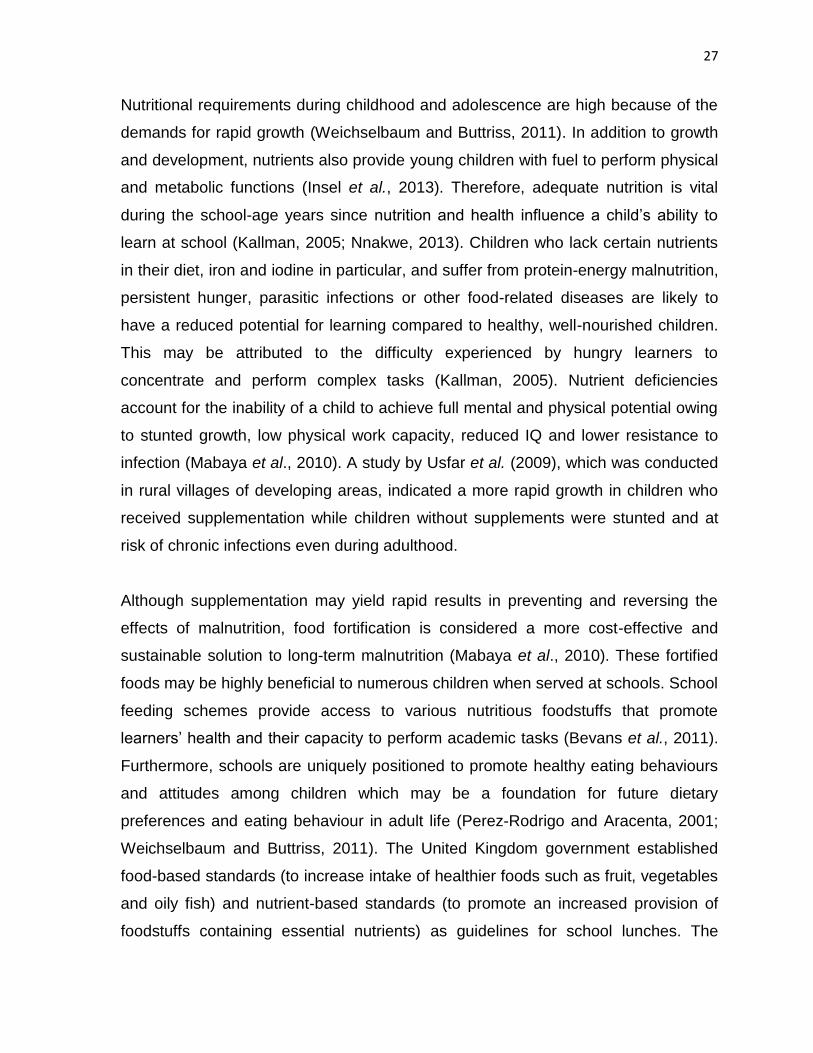
1.2.2. Nutrition during childhood and adolescence
Childhood and adolescence are periods in which the human body develops from
infancy to adulthood. During these periods, the body changes significantly in terms
of physical, hormonal, reproductive and emotional status (Eastwood, 1999). Due to
the rapid growth and development of children, nutritional wellbeing is critical during
childhood and adolescence. Furthermore, the nutritional state of an individual is
dependent on total food intake, rate of growth and physical activity (Francis, 1986;
Whitney and Rolfes, 2008). Carbohydrate intake, as a measure of percentage, for
children beyond one year of age, should remain the same through the ages into
adulthood (Whitney and Rolfes, 2008; Blake et al., 2010; and Insel et al., 2013).
Fibre recommendations for younger children with low energy intakes are less than
those for older ones with high energy intakes. In addition, the protein requirement
declines slightly with age when the child’s body weight is considered; however, total
protein needs increase slightly with age, while the vitamin and mineral requirements
of children increase with age. Energy and nutrient needs are greater during
adolescence than at any other stage of life, except during pregnancy and lactation.
Characteristically, nutrient needs rise throughout childhood, peak in adolescence
and then level off or diminish as the adolescents become adults (Whitney and
Rolfes, 2008; Insel et al., 2013). It is noteworthy that all people throughout life need
the same nutrients in varying quantities (Marotz et al., 1997). Feeding and nutrition
education programmes in schools, when adequately implemented, provide not only
essential nutrients for the children, but they also provide the opportunity for children
to learn to make responsible choices regarding dietary intake (Lucas, 1993).
When children do not receive regular meals, their behaviour and academic
performance are affected (Simeon, 1998). Non-specific symptoms of malnutrition
are frequently seen in children with nutritional imbalances. In the majority of the
cases these are of a psychological nature and include: impulsive and difficult
behaviour; perceptual and auditory disability; acting without considering the
consequences of their actions; seldom finishing tasks that they have started;
imperviousness to the feeling of others; stubbornness; displaying a negative attitude;
11
and bullying may be part of the syndrome (Serfontein, 2001). Under-nutrition during
childhood may further weaken resistance to infection because immune function
decreases when nutrients such as protein, vitamin A and zinc are inadequate in the
diet (Figure 1.1) (Wardlaw et al., 2004). Essential vitamins and minerals for young
children (ages 2 to 8) include iron, zinc, vitamin E, and vitamin D and for
adolescents (ages 9 to 19), micronutrient requirements include iron, calcium and
vitamin A (Insel et al., 2013). Nutrients most likely to be low or deficient in growing
children are calcium, iron and vitamins A and C (Lucas, 1993). Deficiencies in
vitamin A, zinc, iron and protein may result in illness, stunted growth, partial
development and possibly permanent blindness. Whitney and Rolfes (2008)
recommend that children’s meals should include a variety of foods from each food
group to provide all the required nutrients. Healthy, well-nourished children are
usually alert in the classroom and energetic while performing physical activities.
1.3. FOOD SAFETY ASPECTS ASSOCIATED WITH THE NATIONAL SCHOOL
NUTRITION PROGRAMME
Food-borne illness resulting from consumption of foods or beverages contaminated
with pathogenic bacteria has been an important public health concern for several
years (Caillet et al., 2009). In earlier years, investment in food safety interventions
was not considered a priority in developing countries where the main concern was
the sufficient supply of food (Käferstein, 2003). This tendency has altered over the
years with the increase in food related diseases. Estimations indicate that each year
approximately a million people suffer from a food-borne illness, about 20 000 people
receive hospital treatment and that there are around 500 deaths caused by food-
borne illness in the United Kingdom alone (FSA, 2011). Estimates in the United
States indicate that roughly 48 million people become ill each year, 128 000 are
hospitalized, and 3 000 die due to food-borne diseases (CDC, 2013). In addition,
estimations by the World Health Organization (WHO) reveal that 70% of the
diarrheal diseases in African children are due to consumption of contaminated
complementary food, leading to an estimated 30 660 deaths of children per year in
Africa (CDC, 2013). In South Africa records of food-borne illnesses are not efficiently
12
documented and although food-borne disease outbreaks are common in the
country, literature reporting this is insufficient (Benade, 1996; Karas et al., 2001;
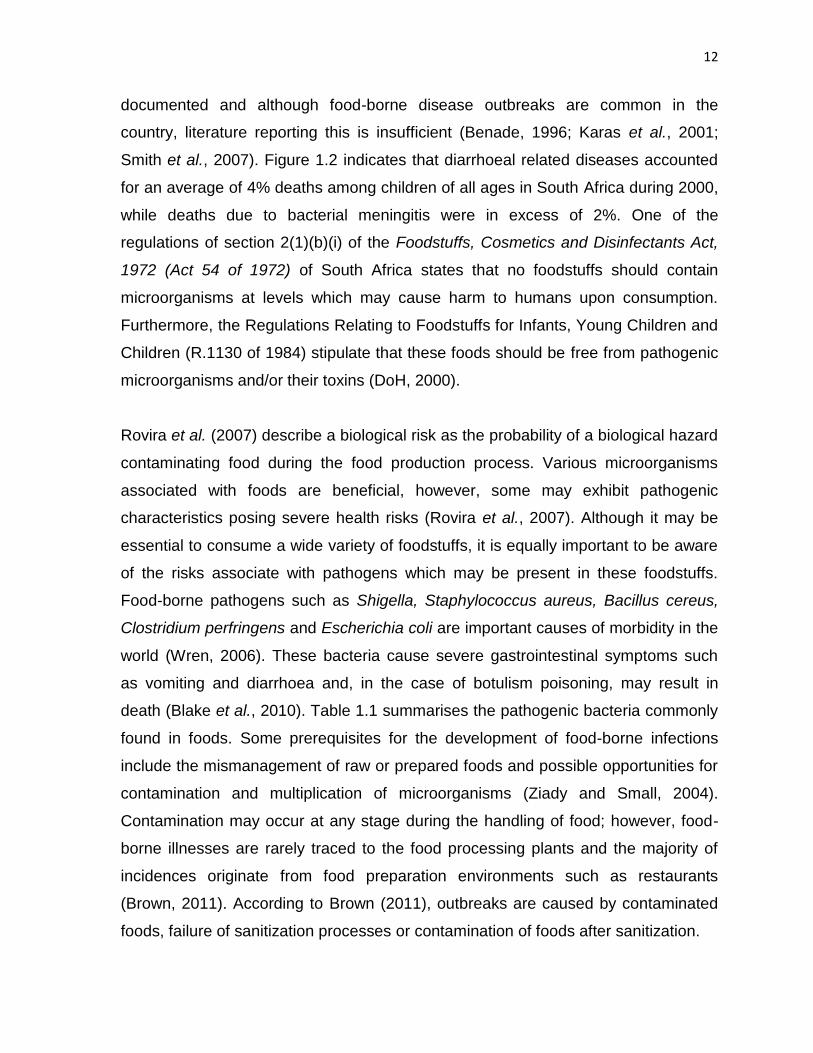
Smith et al., 2007). Figure 1.2 indicates that diarrhoeal related diseases accounted
for an average of 4% deaths among children of all ages in South Africa during 2000,
while deaths due to bacterial meningitis were in excess of 2%. One of the
regulations of section 2(1)(b)(i) of the Foodstuffs, Cosmetics and Disinfectants Act,
1972 (Act 54 of 1972) of South Africa states that no foodstuffs should contain
microorganisms at levels which may cause harm to humans upon consumption.
Furthermore, the Regulations Relating to Foodstuffs for Infants, Young Children and
Children (R.1130 of 1984) stipulate that these foods should be free from pathogenic
microorganisms and/or their toxins (DoH, 2000).
Rovira et al. (2007) describe a biological risk as the probability of a biological hazard
contaminating food during the food production process. Various microorganisms
associated with foods are beneficial, however, some may exhibit pathogenic
characteristics posing severe health risks (Rovira et al., 2007). Although it may be
essential to consume a wide variety of foodstuffs, it is equally important to be aware
of the risks associate with pathogens which may be present in these foodstuffs.
Food-borne pathogens such as Shigella, Staphylococcus aureus, Bacillus cereus,
Clostridium perfringens and Escherichia coli are important causes of morbidity in the
world (Wren, 2006). These bacteria cause severe gastrointestinal symptoms such
as vomiting and diarrhoea and, in the case of botulism poisoning, may result in
death (Blake et al., 2010). Table 1.1 summarises the pathogenic bacteria commonly
found in foods. Some prerequisites for the development of food-borne infections
include the mismanagement of raw or prepared foods and possible opportunities for
contamination and multiplication of microorganisms (Ziady and Small, 2004).
Contamination may occur at any stage during the handling of food; however, food-
borne illnesses are rarely traced to the food processing plants and the majority of
incidences originate from food preparation environments such as restaurants
(Brown, 2011). According to Brown (2011), outbreaks are caused by contaminated
foods, failure of sanitization processes or contamination of foods after sanitization.
13
Boys 5–9 years (N=2391) Girls 5–9 years (N=1534)
Boys 10–14 years (N=2513) Girls 10–14 years (N=1335)
Figure 1.2. Leading causes of mortality among children aged 5–14 years, South Africa 2000 (adapted from Bradshaw et
al., 2003)
1.7%
1.7%
2.5%
2.5%
2.9%
3.1%
4.1%
4.4%
4.9%
21.5%
28.8%
0.0% 5.0% 10.0% 15.0% 20.0% 25.0% 30.0% 35.0%
Tuberculosis
Epilepsy
Other nervous system disorders
Bacterial meningitis
Homicide/violence
Lower respiratory infections
Diarrhoeal diseases
Fires
Drowning
HIV/AIDS
Road traffic accidents
1.6%
1.7%
1.7%
2.2%
2.9%
3.1%
3.3%
3.5%
3.5%
21.9%
33.0%
0.0% 5.0% 10.0% 15.0% 20.0% 25.0% 30.0% 35.0%
Drowning
Protein-energy malnutrition
Other nervous system disorders
Tuberculosis
Bacterial meningitis
Lower respiratory infections
Fires
Diarrhoeal diseases
Homicide/violence
Road traffic accidents
HIV/AIDS
2.8%
2.9%
3.1%
3.4%
4.0%
4.1%
4.3%
4.6%
7.9%
9.0%
18.3%
0.0% 5.0% 10.0% 15.0% 20.0%
Septicaemia
Tuberculosis
Epilepsy
Other nervous system disorders
Suicide
Diarrhoeal diseases
Bacterial meningitis
Lower respiratory infections
Drowning
Homicide/violence
Road traffic accidents
3.2%
3.2%
3.3%
3.4%
3.5%
3.9%
4.5%
4.6%
7.2%
7.3%
14.9%
0.0% 5.0% 10.0% 15.0% 20.0%
Other nervous system disorders
Rheumatic heart disease
Drowning
Epilepsy
Suicide
Bacterial meningitis
Tuberculosis
Diarrhoeal diseases
Lower respiratory infections
Homicide/violence
Road traffic accidents
14
Table 1.1. Common food-borne pathogens and illnesses (adapted from Insel et al., 2013)
Bacteria Sources Diseases and symptoms
Campylobacter jejuni Raw poultry, meat and unpasteurised milk
Campylobacteriosis Onset: usually 2 to 5 days after eating Symptoms: diarrhoea, stomach cramps, fever, bloody stools - lasts 7 to 10 days
Clostridium botulinum (illness is caused by a toxin produced by this organism)
Improper canned foods such as corn, green beans, soups, beets, asparagus, mushrooms, tuna, and liver pate; also, luncheon meats, ham, sausage, garlic in oil, lobster, and smoked and salted fish
Botulism Onset: 18 to 36 hours after eating Symptoms: nerve dysfunction such as double vision, inability to swallow, speech difficulty, and progressive paralysis of respiration system. Can lead to death.
Escherichia coli O157:H7
Raw or undercooked meat, raw vegetables, unpasteurised milk, minimally processed ciders and juices, contaminated water
E. coli infection Onset: 2 to 5 days after eating Symptoms: watery and bloody diarrhoea, severe stomach cramps, dehydration, colitis, neurological symptoms, stroke, and haemolytic uremic syndrome (HUS), a particularly serious disease in young children that can cause kidney failure and death.
Listeria monocytogenes Soft cheeses, unpasteurised milk, hot dogs, luncheon meat, cold cuts, other deli-style meat and poultry Note: resist salt, heat, nitrites, and acidity better than most microorganisms
Listeriosis Onset: 7 to 21 days after eating, but symptoms have been reported 9 to 48 hours after eating Symptoms: fever, headache, nausea, and vomiting; primarily affects pregnant women and their foetuses, newborns, older adults, and people with cancer and compromised immune systems. Can cause death in foetuses and babes.
15
Table 1.1. Common food-borne pathogens and illnesses (continued)
Bacteria Sources Diseases and symptoms
Salmonella Raw or undercooked meats, poultry, eggs, raw milk and other dairy products; seafood; fresh produce, including raw sprouts; coconut; pasta; chocolate; foods containing raw eggs
Salmonellosis Onset: 1 to 3 days after eating Symptoms: nausea, abdominal cramps, diarrhoea, fever, and headache
Shigella Undercooked liquids or moist food that has been handled by an infected person
Shigellosis (bacillary dysentery) Onset: 12 to 50 hours after eating Symptoms: stomach cramps; diarrhoea; fever; sometimes vomiting; and blood, pus, and mucus in stools
Staphylococcus aureus (illness is caused by a toxin produced by this organism)
Meat and poultry; egg products; tuna, potato, and macaroni salads; cream-filled pastries and other foods left unrefrigerated for long periods Note: S. aureus is frequently found in cuts on skin and nasal passages
Staphylococcal food poisoning Onset: 1 to 6 hours after eating Symptoms: diarrhoea, vomiting, nausea, stomach pain and cramps - lasts 1 to 2 days.
Vibrio vulnificus Raw seafood, especially raw oysters Vibrio infection Onset: 1 to 7 days after eating Symptoms: chills, fever, nausea and vomiting, and possibly death, especially in people with underlying heath problems
16
Additionally, the main factors associated with food-borne illness are poor personal
hygiene, cross-contamination and incorrect time/temperature control. The general
principle steering food safety is to provide food that will not cause harm when
consumed. To prevent food-borne illness, food service personnel, food flow (such as
purchasing, storage, preparation, cooking, holding, cooling, reheating and
sanitation) and food safety programmes should be implemented and closely
monitored (Brown, 2011). Furthermore, food safety is achievable by the application
of a number of systems which include good manufacturing practices (GMPs), good
hygiene practices (GHPs) and hazard analysis critical control point (HACCP)
systems as well as pre-requisite programs (PRPs) which provide guidelines to
minimize the risk of contamination (Blackburn, 2003; Brown, 2011).
1.4. RATIONALE
1.4.1. Problem delineation
Food poisoning contributes significantly to mortality and despite advances in
hygiene, consumer knowledge, food treatment and food processing, food-borne
pathogens represent a significant threat to human health worldwide (Wren, 2006).
The South African food legislation further requires that surfaces and foodstuffs made
available to the general public should be hygienic and free of harmful substances
and organisms (R.1183 of 1990; R.918 of 1999). Although annual reports of the
DBE indicate the success of the NSNP (DBE, 2009; DBE, 2010a; DBE, 2011),
studies conducted in various areas in the country focusing on the efficacy of the
programme revealed deficiencies. A study by Napier et al. (2009) indicated that
malnutrition remains a persistent problem amongst school children even with the
implementation of programmes such as the NSNP. Results of studies by Noe (2005)
and Manyatsa (2007) indicated a lack of resources to support the daily operations of
the programme in schools. Children catered for by feeding programmes are from
poverty stricken communities and possibly attend schools without receiving decent
meals and for majority of these children, the meals provided through the NSNP are
their main, and in some cases their sole, sources of energy and nutrients. If these
17
meals are nutrient deficient, the nutritional wellbeing of the recipients may be
compromised and further promotes malnutrition. Feeding children at schools
motivates them to attend classes and children learn more efficiently when they are
fed. An improvement in school attendance was observed as a result of the
intervention of a school feeding programme in Kenya (Vermeersch and Kremer,
2004). With education, these children may be able to discontinue the cycle of
poverty in society.
As indicated in the first newsletter of the year 2010, the NSNP considers nutrition,
food safety and food being served in a dignified manner a priority (DBE, 2010b).
Previous studies conducted with regards to the programme were conducted before
2009 while it was still the PSNP (Noe, 2005; Manyatsa, 2007; Napier et al., 2009).
These studies therefore focused mainly on fortified biscuits, which was the main
food item served by the programme during their studies. Since then two major
changes have been implemented with regards to the programme: 1) it has currently
expanded to secondary schools; and 2) a more diverse menu has been introduced.
The wider food range on the menu offers the programme a nutritional advantage;
however it further allows for a wider opportunity for microbial contamination.
Additionally, with cases of food-borne illnesses on the increase, food safety should
not be overlooked. Food safety is essential with regards to the NSNP because it
caters for young, school-aged children. Young children are at greater risk of
contracting food poisoning since their digestive and immune systems are not as fully
developed as in adults. Food poisoning outbreaks are even more prevalent in
settings, such as that of the NSNP, where food is served in large quantities, by a
variety of people and to numerous individuals.
18
1.4.2. Aim and objectives
The overall aim of this study was to contribute towards the safety and
wholesomeness of food served through the NSNP.
The objectives of this study are listed as follows:
To evaluate the nutritional content of foodstuffs served through the NSNP;
To determine the microorganism prevalence on various surfaces that may
come into contact with food products as an indicator of general hygiene
during the administering of the programme;
To determine the knowledge, attitudes and practices (KAP) of the food
handlers and NSNP representatives with regards to food safety; and
To conclude on the inter-relationships and contribution of the empirical data
to the overall problem and the identification of possible solutions.
It is envisaged that the findings and recommendations as reported in this
dissertation will contribute to the body of knowledge of school feeding schemes. In
addition, the findings and recommendations will be offered in an attempt to improve
the effectiveness of the NSNP for its beneficiaries by making suggestions towards
preserving the nutritional content of meals served and reducing the health risks
Mean of values ± s.d. (standard deviation), (n = 3). ND: non-detected using the current method. *Onion, cooking oil, salt and spices were included during the preparation of all protein portions of meals except for school H.
36
sucrose. These results were attributed to the high starch content of the foodstuffs.
Carbohydrates (in the form of glucose) are the main source of energy in the human
diet and consist of a diverse family of compounds namely mono-, oligo- and
polysaccharides (Molnar-Perl, 2000; Muir et al., 2009; Insel et al., 2013). Further
illustrated in Table 2.1 are the total carbohydrate contents of meals which ranged
between 20.29 ± 0.76 and 59.41 ± 0.10 g.d-1. These data were significantly (P ≤
0.05) below the NBS minima of 70.6 and 86.1 g (Figure 2.1) for pupils aged 7–10
and 11–18 years, respectively. Similar results were observed from a study by
Nicholas et al. (2013) during which the school meals were below the standard (≥
86.1 g) required for carbohydrates and had a content of 73.2 ± 35.6 g. During a
study by Pearce et al. (2012), however, the school lunches yielded a carbohydrate
content which was above the standard at 89.2 ± 38.9 g.
2.4.2. Lipids and fatty acids
The values for the total lipid content ranged between 2.99 ± 0.81 and 16.49 ± 12.42
g.d-1 (Table 2.1) and were within the NBS of below 20.6 and 25.1 g for individuals
aged between 7–10 and 11–18 years respectively (Figure 2.1). A study by Haroun et
al. (2011) indicated that the majority of the school lunches also met the standard for
total fat content. Lipids, particularly fats, are dense sources of energy and facilitate
the absorption of fat-soluble dietary components such as vitamins. Lipids also aid in
regulating blood pressure and nerve transmissions (Gallagher, 2008; EFSA, 2010;
Medeiros and Wildman, 2012; Byrd-Bredbenner et al., 2013). While fat intake should
be kept minimal, intake below 25% of total energy had been associated with low
vitamin levels in young children (EFSA, 2010). Lipid intake further depends on the
composition of fatty acids and the health effects of various lipid components
(saturated, unsaturated and trans-fatty acids) (Gallagher, 2008). Table 2.2 lists the
fatty acids identified in the various samples analysed in this study. It is apparent that
saturated fatty acids were dominant in the majority of the meals. A high content of
saturated fatty acids in school lunches was also observed in the study by Pearce et
al. (2012). Saturated and monounsaturated fatty acids are synthesised by the
human body and are thus not required in the diet, whereas polyunsaturated fatty
37
Figure 2.1. Mean macronutrient values of meals sampled at various NSNP-participating schools (Each data point
represents triplicate values. The standard deviation was used as the error-bar)
0
10
20
30
40
50
60
70
80
90
100
A B C D E F G H I J
To
tal carb
oh
yd
rate
s (
g.d
-1)
Schools
0
5
10
15
20
25
30
35
A B C D E F G H I J
Lip
ids (
g.d
-1)
Schools
NBS (11 - 18 years)
NBS (7 - 10 years)
0
5
10
15
20
25
30
35
A B C D E F G H I J
Pro
tein
(g
.d-1
)
Schools
0
500
1000
1500
2000
2500
3000
A B C D E F G H I J
En
erg
y (
kJ.d
-1)
Schools
38
Table 2.2. Fatty acid compositions of meals served by various NSNP-benefiting schools in Bloemfontein
clothing/protective clothing (Marriott, 1989; Hazelwood and McLean, 1991; Tan et
al., 2013). Other sources of food-borne illnesses include ingesting unwashed foods,
utilizing contaminated cutting boards and knives, and allowing prolonged periods
between cooking and refrigeration. Some causes of food-borne illness may be less
obvious, such as ingestion of raw foods. Although using more unprocessed fruits
and vegetables is encouraged, it is important to be aware of such raw foods which
are likely to cause illness since high cooking temperatures are required to destroy
microorganisms (Marotz et al., 1997).
Studies have indicated that food handlers in food environments often lack
knowledge regarding basic food hygiene (Clayton et al., 2002; Baş et al., 2006) and
that ignorance and carelessness often result in poor hygiene which may have
consequences for both food distributors and consumers (Hazelwood and McLean,
1991). According to Yiannas (2009), inadequate cooking of food and failure to
maintain the cleanliness of hands, protective clothing and preparation surfaces, as
well as failure to take the necessary precautions when injury and illnesses have
occurred, are behavioural aspects which are underlining factors when administering
82
food safety. There is therefore an increasing need for education and awareness
among food handlers regarding safe food handling.
Food safety awareness is particularly important during administration of large-scale
food service operations, such as food aid programmes, food provision at large
events and school feeding schemes. The factors that render these activities
particularly risky include the magnitude of the operation, knowledge of the food
handlers and health statuses of the intended consumers. With regards to the
National School Nutrition Programme (NSNP) in South Africa, volunteer food
handlers are expected to maintain high levels of personal hygiene and hygiene of
the preparation areas (DBE, 2009). Moreover, they are required to attend training
workshops on health and hygienic standards to improve on the quality and safety of
meals. However, previous studies found shortfalls while evaluating the practices,
behaviours and environments associated with the NSNP (Noe, 2005; Manyatsa,
2007). The purpose of this study was therefore to evaluate the food safety
knowledge, attitudes and practices (KAP) of food handlers and NSNP
representatives towards general food safety principles while administering the
programme in schools.
4.3. MATERIALS AND METHODS
A survey in the form of structured interviews was conducted in 20 schools in the
Bloemfontein area of the Free State Province, South Africa. To obtain a
representative sample, the schools were randomly selected from a list of NSNP-
participating schools which resorted under various categories (primary, intermediate,
combined and special schools which were categorised under quintiles 1 to 3 and
were in the rural and urban regions) as assigned by the Department of Basic
Education (DBE). Each interview was completed in the interviewee’s preferred
language with the aid of a structured questionnaire (Appendix 4). This enabled the
interviewer to explain each question so as to avoid misinterpretation. The questions
aimed to determine the perceptions, knowledge, attitudes and behaviours of the
participants with regards to general food safety principles and practices required
83
under the programme. The participants comprised two individuals from each school;
the first was the NSNP representative/committee member allocated at the school
(one of the teachers in the majority of the cases) and the second was a food handler
(a community member selected by the School Governing Body). A total of 40
respondents were thus interviewed. In addition to the interviews, observations of the
actual practices and behaviours of the food handlers were noted in accordance with
the associated questionnaire categories and compared with the findings of similar
studies in the region (Noe, 2005; Manyatsa, 2007).
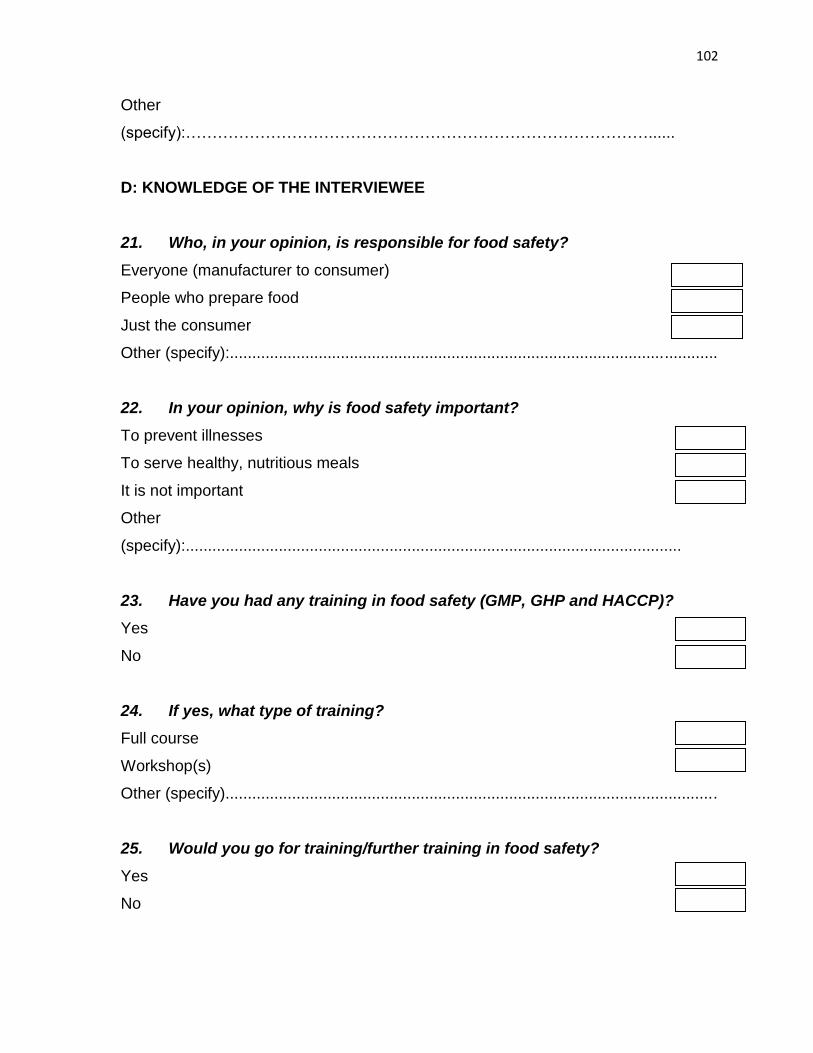
4.4. RESULTS AND DISCUSSION
4.4.1. Demographic characteristics of participants
Table 4.1 shows that the interviewees were primarily black (92.5%), female (97.5%),
above the age of 30 and had South Sotho as a home language. The majority of the
respondents (65%) were permanently employed by the schools while 22.5% worked
on contract. Fifty percent of the respondents were educators who were also
responsible for administering the NSNP at the schools, while the rest were the food
handlers (data not shown). Approximately 42.5% of the respondents had a tertiary
qualification while 40% and 15% held a secondary and a primary level education,
respectively, whereas 2.5% were uneducated. The majority of the participants
(67.5%) were English proficient while others (27.5%) had a fair understanding of the
language and only 5% had a poor understanding (Table 4.1). In a study by Dworkin
et al. (2011), the authors indicated that non-English speaking persons tended to
have less knowledge of food safety than those who were more fluent in English
since training and information regarding food safety are predominantly conducted
and distributed in English.
As illustrated in Table 4.1, 65% of the participants had been working at the schools
for more than a year and the majority had been part of the NSNP for the same
period as they had been at the schools. Forty-eight percent of the participants had
received additional training, the majority of which was not in food safety. This does
84
Table 4.1. Demographic information of participants from various NSNP-participating
schools in Bloemfontein
Variable Frequency Occurrence (%)
Gender (n = 40) Female 39 97.5 Male 1 2.5
Age (n = 40)
Below 20 0 0
20-30 4 10
31-40 9 22.5
41-50 15 37.5
50 and above 12 30
Race (n = 40)
Black 37 92.5
Coloured 1 2.5
White 2 5
Home language (n = 40)
South Sotho 17 42.5
Tswana 10 25
Xhosa 10 25
Afrikaans 3 7.5
English proficiency (n = 40)
Poor 2 5
Fair 11 27.5
Good 27 67.5
Employment status (n = 40)
Permanent 26 65
Volunteer 5 12.5
Contract 9 22.5
Educational level (n = 40)
None 1 2.5
Primary 6 15
Secondary 16 40
Tertiary 17 42.5
Additional training (n = 39)
Yes 19 48
No 20 51
Period of employment at the school (n = 40)
<3 months 3 7.5
3-6 months 7 17.5
7-12 months 4 10
>12 months 26 65
85
not reflect the requirement of the DBE that food handlers are expected to attend all
training workshops on health and hygienic standards (DBE, 2009).
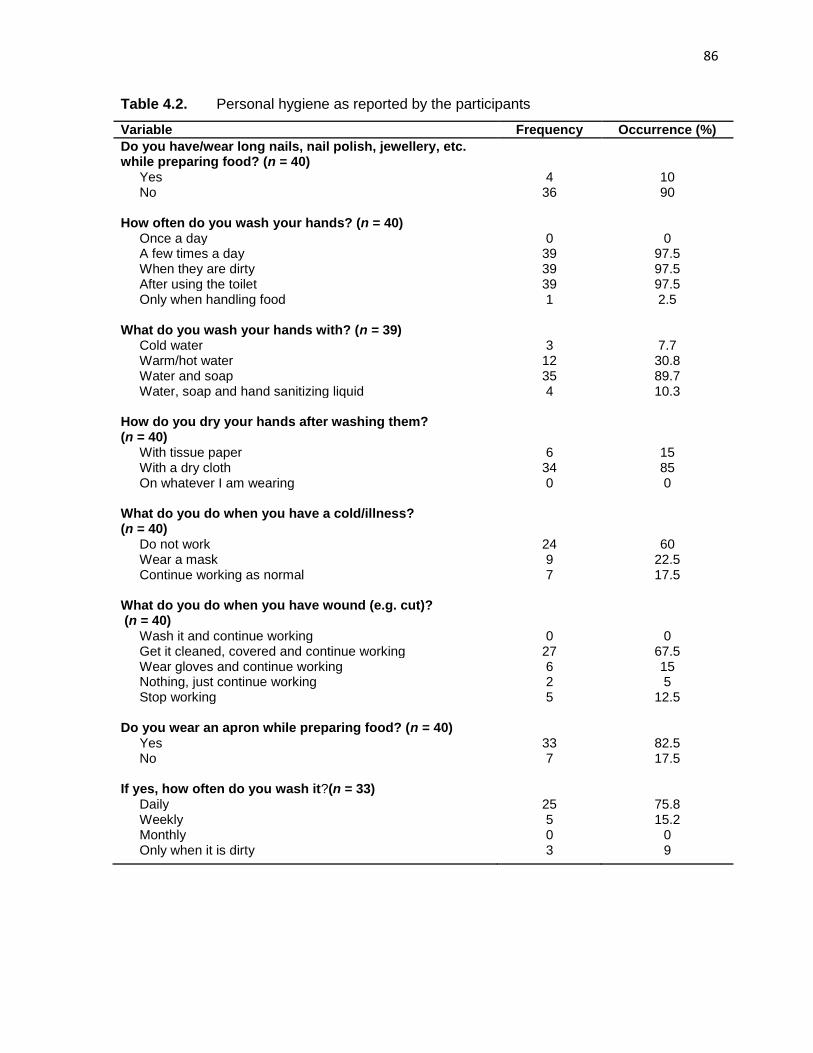
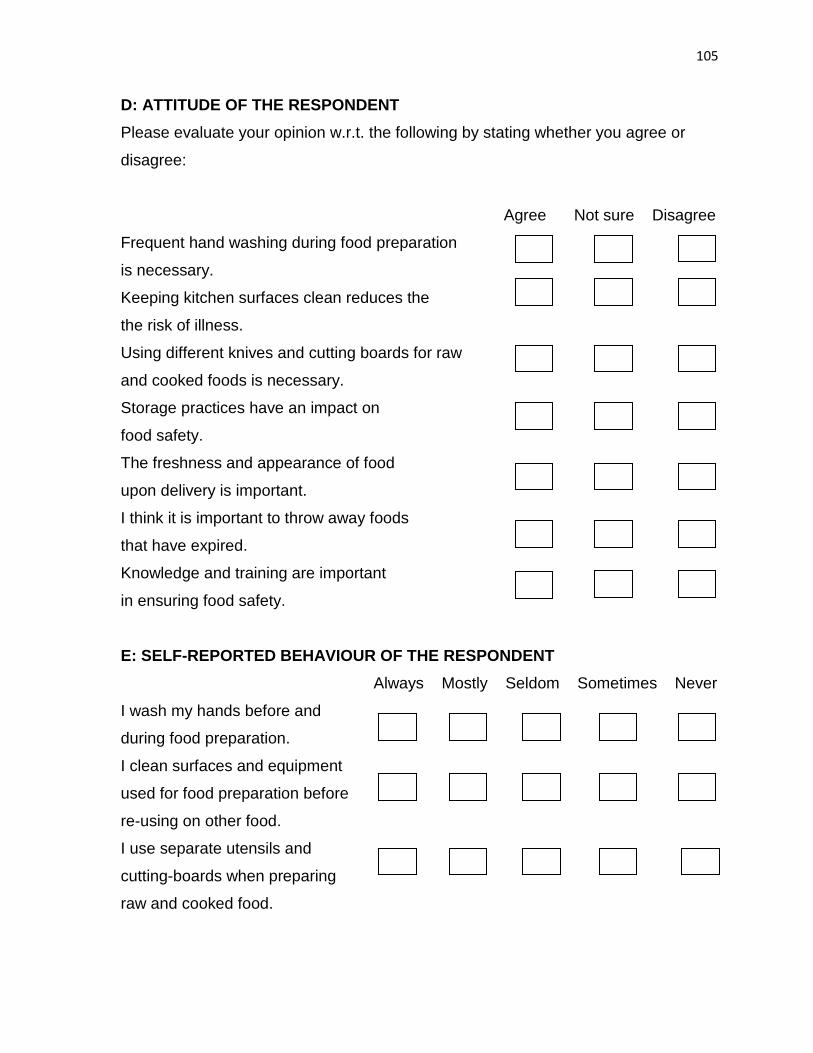
4.4.2. Personal hygiene behaviours
Table 4.2 shows that 90% of the participants did not have long nails and neither did
they wear jewellery or nail polish while preparing food. Jewellery should not be worn
during food preparation since the skin under the jewellery may not be washed and
dried properly and may harbour bacteria, while parts of the jewellery could drop into
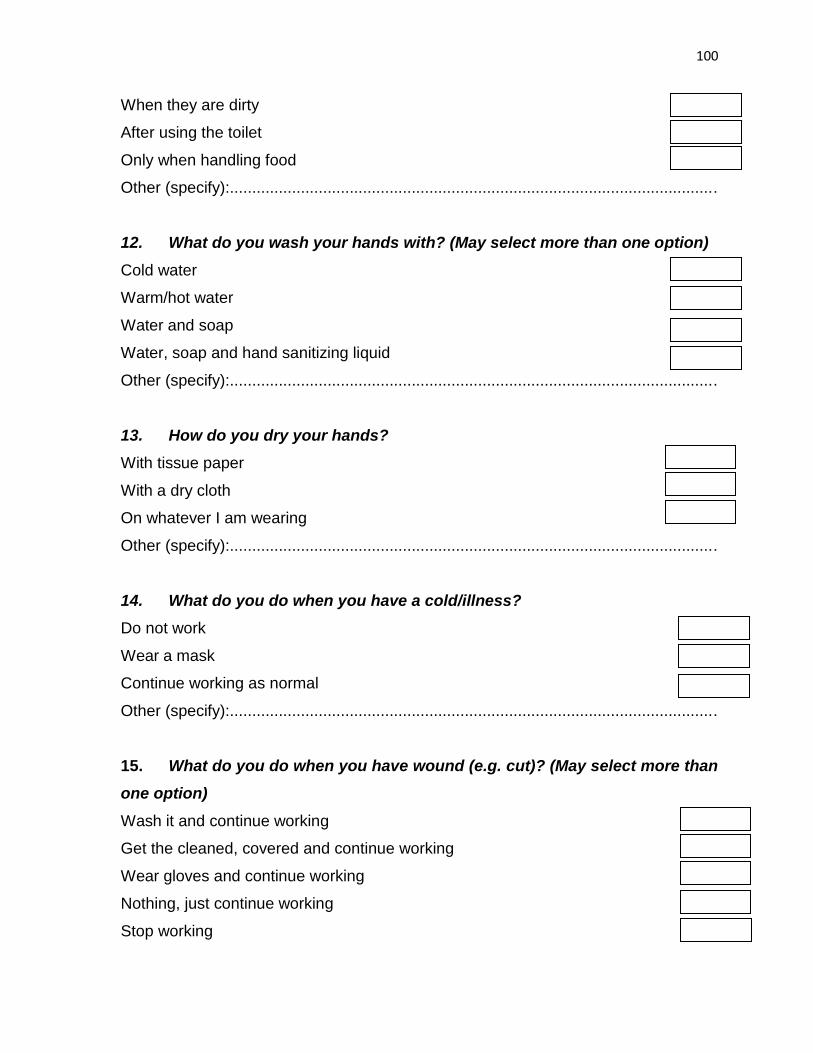
the food (Hobbs and Roberts, 1993). Ninety-eight percent of the participants claimed
to wash their hands several times during the day, 35% washed their hands with
warm water and 7.7% used cold water. Ninety percent of the participants washed
their hands with water and soap only while 10.3% claimed to also use hand
sanitizing liquid (Table 4.2). Additionally, 97.5% of respondents reportedly always
washed their hands before and during food preparation while 2.5% mostly adhered
to this practice (data not shown). These results are in agreement with those
obtained from a study by Tan et al. (2013) during which hand-washing was the most
familiar practice performed by the respondents. Table 4.2 further illustrates that after
washing their hands, 85% of the participants claimed to dry them using a dry cloth.
Although none admitted to practising this, some of the food handlers were witnessed
drying their hands on clothing such as aprons and overalls, which is likely to result in
cross-contamination as ordinary clothing is frequently contaminated with dust and
hair (Trickett, 2002).
Personal hygiene is the most effective manner of achieving food hygiene (Hobbs
and Roberts, 1993; Trickett, 2002; Baş et al, 2006). The hands of food service
employees may be vectors in the spread of food-borne diseases as a result of poor
personal hygiene and cross-contamination. For example, an employee may
contaminate the hands when using the toilet, or bacteria may be spread from raw
meat to a salad by a food handler’s hands (Hayes, 1985; Baş et al., 2006).
Therefore, food-borne illnesses may be transmitted through failure to wash hands
thoroughly (Hayes, 1985; Marotz et al., 1997; Latif et al., 2013). Trickett (2002) and
86
Table 4.2. Personal hygiene as reported by the participants
Variable Frequency Occurrence (%)
Do you have/wear long nails, nail polish, jewellery, etc. while preparing food? (n = 40)
Yes 4 10 No 36 90
How often do you wash your hands? (n = 40)
Once a day 0 0 A few times a day 39 97.5 When they are dirty 39 97.5 After using the toilet 39 97.5 Only when handling food 1 2.5
What do you wash your hands with? (n = 39)
Cold water 3 7.7 Warm/hot water 12 30.8 Water and soap 35 89.7 Water, soap and hand sanitizing liquid 4 10.3
How do you dry your hands after washing them? (n = 40)
With tissue paper 6 15 With a dry cloth 34 85 On whatever I am wearing 0 0
What do you do when you have a cold/illness? (n = 40)
Do not work 24 60 Wear a mask 9 22.5 Continue working as normal 7 17.5
What do you do when you have wound (e.g. cut)? (n = 40)
Wash it and continue working 0 0 Get it cleaned, covered and continue working 27 67.5 Wear gloves and continue working 6 15 Nothing, just continue working 2 5 Stop working 5 12.5
Do you wear an apron while preparing food? (n = 40)
Yes 33 82.5 No 7 17.5
If yes, how often do you wash it?(n = 33)
Daily 25 75.8 Weekly 5 15.2 Monthly 0 0 Only when it is dirty 3 9
87
Sharif et al. (2013) identify hands, fingernails, nose, throat and mouth as habitats of
Salmonella spp, Staphylococcus aureus and Shigella spp which may cause illness
upon entering the intestinal tract. These bacteria may be removed and destroyed by
following proper hand-washing processes. The results of a study by Lee and Greiga
(2010) indicated a reduction in the risk of food-borne illness when food handlers
practised effective hand-washing techniques and received food safety training.
Table 4.2 shows that 60% of participants reportedly did not work when they were ill
and 67.5% claimed to treat and cover wounds before progressing with food
preparation. Individuals involved in food preparation and service should be free of
communicable diseases. Those suffering from any communicable diseases should
refrain from handling food. In some countries, those working in licensed child
facilities are required to supply written proof to the school or child care centre that
they are free of tuberculosis (Marotz et al., 1997). Treating and adequate covering of
cuts and wounds with waterproof plasters is essential since even small wounds on
the skin may be sources of S. aureus (Trickett, 2002; Arvanitoyannis and Varzakaz,
2009). Eighty-three percent of participants wore aprons of which 75.8% washed
them daily (Table 4.2). Food handlers should wear clean, washable clothing and
should change aprons frequently as they become dirty. In addition, hair should be
covered with a net while handling food (Marotz et al., 1997); however, this practice
was not observed among food handlers during the current study.