
HYGIENE AND NUTRITIONAL CONTENT OF THE
NATIONAL SCHOOL NUTRITION PROGRAMME IN
BLOEMFONTEIN, SOUTH AFRICA
by
Nthabiseng Nhlapo
Dissertation submitted in fulfilment of the requirements for the degree of
Master of Technology in Environmental Health
School of Life Sciences
Central University of Technology, Free State
Supervisor: Dr. WH Groenewald (PhD: Food Science)
Co-supervisor: Prof. JFR Lues (PhD: Food Science)
October 2013

ii
DECLARATION
I, the undersigned, hereby declare that the work contained in this dissertation is
my own original work, except for assistance which is acknowledged. I declare
further that I have not previously submitted this dissertation, in its entirety or
partially, at any other tertiary institution in respect of a qualification.
Nthabiseng Nhlapo Date
iii
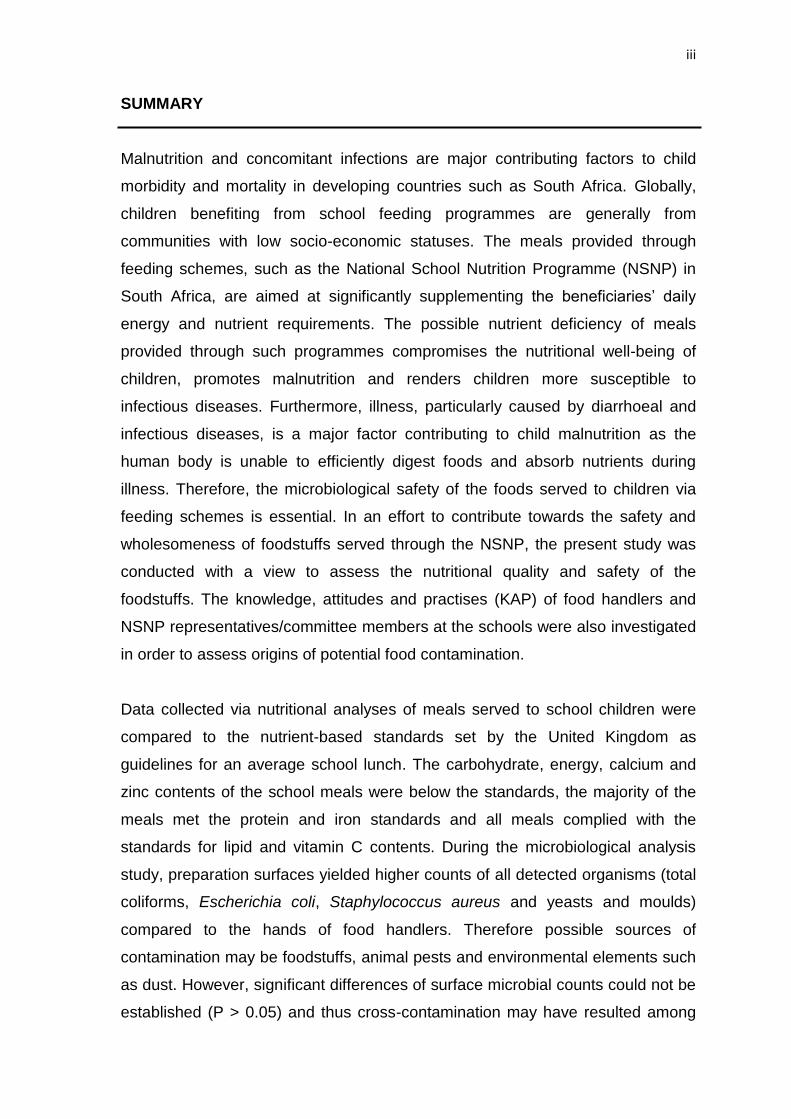
SUMMARY
Malnutrition and concomitant infections are major contributing factors to child
morbidity and mortality in developing countries such as South Africa. Globally,
children benefiting from school feeding programmes are generally from
communities with low socio-economic statuses. The meals provided through
feeding schemes, such as the National School Nutrition Programme (NSNP) in
South Africa, are aimed at significantly supplementing the beneficiaries’ daily
energy and nutrient requirements. The possible nutrient deficiency of meals
provided through such programmes compromises the nutritional well-being of
children, promotes malnutrition and renders children more susceptible to
infectious diseases. Furthermore, illness, particularly caused by diarrhoeal and
infectious diseases, is a major factor contributing to child malnutrition as the
human body is unable to efficiently digest foods and absorb nutrients during
illness. Therefore, the microbiological safety of the foods served to children via
feeding schemes is essential. In an effort to contribute towards the safety and
wholesomeness of foodstuffs served through the NSNP, the present study was
conducted with a view to assess the nutritional quality and safety of the
foodstuffs. The knowledge, attitudes and practises (KAP) of food handlers and
NSNP representatives/committee members at the schools were also investigated
in order to assess origins of potential food contamination.
Data collected via nutritional analyses of meals served to school children were
compared to the nutrient-based standards set by the United Kingdom as
guidelines for an average school lunch. The carbohydrate, energy, calcium and
zinc contents of the school meals were below the standards, the majority of the
meals met the protein and iron standards and all meals complied with the
standards for lipid and vitamin C contents. During the microbiological analysis
study, preparation surfaces yielded higher counts of all detected organisms (total
coliforms, Escherichia coli, Staphylococcus aureus and yeasts and moulds)
compared to the hands of food handlers. Therefore possible sources of
contamination may be foodstuffs, animal pests and environmental elements such
as dust. However, significant differences of surface microbial counts could not be
established (P > 0.05) and thus cross-contamination may have resulted among
iv
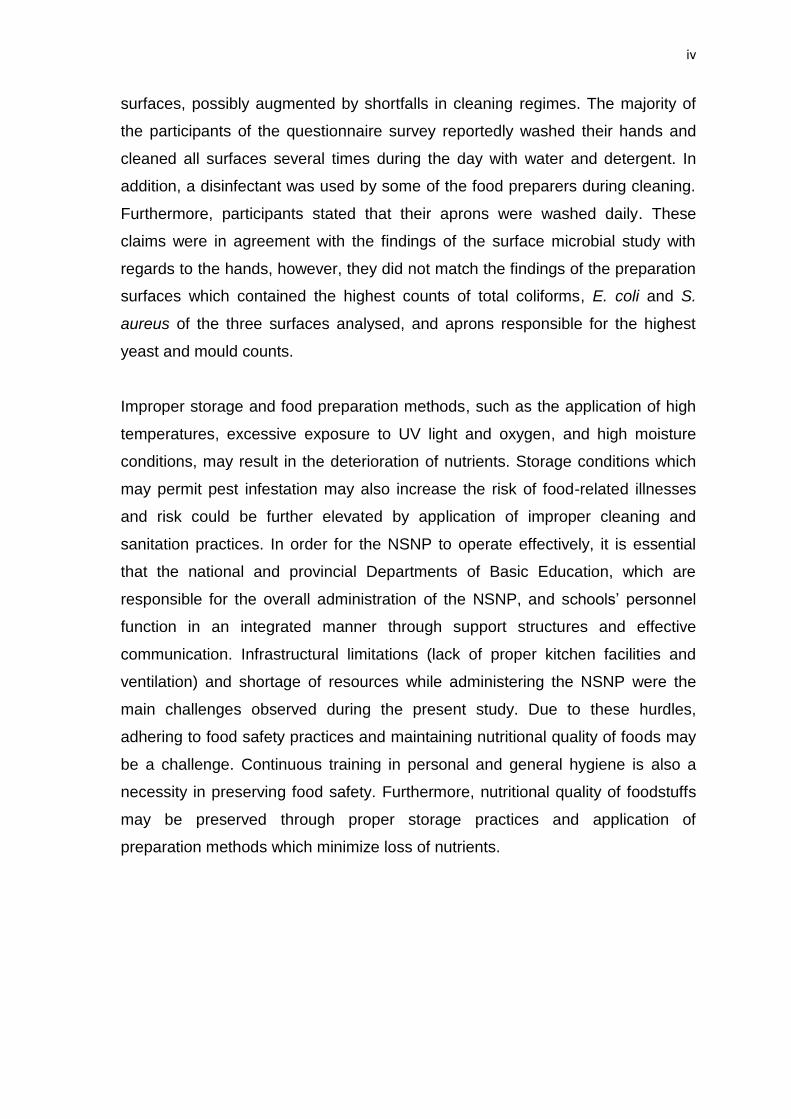
surfaces, possibly augmented by shortfalls in cleaning regimes. The majority of
the participants of the questionnaire survey reportedly washed their hands and
cleaned all surfaces several times during the day with water and detergent. In
addition, a disinfectant was used by some of the food preparers during cleaning.
Furthermore, participants stated that their aprons were washed daily. These
claims were in agreement with the findings of the surface microbial study with
regards to the hands, however, they did not match the findings of the preparation
surfaces which contained the highest counts of total coliforms, E. coli and S.
aureus of the three surfaces analysed, and aprons responsible for the highest
yeast and mould counts.
Improper storage and food preparation methods, such as the application of high
temperatures, excessive exposure to UV light and oxygen, and high moisture
conditions, may result in the deterioration of nutrients. Storage conditions which
may permit pest infestation may also increase the risk of food-related illnesses
and risk could be further elevated by application of improper cleaning and
sanitation practices. In order for the NSNP to operate effectively, it is essential
that the national and provincial Departments of Basic Education, which are
responsible for the overall administration of the NSNP, and schools’ personnel
function in an integrated manner through support structures and effective
communication. Infrastructural limitations (lack of proper kitchen facilities and
ventilation) and shortage of resources while administering the NSNP were the
main challenges observed during the present study. Due to these hurdles,
adhering to food safety practices and maintaining nutritional quality of foods may
be a challenge. Continuous training in personal and general hygiene is also a
necessity in preserving food safety. Furthermore, nutritional quality of foodstuffs
may be preserved through proper storage practices and application of
preparation methods which minimize loss of nutrients.

v
ACKNOWLEDGEMENTS
The collaboration of the following individuals and organisations is sincerely
appreciated:
God for His unconditional love and countless blessings.
My father, Tello Ben Nhlapo, for his continued support and encouragement.
Dr. Willem Groenewald and Prof. Ryk Lues for their management, guidance,
support and mentorship.
Edmore Kativu and Sarel Marais for laboratory assistance and guidance.
The National Research Foundation (NRF) and Central University of
Technology, Free State (CUT) for financial assistance.
The Free State Department of Basic Education for approving and supporting
the study and assisting where needed.
My sister, brother and cousin for their support and patience.
My colleagues for their support.
The Unit for Applied Food Safety and -Biotechnology staff members for their
support, advice and encouragement.

vi
TABLE OF CONTENTS
Page no.
Title page i
Declaration ii
Summary iii
Acknowledgements v
Table of contents vi
List of Tables ix
List of Figures x
List of Acronyms xi
Chapter 1: Introduction 1
1.1. Introduction to the South African National School Nutrition
Programme 2
1.2. Nutritional properties of the National School Nutrition Programme 5
1.2.1. Malnutrition 6
1.2.2. Nutrition during childhood and adolescence 10
1.3. Food safety aspects associated with the National School Nutrition
Programme 11
1.4. Rationale 16
1.4.1. Problem delineation 16
1.4.2. Aim and objectives 18
References 19
Chapter 2: Assessing the quality of food served under a school
feeding scheme: A nutritional analysis 24
2.1. Abstract 25
2.2. Introduction 26
2.3. Materials and methods 28
2.3.1. Sampling procedure 28
2.3.2. Gravimetric determination of moisture content 29
2.3.3. Analysis of soluble sugars by HPLC 29
2.3.4. Total carbohydrate determination 30

vii
2.3.5. Total lipid determination and fatty acids analysis
by GC-FID 30
2.3.6. Protein content determination 31
2.3.7. Analysis of Vitamins A and E 32
2.3.8. Vitamin C analysis 33
2.3.9. Determination of total ash and mineral content 33
2.3.10. Energy calculation 33
2.3.11. Analyses of data 33
2.4. Results and discussion 34
2.4.1. Carbohydrates 34
2.4.2. Lipids and fatty acids 36
2.4.3. Protein 39
2.4.4. Energy 40
2.4.5. Vitamins A and E 41
2.4.6. Vitamin C 41
2.4.7. Ash and mineral content 44
2.5. Conclusions 48
References 50
APPENDICES 57
Appendix 1. Nutrient-based standards for an average school lunch 58
Appendix 2. Calibration curve regression of mono- and disaccharides
over a calibration range of 0.4–3.2 g.l-1 59
Appendix 3. Chromatograms of vitamins A and E standards 60
Chapter 3: The prevalence of microbiota on food contact
surfaces associated with a South African school
feeding scheme 61
3.1. Abstract 62
3.2. Introduction 63
3.3. Materials and methods 65
3.3.1. Sampling protocol 65
3.3.2. Microbial analysis 65
3.4. Results and discussion 67

viii
3.5. Conclusions 72
References 73
Chapter 4: Food safety knowledge, attitudes and practices of food
handlers and representatives of a school feeding
programme 78
4.1. Abstract 79
4.2. Introduction 81
4.3. Materials and methods 82
4.4. Results and discussion 83
4.4.1. Demographic characteristics of participants 83
4.4.2. Personal hygiene behaviours 85
4.4.3. Self-reported behaviours regarding cleaning practices 87
4.4.4. Food safety knowledge of participants 88
4.4.5. Attitudes of participants towards food hygiene 91
4.5. Conclusions 93
References 95
APPENDICES 97
Appendix 4. KAP of food handlers and NSNP representatives while
administering the National School Nutrition Programme 98
Chapter 5: Conclusions 107
5.1. General conclusions 108
5.2. Concluding remarks on chapters 2, 3 and 4 108
5.3. Recommendations 111
5.4. Future research 112
References 113
ix
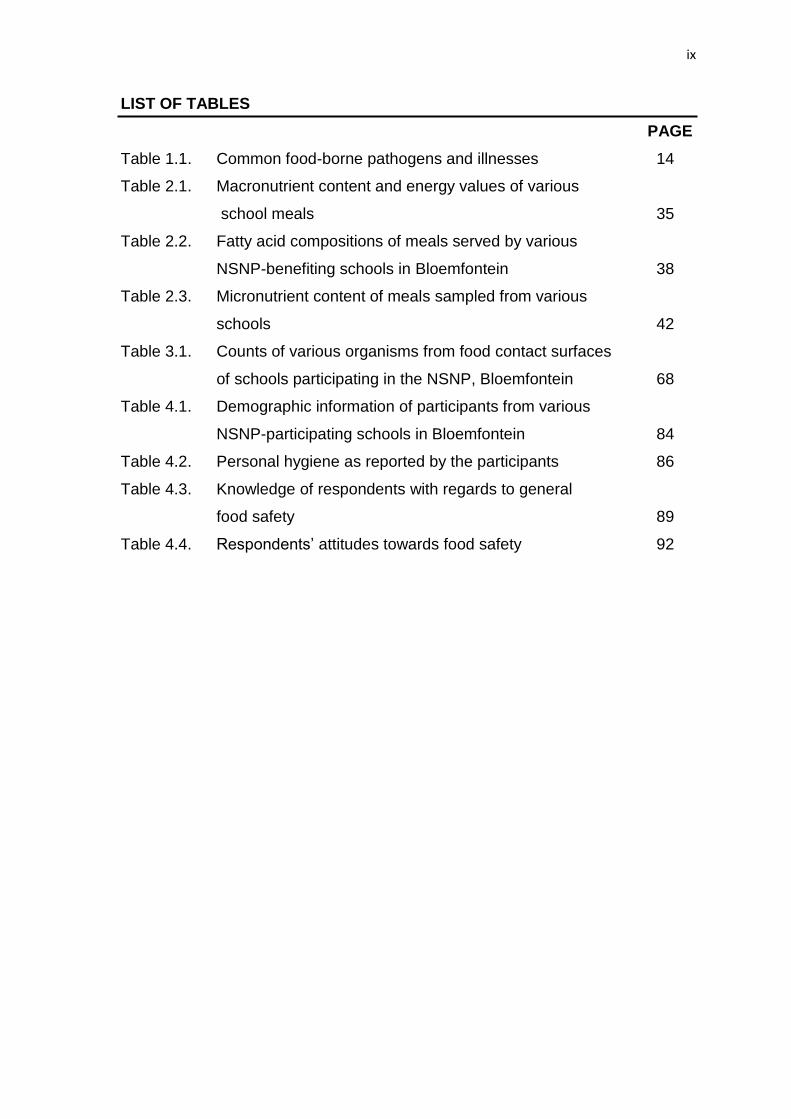
LIST OF TABLES
PAGE
Table 1.1. Common food-borne pathogens and illnesses 14
Table 2.1. Macronutrient content and energy values of various
school meals 35
Table 2.2. Fatty acid compositions of meals served by various
NSNP-benefiting schools in Bloemfontein 38
Table 2.3. Micronutrient content of meals sampled from various
schools 42
Table 3.1. Counts of various organisms from food contact surfaces
of schools participating in the NSNP, Bloemfontein 68
Table 4.1. Demographic information of participants from various
NSNP-participating schools in Bloemfontein 84
Table 4.2. Personal hygiene as reported by the participants 86
Table 4.3. Knowledge of respondents with regards to general
food safety 89
Table 4.4. Respondents’ attitudes towards food safety 92
x
LIST OF FIGURES
PAGE
Figure 1.1. Cycle of infection and malnutrition 9
Figure 1.2. Leading causes of mortality among children aged 5–14
years, South Africa 2000 13
Figure 2.1. Mean macronutrient values of meals sampled at various
NSNP-participating schools 37
Figure 2.2. Mean micronutrient values of meals sampled at various
NSNP-participating schools 43
Figure 2.3. Variation in nutrient contents of similar meals served by
schools D and I 45
Figure 2.4. Relationship between moisture and vitamin C contents of
meals served at various schools 46
xi
LIST OF ACRONYMS
ADHD Attention deficit hyperactivity disorder
BCCDC British Columbia Centre for Disease Control
BHT Butylated hydroxytoluene
BPA Baird parker agar
CCA Chromocult coliform agar
CCPs Critical Control Points
CDC Centers for Disease Control and Prevention
CFU Colony Forming Unit
DBE Department of Basic Education
DoE Department of Education
DoH Department of Health
EFSA European Food Safety Authority
FSA Food Standards Agency
GHPs Good hygiene practices
GMPs Good manufacturing practices
HACCP Hazard Analysis Critical Control Point
HUS Haemolytic uraemic syndrome
HPLC High-Performance Liquid Chromatography
ICP-OES Inductively coupled plasma-optical emission spectrometry
INP Integrated Nutrition Programme
KAP Knowledge, attitudes and practices
MDGs Millennium Development Goals
MEC Member of the Executive Council
NSNP National School Nutrition Programme
PCA Plate count agar
PDA Potato dextrose agar
PMG Parliamentary Monitoring Group
PRPs Pre-requisite programs
PSC Public Service Commission
PSNP Primary School Nutrition Programme

xii
Q Quintile
RI Refractive index
SGB School Governing Body
TNTC Too numerous to count
TVC Total viable count
VFHs Volunteer Food Handlers
WHO World Health Organization

1
CHAPTER 1
INTRODUCTION

2
1.1 INTRODUCTION TO THE SOUTH AFRICAN NATIONAL SCHOOL
NUTRITION PROGRAMME
The right to education is one of the basic human rights reserved in the Bill of Rights
contained in the Constitution of South Africa (Currie and De Waal, 2005). However,
due to poverty in communities across the country, the learning process in schools
tends to be hindered by factors such as malnutrition and hunger (PSC, 2008). In an
effort to avert these factors, the Integrated Nutrition Programme (INP) was
developed from the recommendations of a nutrition committee appointed in 1994 by
the residing Minister of Health to develop a nutrition strategy for South Africa. The
committee recommended an integrated approach to nutrition as a replacement for
the preceding fragmented food-based approach (Kloka, 2003).
The Primary School Nutrition Programme (PSNP), a school feeding scheme which
formed part of the Department of Health’s INP, was introduced nationwide in South
Africa in September 1994. This followed former President Nelson Mandela’s
announcement in his State of the Nation Address on the 24th of May 1994 that such
a nutritional feeding scheme would be implemented in every primary school where a
need was identified (Kloka, 2003; Noe, 2005; Ntuli, 2009). The PSNP was primarily
designed to improve active learning capacity by providing direct services to primary
school learners to alleviate the effects of malnutrition and was aimed to improve
educational outcomes by alleviating short-term hunger and improving school
attendance and participation (Meaker, 2008; Ntuli, 2009). Since the programme was
conceptualised to focus primarily on educational outcomes rather than on health
issues and since the then Department of Education (DoE) had been tasked with the
mandate of working directly with schools, responsibility for the programme was
transferred from the Department of Health (DoH) to the former DoE in 2004 to
improve its efficiency in schools (PSC, 2008).
Since its initiation, the PSNP catered for the most needy primary school learners,
i.e., learners from communities with low socio-economic status. However, following
the 2006 survey by the Fiscal and Finance Commission, it was confirmed that there

3
was a need to expand the programme to secondary schools (DBE, 2009). Upon its
extension to secondary schools, the PSNP was renamed the National School
Nutrition Programme (NSNP). Ntuli (2009) quotes the former KwaZulu-Natal
Member of the Executive Council (MEC) for education, Ms Ina Cronjé, as follows:
"Our idea as the department is to provide meals for all the poor schools regardless
whether it is a primary or secondary school. We want all the hungry learners to be
fed in our schools". In April 2009, the NSNP was successfully extended for the first
time to secondary schools (DBE, 2010a) and is currently administered by the
Department of Basic Education (DBE).
The DBE (2009) classifies the NSNP as one of the essential components of the
government’s Programme of Action, which was specifically assigned the
responsibility of addressing children’s ability to learn by providing them with
nutritious meals. The success thereof may contribute towards the country’s
realisation of the Millennium Development Goals (MDGs) which include reduction of
child mortality, achieving universal primary education and eradication of extreme
poverty and hunger by 2015 (PSC, 2008; Kimani-Murage et al., 2011). The following
are the objectives of the NSNP: to alleviate poverty and improve learning capacity of
children through school feeding; to generate and promote sustainable food
production and economic activities in school communities; to strengthen nutrition
education in schools; to increase attendance of learners and to obliterate school
dropout; to increase the pass rate; to reduce the unemployment rate, particularly
among women; to reduce the incidents of child mortality, mobility and the morbidity
rate; to empower poverty-stricken communities, particularly in the rural areas across
all nine provinces in South Africa; and to increase the transfer of skills and self-
reliance (PMG, 2007; Seoketsa, 2007; PSC, 2008). It is essential that this
programme is managed in such a manner that its aims and objectives are met in
order to abundantly benefit the learners served (Seoketsa, 2007).
The NSNP is funded through a provisional grant that is transferred to provinces
according to the Division of Revenue Act and directives from the DBE and National

4
Treasury (Grant Framework 2010/11) (DBE, 2010a; DBE, 2011). The DBE
coordinates and oversees the programme, ensuring adherence to policies and
relevant legislation through monitoring. The Provincial Education Departments are
tasked with the procurement of goods and services for the NSNP while adhering to
conditions stipulated by the Grant Framework (DBE, 2010a; DBE, 2011). Ntuli
(2009) explains that schools are funded according to a national system of ranking
and funding of schools referred to as a quintile (Q). The DBE ranks schools within
quintiles according to this system, taking into account the socio-economic
circumstances, such as inequality and poverty, of learners and schools. For
example, schools rated at the lowest quintiles (1 and 2) receive more funding based
on the Norms and Standards for Funding Schools (Ntuli, 2009). The schools
targeted are primary and secondary schools ranked in Q1 to Q3 (DBE, 2010a; DoE,
2009).
The provincial/district office and/or schools are allocated funds for the procurement
of equipment, utensils and foodstuffs (DoE, 2009). Food items are delivered to
schools by private contractors and further prepared on the school premises (Noe,
2005). At each participating school, the school principal is responsible for the overall
management and success of the programme. Operational responsibility for the
NSNP is assumed by an educator/administrator nominated by the school principal
as a NSNP school coordinator. The school coordinator supervises the daily activities
of the programme such as receiving and recording stock, maintaining and updating
records of all invoices, meals served and number of learners fed per day. Each
school has a nutrition committee comprising the NSNP school coordinator, school
management team, a school governing body (SGB) member, a food handler, and/or
a food gardener (DoE, 2009). The SGB provides support in addressing any
additional requirements of the programme and ensuring that the programme is
implemented effectively. He/she is also responsible for identifying unemployed
community members to be recruited as volunteer food handlers (VFHs) who will be
responsible for the preparation and serving of meals and for the maintenance of the
preparation area (PSC, 2008; DoE, 2009). The VFHs are required to handle

5
foodstuffs in a manner that preserves the safety and nutritional quality of foods
(DBE, 2009). The NSNP is further facilitated by other government departments such
as the Departments of Health and Agriculture, and a number of private companies
nationwide, such as Massmart Holdings Limited (DBE, 2011).
DBE (2010a) indicates some achievements of the programme during the financial
year 2009/10 as: supplying meals to approximately 7 million learners in over 20
thousand schools nationally; successful extension of the programme to Q1
secondary schools; improvement in the quality of meals (provincial menus included
vegetables and fruits); providing learners with cooked meals five days a week; and
the transfer of approximately R83 147 million to provincial departments to procure
equipment in preparation to extend the programme to Q2 secondary schools in April
2010 (DBE, 2010a). Furthermore, the number of VFHs increased when compared to
the previous financial year. Plans for the 2010/11 financial year included
strengthening monitoring, research, programme advocacy and partnerships to
ensure quality meals, and to prepare for the expansion of the programme to Q3
secondary schools in 2011 (DBE, 2010a).
The first issue of the NSNP Newsletter “Inside NSNP” reported that the programme
provided daily nutritious meals to a significant number of school learners nationally.
The DBE continues to encourage schools to promote healthy eating and food safety
through training workshops. This is achieved through activities such as the NSNP
Best School Awards, where the winning school and nominated schools receive
prizes, and the NSNP Newsletter (DBE, 2010b).
1.2 NUTRITIONAL PROPERTIES OF THE NATIONAL SCHOOL NUTRITION
PROGRAMME
According to Whitney and Rolfes (2008) and Insel et al. (2013), approximately 14%
of the world’s population experiences persistent hunger and 60% of deaths of
children globally may be attributed to poor nutrition. Furthermore, the prevalence is
greater and the consequences more severe in developing countries with the primary

6
cause being poverty. An estimated 1.3 billion people live in poverty in developing
countries and of these approximately 798 million suffer from chronic hunger
(Nnakwe, 2013).
Sound nutrition is a basic human right stipulated in South Africa’s Constitution,
through the Bill of Rights, and comprises more than simply the availability of food or
the consumption of a certain amount of nutrients per day. According to Kloka (2003),
nutrition security incorporates food security, health security and care security, where
security refers to sustainability with food and good nutrition being provided on a
continual basis. Furthermore, nutrition security entails physical and economic
access to a balanced diet and safe drinking water to all people at all times (Panda,
2010). Nutrition security is particularly vital throughout the school attending period
for providing children with opportunities to express their full innate potential in
physical and mental development (Panda, 2010). Therefore, the DBE has an
obligation to ensure that nutrition security is respected, protected, facilitated and
provided to those it serves through the NSNP.
Twenty-four workshops on menu planning, meal preparation, food safety and
hygiene were conducted by the DBE during the 2009/10 financial year to aid in
improvement of meal quality (DBE, 2010a). The workshops were compulsory and
were targeting provincial coordinators, VFHs and NSNP supervisors in six provinces
namely Free State, KwaZulu-Natal, Limpopo, Mpumalanga, Northern Cape and
North-West. Menus for the meals provided to learners follow the Food Based Dietary
Guidelines, which provide for a variety of food items inclusive of vegetables and
fruits (DBE, 2010a).
1.2.1. Malnutrition
Nutrition is defined as all the processes during which the body ingests, digests,
absorbs, transports, utilizes and excretes food components (Marotz et al., 1997).
According to Blake et al. (2010) and Insel et al. (2013), nutrients are constituents of
food that maintain these body processes which include providing building blocks to
7
replace body cells as they perish. Nutrients also provide the body with energy to
perform all body functions and processes which may involve any activities from
maintaining a heartbeat to participating in classroom activities (Blake et al., 2010).
Since the majority of foodstuffs contain numerous nutrients, nutrient deficiencies are
usually multiple; therefore a poor diet may affect the intake level of various nutrients
(Brown, 2002). Nutrients are regarded as essential since the human body is unable
to produce them or produce them in sufficient quantities to maintain body functions.
They should therefore be obtained from the food ingested (Blake et al., 2010).
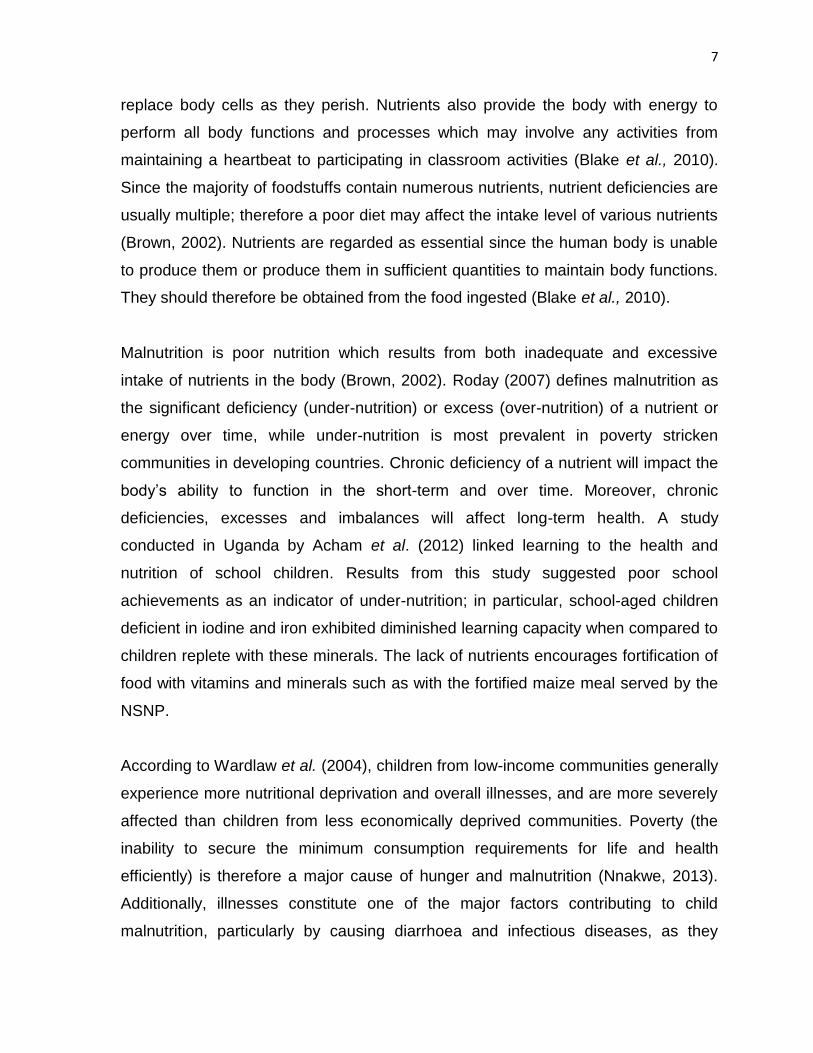
Malnutrition is poor nutrition which results from both inadequate and excessive
intake of nutrients in the body (Brown, 2002). Roday (2007) defines malnutrition as
the significant deficiency (under-nutrition) or excess (over-nutrition) of a nutrient or
energy over time, while under-nutrition is most prevalent in poverty stricken
communities in developing countries. Chronic deficiency of a nutrient will impact the
body’s ability to function in the short-term and over time. Moreover, chronic
deficiencies, excesses and imbalances will affect long-term health. A study
conducted in Uganda by Acham et al. (2012) linked learning to the health and
nutrition of school children. Results from this study suggested poor school
achievements as an indicator of under-nutrition; in particular, school-aged children
deficient in iodine and iron exhibited diminished learning capacity when compared to
children replete with these minerals. The lack of nutrients encourages fortification of
food with vitamins and minerals such as with the fortified maize meal served by the
NSNP.
According to Wardlaw et al. (2004), children from low-income communities generally
experience more nutritional deprivation and overall illnesses, and are more severely
affected than children from less economically deprived communities. Poverty (the
inability to secure the minimum consumption requirements for life and health
efficiently) is therefore a major cause of hunger and malnutrition (Nnakwe, 2013).
Additionally, illnesses constitute one of the major factors contributing to child
malnutrition, particularly by causing diarrhoea and infectious diseases, as they

8
interfere with the body’s ability to utilize the nutrients consumed (Panda, 2010).
Conversely, malnutrition makes a child more susceptible to infectious diseases, and
the combination of malnutrition and infection is a major contributing factor to child
morbidity and mortality in developing countries (Wardlaw et al., 2004; Blake et al.,
2010). Figure 1.1 indicates the cyclical relationship between malnutrition and
infection. With a deficiency of energy, the person may develop the symptoms of
under-nutrition with an evident loss of body mass and becoming prone to infection
and disease. With the deficiency of a nutrient, the person may experience skin rash,
depression, hair loss, bleeding gums, muscle spasms, night blindness and/or other
symptoms. Symptoms such as diarrhoea, skin rash and fatigue are easily
overlooked as indicators of malnutrition because they resemble the symptoms of
other diseases (Whitney and Rolfes, 2008). Nutrition, in general, plays an important
role in preventing disease and promoting health.
Micronutrient deficiencies are prevalent in South Africa and are affecting especially
vulnerable groups such as children and elderly people who are at a higher risk of
becoming inadequately nourished (Brown, 2002; Kloka, 2003). There is no single
food source which contains all the required nutrients. Adequate diets are achievable
by including foods that are quality sources of numerous nutrients and should include
fruits, vegetables, grains and dairy and meat products (Brown, 2002). In addition to
poor nutritional status, knowledge of nutrition among South African communities is
unsatisfactory and, even among those with relatively accurate knowledge, it is often
not applied (Walsh, 1995). The NSNP is therefore a key strategic programme in
decreasing the effects of malnutrition among school attending children in South
Africa (DBE, 2010a).

9
Figure 1.1. Cycle of infection and malnutrition (adapted from Macallan, 2009)
Malnutrition Infection
Increased metabolic
rate
Anorexia
Negative energy balance
Wasting
Acute phase response
Protein catabolism
Increased risk
Compromised barrier
defenses
Impaired humoral immunity
Increased severity
Impaired cellular immunity

10
1.2.2. Nutrition during childhood and adolescence
Childhood and adolescence are periods in which the human body develops from
infancy to adulthood. During these periods, the body changes significantly in terms
of physical, hormonal, reproductive and emotional status (Eastwood, 1999). Due to
the rapid growth and development of children, nutritional wellbeing is critical during
childhood and adolescence. Furthermore, the nutritional state of an individual is
dependent on total food intake, rate of growth and physical activity (Francis, 1986;
Whitney and Rolfes, 2008). Carbohydrate intake, as a measure of percentage, for
children beyond one year of age, should remain the same through the ages into
adulthood (Whitney and Rolfes, 2008; Blake et al., 2010; and Insel et al., 2013).
Fibre recommendations for younger children with low energy intakes are less than
those for older ones with high energy intakes. In addition, the protein requirement
declines slightly with age when the child’s body weight is considered; however, total
protein needs increase slightly with age, while the vitamin and mineral requirements
of children increase with age. Energy and nutrient needs are greater during
adolescence than at any other stage of life, except during pregnancy and lactation.
Characteristically, nutrient needs rise throughout childhood, peak in adolescence
and then level off or diminish as the adolescents become adults (Whitney and
Rolfes, 2008; Insel et al., 2013). It is noteworthy that all people throughout life need
the same nutrients in varying quantities (Marotz et al., 1997). Feeding and nutrition
education programmes in schools, when adequately implemented, provide not only
essential nutrients for the children, but they also provide the opportunity for children
to learn to make responsible choices regarding dietary intake (Lucas, 1993).
When children do not receive regular meals, their behaviour and academic
performance are affected (Simeon, 1998). Non-specific symptoms of malnutrition
are frequently seen in children with nutritional imbalances. In the majority of the
cases these are of a psychological nature and include: impulsive and difficult
behaviour; perceptual and auditory disability; acting without considering the
consequences of their actions; seldom finishing tasks that they have started;
imperviousness to the feeling of others; stubbornness; displaying a negative attitude;

11
and bullying may be part of the syndrome (Serfontein, 2001). Under-nutrition during
childhood may further weaken resistance to infection because immune function
decreases when nutrients such as protein, vitamin A and zinc are inadequate in the
diet (Figure 1.1) (Wardlaw et al., 2004). Essential vitamins and minerals for young
children (ages 2 to 8) include iron, zinc, vitamin E, and vitamin D and for
adolescents (ages 9 to 19), micronutrient requirements include iron, calcium and
vitamin A (Insel et al., 2013). Nutrients most likely to be low or deficient in growing
children are calcium, iron and vitamins A and C (Lucas, 1993). Deficiencies in
vitamin A, zinc, iron and protein may result in illness, stunted growth, partial
development and possibly permanent blindness. Whitney and Rolfes (2008)
recommend that children’s meals should include a variety of foods from each food
group to provide all the required nutrients. Healthy, well-nourished children are
usually alert in the classroom and energetic while performing physical activities.
1.3. FOOD SAFETY ASPECTS ASSOCIATED WITH THE NATIONAL SCHOOL
NUTRITION PROGRAMME
Food-borne illness resulting from consumption of foods or beverages contaminated
with pathogenic bacteria has been an important public health concern for several
years (Caillet et al., 2009). In earlier years, investment in food safety interventions
was not considered a priority in developing countries where the main concern was
the sufficient supply of food (Käferstein, 2003). This tendency has altered over the
years with the increase in food related diseases. Estimations indicate that each year
approximately a million people suffer from a food-borne illness, about 20 000 people
receive hospital treatment and that there are around 500 deaths caused by food-
borne illness in the United Kingdom alone (FSA, 2011). Estimates in the United
States indicate that roughly 48 million people become ill each year, 128 000 are
hospitalized, and 3 000 die due to food-borne diseases (CDC, 2013). In addition,
estimations by the World Health Organization (WHO) reveal that 70% of the
diarrheal diseases in African children are due to consumption of contaminated
complementary food, leading to an estimated 30 660 deaths of children per year in
Africa (CDC, 2013). In South Africa records of food-borne illnesses are not efficiently
12
documented and although food-borne disease outbreaks are common in the
country, literature reporting this is insufficient (Benade, 1996; Karas et al., 2001;
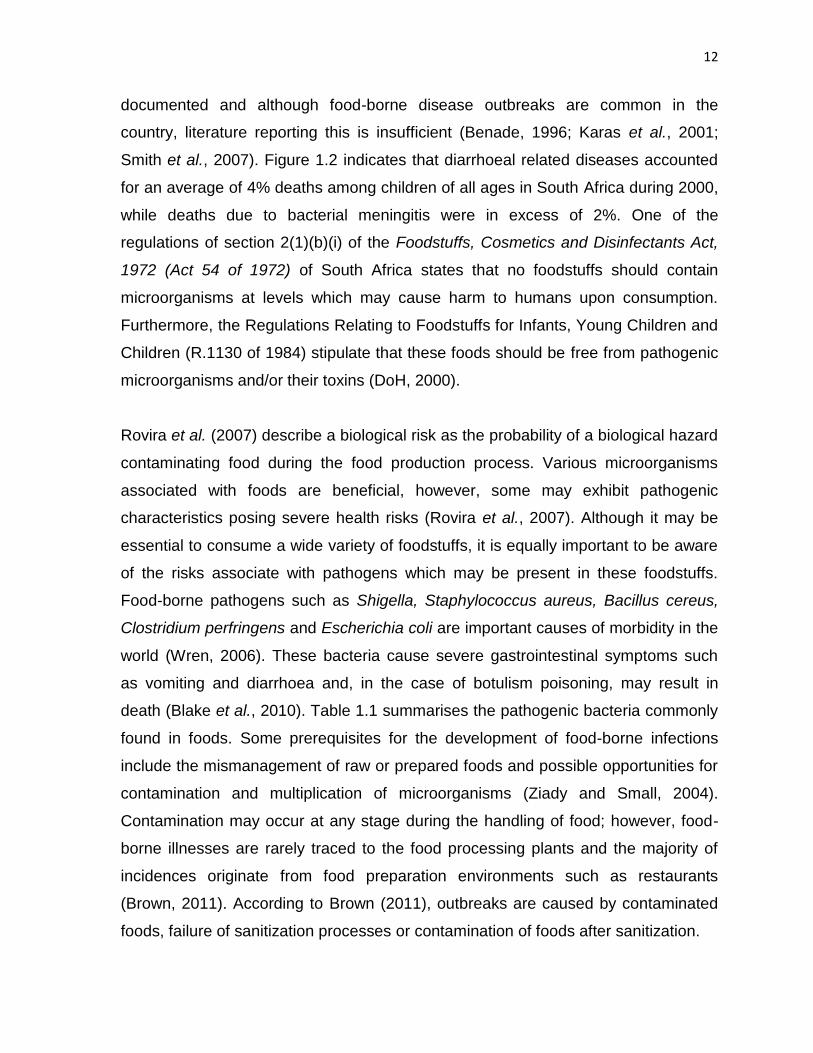
Smith et al., 2007). Figure 1.2 indicates that diarrhoeal related diseases accounted
for an average of 4% deaths among children of all ages in South Africa during 2000,
while deaths due to bacterial meningitis were in excess of 2%. One of the
regulations of section 2(1)(b)(i) of the Foodstuffs, Cosmetics and Disinfectants Act,
1972 (Act 54 of 1972) of South Africa states that no foodstuffs should contain
microorganisms at levels which may cause harm to humans upon consumption.
Furthermore, the Regulations Relating to Foodstuffs for Infants, Young Children and
Children (R.1130 of 1984) stipulate that these foods should be free from pathogenic
microorganisms and/or their toxins (DoH, 2000).
Rovira et al. (2007) describe a biological risk as the probability of a biological hazard
contaminating food during the food production process. Various microorganisms
associated with foods are beneficial, however, some may exhibit pathogenic
characteristics posing severe health risks (Rovira et al., 2007). Although it may be
essential to consume a wide variety of foodstuffs, it is equally important to be aware
of the risks associate with pathogens which may be present in these foodstuffs.
Food-borne pathogens such as Shigella, Staphylococcus aureus, Bacillus cereus,
Clostridium perfringens and Escherichia coli are important causes of morbidity in the
world (Wren, 2006). These bacteria cause severe gastrointestinal symptoms such
as vomiting and diarrhoea and, in the case of botulism poisoning, may result in
death (Blake et al., 2010). Table 1.1 summarises the pathogenic bacteria commonly
found in foods. Some prerequisites for the development of food-borne infections
include the mismanagement of raw or prepared foods and possible opportunities for
contamination and multiplication of microorganisms (Ziady and Small, 2004).
Contamination may occur at any stage during the handling of food; however, food-
borne illnesses are rarely traced to the food processing plants and the majority of
incidences originate from food preparation environments such as restaurants
(Brown, 2011). According to Brown (2011), outbreaks are caused by contaminated
foods, failure of sanitization processes or contamination of foods after sanitization.

13
Boys 5–9 years (N=2391) Girls 5–9 years (N=1534)
Boys 10–14 years (N=2513) Girls 10–14 years (N=1335)
Figure 1.2. Leading causes of mortality among children aged 5–14 years, South Africa 2000 (adapted from Bradshaw et
al., 2003)
1.7%
1.7%
2.5%
2.5%
2.9%
3.1%
4.1%
4.4%
4.9%
21.5%
28.8%
0.0% 5.0% 10.0% 15.0% 20.0% 25.0% 30.0% 35.0%
Tuberculosis
Epilepsy
Other nervous system disorders
Bacterial meningitis
Homicide/violence
Lower respiratory infections
Diarrhoeal diseases
Fires
Drowning
HIV/AIDS
Road traffic accidents
1.6%
1.7%
1.7%
2.2%
2.9%
3.1%
3.3%
3.5%
3.5%
21.9%
33.0%
0.0% 5.0% 10.0% 15.0% 20.0% 25.0% 30.0% 35.0%
Drowning
Protein-energy malnutrition
Other nervous system disorders
Tuberculosis
Bacterial meningitis
Lower respiratory infections
Fires
Diarrhoeal diseases
Homicide/violence
Road traffic accidents
HIV/AIDS
2.8%
2.9%
3.1%
3.4%
4.0%
4.1%
4.3%
4.6%
7.9%
9.0%
18.3%
0.0% 5.0% 10.0% 15.0% 20.0%
Septicaemia
Tuberculosis
Epilepsy
Other nervous system disorders
Suicide
Diarrhoeal diseases
Bacterial meningitis
Lower respiratory infections
Drowning
Homicide/violence
Road traffic accidents
3.2%
3.2%
3.3%
3.4%
3.5%
3.9%
4.5%
4.6%
7.2%
7.3%
14.9%
0.0% 5.0% 10.0% 15.0% 20.0%
Other nervous system disorders
Rheumatic heart disease
Drowning
Epilepsy
Suicide
Bacterial meningitis
Tuberculosis
Diarrhoeal diseases
Lower respiratory infections
Homicide/violence
Road traffic accidents

14
Table 1.1. Common food-borne pathogens and illnesses (adapted from Insel et al., 2013)
Bacteria Sources Diseases and symptoms
Campylobacter jejuni Raw poultry, meat and unpasteurised milk
Campylobacteriosis Onset: usually 2 to 5 days after eating Symptoms: diarrhoea, stomach cramps, fever, bloody stools - lasts 7 to 10 days
Clostridium botulinum (illness is caused by a toxin produced by this organism)
Improper canned foods such as corn, green beans, soups, beets, asparagus, mushrooms, tuna, and liver pate; also, luncheon meats, ham, sausage, garlic in oil, lobster, and smoked and salted fish
Botulism Onset: 18 to 36 hours after eating Symptoms: nerve dysfunction such as double vision, inability to swallow, speech difficulty, and progressive paralysis of respiration system. Can lead to death.
Escherichia coli O157:H7
Raw or undercooked meat, raw vegetables, unpasteurised milk, minimally processed ciders and juices, contaminated water
E. coli infection Onset: 2 to 5 days after eating Symptoms: watery and bloody diarrhoea, severe stomach cramps, dehydration, colitis, neurological symptoms, stroke, and haemolytic uremic syndrome (HUS), a particularly serious disease in young children that can cause kidney failure and death.
Listeria monocytogenes Soft cheeses, unpasteurised milk, hot dogs, luncheon meat, cold cuts, other deli-style meat and poultry Note: resist salt, heat, nitrites, and acidity better than most microorganisms
Listeriosis Onset: 7 to 21 days after eating, but symptoms have been reported 9 to 48 hours after eating Symptoms: fever, headache, nausea, and vomiting; primarily affects pregnant women and their foetuses, newborns, older adults, and people with cancer and compromised immune systems. Can cause death in foetuses and babes.

15
Table 1.1. Common food-borne pathogens and illnesses (continued)
Bacteria Sources Diseases and symptoms
Salmonella Raw or undercooked meats, poultry, eggs, raw milk and other dairy products; seafood; fresh produce, including raw sprouts; coconut; pasta; chocolate; foods containing raw eggs
Salmonellosis Onset: 1 to 3 days after eating Symptoms: nausea, abdominal cramps, diarrhoea, fever, and headache
Shigella Undercooked liquids or moist food that has been handled by an infected person
Shigellosis (bacillary dysentery) Onset: 12 to 50 hours after eating Symptoms: stomach cramps; diarrhoea; fever; sometimes vomiting; and blood, pus, and mucus in stools
Staphylococcus aureus (illness is caused by a toxin produced by this organism)
Meat and poultry; egg products; tuna, potato, and macaroni salads; cream-filled pastries and other foods left unrefrigerated for long periods Note: S. aureus is frequently found in cuts on skin and nasal passages
Staphylococcal food poisoning Onset: 1 to 6 hours after eating Symptoms: diarrhoea, vomiting, nausea, stomach pain and cramps - lasts 1 to 2 days.
Vibrio vulnificus Raw seafood, especially raw oysters Vibrio infection Onset: 1 to 7 days after eating Symptoms: chills, fever, nausea and vomiting, and possibly death, especially in people with underlying heath problems
16
Additionally, the main factors associated with food-borne illness are poor personal
hygiene, cross-contamination and incorrect time/temperature control. The general
principle steering food safety is to provide food that will not cause harm when
consumed. To prevent food-borne illness, food service personnel, food flow (such as
purchasing, storage, preparation, cooking, holding, cooling, reheating and
sanitation) and food safety programmes should be implemented and closely
monitored (Brown, 2011). Furthermore, food safety is achievable by the application
of a number of systems which include good manufacturing practices (GMPs), good
hygiene practices (GHPs) and hazard analysis critical control point (HACCP)
systems as well as pre-requisite programs (PRPs) which provide guidelines to
minimize the risk of contamination (Blackburn, 2003; Brown, 2011).
1.4. RATIONALE
1.4.1. Problem delineation
Food poisoning contributes significantly to mortality and despite advances in
hygiene, consumer knowledge, food treatment and food processing, food-borne
pathogens represent a significant threat to human health worldwide (Wren, 2006).
The South African food legislation further requires that surfaces and foodstuffs made
available to the general public should be hygienic and free of harmful substances
and organisms (R.1183 of 1990; R.918 of 1999). Although annual reports of the
DBE indicate the success of the NSNP (DBE, 2009; DBE, 2010a; DBE, 2011),
studies conducted in various areas in the country focusing on the efficacy of the
programme revealed deficiencies. A study by Napier et al. (2009) indicated that
malnutrition remains a persistent problem amongst school children even with the
implementation of programmes such as the NSNP. Results of studies by Noe (2005)
and Manyatsa (2007) indicated a lack of resources to support the daily operations of
the programme in schools. Children catered for by feeding programmes are from
poverty stricken communities and possibly attend schools without receiving decent
meals and for majority of these children, the meals provided through the NSNP are
their main, and in some cases their sole, sources of energy and nutrients. If these

17
meals are nutrient deficient, the nutritional wellbeing of the recipients may be
compromised and further promotes malnutrition. Feeding children at schools
motivates them to attend classes and children learn more efficiently when they are
fed. An improvement in school attendance was observed as a result of the
intervention of a school feeding programme in Kenya (Vermeersch and Kremer,
2004). With education, these children may be able to discontinue the cycle of
poverty in society.
As indicated in the first newsletter of the year 2010, the NSNP considers nutrition,
food safety and food being served in a dignified manner a priority (DBE, 2010b).
Previous studies conducted with regards to the programme were conducted before
2009 while it was still the PSNP (Noe, 2005; Manyatsa, 2007; Napier et al., 2009).
These studies therefore focused mainly on fortified biscuits, which was the main
food item served by the programme during their studies. Since then two major
changes have been implemented with regards to the programme: 1) it has currently
expanded to secondary schools; and 2) a more diverse menu has been introduced.
The wider food range on the menu offers the programme a nutritional advantage;
however it further allows for a wider opportunity for microbial contamination.
Additionally, with cases of food-borne illnesses on the increase, food safety should
not be overlooked. Food safety is essential with regards to the NSNP because it
caters for young, school-aged children. Young children are at greater risk of
contracting food poisoning since their digestive and immune systems are not as fully
developed as in adults. Food poisoning outbreaks are even more prevalent in
settings, such as that of the NSNP, where food is served in large quantities, by a
variety of people and to numerous individuals.
18
1.4.2. Aim and objectives
The overall aim of this study was to contribute towards the safety and
wholesomeness of food served through the NSNP.
The objectives of this study are listed as follows:
To evaluate the nutritional content of foodstuffs served through the NSNP;
To determine the microorganism prevalence on various surfaces that may
come into contact with food products as an indicator of general hygiene
during the administering of the programme;
To determine the knowledge, attitudes and practices (KAP) of the food
handlers and NSNP representatives with regards to food safety; and
To conclude on the inter-relationships and contribution of the empirical data
to the overall problem and the identification of possible solutions.
It is envisaged that the findings and recommendations as reported in this
dissertation will contribute to the body of knowledge of school feeding schemes. In
addition, the findings and recommendations will be offered in an attempt to improve
the effectiveness of the NSNP for its beneficiaries by making suggestions towards
preserving the nutritional content of meals served and reducing the health risks
associated with foodstuffs.

19
REFERENCES
Acham, H., Kikafunda, J.K., Malde, M.K., Oldewage-Theron, W.H. and Egal, A.A.
(2012). Breakfast, midday meals and academic achievement in rural primary
schools in Uganda: implications for education and school health policy. Food &
Nutrition Research. 56, 1.
Benade, J.G. (1996). A massive outbreak of food poisoning – a reminder of the
importance of proper toxic waste control. South African Medical Journal. 86,
551–552.
Blackburn, C. de W. (2003). Microbiological analysis and food safety management:
GMP and HACCP systems. In Detecting pathogens in food. T.A. McMeekin
(Ed). Cambridge: Woodhead Publishing Limited, pp. 3–17.
Blake, J.S., Munoz, K.D. and Volpe, S. (2010). Nutrition: from science to you. San
Francisco: Pearson Benjamin Cummings.
Bradshaw, D., Bourne, D. and Nannan, N. (2003). What are the leading causes of
death among South African children?. Cape Town: Burden of Disease
Research Unit, Medical Research Council.
Brown, A. (2011). Understanding food: principles and preparation. 4th edition.
Belmont: Wadsworth Publishing.
Brown, J.E. (2002). Nutrition now. 3rd edition. Belmont: Wadsworth Group.
Caillet, S., Ursachi, L., Shareck, F. and Lacroix, M. (2009). Effect of gamma
radiation and oregano essential oil on murein and ATP concentration of
Staphylococcus aureus. Journal of Food Science. 74, M499–M508.
Centers for Disease Control and Prevention (CDC). (2013). Estimates of
foodborne illness in the United States. Available from:
http://www.cdc.gov/foodborneburden/index.html. Date of access: 2013/02/04.
Currie, I. and De Waal, J. (2005). The Bill of Rights handbook. 5th edition.
Claremont: Juta & Company Ltd.
Department of Basic Education (DBE). (2009). National School Nutrition
Programme: 2008 Annual Report. Pretoria: Government Printers.
Department of Basic Education (DBE). (2010a). National School Nutrition
Programme: Annual Report 2009/10. Pretoria: Government Printers.

20
Department of Basic Education (DBE). (2010b). Inside NSNP, Issue1, December
2010. Pretoria: Government Printers.
Department of Basic Education (DBE). (2011). National School Nutrition
Programme: Annual Report 2010/11. Pretoria: Government Printers.
Department of Education (DoE). (2009). National School Nutrition Programme: a
guide for secondary schools. Pretoria: Department of Education.
Department of Health (DoH). (2000). Guidelines for environmental health officers
on the interpretation of microbiological analysis data of food. Pretoria:
Directorate of Food Control, Government Printer.
Eastwood, M. (1999). Principles of human nutrition. Maryland: Aspen Publishers,
Inc.
Food Standards Agency (FSA). (2011). Foodborne disease strategy 2010-15: an
FSA programme for the reduction of foodborne disease in the UK. Available
from: http://www.food.gov.uk/multimedia/pdfs/fds2015.pdf. Date of access:
2013/02/04.
Francis, E.M. (1986). Nutrition for children. London: Blackwell Scientific
Publications.
Insel, P., Ross, D., McMahon, K. and Bernstein, M. (2013). Discovering nutrition. 4th
edition. Burlington: Jones & Bartlett Learning.
Käferstein, F. (2003). Foodborne diseases in developing countries: aetiology,
epidemiology and strategies for prevention. International Journal of
Environmental Health Research. 13, S161–S168.
Karas, J.A., Nicol, M.P., Martinson, N. and Heubner, R. (2001). An outbreak of food
poisoning among children attending an international sports event in
Johannesburg. South African Medical Journal. 91, 417–421.
Kimani-Murage, E.W., Norris, S.A., Pettifor, J.M., Tollman, S.M., Klipstein-
Grobusch, K., Gómez-Olivé, X.F., Dunger, D.B. and Kahn, K. (2011).
Nutritional status and HIV in rural South African children. BMC Pediatrics. 11,
23.
Kloka, D. (2003). Integrated Nutrition Programme (INP). Background document for
Cabinet briefing. Pretoria: Department of Health.

21
Lucas, B. (1993). Nutrition and the school-age child. In Nutrition in Infancy and
Childhood. L.P. Pipes and C.M. Trahms (Eds). 5th edition. St. Louis: Mosby
Year Book, Inc., pp142–164.
Macallan, D. (2009). Food security in Sub-Saharan Africa. Medicine. 37, 525–528.
Manyatsa, M.J. (2007). The influence of storage on vitamin degradation in fortified
biscuits. M. Tech. Dissertation. Bloemfontein: Central University of Technology.
Marotz, L.R., Cross, M.Z. and Rush, J.M. (1997). Health, safety, and nutrition for the
young child. 4th edition. Washington: Delmar Publishers.
Meaker, J. (2008). An observational cross-sectional investigation of food service
management and general management practices in schools running the
National School Nutrition Programme (NSNP) in the formal and informal urban
areas of Pietermaritzburg, KwaZulu-Natal, South Africa. M.Sc. Dissertation.
Stellenbosch: Stellenbosch University.
Napier, C., Oldewage-Theron, W. and Kearney, J. (2009). Comparison of three
school feeding strategies for primary school children in an informal settlement
in Gauteng, South Africa. Journal of Interdisciplinary Health Sciences. 14, 96–
103.
Nnakwe, N.E. (2013). Community nutrition: planning health promotion and disease
prevention. 2nd edition. Burlington: Jones & Bartlett Learning.
Noe, M.H. (2005). The influence of aerosolized microorganisms on the safety and
quality of fortified biscuits. M. Tech. Dissertation. Bloemfontein: Central
University of Technology.
Ntuli, S. (2009). South Africa: 400 high schools on the Government’s Nutrition
Programme. Available from: http://allafrica.com/stories/200904061262.html.
Date of access: 2013/01/07.
Panda, S.C. (2010). Sustainable food and nutrition security in national economy. 1st
edition. Jodhpur: Agrobios (India).
Parliamentary Monitoring Group (PMG). (2007). National School Nutrition
Programme, conditional grants, life skills and HIV and AIDS conditional grant
and learner transport. Available from:

22
http://www.pmg.org.za/minutes/20070514-national-school-nutrition-programme-
conditional-grants-life-skills-hiv-aids-conditi. Date of access: 2013/01/07.
Public Service Commission (PSC). (2008). Report on the evaluation of the
National School Nutrition Programme (NSNP). Pretoria: The Public Service
Commission (PSC).
Republic of South Africa. (1990). Regulation No. R.1183 of 1 June 1990:
Regulations relating to perishable foodstuffs, promulgated under the
Foodstuffs, Cosmetics and Disinfectants Act, 1972 (Act No. 54 of 1972).
Pretoria: Government Printer.
Republic of South Africa. (1999). Regulation No. R.918 of 30 July 1999:
Regulations governing general hygiene requirements for food premises and the
transport of food, promulgated under the Health Act, 1977 (Act No. 63 of 1977).
Pretoria: Government Printer.
Roday, S. (2007). Food science and nutrition. New Delhi: Oxford University Press.
Rovira, J., Cencic, A., Santos, E. and Jakobsen, M. (2007). Biological hazards. In
Safety in the agri-food chain. P.A. Luning (Ed). Wageningen: Wageningen
Academic Publishers, pp. 67–136.
Seoketsa, L.M. (2007). Management of school feeding scheme at Manamelong
Primary in North West Province. M. Tech. Dissertation. Pretoria: Tshwane
University of Technology.
Serfontein, W. (2001). New nutrition: transform your life. Cape Town: Tafelberg
Publishers.
Simeon, D.T. (1998). School feeding in Jamaica: a review of its evaluation.
American Journal of Clinical Nutrition. 67, 790S–794S.
Smith, A.M., Gouws, A.M., Hoyland, G., Sooka, A. and Keddy, K.H. (2007). Group
for enteric, respiratory and meningeal disease surveillance in South Africa
(GERMS-SA). Outbreaks of food-borne disease - a common occurrence but
rarely reported. South African Medical Journal. 97, 1272.
Vermeersch, C. and Kremer, M. (2004). School meals, educational achievement,
and school competition: evidence from a randomized evaluation. World Bank
Policy Research working paper No. 3523. Washington, DC: World Bank.

23
Walsh, C.M. (1995). The effect of a nutrition education programme on the
knowledge of nutrition and dietary practices of lower socio-economic Coloured
communities. PhD Thesis. Bloemfontein: University of the Free State.
Wardlaw, G.M., Hampl, J.S. and DiSilvestro, R.A. (2004). Perspectives in nutrition.
6th edition. Boston: McGraw-Hill.
Whitney, E. and Rolfes, S.R. (2008). Understanding nutrition. 12th edition. Belmont:
Cengage Learning.
Wren, B. (2006). How bacterial pathogens evolve. In Emerging food-borne
pathogens. Y. Motarjemi and M. Adams (Eds). England: Woodhead Publishing
Limited, pp. 3–19.
Ziady, L. and Small, N. (2004). Prevent and control infection. Cape Town: Juta &
Company Ltd.

24
CHAPTER 2
ASSESSING THE QUALITY OF FOOD SERVED
UNDER A SCHOOL FEEDING SCHEME:
A NUTRITIONAL ANALYSIS
This chapter has been submitted, partially or in full, for publication in International Journal
of Food Sciences and Nutrition; ISSN 1465-3478.

25
2.1. ABSTRACT
Under-nutrition due to poverty is most prevalent in developing countries. Nutrients in
food are essential to sustain normal body function, growth and development. Sound
nutrition is, therefore, crucial for the wellbeing of children whereas stunted growth
due to nutrient deficiencies hinders the development of children and the effects may
continue into adulthood. Such effects of malnutrition may be prevented and reversed
by implementing supplementary nutritional programmes. Thus school feeding
schemes have been implemented in various schools across the globe to improve the
nutritional wellbeing of learners. The purpose of this study was to identify possible
nutritional benefits/deficiencies of foodstuffs served during the administration of the
South African National School Nutrition Programme in the Bloemfontein area.
Representative meal samples were collected from 10 randomly selected NSNP-
beneficiary schools in the area and the nutrient contents of meals were determined.
Results were measured against the United Kingdom’s nutrient-based standards for
an average school lunch for individuals aged 7–10 and 11–18 years. For both age
groups, the meals did not meet the nutrient standards for carbohydrate and energy
contents while the protein standards were met by 90% of meals for individuals aged
7–10 years and met by 40% of meals for those aged 11–18 years. Ten percent of
the school meals met the standards for calcium (for the age group of 7–10 years;
none for the age group of 11–18 years) and zinc (for both age groups) whereas for
iron content, 80% and 30% met the nutrient standards for those aged 7–10 years
and 11–18 years, respectively. The lipid and vitamin C contents were within
standards for both age groups. The nutritional status of meals may be improved by
including foodstuffs from various food groups. Moreover, the implementation of
proper storage and food preparation procedures may significantly assist in
preserving the quality of nutrients.
Keywords: National School Nutrition Programme, malnutrition, nutrients, chemical
analysis, nutrient-based standards
26
2.2. INTRODUCTION
Food consists of a combination of essential chemicals (nutrients) which are required
for normal bodily function, growth and development (Blake et al., 2010). Additionally,
these essential nutrients maintain cells and tissues while they also regulate the
numerous metabolic processes which take place inside the body throughout each
day (Insel et al., 2013). The deficiency of nutrients results in the deterioration of
health as the human body is unable to produce nutrients or it produces them in
quantities that are insufficient to support health (Byrd-Bredbenner et al., 2013). With
prolonged deficiency, the damage may be permanent. However, should the nutrient
be replaced in the diet, the effects may be reversed and health restored (Byrd-
Bredbenner et al., 2013; Insel et al., 2013). For example, vitamin A supplements
may reverse the effects of deficiency on the eyes; however, should the deficiency be
prolonged, permanent blindness may result (Insel et al., 2013).
Malnutrition is caused by continual consumption of foods that provide inaccurate
levels of nutrients and/or energy to maintain the requirements of the human body
(Nnakwe, 2013). According to Black et al. (2008) and Usfar et al. (2009), about a
third of young children globally are stunted and the causes of their growth failure
may be traced to poverty. Malnutrition and hunger account for nearly half of the
death rate of preschool children worldwide with approximately 26% of
undernourished children residing in Africa (World Hunger Education Service, 2011;
Nnakwe, 2013). Twenty percent of the population in developing countries suffer from
iodine deficiency, while approximately 25% of children are vitamin A deficient
(Nnakwe, 2013). Other nutrients most likely to be deficient in children have been
reported to be iron, zinc, calcium, folic acid and vitamin B6 (Mabaya et al., 2010;
Iversen et al., 2011). Iversen et al. (2011) report that under-nutrition is a health
concern in South Africa and posit that it particularly affects young children residing in
rural areas. Furthermore, during a national food consumption and anthropometric
survey among South African children, the Free State province was revealed to have
high prevalence of nutritional disorders (Labadarios et al., 2005).
27
Nutritional requirements during childhood and adolescence are high because of the
demands for rapid growth (Weichselbaum and Buttriss, 2011). In addition to growth
and development, nutrients also provide young children with fuel to perform physical
and metabolic functions (Insel et al., 2013). Therefore, adequate nutrition is vital
during the school-age years since nutrition and health influence a child’s ability to
learn at school (Kallman, 2005; Nnakwe, 2013). Children who lack certain nutrients
in their diet, iron and iodine in particular, and suffer from protein-energy malnutrition,
persistent hunger, parasitic infections or other food-related diseases are likely to
have a reduced potential for learning compared to healthy, well-nourished children.
This may be attributed to the difficulty experienced by hungry learners to
concentrate and perform complex tasks (Kallman, 2005). Nutrient deficiencies
account for the inability of a child to achieve full mental and physical potential owing
to stunted growth, low physical work capacity, reduced IQ and lower resistance to
infection (Mabaya et al., 2010). A study by Usfar et al. (2009), which was conducted
in rural villages of developing areas, indicated a more rapid growth in children who
received supplementation while children without supplements were stunted and at
risk of chronic infections even during adulthood.
Although supplementation may yield rapid results in preventing and reversing the
effects of malnutrition, food fortification is considered a more cost-effective and
sustainable solution to long-term malnutrition (Mabaya et al., 2010). These fortified
foods may be highly beneficial to numerous children when served at schools. School
feeding schemes provide access to various nutritious foodstuffs that promote
learners’ health and their capacity to perform academic tasks (Bevans et al., 2011).
Furthermore, schools are uniquely positioned to promote healthy eating behaviours
and attitudes among children which may be a foundation for future dietary
preferences and eating behaviour in adult life (Perez-Rodrigo and Aracenta, 2001;
Weichselbaum and Buttriss, 2011). The United Kingdom government established
food-based standards (to increase intake of healthier foods such as fruit, vegetables
and oily fish) and nutrient-based standards (to promote an increased provision of
foodstuffs containing essential nutrients) as guidelines for school lunches. The

28
standards are aimed to address concerns regarding the poor quality of school meals
and to improve the quality and nutritional balance of meals served to school children
(School Food Trust, 2008; Haroun et al., 2011; Department of Education, UK, 2012).
During the present study, the constituents of the six classes of nutrients in food
(moisture, carbohydrates, proteins, lipids, vitamins and minerals) were determined
with the application of chemical analysis of the meals served during the
administration of the National School Nutrition Programme (NSNP) in Bloemfontein,
South Africa. The study aimed to cast light on possible nutritional benefits and
deficiencies of the school meals.
2.3. MATERIALS AND METHODS
2.3.1. Sampling procedure
Representative food samples were collected from 10 randomly selected schools
which were beneficiaries of the NSNP in Bloemfontein, South Africa. The school
sample included primary, intermediate, combined and special schools, categorized
under the three quintiles, namely Q1, Q2 and Q3. This sample also represented an
even distribution of schools in the urban and rural areas of the region. The NSNP
representative or school principal was notified prior to the visit and arrangements
were made to collect food samples which were collected during serving times
(between 10:30 and 12:00) during the summer season. This notification was
necessary because schools were found not to always adhere to the serving time
stipulated by the Department of Basic Education (DBE) as they operate differently in
terms of the duration of classes and general attendance (DBE, 2013). The samples
consisted of representative portions of food that were served to children under
normal serving practises. In an attempt to collect a variety of food and obtain a wider
perspective on the nutritional benefits of the meals, the samples were collected on
specific days with guidance of menus provided by the schools.
Meal samples of between 267 g and 477 g were collected using latex gloves and
placed in sterile polythene bags. Schools were alphabetically labelled to maintain
29
confidentiality. Samples consisted of the following from each of the schools: A:
maize porridge and cabbage with potatoes; B: maize porridge and soup with beans
and cabbage; C: maize rice and soya mince stew with potatoes and carrots; D:
maize rice and beef stew with carrots and potatoes; E: rice and cabbage with
potatoes and carrots; F: maize porridge and cabbage with tinned fish; G: samp (a
South African staple food made from broken, dried corn kernels) and soya mince
stew with potatoes and pumpkin; H: maize porridge and milk; I: maize rice and soya
mince stew with potatoes and carrots; and J: rice and tinned fish (pilchards in tomato
sauce) stew. Onion, cooking oil, salt and spices were included during the
preparation of all meals except for the meal served by school H. The food handlers
followed recommendations of the DBE in preparing the meals with some
modifications according to availability of ingredients (DBE, 2013). All meals had
been prepared on the day they were sampled. The samples were transported to the
laboratory on ice and homogenized upon arrival at the laboratory. Sampling and
analyses were performed in triplicate.
2.3.2. Gravimetric determination of moisture content
Samples were dried in an oven at 105 ± 5°C for 24 hours and the moisture content
was expressed as the percentage of moisture in the fresh sample upon determining
the difference in weights between the fresh sample and dry matter (Moreno-Rojas et
al., 2010).
2.3.3. Analysis of soluble sugars by HPLC
Analysis of soluble sugars using HPLC-RI
The HPLC system consisted of a Shimadzu Prominence high-performance liquid
chromatography apparatus (Shimadzu Corporation, Nakagyo-ku, Kyoto, Japan)
equipped with a pump (LC-20AD), a solvent degasser (DGU-20A3), an autosampler
(SIL-20AC, 230V), a refractive index (RI) detector, a CBM-20A controller and an
integrator running DataApex Clarity Chromatography Software. For separation, a
Phenomenex Luna NH2 250 × 4.60 mm reverse-phase column (5 µm particle size)

30
(Phenomenex, Torrance, California, US) was used with the oven temperature at
40°C. An isocratic elution was employed with 75% acetonitrile (HPLC grade from
Merck, Wadeville, Gauteng, SA) in nanopure water at a flow rate of 1.25 ml.min-1
and the injection volume was 10 µl. A carbohydrate kit (Sigma-Aldrich, Aston Manor,
Gauteng, SA) was used to identify and quantify individual sugars by comparing the
relative retention times of sample peaks with standards using calibration curves.
The calibration was carried out using the external standard method and four sets of
calibration standards at concentrations of 0.4, 0.8, 1.8 and 3.2 g.l-1 were prepared
for each reference sugar. The standard material was weighted, the appropriate
volume of nanopure water was added and the mixture was vortexed for 30 sec. The
resultant solutions were filtered using syringe filters and analyzed by HPLC.
Extraction of soluble sugars
The sugars were extracted from the various food samples using a modified method
as proposed by Barreira et al. (2010). Approximately 10 g of the homogenized
samples were extracted with 40 ml of 80% aqueous ethanol (Merck, SA) at 70°C for
30 minutes. After cooling to room temperature the samples were centrifuged at 3000
rpm for 15 min. The ethanol in the supernatant was evaporated and the extract was
diluted to a final volume of 10 ml in nanopure water, filtered at 0.45 µm and injected
for HPLC analysis.
2.3.4. Total carbohydrate determination
Total carbohydrate content of food samples was calculated using the following
formula as described by Charrondiere et al. (2004): total carbohydrate (g) = 100 g –
(moisture + protein + lipid + ash) grams.
2.3.5. Total lipid determination and fatty acids analysis by GC-FID
With minor adaptation, the method proposed by Gressler et al. (2010) was applied
for the identification and quantification of lipids and fatty acids. Five grams of each
homogenized food sample were weighted to which 250 mg of pyrogalic acid (Sigma-
31
Aldrich, SA) (to minimize fatty acid degradation) and 5 ml ethanol were added. For
acid hydrolysis, 25 ml of 32% HCl (Merck, SA) were added and shaken for 40 min at
70–80°C followed, by vortexing for approximately 10 min. The lipids were extracted
(at room temperature) with ethyl ether (60 ml mixed in vortex for 1 min) and
petroleum ether (60 ml mixed in vortex for 1 min) (both were purchased from Merck,
SA). The samples were centrifuged (4000 rpm × 5 min) and the ether phase was
evaporated to dryness under nitrogen gas. The residue was gravimetrically
determined as total lipid content.
The fatty acids in the extracted lipid were methylated to fatty acid methyl esters
(FAMEs) with boron trifluoride/methanol complex (5 ml of 20% BF3/MeOH reagent)
(Merck, SA) followed by heating in 2.5 ml toluene (Merck, SA) at 100°C for 45 min
under gentle mix. At room temperature, nanopure water (12.5 ml) was added and
the FAMEs were extracted with 5 ml of hexane (Merck, SA). The hexane fraction
was dried in nitrogen gas, suspended in 500 µl hexane and the solution was filtered
prior to analysis. The fatty acids were analysed using Finnigan Focus GC (Thermo
Fisher Scientific, Waltham, Massachusetts, US) with flame ionization detector and a
25 m x 0.32 mm ID SGE capillary column BPX70, 0.25 µm film (SGE, Melbourne,
Victoria, Australia). The temperature conditions were 100°C for 5 min, 100–240°C at
a rate of 3°C.min-1 and at 240°C for 20 min. The samples were injected at 225°C
and detected at 285°C with helium (linear flow of 20 cm.s-1) as the carrier gas and
split ratio of 1:50. A 37-Component FAME mixture (Sigma-Aldrich, SA) was used to
identify the fatty acids.
2.3.6. Protein content determination
The Dumas combustion method was used to determine the nitrogen content of food
samples as described by Jung et al. (2003). The protein content was determined by
means of a nitrogen conversion factor of 6.25.
32
2.3.7. Analysis of Vitamins A and E
HPLC-UV conditions
With minor variations, the HPLC system used was the same as described earlier for
the analysis of soluble sugars. For vitamin separation, a Phenomenex Luna C18 (2)
5 µm 150 × 4.60 mm reverse-phase column (Phenomenex, US) was used and the
analyses were performed under isocratic mode (mobile phase of acetonitrile) at a
flow rate of 2.0 ml.min-1 with the oven temperature at 40°C. The injection volume
was 10 µl and a UV detector was set at 325 nm for vitamin A (retinyl acetate
purchased from Sigma-Aldrich, SA) and 290 nm for vitamin E (δ-tocopherol, α-
tocopherol and α-tocopherol acetate purchased from Sigma-Aldrich, SA) to
monitored column effluents. The retention times, peak areas/heights and the spectra
of the standard compounds were used for vitamin identification. For standard
solutions, a stock solution of each vitamin was prepared by dissolving 3 mg of the
vitamin standard in 100 ml ethanol containing 3 mg of antioxidant butylated
hydroxytoluene (BHT) (Sigma-Aldrich, SA) as a protection reagent.
Saponification and extraction of vitamins
With minor adaptations, the method proposed by Salo-Väänänen et al. (2000) was
applied to identify vitamin A and E contents of the homogenized samples. For
saponification, samples of approximately 2 g were weighed into flasks after which
pyrogallol (Sigma-Aldrich, SA) of 20 ml (15 g.l-1, dissolved in absolute ethanol) and
10 ml KOH saponification solution (which consisted of 100 g of KOH pellets –
purchased from NT Laboratory Suppliers Excom, Johannesburg, SA – dissolved in
100 ml of nanopure water) were added. Taka diastase (0.01 g) (Sigma-Aldrich, SA)
was added to digest starch and prevent formation of lumps. The flasks were heated
at 60°C for 30 min and cooled to room temperature for about 15 min. To avoid
emulsion formation, 10 ml of 10% NaCl (Merck, SA) were added.
After saponification, the vitamins were extracted using three portions of 20 ml n-
hexane-petroleum ether (80:20) (n-hexane was obtained from Merck, SA). With

33
each portion, the flask was vortexed for about 30 sec and centrifuged (4200 rpm × 5
min). The phases were allowed to separate, and the organic layers were washed
with 20 ml of 5% NaCl and evaporated. Five millilitres of ethanol and 5 ml of n-
hexane were added to the flask and the solution was evaporated to dryness with
nitrogen gas. The residue was dissolved in 1 ml of n-hexane (containing 5 mg of
BHT) and filtered (Whatman, 0.45 µm) prior to HPLC analyses. Exposure to high
temperature and bright light were eliminated throughout the process to prevent the
loss of vitamins.
2.3.8. Vitamin C analysis
Total vitamin C content was determined according to AOAC Method 984.26 as
proposed by Moses et al. (2009).
2.3.9. Determination of total ash and mineral content
The total mineral content was determined by a dry ashing method during which the
dried food samples were ashed at 525°C overnight in a muffle furnace (McCleary et
al., 2010). The resultant ash was determined gravimetrically while individual
minerals (calcium, iron and zinc) were identified and quantified using inductively
coupled plasma-optical emission spectrometry (ICP-OES) as per the method
proposed by Zhou et al. (2013).
2.3.10. Energy calculation
Energy was determined using the following formula as described by Charrondiere et
al. (2004): energy (kJ) = (total carbohydrate grams ×17 kJ) + (protein grams ×17 kJ)
+ (lipids grams × 37 kJ).
2.3.11. Analyses of data
As far as was determined during the current study, there are no South African
nutritional standards for school meals, thus the results of this study were analysed
according to the United Kingdom’s nutrient-based standards (NBS) for an average
school lunch as summarized in Appendix 1 (School Food Trust, 2008). It was

34
deemed necessary to compare schools that served the same meal in order to
explore preparation methods as possibly having an impact on nutritional quality of
foodstuffs. The results were expressed as grams per day and milligrams per day for
macro- and micronutrients, respectively, and as kilojoules per day for energy. All
descriptive and inferential statistical analyses were performed using SigmaPlot
10.0.1, Systat software. In the cases of determination of significance, the t-test was
used with a significance level of 0.05 (P). Means of triplicates values ± standard
deviations and percentages were used to present the results.
2.4. RESULTS AND DISCUSSION
According to the menus received from schools and the one which had been
designed by the DBE, balanced and wholesome meals should alternate the
inclusion of a green and yellow vegetable along with the starch and protein portions.
However, the only measurable vegetables served during sampling were cabbage
(served by schools A, B, C, E and F) and pumpkin (served by schools G and J). In
addition, the cabbage was served as a replacement for or in combination with the
protein portion of the meals. To further supplement the nutrient intake, it was
expected that a fruit would be provided to each child per week; however, it was
observed that only one school adhered to this regulation during the course of this
study.
2.4.1. Carbohydrates
The soluble sugars (glucose, fructose and sucrose) were quantified and the mono-
and disaccharide contents are listed in Table 2.1. Soluble sugar contents ranged
between 0.06 ± 0.03 and 1.01 ± 0.40 g.d-1 for glucose, 0.11 ± 0.00 and 1.20 ± 0.72
g.d-1 for fructose and 0.07 ± 0.00 and 1.02 ± 0.26 g.d-1 for sucrose with calibration
curves as indicated in Appendix 2. The low sugar contents were reflected in the
results of a study by Menezes et al. (2004), who found that the contents were below
0.5% of fresh weight for all foods and ranged between 3.07 and 38.42 mg.100g-1 for
glucose, 3.77 and 55.90 mg.100g-1 for fructose and 9.39 and 368.27 mg.100g-1 for

35
Table 2.1. Macronutrient content and energy values of various school meals
School Meal description* Glucose
(g.d-1
)
Fructose
(g.d-1
)
Sucrose
(g.d-1
)
Total carbohydrate
(g.d-1
)
Lipid
(g.d-1
)
Protein
(g.d-1
)
Energy (kJ.d-1
)
A Maize porridge; cabbage with
potatoes
0.61 ± 0.24 0.57 ± 0.14 0.24 ± 0.03 37.75 ± 0.40 9.42 ± 1.88 9.12 ± 1.12 1142.71 ± 43.54
B Maize rice; beef stew with
potatoes and carrots
0.26 ± 0.29 0.23 ± 0.26 0.19 ± 0.06 39.12 ± 3.25 6.42 ± 3.59 30.86 ± 0.62 1488.76 ± 52.66
C Maize porridge; soup with
beans and cabbage
0.54 ± 0.47 1.11 ± 0.20 0.23 ± 0.17 49.93 ± 0.87 5.96 ± 1.71 9.38 ± 0.40 1242.12 ± 62.76
D Maize rice; soya mince stew
with potatoes and carrots
0.36 ± 0.00 0.52 ± 0.29 0.16 ± 0.16 20.29 ± 0.76 4.97 ± 1.00 6.83 ± 0.18 663.86 ± 7.79
E Rice; cabbage with potatoes
and carrots
1.01 ± 0.40 1.20 ± 0.72 0.61 ± 0.40 55.33 ± 0.52 2.99 ± 0.81 10.15 ± 1.00 1240.33 ± 40.41
F Maize porridge; cabbage with
tinned fish (pilchards in
tomato sauce)
0.07 ± 0.05 0.23 ± 0.14 0.07 ± 0.00 35.09 ± 8.67 6.03 ± 1.38 9.12 ± 0.31 974.63 ± 69.78
G Samp; soya mince stew with
potatoes; pumpkin
0.32 ± 0.07 0.11 ± 0.00 0.07 ± 0.07 40.92 ± 5.94 3.01 ± 0.42 9.10 ± 0.22 964.63 ± 115.50
H Maize porridge; milk 0.81 ± 0.26 0.19 ± 0.05 0.43 ± 0.19 59.41 ± 0.10 5.05 ± 2.88 14.32 ± 0.20 1430.16 ± 149.80
I Maize rice; soya mince stew
with potatoes and carrots
0.46 ± 0.07 0.39 ± 0.07 1.02 ± 0.26 25.30 ± 8.91 16.49 ± 12.42 18.67 ± 1.55 1097.47 ± 8.27
J Rice; tinned fish stew;
pumpkin
0.06 ± 0.03 ND 0.03 ± 0.00 41.12 ± 9.22 6.98 ± 0.84 14.23 ± 1.09 1213.61 ± 167.81
Mean of values ± s.d. (standard deviation), (n = 3). ND: non-detected using the current method. *Onion, cooking oil, salt and spices were included during the preparation of all protein portions of meals except for school H.

36
sucrose. These results were attributed to the high starch content of the foodstuffs.
Carbohydrates (in the form of glucose) are the main source of energy in the human
diet and consist of a diverse family of compounds namely mono-, oligo- and
polysaccharides (Molnar-Perl, 2000; Muir et al., 2009; Insel et al., 2013). Further
illustrated in Table 2.1 are the total carbohydrate contents of meals which ranged
between 20.29 ± 0.76 and 59.41 ± 0.10 g.d-1. These data were significantly (P ≤
0.05) below the NBS minima of 70.6 and 86.1 g (Figure 2.1) for pupils aged 7–10
and 11–18 years, respectively. Similar results were observed from a study by
Nicholas et al. (2013) during which the school meals were below the standard (≥
86.1 g) required for carbohydrates and had a content of 73.2 ± 35.6 g. During a
study by Pearce et al. (2012), however, the school lunches yielded a carbohydrate
content which was above the standard at 89.2 ± 38.9 g.
2.4.2. Lipids and fatty acids
The values for the total lipid content ranged between 2.99 ± 0.81 and 16.49 ± 12.42
g.d-1 (Table 2.1) and were within the NBS of below 20.6 and 25.1 g for individuals
aged between 7–10 and 11–18 years respectively (Figure 2.1). A study by Haroun et
al. (2011) indicated that the majority of the school lunches also met the standard for
total fat content. Lipids, particularly fats, are dense sources of energy and facilitate
the absorption of fat-soluble dietary components such as vitamins. Lipids also aid in
regulating blood pressure and nerve transmissions (Gallagher, 2008; EFSA, 2010;
Medeiros and Wildman, 2012; Byrd-Bredbenner et al., 2013). While fat intake should
be kept minimal, intake below 25% of total energy had been associated with low
vitamin levels in young children (EFSA, 2010). Lipid intake further depends on the
composition of fatty acids and the health effects of various lipid components
(saturated, unsaturated and trans-fatty acids) (Gallagher, 2008). Table 2.2 lists the
fatty acids identified in the various samples analysed in this study. It is apparent that
saturated fatty acids were dominant in the majority of the meals. A high content of
saturated fatty acids in school lunches was also observed in the study by Pearce et
al. (2012). Saturated and monounsaturated fatty acids are synthesised by the
human body and are thus not required in the diet, whereas polyunsaturated fatty

37
Figure 2.1. Mean macronutrient values of meals sampled at various NSNP-participating schools (Each data point
represents triplicate values. The standard deviation was used as the error-bar)
0
10
20
30
40
50
60
70
80
90
100
A B C D E F G H I J
To
tal carb
oh
yd
rate
s (
g.d
-1)
Schools
0
5
10
15
20
25
30
35
A B C D E F G H I J
Lip
ids (
g.d
-1)
Schools
NBS (11 - 18 years)
NBS (7 - 10 years)
0
5
10
15
20
25
30
35
A B C D E F G H I J
Pro
tein
(g
.d-1
)
Schools
0
500
1000
1500
2000
2500
3000
A B C D E F G H I J
En
erg
y (
kJ.d
-1)
Schools

38
Table 2.2. Fatty acid compositions of meals served by various NSNP-benefiting schools in Bloemfontein
School A B C D E F G H I J
Fatty acids C4:0 C6:0 C8:0 C10:0 C12:0 C14:0 C16:1 C18:0 C18:1n9c C20:0 C21:0 C20:2 C22:2 C24:0 C20:5n3
C4:0 C8:0 C10:0 C13:0 C15:0 C17:0 C17:1 C18:3n3 C21:0 C20:3n6 C22:1n9 C20:3n3 C23:0 C22:2 C22:6n3
C4:0 C8:0 C10:0 C14:0 C16:1 C18:0 C18:1n9 C18:3n6 C21:0 C20:2 C22:0 C24:0 C20:5n3
C4:0 C16:0 C18:0 C18:1n6cC20:2 C22:2 C24:0
C4:0 C8:0 C10:0 C11:1 C12:0 C13:0 C15:0 C17:0 C21:0 C22:1n9 C20:3n3 C22:2 C20:5n3 C22:6n3
C4:0 C6:0 C10:0 C12:0 C13:0 C14:0 C15:0 C16:0 C16:1 C17:0 C18:0 C18:1n9t C18:2n6tC18:1n6c C20:0 C18:3n6 C20:1 C18:3n3 C20:2 C22:0 C20:3n3 C22:2 C24:0 C20:5n3 C24:1 C22:6n3
C4:0 C10:0 C14:0 C16:0 C18:0 C18:1n9t C18:1n9c C18:1n6c C21:0 C20:2 C24:0 C20:5n3
C4:0 C8:0 C10:0 C12:0 C14:0 C15:0 C16:0 C16:1 C17:0 C18:0 C18:1n9c C18:2n6t C18:1n6c C18:3n6 C20:1 C21:0 C20:2 C20:3n3 C23:0 C24:0
C4:0 C8:0 C16:0 C18:1n9t C18:1n9c C18:2n6t C18:1n6c C18:3n6 C20:2 C22:0 C24:0 C20:5n3
C4:0 C6:0 C10:0 C12:0 C14:0 C15:0 C16:1 C17:1 C18:1n9t C18:1n9c C20:0 C18:3n6 C20:1 C18:3n3 C21:0 C20:2 C20:3n6 C20:3n3 C24:0 C24:1 C22:6n3

39
acids, such as omega-3 and -6, are essential fats which should be obtained from the
diet (EFSA, 2010). School B’s meal contained omega-3 (C18:3n3) fatty acids while
meals from schools C, H and I contained omega-6 (C18:3n6) fatty acids. Meals which
excluded foodstuffs of animal origin (schools D, E and G) were deficient of essential
fats, whereas the meal from school F had the highest fatty acid composition and, along
with that of school J, had both omega-3 and omega-6 essential fatty acids (Table 2.2).
Schools F and J served tinned fish (pilchards) and it is a recognized fact that essential
fats are abundant in fish oil (Chan and Cho, 2009). Prior and Galduróz (2012) elaborate
that these essential fats occupy one-third of the central nervous system while
approximately 20% of the human brain consists of omega-3 fatty acids. This occupation
of essential fatty acids in the brain was found to reduce attention deficit hyperactivity
disorder (ADHD) symptoms in children during a study by Johnson et al. (2009).
2.4.3. Protein
As illustrated in Table 2.1, protein quantities ranged between 6.83 ± 0.18 and 30.86 ±
0.62 g.d-1 and only one meal (school D) did not contain the protein required in a school
lunch (minimum of 7.5 g) for children aged 7–10 years. For pupils aged from 11 to 18
years, only four school meals (B, H, I and J) met the nutrient standard of a minimum of
13.3 g, whereas the remaining six schools were significantly (P ≤ 0.05) below the
standard as indicated in Figure 2.1. School meals analysed during the studies by
Pearce et al. (2012) and Nicholas et al. (2013) for nutritional quality met the standards
for protein requirements. As indicated in Table 2.1 and Figure 2.1, the meal served by
school B had noticeably higher protein content than those sampled from the other
schools. This was due to the meal being the only one that included meat (beef), which is
a primary source of protein. Proteins are nitrogen-containing compounds with amino
acids as building blocks. These compounds mainly provide structure for the body and
are major components of bone, muscle, blood, cell membranes, enzymes and immune
factors (Hoffman and Falvo, 2004). Additionally, proteins may be a source of energy;
however, the body does not rely on protein for daily energy requirements (Byrd-
Bredbenner et al., 2013). The quality of protein in food is dependent on the composition

40
of essential amino acids which bind together to form proteins such as in hormone
formation (Hoffman and Falvo, 2004; Gallagher, 2008). The human body is unable to
synthesize the 8 to 9 essential amino acids; namely lysine, tryptophan, methionine,
valine, phenylalanine, leucine, isoleucine, threonine and, for infants, histidine; and these
should be obtained from the diet (Medeiros and Wildman, 2012).
2.4.4. Energy
The energy values of the analysed meals provided to school children ranged between
663.86 ± 7.79 and 1488.76 ± 52.66 kJ.d-1 (Table 2.1), which were significantly (P ≤
0.05) below the minimum required values for an average school lunch (≥ 2215 kJ for
individuals aged between 7–10 years and ≥ 2700 kJ for those aged between 11–18
years) as described in Figure 2.1. According to the School Food Trust (2008), a
minimum of 50% of energy from food should be obtained from carbohydrates, less than
35% should be from fats, and a portion (quantity not specified) should be supplied by
proteins. Data obtained from the current study indicated that meals from the majority of
the schools contributed the required amount of total carbohydrates to the energy values
and did not exceed the standard for lipids. This finding is similar to that of a study by
Charrondiere et al. (2004), regarding numerous food items from various countries,
during which the total carbohydrate content supplied 50–80% of energy and 7–11% of
energy was from protein). However, the meal from school B supplied approximately
47%, 17% and 37% of energy from carbohydrates, lipids and protein, respectively, and
therefore relied on protein for energy. Whereas the meal from school I contributed
approximately 31%, 45% and 23% to the energy value from carbohydrates, lipids and
protein, respectively (data not shown) indicating fats as the main source of energy. In an
ideal diet, carbohydrates should be the main source of energy and the body should
avoid reliance on protein for energy (Lucas and Feucht, 2008; Byrd-Bredbenner et al.,
2013). Similar results of low energy provided by school meals were observed during a
study by Nicholas et al. (2013); however, the meals generally met the standards for
percentage of energy from carbohydrates and fats, but not from non-milk extrinsic
sugars (sugars that are not contained within the cellular structure of food). A study by

41
Burgess and Bunker (2002) regarding school lunches found that the energy values of
meals were above the minimum standard, although neither of the percentages of
energy from carbohydrates, fats and non-milk extrinsic sugars were within the
standards. Energy intake of children should be sufficient to ensure growth and meals
consumed by children should provide all the required nutrients without the addition
excessive energy sources to the diet (McGuire and Beerman, 2013).
2.4.5. Vitamins A and E
The analysis for vitamins A and E in the present study yielded undetectable results for
both vitamins. The chromatographs of the standards are presented in Appendix 3.
Depending on the cooking method and composition of food, variable losses of vitamins
may occur as a result of processing and cooking conditions (Lešková et al., 2006).
Kuyper (2000) reported an average loss of 53% of vitamin A during the preparation of
maize meal. The results obtained from a study by Pretorius and Schönfeldt (2012)
indicated that fortification contributed to the improvement of the overall vitamin A status
of children aged 1–9 years, whereas foodstuffs that were not fortified did not yield
results. Vitamins enable numerous chemical reactions to occur in the body which may
aid with the release of energy from carbohydrates, lipids and proteins (Byrd-Bredbenner
et al., 2013). The important roles that fat-soluble vitamins play in several functions of the
human body include vision (Vitamin A), calcium absorption (Vitamin D) and antioxidative
protection in cell membranes (Vitamin E) (Heudi et al., 2004).
2.4.6. Vitamin C
Ascorbic acid values ranged between 14.41 ± 0.46 and 42.30 ± 0.69 mg.d-1, with meals
from schools I and D containing the lowest and highest levels respectively (Table 2.3).
Meals from all the schools met the vitamin C requirements for pupils of all ages as
stipulated for an average school lunch (Figure 2.2). Similar results were observed in the
studies by Pearce et al. (2012) and Nicholas et al. (2013). Both groups of researchers
reported that the vitamin C contents of the school meals they analysed met the required
standards. The study by Fontannaz et al. (2006) revealed that soya-based food
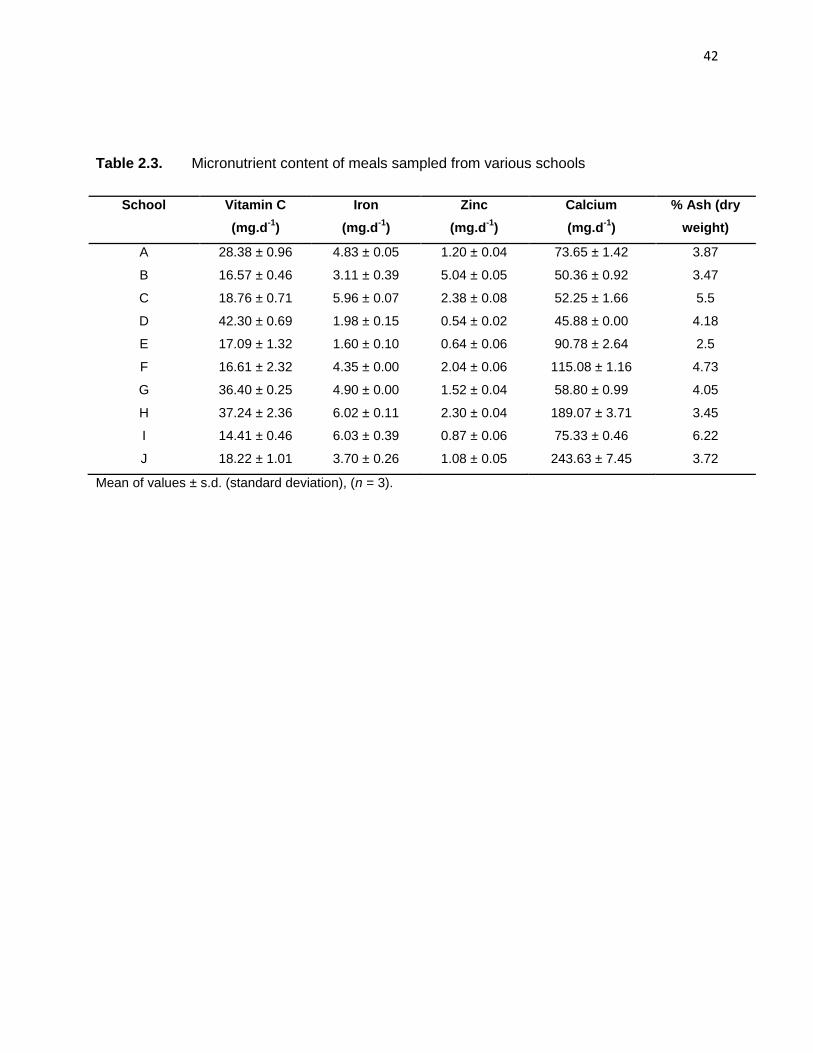
42
Table 2.3. Micronutrient content of meals sampled from various schools
Mean of values ± s.d. (standard deviation), (n = 3).
School Vitamin C
(mg.d-1
)
Iron
(mg.d-1
)
Zinc
(mg.d-1
)
Calcium
(mg.d-1
)
% Ash (dry
weight)
A 28.38 ± 0.96 4.83 ± 0.05 1.20 ± 0.04 73.65 ± 1.42 3.87
B 16.57 ± 0.46 3.11 ± 0.39 5.04 ± 0.05 50.36 ± 0.92 3.47
C 18.76 ± 0.71 5.96 ± 0.07 2.38 ± 0.08 52.25 ± 1.66 5.5
D 42.30 ± 0.69 1.98 ± 0.15 0.54 ± 0.02 45.88 ± 0.00 4.18
E 17.09 ± 1.32 1.60 ± 0.10 0.64 ± 0.06 90.78 ± 2.64 2.5
F 16.61 ± 2.32 4.35 ± 0.00 2.04 ± 0.06 115.08 ± 1.16 4.73
G 36.40 ± 0.25 4.90 ± 0.00 1.52 ± 0.04 58.80 ± 0.99 4.05
H 37.24 ± 2.36 6.02 ± 0.11 2.30 ± 0.04 189.07 ± 3.71 3.45
I 14.41 ± 0.46 6.03 ± 0.39 0.87 ± 0.06 75.33 ± 0.46 6.22
J 18.22 ± 1.01 3.70 ± 0.26 1.08 ± 0.05 243.63 ± 7.45 3.72

43
Figure 2.2. Mean micronutrient values of meals sampled at various NSNP-participating schools (Each data point
represents triplicate values. The standard deviation was used as the error-bar)
0
5
10
15
20
25
30
35
40
45
50
A B C D E F G H I J
Vit
am
in C
(m
g.d
-1)
Schools
0
50
100
150
200
250
300
350
400
A B C D E F G H I J
Calc
ium
(m
g.d
-1)
Schools NBS (11 - 18 years)
NBS (7 - 10 years)
0
1
2
3
4
5
6
7
A B C D E F G H I J
Iro
n (
mg
.d-1
)
Schools
0
1
2
3
4
5
6
A B C D E F G H I J
Zin
c (
mg
.d-1
)
Schools
44
contained higher vitamin C levels than meat-based food. This trend was also
observed in the meals analysed in the current study as the food provided by schools
D and G, which included soya mince, contained higher vitamin C levels than the
meals of school B (which included beef) and school H (which included milk). Vitamin
C is essential for growth and repair of tissues in the body (Grindberg and Williams,
2010). In addition, ascorbic acid acts as a cellular antioxidant and facilitates
intestinal absorption of iron and maintenance of plasma iron (Tarrago-Trani et al.,
2012). Interestingly, meals collected from schools D and I were prepared using
similar ingredients, however the meal from school I produced higher counts of all
quantified nutrients, except for vitamin C (Figure 2.3). The t-test indicated that the
meal from school D had a significantly higher (P ≤ 0.05) ascorbic acid content than
that of school I. This finding may be due to vitamin C being water-soluble and school
D’s meal had a higher moisture content (86%) than that of school I (78%).
Furthermore a moderate positive correlation between moisture and vitamin C was
observed (Figure 2.4).
2.4.7. Ash and mineral content
The ash content of all the meals analysed ranged between 2.5% and 6.22%. Ash
content is regarded as an index of mineral content in biological mass (Effiong and
Udo, 2010). The iron, zinc and calcium values ranged between 1.60 ± 0.10 and 6.03
± 0.39 mg.d-1, 0.54 ± 0.02 and 5.04 ± 0.05 mg.d-1, and 45.88 ± 0.00 and 243.63 ±
7.45 mg.d-1, respectively (Table 2.3). As illustrated in Figure 2.2, for iron content,
only two school meals did not comply with the nutrient standard (≥ 3.0 mg) for pupils
aged 7–10 years while seven schools did not comply with the standard (≥ 5.2 mg)
for those aged 11–18 years. In addition, meals of schools C, H and I had iron levels
that were above the NBS for both age groups and the standard for the zinc content
of school lunches was met by one meal (school B) for both age groups (Figure 2.2).
Furthermore, for the 11–18 years age group, the calcium standard (≥ 350 mg) was
not met by any of the meals analysed while only one sample (school J) met the
standard for individuals aged 7–10 years (≥ 193 mg).

45
Figure 2.3. Variation in nutrient contents of similar meals served by schools D and
I (Each data point represents triplicate values. The standard deviation
was used as the error-bar)
0
5
10
15
20
25
30
35
Total carbohydrates
Lipid Protein
g.d
-1
Macronutrients
School D
School I
0
10
20
30
40
50
60
70
80
Vitamin C Calcium
mg
.d-1
Micronutrients
0
1
2
3
4
5
6
7
Iron Zinc
mg
.d-1
Micronutrients

46
Figure 2.4. Relationship between moisture and vitamin C contents of meals
served at various schools
y = 0.4881x - 30.242 R² = 0.6634
0
2
4
6
8
10
12
14
72 74 76 78 80 82 84 86 88
% V
itam
in C
% Moisture

47
Llorent-Martínez et al. (2012) observed significantly higher levels of minor nutritional
elements (copper, iron and manganese) in soya products than in products of animal
origin; however, the authors found that zinc levels were higher in foodstuffs of
animal origin than of soya. A similar observation was made during the present study
with the meal from school B presenting the highest level of zinc, which may be
attributed to the inclusion of beef, and lower levels of the other micronutrients. The
results of the studies by Pearce et al. (2012) and Nicholas et al. (2013) indicated
school meal values that were below standards for calcium, iron and zinc. A below
standard calcium content and an above standard iron content were reported in the
results of a study by Burgess and Bunker (2002). Iron is critical for the transport and
storage of oxygen in the body and children are at risk of developing iron deficiency
anaemia should the nutrient be deficient (Lucas and Feucht, 2008). Children require
calcium for mineralization and to maintain their growing bones. The primary sources
of calcium are milk and dairy products (Lucas and Feucht, 2008) hence a calcium
content of above the NBS was expected from school H’s meal (which consisted of
milk). Zinc in children is essential for growth and healing of wounds with the major
sources being meat and seafood.
The matter of storage conditions and preparation methods as well as their influences
on the different nutritional categories emanated as a notable observation in this
study. According to Yuan et al. (2009), food preparation methods induce significant
changes in the chemical composition of foodstuffs. In addition, literature suggests
that high temperatures used in cooking methods have an effect on the contents of
nutrient and health-promoting food constituents such as vitamins (Vallejo et al.,
2002; Lin and Chang, 2005; Cieslik et al., 2007; Sikora et al., 2008). Yuan et al.
(2009) reported that various cooking treatments caused major losses of total soluble
proteins, soluble sugars and vitamin C in broccoli due to the application of heat for
prolonged periods during their study. The authors also identified the use of
excessive liquid as reducing the nutritional content of foods via leaching of water-
soluble components into the liquid. Components of the meals sampled in the present
study were prepared using high volumes of liquid with the possible aim of

48
supplementing the foodstuffs. However, this practice may compromise the nutrient
content of food since water-soluble nutrients (such as vitamin C and soluble proteins
and sugars) may be lost by leaching into surrounding liquid medium (Rickman et al.,
2007). Further deterioration and loss of nutrients (particularly vitamins) may occur
due to excessive exposure of foodstuffs to UV light and oxygen, the pH of the
solvent or combinations of various conditions (Severi et al., 1997; Rickman et al.,
2007). Moreover, a study by Vinha et al. (2013) revealed that in all the studied
parameters, temperature and storage duration caused statistically significant
differences in the nutritional values of each food sample analysed. Macronutrients
are relatively stable under various storage conditions; however, the length of storage
considerably affects the retention of micronutrients with high losses observed due to
prolonged periods of storage (Severi et al., 1997; Rickman et al., 2007). It is
therefore essential that NSNP-benefiting schools adhere to the first-in-first-out
principle for storage conduct.
2.5. CONCLUSIONS
According to the data of the present study, meal samples from the various schools
did not meet the NBS for carbohydrates and energy whereas the total carbohydrate
content of the majority of the meals emerged as the main contributor to the energy
value. Children aged between 7 and 10 years were provided with the required
protein in their school meals while only four schools met the standard for those aged
11–18 years. The vitamin C and lipid requirements were satisfied for both age
groups with 50% of the meals containing an essential fatty acid. The majority of the
school meals provided did not satisfy the standards for zinc and calcium for both age
groups while the majority met the NBS for the iron content of school meals for those
aged from 7 to 10 years. The lower content of some nutrients as compared to the
standards may be attributed to the possible shortage of variety in ingredients of the
meals served. In this regard, a study by Snelling and Yezek (2012) indicated that
using nutrient standards to guide the selection of foods offered in schools may
positively affect the intake of energy and nutrients. Therefore, to improve the macro-
and micronutrient quantities of meals, NSNP-participating schools may serve meals
49
that include a variety of whole grains, meat/meat alternatives, fruits, vegetables and
dairy options (Bevans et al., 2011). Food handling methods, especially during
storage and preparation, may also have a significant influence on the nutritional
quality of foods. This was observed in the present study with the wide variation in
nutrient levels of meals containing similar components. Moreover, it may have been
possible that vitamin C leached into surrounding media because meals with high
moisture content yielded higher values for this vitamin. It is further postulated that
the undetected contents of vitamins A and E may be attributed to deterioration
during handling of foodstuffs. Therefore, proper storage practices should be
maintained to minimize loss of nutrients caused by exposing foodstuffs to
surrounding elements and meals should be prepared in a manner that preserves the
quality of nutrients.

50
REFERENCES
Barreira, J.C.M., Pereira, J.A., Oliveira, M.B.P.P. and Ferreira, I.C.F.R. (2010).
Sugar profiles of different chestnut (Castaneasativa Mill.) and almond
(Prunusdulcis) cultivars by HPLC-RI. Plant Foods for Human Nutrition. 65, 38–
43.
Bevans, K.B., Sanchez, B., Teneralli, R. and Forrest, C.B. (2011). Children's eating
behaviour: the importance of nutrition standards for foods in schools. Journal of
School Health. 81, 424–429.
Black, R.E., Allen, L.H., Bhutta, Z.A., Caulfield, L.E., de Onis, M., Ezzati, M.,
Mathers, C. and Rivera, J. (2008). Maternal and child undernutrition: global and
regional exposures and health consequences. The Lancet. 371, 243–260.
Blake, J.S., Munoz, K.D. and Volpe, S. (2010). Nutrition: from science to you. San
Francisco: Pearson Benjamin Cummings.
Burgess, A.L. and Bunker, V.W. (2002). An investigation of school meals eaten by
primary school children. British Food Journal. 104, 705–712.
Byrd-Bredbenner, C., Moe, G., Beshgetoor, D. and Berning, J. (2013). Wardlaw’s
perspectives in nutrition. 9th edition. New York: The McGraw-Hill Companies.
Cieslik, E., Leszczynska, T., Filipiak-Florkiewicz, A., Sikora, E. and Pisulewski, P.M.
(2007). Effects of some technological processes on glucosinolate contents in
cruciferous vegetables. Food Chemistry. 105, 976–981.
Chan, E.J. and Cho, L. (2009). What can we expect from omega-3 fatty acids?.
Cleveland Clinic Journal of Medicine. 76, 245–251.
Charrondiere, U.R., Chevassus-Agnes, S., Marroni, S. and Burlingame, B. (2004).
Impact of different macronutrient definitions and energy conversion factors on
energy supply estimations. Journal of Food Composition and Analysis. 17,
339–360.
Department of Basic Education (DBE). (2013). Mnandi 4 sure: A recipe book for
the National School Nutrition Programme. Available from:
http://www.education.gov.za/LinkClick.aspx?fileticket=%2fBa%2fsZsQZvc%3d
&tabid=440&mid=1911. Date of access: 2013/08/06.

51
Department of Education, United Kingdom. (2012). Nutritional standards.
Available from: http://www.deni.gov.uk/index/support-and-
development2/5schools_meals/nutritional-standards.htm. Date of access:
2013/06/27.
Effiong, G.S. and Udo, I.F. (2010). Nutritive values of four indigenous wild fruits in
south eastern Nigeria. Electronic Journal of Environmental, Agricultural and
Food Chemistry. 9, 1168–1176.
European Food Safety Authority (EFSA). (2010). Scientific opinion on dietary
reference values for fats, including saturated fatty acids, polyunsaturated fatty
acids, monounsaturated fatty acids, trans fatty acids, and cholesterol. EFSA
Journal. 8, 1461.
Fontannaz, P., Kilinc, T. and Heudi, O. (2006). HPLC-UV determination of total
vitamin C in a wide range of fortified food products. Food Chemistry. 94, 626–
631.
Gallagher, M.L. (2008). The nutrients and their metabolism. In Krause’s Food &
Nutrition Therapy. L.K. Mahan and S.E. Stump (Eds). 12th edition. St. Louis:
Saunders Elsevier., pp 39–143.
Gressler, V., Yokoya, N.S., Fujii, M.T., Colepicolo, P., Filho, J.M., Torres, R.P. and
Pinto, E. (2010). Lipid, fatty acid, protein, amino acid and ash contents in four
Brazilian red algae species. Food Chemistry. 120, 585–590.
Grindberg, T. and Williams, K. (2010). Vitamin C quantification using reversed-
phase ion-pairing HPLC. Concordia College Journal of Analytical Chemistry.1,
19–23.
Haroun, D., Wood, L., Harper, C. and Nelson, M. (2011). Nutrient-based standards
for school lunches complement food-based standards and improve pupils’
nutrient intake profile. British Journal of Nutrition. 106, 472–474.
Heudi, O., Trisconi, M.J. and Blake, C.J. (2004). Simultaneous quantification of
Vitamins A, D3 and E in fortified infant formulae by liquid chromatography–
mass spectrometry. Journal of Chromatography A.1022, 115–123.
Hoffman, J.R. and Falvo, M.J. (2004). Protein – which is best?. Journal of Sports
Science and Medicine. 3, 118–130.

52
Insel, P., Ross, D., McMahon, K. and Bernstein, M. (2013). Discovering nutrition. 4th
edition. Burlington: Jones & Bartlett Learning.
Iversen, P.O., du Plessis, L., Marais, D., Morseth, M., Høisæther, E.A. and
Herselman, M. (2011). Nutritional health of young children in South Africa over
the first 16 years of democracy. South African Journal of Child Health. 5, 72–
77.
Johnson, M., Östlund, S., Fransson, G., Kadesjö, B. and Gillberg, C. (2009).
Omega-3/omega-6 fatty acids for attention deficit hyperactivity disorder: a
randomized placebo-controlled trial in children and adolescents. Journal of
Attention Disorders. 12, 394–401.
Jung, S., Rickert, D.A., Deak, N.A., Aldin, E.D., Recknor, J., Johnson, L.A. and
Murphy, P.A. (2003). Comparison of Kjeldahl and Dumas methods for
determining protein contents of soybean products. Journal of the American Oil
Chemists' Society. 80, 1169–1173.
Kallman, K. (2005). Food for thought: a review of the National School Nutrition
Programme. Children’s Institute. Cape Town: University of Cape Town.
Kuyper, L. (2000). Stability tests and sensory evaluation of fortified food vehicles for
the national food fortification programme. Pretoria: Council for Scientific and
Industrial Research (CSIR).
Labadarios, D., Steyn, N.P., Maunder, E., MacIntryre, U., Gericke, G., Swart, R.,
Huskisson, J., Dannhauser, A., Vorster, H.H., Nesmvuni, A.E. and Nel, J.H.
(2005). The National Food Consumption Survey (NFCS): South Africa, 1999.
Public Health Nutrition. 8, 533–543.
Lešková, E., Kubíová, J., Kováčiková, E., Košická, M., Porubská, J. and Holčíová,
K. (2006). Vitamin losses: retention during heat treatment and continual
changes expressed by mathematical models. Journal of Food Composition and
Analysis. 19, 252−276.
Lin, C.H. and Chang, C.Y. (2005). Textural change and antioxidant properties of
broccoli under different cooking treatments. Food Chemistry. 90, 9−15.

53
Llorent-Martínez, E.J., Fernández de Córdova, M.L., Ruiz-Medina, A. and Ortega-
Barrales, P. (2012). Analysis of 20 trace and minor elements in soy and dairy
yogurts by ICP-MS. Microchemical Journal. 102, 23–27.
Lucas, B.T. and Feucht, S.A. (2008). Nutrition in childhood. In Krause’s Food &
Nutrition Therapy. L.K. Mahan and S.E. Stump (Eds). 12th edition. St. Louis:
Saunders Elsevier., pp 222–243.
Mabaya, E., Jordaan, D., Malope, P., Monkhei, M. and Jackson, J. (2010). Attribute
preferences and willingness to pay for fortified cereal foods in Botswana.
Agricultural Economics Research, Policy and Practice in Southern Africa. 49,
459-483.
McCleary, B.V., DeVries, J.W., Rader J.I., Cohen, G., Prosky, L., Mugford, D.C.,
Champ, H. and Okuma, K. (2010). Determination of total dietary fiber (CODEX
definition) by enzymatic-gravimetric method and liquid chromatography:
collaborative study. Journal of AOAC International. 93, 221–232.
McGuire, M.K. and Beerman, K.A. (2013). Nutr. Belmont: Cengage Learning.
Medeiros, D.M. and Wildman, R.E.C. (2012). Advanced human nutrition. 2nd edition.
Sudbury: Jones & Bartlett Learning.
Menezes, E.W., de Melo, A.T., Lima, G.H. and Lajolo, F.M. (2004). Measurement of
carbohydrate components and their impact on energy value of foods. Journal of
Food Composition and Analysis.17, 331–338.
Molnar-Perl, I. (2000). Role of chromatography in the analysis of sugars, carboxylic
acids and amino acids in food. Journal of Chromatography A. 891, 1–32.
Moreno-Rojas, R., Sánchez-Segarra, P. J., Cámara-Martos, F. and Amaro-López,
M. A. (2010). Multivariate analysis techniques as tools for categorization of
Southern Spanish cheeses: nutritional composition and mineral content.
European Food Research and Technology. 231, 841–851.
Moses, S.K., Whiting, A.V., Muir, D.C.G., Wang, X. and O'Hara, T.M. (2009).
Organic nutrients and contaminants in subsistence species of Alaska:
Concentrations and relationship to food preparation method. International
Journal of Circumpolar Health. 68, 354–371.
54
Muir, J.G., Rose, R., Rosella, Q., Liels, K., Barrett, J.S., Shepherd, S.J. and Gibson
P.R. (2009). Measurement of short-chain carbohydrates in common Australian
vegetables and fruits by high-performance liquid chromatography (HPLC).
Journal of the Science of Food and Agriculture. 57, 554–565.
Nicholas, J., Wood, L., Harper, C. and Nelson, M. (2013). The impact of the food-
based and nutrient-based standards on lunchtime food and drink provision and
consumption in secondary schools in England. Public Health Nutrition. 16,
1052–1065.
Nnakwe, N.E. (2013). Community nutrition: planning health promotion and disease
prevention. 2nd edition. Burlington: Jones & Barlett Learning.
Pearce, J., Wood, L. and Nelson, M. (2012). Lunchtime food and nutrient intakes of
secondary-school pupils; a comparison of school lunches and packed lunches
following the introduction of mandatory food-based standards for school lunch.
Public Health Nutrition. 16, 1126–1131.
Perez-Rodrigo, C. and Aracenta, J. (2001). School-based nutrition education:
lessons learned and new perspectives. Public Health Nutrition. 4, 131–139.
Pretorius, B. and Schönfeldt, H.C. (2012).Vitamin A content of fortified maize meal
and porridge as purchased and consumed in South Africa. Food Research
International. 47, 128–133.
Prior, P.L. and Galduróz, J.C.F. (2012). (N-3) Fatty acids: molecular role and clinical
uses in psychiatric disorders. Advances in Nutrition. 3, 257–265.
Rickman, J.C., Barrett, D.M. and Bruhn, C.M. (2007). Nutritional comparison of
fresh, frozen and canned fruits and vegetables. Part 1. Vitamins C and B and
phenolic compounds. Journal of the Science of Food and Agriculture. 87, 930–
944.
Salo-Väänänen, P., Ollilainen, V., Mattila, P., Lehikoinen, K., Salmela-Mölsä, E. and
Piironen, V. (2000). Simultaneous HPLC analysis of fat-soluble vitamins in
selected animal products after small-scale extraction. Food Chemistry. 71,
535–543.
School Food Trust. (2008). A guide to introducing the government’s food-based
and nutrient-based standards for school lunches. Sheffield, UK: School Food

55
Trust: Eat better Do better. Available from:
http://www.salisbury.anglican.org/resources-library/schools/schools-every-child-
matters/be-healthy-school-food-trust-guide-to-government-lunch-standards.
Date of access: 2013/06/27.
Severi, S., Bedogni, G., Manzieri, A.M., Poli, M. and Battistini, N. (1997). Effects of
cooking and storage methods on the micronutrient content of foods. European
Journal of Cancer Prevention. 6, 521–524
Sikora, E., Cieslik, E., Leszczynska, T., Filipiak-Florkiewicz, A. and Pisulewski, P.M.
(2008). The antioxidant activity of selected cruciferous vegetables subjected to
aquathermal processing. Food Chemistry. 107, 55–59.
Snelling, A.M. and Yezek, J. (2012). The effect of nutrient-based standards on
competitive foods in 3 schools: potential savings in kilocalories and grams of
fat. Journal of School Health. 82, 91–96.
Tarrago-Trani, M.T., Phillips, K.M. and Cotty, M. (2012). Matrix-specific method
validation for quantitative analysis of vitamin C in diverse foods. Journal of
Food Composition and Analysis. 26, 12–25.
Usfar, A.A., Achadi, E.L., Martorell, R., Hadi, H., Thaha, R., Jus'at, I., Atmarita,
Martianto, D., Ridwan, H. and Soekirman. (2009). Expert meeting on child
growth and micronutrient deficiencies - new initiatives for developing countries
to achieve millennium development goals: executive summary report. Asia
Pacific Journal of Clinical Nutrition. 18, 462–469.
Vallejo, F., Tomas-Barberan, F.A. and Garcia-Viguera, C. (2002). Glucosinolates
and vitamin C content in edible parts of broccoli florets after domestic cooking.
European Food Research and Technology. 215, 310–316.
Vinha, A.F., Barreira, S.V.P., Castro, A., Costa, A. and Oliveira, M.B.P.P. (2013).
Influence of the storage conditions on the physicochemical properties,
antioxidant activity and microbial flora of different tomato (Lycopersicon
esculentum L.) cultivars. Journal of Agricultural Science. 5, 118–128.
Weichselbaum, E. and Buttriss, J. (2011). Nutrition, health and schoolchildren.
Nutrition Bulletin, 36, 295–355.

56
World Hunger Education Service. (2011). 2012 World hunger and poverty facts
and statistics. Available from:
http://www.worldhunger.org/articles/Learn/world%20hunger%20facts%202002.
htm#Number_of_hungry_people_in_the_world. Date of access: 2013/04/28.
Yuan, G., Sun, B., Yuan, J. and Wang, Q. (2009). Effects of different cooking
methods on health-promoting compounds of broccoli. Journal of Zhejiang
University SCIENCE B.10, 580–588.
Zhou, J., Suo, Z., Zhao, P., Cheng, N., Gao, H., Zhao, J. and Cao, W. (2013).
Jujube honey from China: physicochemical characteristics and mineral
contents. Journal of Food Science. 78, C387–C394.

57
APPENDICES

58
Appendix 1. Nutrient-based standards for an average school lunch (adapted from
School Food Trust, 2008)
Nutrient Maximum or
Minimum
7–10 years 11–18 years
Energy (kJ) Min 2215 ± 111 2700 ± 135
Carbohydrate (g) Min 70.6 86.1
Fat (g) Max 20.6 25.1
Protein (g) Min 7.5 13.3
Vitamin A (µg) Min 175 245
Vitamin C (mg) Min 10.5 14.0
Calcium (mg) Min 193 350
Iron (mg) Min 3.0 5.2
Zinc (mg) Min 2.5 3.3

59
Appendix 2. Calibration curve regression of mono- and disaccharides over a
calibration range of 0.4–3.2 g.l-1
y(fructose) = 0.013x - 0.019 R² = 1
y(glucose) = 0.014x - 0.024 R² = 1
y(sucroce)= 0.012x - 0.008 R² = 1
0
0.5
1
1.5
2
2.5
3
3.5
0 50 100 150 200 250 300
Co
nc
en
tra
tio
n (
g/l
)
Response
Fructose
Glucose
Sucrose

60
Appendix 3. Chromatograms of vitamins A and E standards (A: retinyl acetate; B: δ-tocopherol; C: α-tocopherol; D: α-
tocopherol acetate)
D
A B
C
61
CHAPTER 3
THE PREVALENCE OF MICROBIOTA ON FOOD
CONTACT SURFACES ASSOCIATED WITH A SOUTH
AFRICAN SCHOOL FEEDING SCHEME
This chapter has been submitted, partially or in full, for publication in Journal of Food
Safety; ISSN 1745-4565.

62
3.1. ABSTRACT The prominence of disease transmission between individuals in confined
environments is a concern particularly in educational environments. These
environments primarily facilitate educational activities and are not conducive for
catering purposes. With respect to school feeding schemes food contact surfaces
may act as a potential source of cross-contamination of pathogens. The aim of this
study was to assess the contamination levels of surfaces that came into contact with
food provided to children during the administration of the National School Nutrition
Programme in central South Africa. In each school under study, microbiological
samples were collected from the preparation surfaces and the dominant hands and
aprons of food handlers. The samples were analysed for total viable counts, total
coliforms, Escherichia coli, Staphylococcus aureus and yeast and moulds. The
criteria specified in the British Columbia Centre for Disease Control Guide for
Environmental Health Officers were used to evaluate the results. Total viable counts
produced colonies that were too numerous to count (over 100 colonies per plate) for
the majority of the surfaces. When compared to the guide, approximately 7% of all
surfaces produced unsatisfactory enumeration of S. aureus and E. coli whereas
approximately 10% and 37% of the counts were unsatisfactory for total coliforms
and yeast and mould, respectively. Statistically differences could not be established
amongst microbial counts of the surfaces which suggest cross-contamination may
have occurred. Contamination may be attributed to foodstuffs and animals
(particularly rodents) in the vicinity of the preparation area rather than to the food
handlers since the hands had the lowest counts of enumerated organisms amongst
the analysed surfaces.
Keywords: National School Nutrition Programme, cross-contamination,
microbiological testing, food contact surfaces

63
3.2. INTRODUCTION
Direct transmission of diseases among individuals has been shown to be prominent
in confined environments such as schools (Mbithi et al., 1992; Clay et al., 2006).
School environments are particularly prone to epidemiological outbreaks due to the
nature of inter-personal dynamics. The risk is augmented with the introduction of an
additional variable which supports microbial proliferation, such as food. Food, water
and surfaces may be contaminated with considerable quantities of pathogenic
microorganisms during food preparation and consumption, which may result in
illnesses (Taulo et al., 2009). Young children are particularly vulnerable to
pathogenic bacteria and are at risk of developing pathological conditions upon being
infected with pathogens such as Escherichia coli, Staphylococcus aureus and some
opportunistic pathogens upon consumption of contaminated foods (Gerba, 2009;
Lee and Greiga, 2010; Adams, 2012). In children, E. coli infection may be
associated with diarrhoea and haemolytic uraemic syndrome (HUS) (particularly in
children under five years of age) which may result in fatality (Bell and Kyriakides,
1998; Scannell, 2012). Possible outbreaks amongst school children are of concern
since illnesses from pathogenic bacteria may persist for a maximum of three to five
days (Gerba, 2009; Scannell, 2012) and therefore promote absenteeism. The main
factors that lead to food-borne illnesses have been shown to be improper
time/temperature control, poor personal hygiene of the food preparer and cross-
contamination (Collins, 1997; FDA, 2004; Brannon et al., 2009). Blackburn (2003)
describes food contact surfaces and food handlers’ hands as significant potential
vehicles of pathogens. Cross-contamination via the hands of food handlers and food
contact surfaces, particularly chopping boards, is a major concern in the
transmission of food-borne pathogens. These surfaces have been found to have a
significant contribution to cross-infection and pose an elevated risk of microbial
transfer (Bloomfield and Scott, 1997; Cogan et al., 1999; Gorman et al., 2002).
Food-borne pathogens may be introduced by the unwashed hands of food handlers
who themselves are infected while remaining operational in food preparation
environments. Microbiota may further be transferred amongst foodstuffs by the use
of utensil or cutting board without proper sanitation (CDC, 2013).

64
Since food contact surfaces are particularly important vectors in the dispersal of
food-borne pathogens, their cleaning and sanitization is of importance in reducing
the number and type of potential pathogens (Knechtges, 2012). Frequent sanitation
is reportedly the most effective control measure in ensuring the microbiological
safety of foodstuffs (Changani et al., 1997; Blackburn, 2003). It is also critical to
ensure that cleaning is achieved to a measure that substantially reduces cross-
contamination and ensures the integrity of the food (Stephan et al., 2004; Jackson et
al., 2008). Furthermore, the majority of food-related diseases are transmitted via the
faecal-oral route, therefore reducing sources of faecal contamination is fundamental
in achieving food sanitation (Gerba, 2009). In addition to cleaning and sanitizing, the
application and evaluation of monitoring methods is necessary for ensuring the
efficiency of sanitation procedures in the food processing environment (Gilbert,
1970). According to Moore and Griffith (2002), various methods of detecting
microbiota and enumerating microbial surface contamination may be integrated.
Microbiological testing plays an important role in identifying potential threats and
their sources as well as evaluating their effects on the final product. Assessments
may further assist in developing and implementing preventative measures
(Blackburn, 2003) and may promote food safety while administering school feeding
schemes such as the South African National School Nutrition Programme (NSNP).
The NSNP was introduced to serve food to pupils across the country, mainly among
poverty-stricken communities. However, since the programme is rolled out at
schools that are primarily deficient of proper catering facilities, the maintenance of
hygiene may be questionable during the administration of the programme. It was
envisaged that the current study would provide information on the general hygiene
of surfaces in contact with foodstuffs during the administration of the NSNP at
participating schools in Bloemfontein, South Africa, through the use of
microbiological methods.

65
3.3. MATERIALS AND METHODS
3.3.1. Sampling protocol
Ten schools were randomly selected from amongst beneficiaries of the NSNP in the
Bloemfontein area. The sample represented schools in quintiles 1, 2 and 3
categories and included primary, intermediate, combined and special schools from
the rural and urban regions. Schools are categorized (by the Department of Basic
Education) in quintiles according to the socio-economic statuses of the communities
with the lowest being quintile 1. For the purpose of this study, schools were
alphabetically labelled to maintain confidentiality. From each school, representative
samples were collected from three previously cleaned surfaces that came into
contact with foodstuffs, namely the preparation surface, and the hand (thumb,
forefinger, middle finger and palm of dominant hand) and the apron of the food
handler. In total, 120 surface samples were collected. All samples were transported
on ice to the laboratory where investigations were conducted without delay. All
analyses were performed in triplicate.
3.3.2. Microbial analysis
Microbial samples were collected and quantified using 65 mm Rodac plates (Lasec,
Ndabeni, Cape Town, SA). The media were prepared according to the
manufactures’ instructions, followed by preparation of the contact plates according
to the method proposed by Bruch and Smith (1968) and Ness (1994). The selected
agar media were used to investigate total viable counts, total coliforms, E. coli, S.
aureus and yeasts and moulds on the dominant hand of each food preparer. Four
samples were also collected from exposed areas of the aprons and cutting surfaces
using the Rodac plates containing agar media to investigate the mentioned
organisms.

66
Total viable counts
Plate count agar (PCA) (Merck, Wadeville, Gauteng, SA) was used for the
enumeration and detection of TVC and plates were incubated at 36°C for 24 to 48
hours (Lues and van Tonder, 2007).
Total coliforms and Escherichia coli
Total coliforms and presumptive E. coli were enumerated using Chromocult coliform
agar (CCA) (Merck, SA) and incubated at 36°C for 24 to 48 hours. Typical coliforms
were salmon pink to red in colour, whilst E. coli produced typical dark-blue to violet
colonies (González et al., 2003).
Staphylococcus aureus
Baird-Parker agar (BPA) (Merck, SA) supplemented with egg yolk telluride emulsion
was used for the enumeration of presumptive S. aureus and plates were incubated
at 36°C for 24 to 48 hours. Grey-black shiny colonies with white margins surrounded
by clear zones were identified as S. aureus colonies (Baird & Lee, 1995).
Yeasts and moulds
Potato dextrose agar (PDA) (Merck, SA) plates were incubated at 25°C for 3 to 5
days for the enumeration of yeasts and moulds (Beuchat, 1992). Typically, yeasts
exhibited creamy to white colonies and moulds appeared as filamentous colonies of
various colours.
Analysis of data
Upon differentiation of microbial colonies on appearance and colour, they were
counted using a Symbiosis aCOLade colony counter (Vacutec, Randburg, Gauteng,
SA) and expressed as CFU.cm-2. All results were evaluated according to the British
Columbia Centre for Disease Control (BCCDC) Guide for Environmental Health
Officers using the following criteria: satisfactory: < 5 CFU.cm-2; acceptable: 5
CFU.cm-2 to 10 CFU.cm-2; and unsatisfactory: > 10 CFU.cm-2 (BC Centre for
Disease Control, 2010). This guideline was used as it is considered authoritative

67
(Skowronski et al., 2012) as well as related to the South African environmental
health systems. In addition, the guideline provided by the BCCDC guide articulates
well with the units and best described assumptions used in this study. Additionally
the BCCDC guide was found to cover significantly more categories when compared
to the South African R.918 of 1999 which offers only the guideline of 100 CFU.cm-2
on surfaces. For the purpose of this study, counts of above 100 colonies as
determined by the probable number of volumes which produced a matrix of growth
rather than individual countable colonies were labelled as too numerous to count
(TNTC). The significance defined was at the p-value of 0.05.
3.4. RESULTS AND DISCUSSION
As shown in Table 3.1, in terms of TVC, 80% of all the surfaces sampled had counts
that were TNTC. For total coliforms, 60% of the counts obtained from hands were
satisfactory while 20% were acceptable and 20% were not detectable. For
preparation surfaces, 40% of coliform counts were satisfactory and 20% were
acceptable, whereas 30% were unsatisfactory and 10% were not detectable when
compared to the BCCDC guide. Furthermore, 80% of the apron counts were
satisfactory, 10% were acceptable and 10% were not detectable for total coliforms.
E. coli counts ranged between 0.50 and 2.63 CFU.cm-2 for the hands, 0.60 CFU.cm-
2 and TNTC for preparation surfaces, and 0.29 and 2.44 CFU.cm-2 for aprons (Table
3.1). Fifty percent and 90% of the E. coli counts were satisfactory for the hands and
aprons, respectively, and the remaining counts of both surfaces were not detectable.
Additionally, 60% of the counts for the preparation surfaces were satisfactory, 10%
were acceptable. 20% were unsatisfactory and 10% were not detectable for E. coli.
S. aureus counts ranged between 0.40 and 5.57 CFU.cm-2 for the hands, 0.60
CFU.cm-2 and TNTC for preparation surfaces, and 0.70 and 4.17 CFU.cm-2 for
aprons. For the hands, 80% of the S. aureus counts were satisfactory, 10% were
acceptable and 10% were not detectable; while 60% were satisfactory for
preparation surfaces, 20% were acceptable and 20% were unsatisfactory whereas
all detectable counts (90%) were satisfactory for aprons. Of the three surfaces
analysed, preparation surfaces enumerated the highest counts of total coliforms, E.
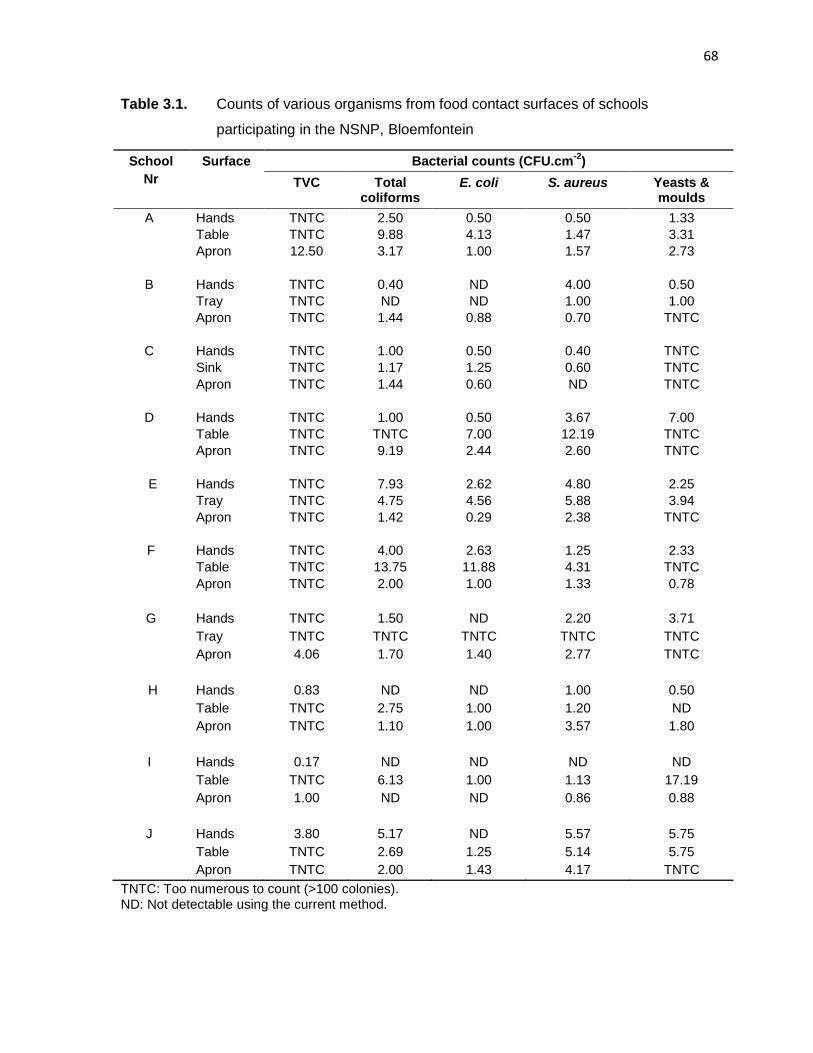
68
Table 3.1. Counts of various organisms from food contact surfaces of schools
participating in the NSNP, Bloemfontein
TNTC: Too numerous to count (>100 colonies). ND: Not detectable using the current method.
School
Nr
Surface
Bacterial counts (CFU.cm-2
)
TVC Total coliforms
E. coli S. aureus Yeasts & moulds
A Hands TNTC 2.50 0.50 0.50 1.33
Table TNTC 9.88 4.13 1.47 3.31
Apron 12.50 3.17 1.00 1.57 2.73
B Hands TNTC 0.40 ND 4.00 0.50
Tray TNTC ND ND 1.00 1.00
Apron TNTC 1.44 0.88 0.70 TNTC
C Hands TNTC 1.00 0.50 0.40 TNTC
Sink TNTC 1.17 1.25 0.60 TNTC
Apron TNTC 1.44 0.60 ND TNTC
D Hands TNTC 1.00 0.50 3.67 7.00
Table TNTC TNTC 7.00 12.19 TNTC
Apron TNTC 9.19 2.44 2.60 TNTC
E Hands TNTC 7.93 2.62 4.80 2.25
Tray TNTC 4.75 4.56 5.88 3.94
Apron TNTC 1.42 0.29 2.38 TNTC
F Hands TNTC 4.00 2.63 1.25 2.33
Table TNTC 13.75 11.88 4.31 TNTC
Apron TNTC 2.00 1.00 1.33 0.78
G Hands TNTC 1.50 ND 2.20 3.71
Tray TNTC TNTC TNTC TNTC TNTC
Apron 4.06 1.70 1.40 2.77 TNTC
H Hands 0.83 ND ND 1.00 0.50
Table TNTC 2.75 1.00 1.20 ND
Apron TNTC 1.10 1.00 3.57 1.80
I Hands 0.17 ND ND ND ND
Table TNTC 6.13 1.00 1.13 17.19
Apron 1.00 ND ND 0.86 0.88
J Hands 3.80 5.17 ND 5.57 5.75
Table TNTC 2.69 1.25 5.14 5.75
Apron TNTC 2.00 1.43 4.17 TNTC
69
coli and S. aureus. Yeast and mould counts ranged between 0.50 CFU.cm-2 and
TNTC for the hands, 1.00 CFU.cm-2 and TNTC for preparation surfaces, 0.78
CFU.cm-2 and TNTC for the aprons (Table 3.1). According to BCCDC guide, for the
hands, 60% of the counts of yeasts and moulds were satisfactory, 20% were
acceptable, 10% were unsatisfactory and 10% were not detectable, while 40% were
satisfactory, 50% were unsatisfactory and 10% were not detectable for the
preparation surfaces, and 40% of the counts were satisfactory and 60% were
unsatisfactory for the aprons. Aprons yielded the highest counts of yeast and moulds
while hands had the lowest counts of these organisms.
The objective of TVC is to provide a general indication of the number of organisms
present in the sample, thereby indicating the general hygiene status of the sample
(Bell et al., 2005) while the presence of coliforms indicates a risk in occurrence of
pathogens and is therefore a measure of the effectiveness of sanitation programmes
(Frank et al., 1990; Buchanan, 2000). In addition, coliforms, including E. coli, form
part of the natural microbiota in the intestinal tracts of warm-blooded humans and
animals. Their presence generally indicates faecal contamination (Bell and
Kyriakides, 1998; Lues and van Tonder, 2007; Pepper and Gerba, 2009). Pathogens
may be present in faeces in concentrations of between 104 and 1011.g-1 indicating
that even a tenth of a milligram of faeces on the skin may contain up to a million
infectious bacterial cells (Lee and Greiga, 2010). A higher contamination of food by
hands than that by surfaces was observed during a study by Taulo et al. (2009),
which found that the transfer of S. aureus was significantly higher than that of E. coli.
The authors postulated that although the traditional cooking of thick porridge
inactivated S. aureus and E. coli, the porridge could have been contaminated with
the bacteria by hands and wooden ladles during serving. During this study, however,
the hands of food handlers yielded lower counts of all enumerated organisms (total
coliforms, E. coli, S. aureus and yeasts and moulds) than preparation surfaces. This
finding suggests that the sources of contamination are more likely to result from the
foodstuffs and animals (rodents particularly in the rural areas) in the vicinity of the
preparation area rather than from the food handlers themselves.

70
Although some visual differences were observed among the contamination levels of
hands, preparation surfaces and aprons, a significant deference regarding the
microbial counts among these food contact surfaces could not be established (P >
0.05). Thus it appears that considerable cross-contamination resulted among the
surfaces with no evident differences in, for example, cleaning regimes. Additionally,
this observation points to a lack of practices that isolates these surfaces from one
another so as to hinder cross-contamination. Other factors which may be attributed
to contamination of surfaces include the use of contaminated water and there may
have been shortcomings in surface sanitation methods, such as incorrect detergent
to water dilution ratios and the minimum contact time for disinfectants (Samadi et al.,
2009; Taulo et al., 2009). A study of Mosupye and von Holy (2000), during which
facilities of street food vendors in Johannesburg, South Africa, were assessed,
illustrated high aerobic plate and coliform counts from surface samples collected
from a vendor who did not clean the food preparation surface during preparation
whereas fewer counts were observed from a vendor who constantly cleaned the
surface using a dishcloth. With regards to yeasts and moulds, the main source of
contamination is the environment, particularly the air (Kure et al., 2004). Preparation
areas of the majority of the schools were predisposed to becoming dusty due to a
lack of proper kitchen facilities and ventilation which may contribute to contamination
of surfaces and foodstuffs.
Illness-causing bacteria may survive on various surfaces around the kitchen,
including hands, utensils, and cutting boards. The CDC (2013) recommends that
hands be washed for 20 seconds with soap and running water, followed by
scrubbing at the back, between fingers and under the nails. Furthermore, for utensils
and cutting boards to be sufficiently sanitized, hot water with detergent and a
sanitising (bleach) solution should be used. Although not sufficient, hand-washing
alone significantly reduces levels of bacteria load. Due to a lack of resources and
because of infrastructure limitations, the majority of the schools participating in the
NSNP were not provided with hand-washing facilities within the food preparation
areas and nor did they have readily available hot water. The water taps, particularly
71
at schools located in rural areas, were located outside and were not in the vicinity of
the food preparation areas. A study by Snyder (2004) found a significant reduction of
E.coli by rinsing hands in a bucket of acetic acid solution prepared with tap water (at
room temperature) and distilled vinegar (5% acetic acid). The solution proved to
maintain effectiveness after several hand rinses (i.e., less than 1 CFU.10ml-1 was
observed in the solution after 24 hours).
In addition to cleaning practices, the nature of the contact surfaces may have an
impact on contamination levels of foods with microorganisms. According to the
South African Health Regulations (R.918 of 1999), the surface which comes into
direct contact with food should be made of smooth, rust-proof, non-toxic and non-
absorbent material that is free of open joints, chips or cracks. Generally, smooth
surfaces are easier to clean than irregular surfaces. Surfaces which may crack,
splinter, scratch and distort provide harbourage for microorganisms and prevent
proper cleaning and sanitizing (Knechtges, 2012). Additionally, organic material from
food residues may reduce the effectiveness of disinfectant by either reacting
chemically with the disinfectant or inhibiting the physical access of the disinfectant to
the targeted microbiota (Entis, 2007; Meyer et al., 2010). The high levels of organic
material likely to be present on food contact surfaces increase the hydrophilicity of
the surfaces, and bacteria attach more readily to hydrophilic surfaces, but struggle to
remain attached to hydrophobic surfaces (Zottola and Sasahara, 1994; Dickinson et
al., 1997; Abban et al., 2012). The majority of the schools sampled during the
current study (60%) prepared food on wooden table tops while the other 40% used
plastic surfaces (data not shown). According to Abban et al. (2012), stainless steel is
the material of choice in the food processing environment. However, plastic cutting
boards may also contribute greatly to cleanliness and minimize cross-contamination
(Knechtges, 2012). According to Entis (2007), the cutting board is the most
susceptible to contamination of all the kitchen utensils and the porous nature of
wood leads to concerns regarding the potential for cross-contamination. The
wooden food preparation surfaces employed by schools during the administration of
the NSNP were irregular and hydrophilic with distinct flaws, thus creating a
72
favourable habitat onto which microorganisms could attach and grow. Conversely, it
is noteworthy that the preparation surface used by school G (which was made of
plastic) had counts that were TNTC for all enumerated organisms which indicates
that in some instances the method of sanitation may have a greater impact on the
hygiene of surfaces than the nature of material from which the surface is made.
3.5. CONCLUSIONS
Generally, the present study indicated that preparation surfaces had the highest
counts of the detected pathogens, whereas hands had the lowest counts of
microorganisms. However, a significant difference in the microbial loads amongst
the food contact surfaces could not be established. These findings suggest that
although the surfaces may have not been sources of contamination, opportunity for
the occurrence of cross-contamination among surfaces may be due to lack of
surface isolation and shortcomings in the cleaning regimes. To prevent cross-
contamination, all equipment and working surfaces must be thoroughly washed with
hot water and detergent after being used to prepare raw foods. In this regard,
sanitation programmes have proved to be cost effective, simple to implement and to
significantly reduce microbial contamination (Stretch and Southgate, 1991;
Blackburn, 2003). According to DeVere and Purchase (2007), the traditional two-
step detergent and rinse cleaning method has been substituted with various
antibacterial products that have been developed to provide fast and effective
cleaning to food preparation areas. Household bleach (sodium hypochlorite) is an
inexpensive and readily available agent for sanitizing preparation surfaces (Entis,
2007). Individuals carry thousands of bacteria on the surface of their skin (such as
S. aureus and Salmonella bacteria) and are usually not aware they may be carriers
of food pathogens (Stretch and Southgate, 1991). The importance of washing
hands, particularly after using the toilet, should not be overlooked. With the various
opportunities for food to become contaminated during production and preparation,
monitoring procedures which include microbial analyses may contribute to ensuring
the safety of foodstuffs.

73
REFERENCES
Abban, S., Jakobsen, M. and Jespersen, L. (2012). Attachment behaviour of
Escherichia coli K12 and Salmonella Typhimurium P6 on food contact surfaces
for food transportation. Food Microbiology. 31, 139–147.
Adams, M. (2012). Introduction to food microbiology. In Handbook of food safety
engineering. D. Sun (Ed). Chichester: Wiley-Blackwell, pp. 3–17.
Baird, R.M. and Lee, W.H. (1995). Media used in the detection and enumeration of
Staphylococcus aureus. International Journal of Food Microbiology. 26, 15–24.
BC Centre for Disease Control. (2010). Environmental hygiene monitoring: a guide
for environmental health officers. Available from:
http://www.bccdc.ca/NR/rdonlyres/EF1461BE-0301-4A59-8843-
420072412721/0/EnvMonitoringHygieneGuideforEHOs.pdf. Date of access:
2012/05/28.
Bell, C. and Kyriakides, A. (1998). E. coli: a practical approach to the organism and
its control in food. 1st edition. London: Blackie Academic & Professional.
Bell, C., Neaves, P. and Williams, A.P. (2005). Food microbiology and laboratory
practice. Oxford: Blackwell Publishing.
Beuchat, L.R. (1992). Media for detecting and enumerating yeasts and moulds.
International Journal of Food Microbiology. 17, 145–158.
Blackburn, C. de W. (2003). Microbiological analysis and food safety management:
GMP and HACCP systems. In Detecting pathogens in food. T.A. McMeekin
(Ed). Cambridge: Woodhead Publishing Limited, pp. 3–17.
Bloomfield, S.F. and Scott, E. (1997). Cross-contamination and infection in the
domestic environment and the role of chemical disinfectants. Journal of Applied
Microbiology. 83, 1–9.
Brannon, L.A., York, V.K., Roberts, K.R., Shanklin, C.W. and Howells, A.D. (2009).
Appreciation of food safety practices based on level of experience. Journal of
Foodservice Business Research. 12, 134–154.
Bruch, M.K. and Smith F.W. (1968). Improved method for pouring rodac plates.
Applied Microbiology. 16, 1427–1428.

74
Buchanan, R.L. (2000). Acquisition of microbiological data to enhance food safety.
Journal of Food Protection. 63, 832–838.
Centers for Disease Control and Prevention (CDC). (2013). Food safety.
Available from: http://www.cdc.gov/foodsafety/, Date of access: 2013/02/21.
Changani, S.D., Belmar-Beiny, M.T. and Fryer, P.J. (1997). Engineering and
chemical factors associated with fouling and cleaning in milk processing.
Experimental Thermal and Fluid Science.14, 392–406.
Clay, S., Maherchandani, S., Malik, Y.S. and Goyal, S.M. (2006). Survival on
uncommon fomites of feline calicivirus, a surrogate of norovirus. American
Journal of Infection Control. 34, 41–43.
Cogan, T.A., Bloomfield, S.F. and Humphrey, T.J. (1999). The effectiveness of
hygiene procedures for the prevention of cross-contamination from chicken
carcasses in the domestic kitchen. Letters in Applied Microbiology. 29, 354–
358.
Collins, J.E. (1997). Impact of changing lifestyles on the emergence/re-emergence
of foodborne pathogens. Emerging Infectious Diseases. 3, 471–479.
DeVere, E. and Purchase, D. (2007). Effectiveness of domestic antibacterial
products in decontaminating food contact surfaces. Food Microbiology. 24,
425–430.
Dickinson, R.B., Nagel, J.A., Proctor, R.A. and Cooper, S.L. (1997). Quantitative
comparison of shear-dependent Staphylococcus aureus adhesion to three
polyurethane ionomer analogs with distinct surface properties. Journal of
Biomedical Materials Research. 36, 152–162.
Entis, P. (2007). Food safety: old habits, new perspectives. Washington, DC: ASM
Press.
Food and Drug Administration (FDA). (2004). FDA report on the occurrence of
foodborne illness risk factors in selected institutional foodservice, restaurant,
and retail food store facility types. Available from:
http://www.fda.gov/Food/FoodSafety/RetailFoodProtection/FoodborneIllnessan
dRiskFactorReduction/RetailFoodRiskFactorstudies/ucm089696.htm. Date of
access: 2012/07/03.

75
Frank, J.F., Gillett, R.A.N. and Ware, G.O. (1990). Association of Listeria spp.
contamination in the dairy processing plant environment with the presence of
Staphylococci. Journal of Food Protection. 53, 928–932.
Gerba, C.P. (2009). Environmentally transmitted pathogens. In Environmental
microbiology. 2nd edition. R.M. Maier, I.L. Pepper and C.P. Gerba (Eds).
Burlington: Elsevier, pp. 445–484.
Gilbert, R.J. (1970). Comparison of materials used for cleaning equipment in retail
food premises, and of two methods for the enumeration of bacteria on cleaned
equipment and work surfaces. The Journal of Hygiene. 68, 221–232.
González, R.D., Tamagnini, L.M., Olmos, P.D. and de Sousa, G.B. (2003).
Evaluation of a chromogenic medium for total coliforms and Escherichia coli
determination in ready-to-eat foods. Food Microbiology. 20, 601–604.
Gorman, R., Bloomfield, S. and Adley, C.C. (2002). A study of cross-contamination
of food-borne pathogens in the domestic kitchen in the Republic of Ireland.
International Journal of Food Microbiology. 76, 143–150.
Jackson, L.S., Al-Taher, F.M., Moorman, M., DeVries, J.W., Tippett, R., Swanson,
K.M.J., Fu, T.J., Salter, R., Dunaif, G., Estes, S., Albillos, S. and Gendel, S.M.
(2008). Cleaning and other control and validation strategies to prevent allergen
cross-contact in food-processing operations. Journal of Food Protection. 71,
445–448.
Knechtges, P.L. (2012). Food safety: theory and practice. Burlington: Jones &
Bartlett Learning.
Kure, F.C., Skaar, I. and Brendehaug, J. (2004). Mould contamination in production
of semi-hard cheese. International Journal of Food Microbiology. 93, 41–49.
Lee, M.B. and Greiga, J.D. (2010). A review of gastrointestinal outbreaks in schools:
effective infection control interventions. Journal of School Health. 80, 588–598.
Lues, J.F.R. and van Tonder, I. (2007). The occurrence of indicator bacteria on
hands and aprons of food handlers in the delicatessen sections of a retail
group. Food Control. 18, 326–332.
76
Mbithi, J.N., Springthorpe, V.S., Boulet, J.R. and Sattar, S.A. (1992). Survival of
hepatitis A virus on human hands and its transfer on contact with animate and
inanimate surfaces. Journal of Clinical Microbiology. 30, 757–763.
Meyer, B., Morin, V.N., Rödger, H.-J., Holah, J. and Bird, C. (2010). Do European
standard disinfectant tests truly simulate in-use microbial and organic soiling
conditions on food preparation surfaces? Journal of Applied Microbiology.108,
1344–1351.
Moore, G. and Griffith, C. (2002). A comparison of surface sampling methods for
detecting coliforms on food contact surfaces. Food Microbiology. 19, 65–73.
Mosupye, F.M. and von Holy, A. (2000). Microbiological hazard identification and
exposure assessment of street food vending in Johannesburg, South Africa.
International Journal of Food Microbiology. 61,137–145.
Ness, S.A. (1994). Surface and dermal monitoring for toxic exposures. New York:
John Wiley & Sons, Inc.
Pepper, I.L. and Gerba, C.P. (2009). Cultural methods. In Environmental
microbiology. 2nd edition. R.M. Maier, I.L. Pepper and C.P. Gerba (Eds).
Burlington: Elsevier, pp. 173–189.
Republic of South Africa. (1999). Regulation No. R.918 of 30 July 1999:
Regulations governing general hygiene requirements for food premises and the
transport of food, promulgated under the Health Act, 1977 (Act No. 63 of 1977).
Pretoria: Government Printer.
Samadi, N., Abadian, N., Bakhtiari, D., Fazeli, M.R. and Jamalifar, H. (2009).
Efficacy of detergents and fresh produce disinfectants against microorganisms
associated with mixed raw vegetables. Journal of Food Protection. 72, 1486–
1490.
Scannell, A.G.M. (2012). Overview of foodborne pathogens. In Handbook of food
safety engineering. D. Sun (Ed). Chichester: Wiley-Blackwell, pp. 18–56.
Skowronski, D.M., Janjua, N.Z., De Serres, G., Purych, D., Gilca, V., Scheifele,
D.W., Dionne, M., Sabaiduc, S., Gardy, J.L., Li, G., Bastien, N., Petric, M.,
Boivin, G. and Li, Y. (2012). Cross-reactive and vaccine-induced antibody to an

77
emerging swine-origin variant of influenza A virus subtype H3N2 (H3N2v).
Journal of Infectious Diseases. 206, 1852–1861.
Snyder, O.P. Jr. (2004). HACCP-based fingertip rinse procedure. Food Protection
Trends. 24, 162–165.
Stephan, O., Weisz, N., Vieths, S., Weiser, T., Rabe, B. and Vatterott, W. (2004).
Protein quantification, sandwich ELISA, and real-time PCR used to monitor
industrial cleaning procedures for contamination with peanut and celery
allergens. Journal of AOAC International. 87, 1448–1457.
Stretch, A. and Southgate, H. (1991). Food hygiene, health & safety. England:
Addison Wesley Longman Limited.
Taulo, S., Wetlesen, A., Abrahamsen, R.K., Narvhus, J.A. and Mkakosya, R. (2009).
Quantification and variability of Escherichia coli and Staphylococcus aureus
cross-contamination during serving and consumption of cooked thick porridge
in Lungwena rural households, Malawi. Food Control. 20, 1158–1166.
Zottola, E.A. and Sasahara, K.C. (1994). Microbial biofilms in the food processing
industry – should they be a concern? International Journal of Food
Microbiology. 23, 125–148.

78
CHAPTER 4
FOOD SAFETY KNOWLEDGE, ATTITUDES AND
PRACTICES OF FOOD HANDLERS AND
REPRESENTATIVES OF A SCHOOL FEEDING
PROGRAMME
This chapter has been submitted, partially or in full, for publication in British Food Journal;
ISSN 0007-070X.

79
4.1. ABSTRACT
Training in food safety is an important contributor to the knowledge and practices of
individuals tasked with the management and preparation of foodstuffs. Specific
knowledge with regards to the risks associated with food provision in sensitive
environments, such as where the beneficiaries include the elderly, pregnant,
immunocompromised and young children, is of particular importance. School
feeding schemes resort under this category due to the general under-nourishment of
the pupils as well as the deficiencies of food service infrastructure at these schools.
The purpose of this study was to assess the knowledge, attitudes, and behaviours of
food handlers and representatives involved in the National School Nutrition
Programme (NSNP) in Bloemfontein, central South Africa. This study aimed to
determine whether general food safety principles were applied effectively while
administering the programme in selected schools and was conducted by
administering structured questionnaires, completed via interviews, in a
representative sample of schools which are beneficiaries of the NSNP in the area. A
secondary component of the investigation was to observe and note the actual food-
handling practices of the food handlers in the schools under study. Although the
majority of the participants recognized the essential role that personal hygiene plays
in food safety, the results indicated a general lack of knowledge regarding issues
such as implementing food safety principles. However, the majority of the
respondents reflected a general positive behaviour and attitude relating to food
safety by showing an interest in receiving training. Respondents reportedly adhered
to some food hygiene practices such as regularly washing hands and using separate
boards for raw and cooked foodstuffs. While the respondents may have reported
positive behaviours, these did not always concur with the actual practices observed.
Addressing the situation through food safety training programmes that also focus on
behavioural aspects should address existing shortcomings. Creating food and
personal hygiene awareness amongst the beneficiaries (the children themselves)
should further assist in enhancing the general safety of foodstuffs served through
the NSNP.

80
Keywords: Food safety, knowledge, attitude, National School Nutrition Programme,
training, questionnaire survey
81
4.2. INTRODUCTION
Millions of people worldwide die annually from diarrhoea related diseases with a
considerable proportion of these cases being attributed to consumption of
contaminated food and drinking water (Department of Health, 2009; WHO, 2013). In
South Africa, sizeable numbers of food poisoning cases are reported every year
(Department of Health, 2009). According to Marriott (1989), humans are the leading
sources of food contamination due to not adhering to good hygiene practices.
Therefore, to reduce the cases of food poisoning outbreaks, all individuals who
prepare and serve food should understand how food poisoning arises and can be
prevented (Trickett, 2002). It is further essential that individuals who manage and
serve food operate in a safe and hygienic manner while adhering to a strict personal
hygiene routine (Marotz et al., 1997). Areas of personal hygiene include hands, skin
(cuts, boils, septic spots, grazes, sweat, etc.), hair, ear, nose, mouth and
clothing/protective clothing (Marriott, 1989; Hazelwood and McLean, 1991; Tan et
al., 2013). Other sources of food-borne illnesses include ingesting unwashed foods,
utilizing contaminated cutting boards and knives, and allowing prolonged periods
between cooking and refrigeration. Some causes of food-borne illness may be less
obvious, such as ingestion of raw foods. Although using more unprocessed fruits
and vegetables is encouraged, it is important to be aware of such raw foods which
are likely to cause illness since high cooking temperatures are required to destroy
microorganisms (Marotz et al., 1997).
Studies have indicated that food handlers in food environments often lack
knowledge regarding basic food hygiene (Clayton et al., 2002; Baş et al., 2006) and
that ignorance and carelessness often result in poor hygiene which may have
consequences for both food distributors and consumers (Hazelwood and McLean,
1991). According to Yiannas (2009), inadequate cooking of food and failure to
maintain the cleanliness of hands, protective clothing and preparation surfaces, as
well as failure to take the necessary precautions when injury and illnesses have
occurred, are behavioural aspects which are underlining factors when administering

82
food safety. There is therefore an increasing need for education and awareness
among food handlers regarding safe food handling.
Food safety awareness is particularly important during administration of large-scale
food service operations, such as food aid programmes, food provision at large
events and school feeding schemes. The factors that render these activities
particularly risky include the magnitude of the operation, knowledge of the food
handlers and health statuses of the intended consumers. With regards to the
National School Nutrition Programme (NSNP) in South Africa, volunteer food
handlers are expected to maintain high levels of personal hygiene and hygiene of
the preparation areas (DBE, 2009). Moreover, they are required to attend training
workshops on health and hygienic standards to improve on the quality and safety of
meals. However, previous studies found shortfalls while evaluating the practices,
behaviours and environments associated with the NSNP (Noe, 2005; Manyatsa,
2007). The purpose of this study was therefore to evaluate the food safety
knowledge, attitudes and practices (KAP) of food handlers and NSNP
representatives towards general food safety principles while administering the
programme in schools.
4.3. MATERIALS AND METHODS
A survey in the form of structured interviews was conducted in 20 schools in the
Bloemfontein area of the Free State Province, South Africa. To obtain a
representative sample, the schools were randomly selected from a list of NSNP-
participating schools which resorted under various categories (primary, intermediate,
combined and special schools which were categorised under quintiles 1 to 3 and
were in the rural and urban regions) as assigned by the Department of Basic
Education (DBE). Each interview was completed in the interviewee’s preferred
language with the aid of a structured questionnaire (Appendix 4). This enabled the
interviewer to explain each question so as to avoid misinterpretation. The questions
aimed to determine the perceptions, knowledge, attitudes and behaviours of the
participants with regards to general food safety principles and practices required

83
under the programme. The participants comprised two individuals from each school;
the first was the NSNP representative/committee member allocated at the school
(one of the teachers in the majority of the cases) and the second was a food handler
(a community member selected by the School Governing Body). A total of 40
respondents were thus interviewed. In addition to the interviews, observations of the
actual practices and behaviours of the food handlers were noted in accordance with
the associated questionnaire categories and compared with the findings of similar
studies in the region (Noe, 2005; Manyatsa, 2007).
4.4. RESULTS AND DISCUSSION
4.4.1. Demographic characteristics of participants
Table 4.1 shows that the interviewees were primarily black (92.5%), female (97.5%),
above the age of 30 and had South Sotho as a home language. The majority of the
respondents (65%) were permanently employed by the schools while 22.5% worked
on contract. Fifty percent of the respondents were educators who were also
responsible for administering the NSNP at the schools, while the rest were the food
handlers (data not shown). Approximately 42.5% of the respondents had a tertiary
qualification while 40% and 15% held a secondary and a primary level education,
respectively, whereas 2.5% were uneducated. The majority of the participants
(67.5%) were English proficient while others (27.5%) had a fair understanding of the
language and only 5% had a poor understanding (Table 4.1). In a study by Dworkin
et al. (2011), the authors indicated that non-English speaking persons tended to
have less knowledge of food safety than those who were more fluent in English
since training and information regarding food safety are predominantly conducted
and distributed in English.
As illustrated in Table 4.1, 65% of the participants had been working at the schools
for more than a year and the majority had been part of the NSNP for the same
period as they had been at the schools. Forty-eight percent of the participants had
received additional training, the majority of which was not in food safety. This does

84
Table 4.1. Demographic information of participants from various NSNP-participating
schools in Bloemfontein
Variable Frequency Occurrence (%)
Gender (n = 40) Female 39 97.5 Male 1 2.5
Age (n = 40)
Below 20 0 0
20-30 4 10
31-40 9 22.5
41-50 15 37.5
50 and above 12 30
Race (n = 40)
Black 37 92.5
Coloured 1 2.5
White 2 5
Home language (n = 40)
South Sotho 17 42.5
Tswana 10 25
Xhosa 10 25
Afrikaans 3 7.5
English proficiency (n = 40)
Poor 2 5
Fair 11 27.5
Good 27 67.5
Employment status (n = 40)
Permanent 26 65
Volunteer 5 12.5
Contract 9 22.5
Educational level (n = 40)
None 1 2.5
Primary 6 15
Secondary 16 40
Tertiary 17 42.5
Additional training (n = 39)
Yes 19 48
No 20 51
Period of employment at the school (n = 40)
<3 months 3 7.5
3-6 months 7 17.5
7-12 months 4 10
>12 months 26 65

85
not reflect the requirement of the DBE that food handlers are expected to attend all
training workshops on health and hygienic standards (DBE, 2009).
4.4.2. Personal hygiene behaviours
Table 4.2 shows that 90% of the participants did not have long nails and neither did
they wear jewellery or nail polish while preparing food. Jewellery should not be worn
during food preparation since the skin under the jewellery may not be washed and
dried properly and may harbour bacteria, while parts of the jewellery could drop into
the food (Hobbs and Roberts, 1993). Ninety-eight percent of the participants claimed
to wash their hands several times during the day, 35% washed their hands with
warm water and 7.7% used cold water. Ninety percent of the participants washed
their hands with water and soap only while 10.3% claimed to also use hand
sanitizing liquid (Table 4.2). Additionally, 97.5% of respondents reportedly always
washed their hands before and during food preparation while 2.5% mostly adhered
to this practice (data not shown). These results are in agreement with those
obtained from a study by Tan et al. (2013) during which hand-washing was the most
familiar practice performed by the respondents. Table 4.2 further illustrates that after
washing their hands, 85% of the participants claimed to dry them using a dry cloth.
Although none admitted to practising this, some of the food handlers were witnessed
drying their hands on clothing such as aprons and overalls, which is likely to result in
cross-contamination as ordinary clothing is frequently contaminated with dust and
hair (Trickett, 2002).
Personal hygiene is the most effective manner of achieving food hygiene (Hobbs
and Roberts, 1993; Trickett, 2002; Baş et al, 2006). The hands of food service
employees may be vectors in the spread of food-borne diseases as a result of poor
personal hygiene and cross-contamination. For example, an employee may
contaminate the hands when using the toilet, or bacteria may be spread from raw
meat to a salad by a food handler’s hands (Hayes, 1985; Baş et al., 2006).
Therefore, food-borne illnesses may be transmitted through failure to wash hands
thoroughly (Hayes, 1985; Marotz et al., 1997; Latif et al., 2013). Trickett (2002) and
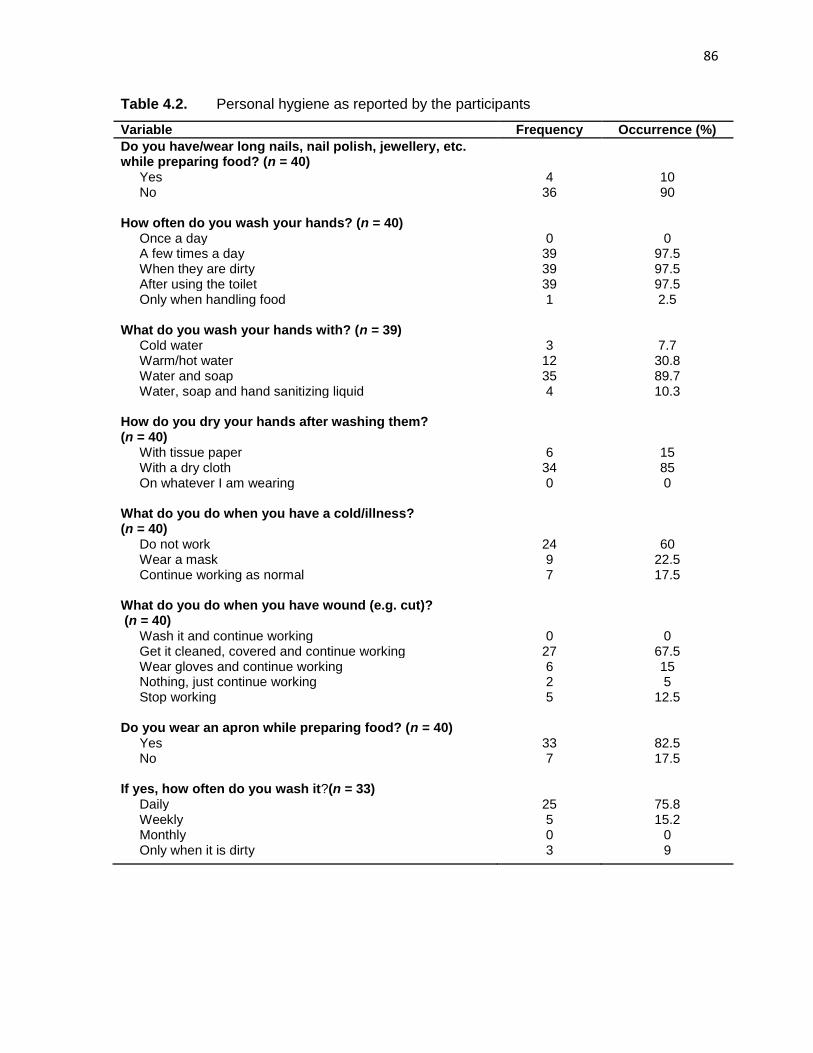
86
Table 4.2. Personal hygiene as reported by the participants
Variable Frequency Occurrence (%)
Do you have/wear long nails, nail polish, jewellery, etc. while preparing food? (n = 40)
Yes 4 10 No 36 90
How often do you wash your hands? (n = 40)
Once a day 0 0 A few times a day 39 97.5 When they are dirty 39 97.5 After using the toilet 39 97.5 Only when handling food 1 2.5
What do you wash your hands with? (n = 39)
Cold water 3 7.7 Warm/hot water 12 30.8 Water and soap 35 89.7 Water, soap and hand sanitizing liquid 4 10.3
How do you dry your hands after washing them? (n = 40)
With tissue paper 6 15 With a dry cloth 34 85 On whatever I am wearing 0 0
What do you do when you have a cold/illness? (n = 40)
Do not work 24 60 Wear a mask 9 22.5 Continue working as normal 7 17.5
What do you do when you have wound (e.g. cut)? (n = 40)
Wash it and continue working 0 0 Get it cleaned, covered and continue working 27 67.5 Wear gloves and continue working 6 15 Nothing, just continue working 2 5 Stop working 5 12.5
Do you wear an apron while preparing food? (n = 40)
Yes 33 82.5 No 7 17.5
If yes, how often do you wash it?(n = 33)
Daily 25 75.8 Weekly 5 15.2 Monthly 0 0 Only when it is dirty 3 9
87
Sharif et al. (2013) identify hands, fingernails, nose, throat and mouth as habitats of
Salmonella spp, Staphylococcus aureus and Shigella spp which may cause illness
upon entering the intestinal tract. These bacteria may be removed and destroyed by
following proper hand-washing processes. The results of a study by Lee and Greiga
(2010) indicated a reduction in the risk of food-borne illness when food handlers
practised effective hand-washing techniques and received food safety training.
Table 4.2 shows that 60% of participants reportedly did not work when they were ill
and 67.5% claimed to treat and cover wounds before progressing with food
preparation. Individuals involved in food preparation and service should be free of
communicable diseases. Those suffering from any communicable diseases should
refrain from handling food. In some countries, those working in licensed child
facilities are required to supply written proof to the school or child care centre that
they are free of tuberculosis (Marotz et al., 1997). Treating and adequate covering of
cuts and wounds with waterproof plasters is essential since even small wounds on
the skin may be sources of S. aureus (Trickett, 2002; Arvanitoyannis and Varzakaz,
2009). Eighty-three percent of participants wore aprons of which 75.8% washed
them daily (Table 4.2). Food handlers should wear clean, washable clothing and
should change aprons frequently as they become dirty. In addition, hair should be
covered with a net while handling food (Marotz et al., 1997); however, this practice
was not observed among food handlers during the current study.
4.4.3. Self-reported behaviours regarding cleaning practices
All participants claimed to always clean surfaces (tables and trays) and equipment
utilized during food preparation and before utilizing them for other food items. Ninety
percent of the participants claimed to clean surfaces before and after preparing food,
and reportedly always used separate utensils and cutting boards during preparation
of raw and cooked food to minimize cross-contamination. Fifty-three percent of the
participants cleaned the surfaces with water and soap while 47% claimed to also
add a disinfectant. Preparation surfaces along with hands are the main vectors for
cross-contamination. Therefore, maintaining food preparation surfaces in a clean
88
and sanitised condition is essential as the majority of food items are prepared on
these surfaces (Hobbs and Roberts, 1993). Although frequent cleaning of the
kitchen reduces microbial contamination, cleaning tools and methods are critical for
effective cleaning (Chen et al., 2011).
4.4.4. Food safety knowledge of participants
As reported in Table 4.3, 40% of the respondents perceived food safety as a
collective responsibility, including farmers, manufacturers/producers, retailers and
consumers, while 57.5% perceived only those who prepare the food as responsible
for ensuring food safety. Each individual that handles food is responsible for
ensuring the hygiene of the food because food safety may be compromised at any
stage during supply, processing, preparation, distribution, serving and consumption
(Kemp, 2012). All respondents recognized the significance of food safety and
although some (40%) believed that food safety is important for nutritional and quality
purposes, the majority (75%) were aware that it is relevant in preventing illnesses by
maintain food free of contaminates which may be pathogenic.
Table 4.3 shows that only 22.5% of the respondents had received training in food
safety, of which 22% had completed a full course in food safety while the remaining
78% had only attended workshops. Table 4.1 indicates that only 48% of
respondents had received training in addition to having academic qualifications.
Ninety percent of the respondents were willing to receive training or further training
in food safety (Table 4.3). The 10% who were not interested in receiving training
were teachers who believed that training would only be applicable to the food
handlers. This response matches the belief of the majority of the respondents
(57.5%) that only individuals who prepare food should be responsible for food
safety. A study by Latif et al. (2013) in relation to food handlers' knowledge revealed
that 7% of the studied sample had unsatisfactory knowledge prior to a food safety
educational program while 95% of the respondents obtained high knowledge scores
post training. Although highly beneficial, training alone is not sufficient in
encouraging daily food safety practices since people do not usually apply their

89
Table 4.3. Knowledge of respondents with regards to general food safety
Variable Frequency (%)
Who, in your opinion, is responsible for food safety?(n = 40)
Everyone (manufacturer to consumer) 16 (40) People who prepare food 23 (57.5) Only the consumer 0 Other (management) 1 (2.5)
In your opinion, why is food safety important? (n = 40)
To prevent illnesses 30 (75) To serve healthy, nutritious meals 16 (40) It is not important 0
Have you had any training in food safety (GMP, GHP and HACCP)?(n = 40)
Yes 9 (22.5) No 31 (77.5)
If yes, what type of training? (n = 9) Full course 2 (22) Workshop(s) 7 (78)
Would you go for training/further training in food safety?(n = 40)
Yes 36 (90) No 4 (10)
Indicate whether you find the following true or false: (n = 40)
True False Not sure
It is important to wash hands before handling food. 40 (100) 0 0
Wiping cloths can spread microorganisms. 32 (80) 4 (10) 4 (10)
The same cutting board can be used for raw and cooked foods provided it looks clean.
9 (22.5) 30 (75) 1 (2.5)
Cooked food does not need to be thoroughly reheated. 20 (50) 16 (40) 4 (10)
Temperature is not related to food safety. 8 (20) 30 (75) 2 (5)
Water quality has no impact on food safety. 4 (10) 36 (90) 0
Raw meat should not be transported in the same bag or container as fresh vegetables and fruit.
37 (92.5) 2 (5) 1 (2.5)
It is best to drink pasteurised milk and juice. 35 (87.5) 4 (10) 1 (2.5)
Person-to-person contact may cause contamination of food.
27 (67.5) 10 (25) 3 (7.5)

90
knowledge (Yiannas, 2009). Regular communication about food safety employing a
variety of media between management and employee may also result in a notable
improvement in attitude and behaviour (Lee and Greiga, 2010).
Table 4.3 further illustrates that 80% of the participants recognized that wiping cloths
may spread microorganisms while 75% recognized that separate cutting boards
should be used for raw and cooked food, or that the boards should be cleaned after
they have been utilized for raw food. The results of a study by Chen et al. (2011)
indicate that tools used for cleaning kitchen surfaces (dishcloths, sponges and dish
pads) tended to be more contaminated than surfaces. Additionally, wash sponges
and dishcloths are some of the items which may be found to be saturated with
bacteria (Chen et al., 2011).
Twenty percent of the respondents perceived temperature conditions as having no
impact on food safety while 75% recognised the relation between temperature and
food safety. Moreover, 88% believed that it is better to consume pasteurised milk
and beverages, which indicates significant awareness of the danger of consumption
of unpasteurised milk and fruit juices. In addition, 50% of the respondents deemed it
unnecessary to thoroughly reheat prepared food prior to serving while 40% believed
that it was necessary to thoroughly reheat cooked food (Table 4.3). Temperature
has an impact on microbial growth since bacteria may remain dormant for long
periods of time in frozen food, but will not survive at high temperatures. Bacteria will
however multiply when the food is thawed and warmed (Kemp, 2012). Literature
further reports that advanced preparation of food is one of the factors that reduce
food poisoning outbreaks (Trickett, 2002). Table 4.3 also indicates that 93% of the
participants were aware that raw meat should not be kept in close proximity to fresh
vegetables and fruit. Intestines of animals often harbour bacteria that cause food
poisoning and as a precaution, raw meat and poultry should be perceived as
contaminated with food poisoning bacteria (Trickett, 2002), thus necessitating
thorough cleaning and cooking methods. Sixty-eight percent of the participants

91
believed that physical contact among people may ultimately result in the
contamination of food.
4.4.5. Attitudes of participants towards food hygiene
An employee with the correct attitude will be more likely to take the correct actions
(Yiannas, 2009). All participants agreed that frequent hand-washing is a necessity
during food preparation and that the cleanliness of kitchen surfaces should be
maintained to reduce the risk of illness (Table 4.4). Table 4.4 further indicates that
the majority of the participants (92.5%) agreed that it is necessary to use separate
knives and cutting boards for raw and cooked foodstuffs while 5% disagreed. Eighty-
five percent of participants agreed that storage practices have an impact on food
safety and 95% agreed that food should appear fresh upon delivery. Food should be
covered or wrapped during transportation and all raw produce should be inspected
for spoilage upon delivery and washed before use (Kemp, 2012). All respondents
agreed that knowledge and training are essential in ensuring food safety (Table 4.4),
whereas some of the teachers (who were also NSNP representatives at the schools)
deemed it unnecessary to participate in the current survey and reasoned that the
questions were not applicable to them since they were only responsible for the
management and not involved in food preparation.
In addition to the questionnaire findings, some of the hurdles that food handlers
faced included: not having proper kitchen facilities, which resulted in the use of
classrooms and shacks to prepare food; kitchens that were not fully equipped and
were not well-planned and easy-to-clean kitchens; water taps being located outside
the kitchen area; not having readily available hot water; and disinfectants and
protective clothing not being provided. Studies previously conducted with regards to
the NSNP included checklists of storerooms and kitchens of the participating
schools. From these checklists, it was concluded that the storerooms and kitchens
were not well designed and maintained according to good storage and processing
practices (Noe, 2005; Manyatsa, 2007). During the present study, no differences
with regards to the infrastructure and resources were observed among various

92
Table 4.4. Respondents’ attitudes towards food safety
Variable (n = 40) Frequency (%)
Evaluate your opinion w.r.t the following by
stating whether you agree or disagree:
Agree Not sure Disagree
Frequent hand washing during food preparation is
necessary.
40 (100) 0 0
Keeping kitchen surfaces clean reduces the risk of
illness.
40 (100) 0 0
Using different knives and cutting boards for raw
and cooked foods is necessary.
37 (92.5) 1 (2.5) 2 (5)
Storage practices have an impact on food safety. 34 (85) 2 (5) 4 (10)
The freshness and appearance of food upon
delivery is important.
38 (95) 0 2 (5)
I think it is important to throw away foods that have
expired.
40 (100) 0 0
Knowledge and training are important in ensuring
food safety.
40 (100) 0 0

93
categories of schools, i.e., the various quintiles and urban and rural schools.
Furthermore, it is noteworthy that despite qualification inequalities, no noticeable
difference was generally observed between NSNP representatives and food
handlers with regards to food safety KAP.
4.5. CONCLUSIONS
According to the data obtained by means of the questionnaires, the attitudes and
self-reported behaviours of the respondents were positive since the majority were
interested in attending training courses. However, the practices with regards to food
safety administration priorities in these schools is a concern since management
deemed it unnecessary to participate in the survey comprising questions regarding
food safety. Moreover, not all management representatives were willing to attend
training courses as they reasoned that they were not involved in the actual
preparation of food. All persons involved in the management and preparation of food
need to go beyond accountability and need to believe in and be committed to food
safety (Yiannas, 2009). Additionally, it is essential that food handlers comprehend
their roles and responsibilities with regards to the children they serve and that their
duties are vital and require skill (Latif et al., 2013). In general, the data suggested
that the respondents were aware of the basic importance of food safety practices
though they may have been unable to adhere to these practices due to
infrastructural challenges. Observations indicated a definite lack of resources in
schools, which increased the difficulty for food handlers in adhering to food safety
procedures.
Food safety education and training are of importance as the knowledge and skill
gained through training influences the perceptions and attitudes towards food safety
which may determine the behaviour and may ultimately result in practising proper
food hygiene. Although food handlers are required by the DBE to attend food safety
training programmes, the majority of the participants who had been employed to
implement the NSNP for several years claimed to have received no, or very little,
training in food safety. This indicates a possible need for implementation and

94
monitoring of safety programmes by the DBE. In order to successfully achieve a
high level of food hygiene, it is essential that the national and provincial
Departments of Basic Education, which are responsible for the overall administration
of the NSNP, and schools’ personnel function in an integrated manner.

95
REFERENCES
Arvanitoyannis, I.S. and Varzakaz, T.H. (2009). Catering in HACCP and ISO
22000: application to foods of animal origin. I.S. Arvanitoyannis (Ed).
Chichester: Wiley-Blackwell, pp. 453–529.
Baş, M., SafakErsun, A. and Kıvanç, G. (2006). The evaluation of food hygiene
knowledge, attitudes, and practices of food handlers in food businesses in
Turkey. Food Control. 17, 317–322.
Chen, F., Godwin, S.L. and Kilonzo-Nthenge, A. (2011). Relationship between
cleaning practices and microbiological contamination in domestic kitchens.
Food Protection Trends. 31, 672–679.
Clayton, D.A., Griffith, C.J., Price, P. and Peters, A.C. (2002). Food handlers’
beliefs and self-reported practices. International Journal of Environmental
Health Research. 12, 25–39.
Department of Basic Education (DBE). (2009). National School Nutrition
Programme: 2008 Annual Report. Pretoria: Government Printers.
Department of Health. (2009). Statistical notes: foodborne illnesses in Mpumalanga
Province. Available from: www.nmc.gov.za/Docs/Food_Poisoning.pdf. Date of
access: 2013/05/17.
Dworkin, M.S., Udompat, P., Panchal, P. and Liu, L. (2011). A comparison of
overall versus duty-specific food poisoning prevention knowledge among
restaurant food handlers. Food Protection Trends. 31, 664–671.
Hayes, P.R. (1985). Food microbiology and hygiene. London: Elsevier Applied
Science Publishers.
Hazelwood, D. and McLean, A.C. (1991). Hygiene: a complete course for food
handlers. London: Hodder & Stoughton.
Hobbs, B.C. and Roberts, D. (1993). Food poisoning and food hygiene. 6th edition.
London: Edward Arnold.
Kemp, R. (2012). Food safety, from farm to folk. Farmlink. 2, 10–13.
Latif, N.A., Elkarmalawy, E.M. and Esmail, G.M. (2013). Impact of food safety
educational program on food handlers' knowledge and practice in Cairo
governorate. Journal of American Science. 9, 429–434.

96
Lee, M.B. and Greiga, J.D. (2010). Review of gastrointestinal outbreaks in schools:
effective infection control interventions. Journal of School Health. 80, 588–598.
Manyatsa, M.J. (2007). The influence of storage on vitamin degradation in fortified
biscuits. M. Tech. Dissertation. Bloemfontein: Central University of Technology.
Marotz, L.R., Cross, M.Z. and Rush, J.M. (1997). Health, safety, and nutrition for the
young child. 4th edition. New York: Delmar Publishers.
Marriott, M.N. (1989). Principles of food sanitation. 2nd edition. New York: Van
Nostrand Reinhold.
Noe, M.H. (2005). The influence of aerosolized microorganisms on the safety and
quality of fortified biscuits. M. Tech. Dissertation. Bloemfontein: Central
University of Technology.
Sharif, L., Obaidat, M.M. and Al-Dalalah, M.R. (2013). Food hygiene knowledge,
attitudes and practices of the food handlers in military hospitals. Food and
Nutrition Sciences. 4, 245–251.
Tan, S.L., Cheng, P.L., Soon, H.K., Ghazali, H. and Mahyudin, N.A. (2013). A
qualitative study on personal hygiene knowledge and practices among food
handlers at selected primary schools in Klang valley area, Selangor, Malaysia.
International Food Research Journal. 20, 71–76.
Trickett, J. (2002). Food hygiene for food handlers. 2nd edition. London: Thomson
Learning.
World Health Organisation (WHO). (2013). Foodborne disease. Available from:
http://www.who.int/foodsafety/foodborne_disease/en/. Date of access:
2013/07/23.
Yiannas, F. (2009). Food safety culture: creating a behavior-based food safety
management system. New York: Springer Science+Business Media, LLC.

97
APPENDICES

98
Appendix 4. KAP of food handlers and NSNP representatives while
administering the National School Nutrition Programme
Name of School: …………………………………………………………………………..
Date of interview: ………………………………………………………………………….
A: INFORMATION OF INTERVIEWEE
1. Gender Female
Male
2. Age Below 20
20-30
31-40
41-50
Above 50
3. Race Black
Coloured
White
Other (specify):......................................................
4. Home language South Sotho
Tswana
Xhosa/Zulu
Afrikaans
Other (Specify):……………………………………….
5. English proficiency Poor
Fair
Good

99
6. Employment status Permanent
Volunteer
Contract
Other (Specify):………………………………………
7. Educational level None
Primary
Secondary
Tertiary
8. Additional Training Yes
No
If yes, specify:.....................................................................................................
9. How long have you been preparing food for the school?
Less than 3 months
3 to 6 months
7 months to 1 year
More than 1 year
B: PERSONAL HYGIENE
10. Do you have/wear long nails, nail polish, jewellery, etc while preparing
food?
Yes
No
Specify:................…………………………………………………………………………….
11. How often do you wash your hands?
Once a day
A few times a day

100
When they are dirty
After using the toilet
Only when handling food
Other (specify):..............................................................................................................
12. What do you wash your hands with? (May select more than one option)
Cold water
Warm/hot water
Water and soap
Water, soap and hand sanitizing liquid
Other (specify):..............................................................................................................
13. How do you dry your hands?
With tissue paper
With a dry cloth
On whatever I am wearing
Other (specify):..............................................................................................................
14. What do you do when you have a cold/illness?
Do not work
Wear a mask
Continue working as normal
Other (specify):..............................................................................................................
15. What do you do when you have wound (e.g. cut)? (May select more than
one option)
Wash it and continue working
Get the cleaned, covered and continue working
Wear gloves and continue working
Nothing, just continue working
Stop working

101
Other (specify):..............................................................................................................
16. Do you wear an apron while preparing food?
Yes
No
If no, explain..................................................................................................................
17. If yes, how often do you wash it?
Daily
Weekly
Monthly
Only when it is dirty
C: CLEANING PRACTICES
18. Do you clean surfaces, cutlery and cookery before and after preparing
each food item?
Yes
No
19. How often do you clean preparation surfaces (tables and boards)
Before preparing food
After preparing food
Before and after preparing food
Other (specify):..............................................................................................................
20. How do you clean preparation surfaces (tables, boards, plates, etc.)?
With only water
With water and suitable soap
With disinfectants
With water, soap and disinfectants
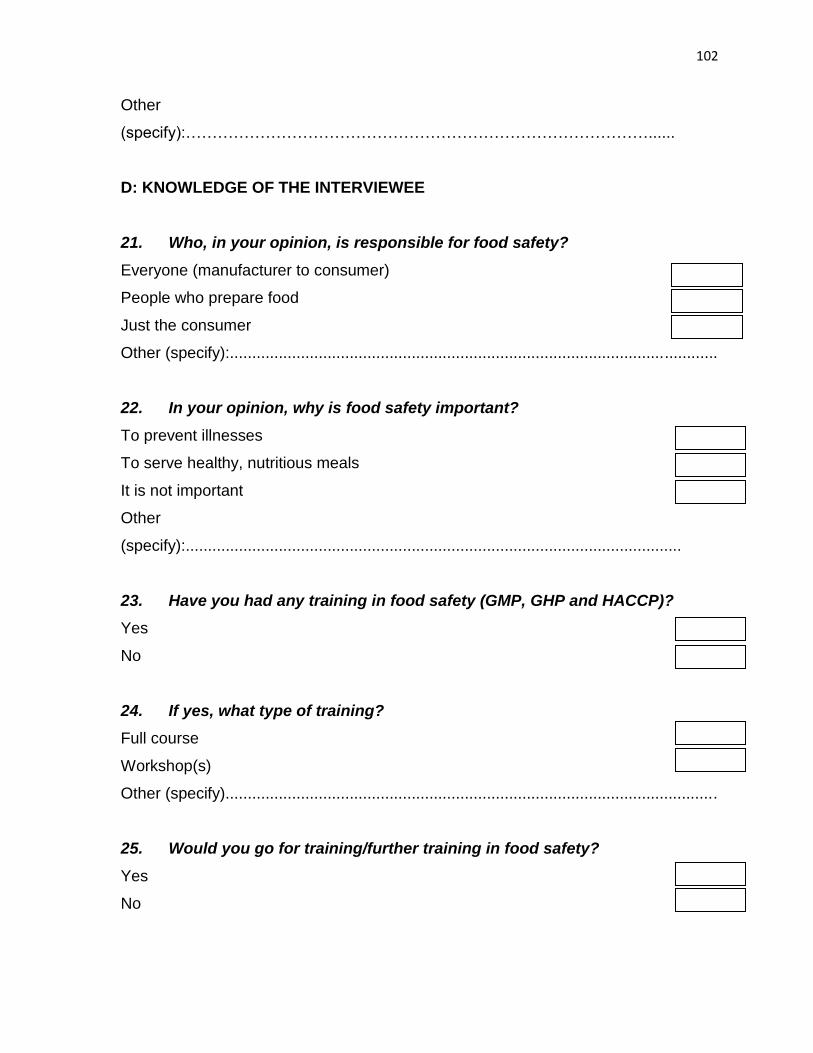
102
Other
(specify):……………………………………………………………………………......
D: KNOWLEDGE OF THE INTERVIEWEE
21. Who, in your opinion, is responsible for food safety?
Everyone (manufacturer to consumer)
People who prepare food
Just the consumer
Other (specify):..............................................................................................................
22. In your opinion, why is food safety important?
To prevent illnesses
To serve healthy, nutritious meals
It is not important
Other
(specify):................................................................................................................
23. Have you had any training in food safety (GMP, GHP and HACCP)?
Yes
No
24. If yes, what type of training?
Full course
Workshop(s)
Other (specify)...............................................................................................................
25. Would you go for training/further training in food safety?
Yes
No

103
26. Indicate whether you find the following true or false:
True False Not sure
It is important to wash hands before handling food.
Wiping cloths can spread microorganisms.
The same cutting board can be used for raw and
cooked foods provided it looks clean.
Cooked food does not need to be thoroughly reheated.
Temperature is not related to food safety.
Water quality has no impact on food safety.
Raw meat should not be transported in the same bag or
container as fresh vegetables and fruit.
It is best to drink pasteurised milk and juice.
Person-to-person contact may cause contamination of food.
27. Where does the food you serve come from? (Supplier e.g. from which
supermarket, farm, etc.)
Supplier
Department of Basic Education
I do not know
28. Who delivers the food to the school?
Personnel from the Department of Basic Education
Comes from supplier
I do not know
Other (specify)...............................................................................................................
29. How is the food delivered to the school?
By truck(s)
By car/van
77

104
Not sure
30. Is the cold chain maintained from supplier to food preparation?
Yes
No
I don’t know
31. How long after delivery is the food prepared?
Within a day
Within a week
Within a month
32. Do you make use of the first-in-first-out principle when preparing food?
Always
Sometimes
Never
Not sure
33. Have you seen any child/children suffer from any of the following
symptoms: nausea, vomiting, diarrhoea, dizziness, abdominal cramping and
fever?
No
Yes
34. If yes, how frequently has it occurred?
Often
Seldom
Other
(specify)…………………………………………………………………………………
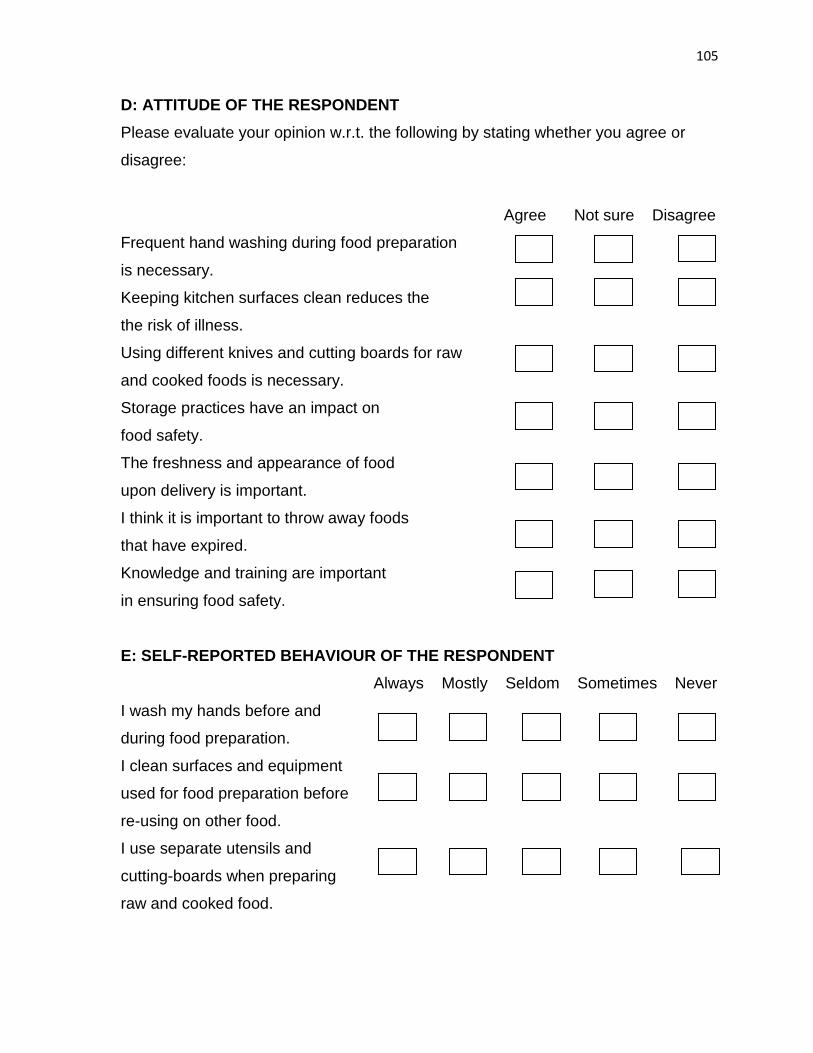
105
D: ATTITUDE OF THE RESPONDENT
Please evaluate your opinion w.r.t. the following by stating whether you agree or
disagree:
Agree Not sure Disagree
Frequent hand washing during food preparation
is necessary.
Keeping kitchen surfaces clean reduces the
the risk of illness.
Using different knives and cutting boards for raw
and cooked foods is necessary.
Storage practices have an impact on
food safety.
The freshness and appearance of food
upon delivery is important.
I think it is important to throw away foods
that have expired.
Knowledge and training are important
in ensuring food safety.
E: SELF-REPORTED BEHAVIOUR OF THE RESPONDENT
Always Mostly Seldom Sometimes Never
I wash my hands before and
during food preparation.
I clean surfaces and equipment
used for food preparation before
re-using on other food.
I use separate utensils and
cutting-boards when preparing
raw and cooked food.

106
After I have cooked a meal,
I store any leftovers in a cool
place within two hours.
I wash fruit and vegetables with
safe water before serving them.

107
CHAPTER 5
CONCLUSIONS

108
5.1. GENERAL CONCLUSIONS
Malnutrition and food-related illnesses are persistent issues in many developing
countries. Reducing under-nutrition may be complicated and might require lengthy
periods to accomplish. However, Wardlaw et al. (2004) state that should swift action
not be taken to curb the effects of malnutrition, projections indicate that on-going
under-nutrition could leave more than 1 billion children with mental impairment by
2020. To overcome nutrient deficiencies, missing nutrients such as zinc may be
restored to children’s diets and improvement in health may be significant (Wardlaw
et al., 2004). Numerous food-aid and fortification programmes are therefore
implemented in various countries to alleviate the consequences of under-nutrition. In
South Africa, the National School Nutrition Programme (NSNP) was established to
supplement the diet of school children across schools with the greatest need. One of
the main objectives of the programme is to encourage learners to attend school and
participate in school activities by alleviating short-term hunger. The safety of the
food served through the NSNP is therefore important so as to assist in reducing
illness and absenteeism amongst pupils. In addition to school feeding programs
being important sources of nutrition, they also provide the opportunity to influence
children’s eating habits in ways that promote life-time health (Clark and Fox, 2009).
Against this backdrop, this study set out to investigate possible inefficiencies in
nutrition and safety of foods served by the NSNP in order to contribute towards
improving the wellbeing of beneficiaries of the programme.
5.2. CONCLUDING REMARKS ON CHAPTERS 2, 3 AND 4
During the nutritional analysis in Chapter 2 of this dissertation, chemical analyses
were conducted to the determine the moisture, total carbohydrates and sugars, total
lipids and fatty acids, protein, vitamins and minerals contents of school meals. The
results were compared against nutrient-based standards set by the United Kingdom
as guidelines for an average school lunch for pupils within the age groups of 7–10
and 11–18 years. The investigation indicated shortcomings in the meals provided at
the schools, particularly in the contents of carbohydrates and energy which were
significantly (P ≤ 0.05) below the standards for both age groups. The protein content

109
of meals met the standard for the majority (90%) of the schools for individuals aged
7–10 years, however only 40% of the school meals met the standard for those ages
11–18 years. The meals did not exceed the maximum standard for lipids with 50% of
the meals containing at least one essential fat and all meals met the required
standards for vitamin C requirements for both age groups. The calcium and zinc
values were significantly (P ≤ 0.05) below the standards for the majority of the
school meals for both age groups, while the iron content met the standards for 80%
and 30% for pupils aged 7–10 and 11–18 years, respectively. Although generally not
significantly deficient, initiatives towards further improving the nutritional quality of
meals served through the programme may prove beneficial to the quality of health of
recipients.
Interventions towards improving the microbiological safety of the foodstuffs may also
contribute toward the quality of the meals served at the schools. The surfaces
sampled during microbial analysis of the present study as reported in Chapter 3
produced colonies that were too numerous to count (over 100 colonies per plate) for
total viable counts of the majority of the surfaces. When compared to the BCCDC
guide, approximately 7% of all surfaces produced unsatisfactory enumeration of S.
aureus and E. coli whereas approximately 10% and 37% of the counts were
unsatisfactory for coliforms and yeast and mould respectively. Of the three surfaces
analysed, preparation surfaces enumerated the highest counts of total coliforms, E.
coli and S. aureus. Aprons yielded the highest counts of yeast and moulds while
hands had the lowest counts. The hands of food handlers yielded lower counts of all
enumerated organisms (total coliforms, E. coli, S. aureus and yeasts and moulds)
than preparation surfaces, therefore the sources of contamination were more likely
to result from the foodstuffs, animals (particularly rodents) in the vicinity of the
preparation area and environmental elements (such as dust) rather than from the
hands of food handlers. The data did not indicate significant difference (P > 0.05)
among counts of the various organisms on surfaces which suggested possible
occurrence of cross-contamination among food contact surfaces and possible

110
shortfalls in the cleaning system such as using contaminated water and minimum
contact time for disinfectants.
Participants who responded to the questionnaire survey (reported in Chapter 4)
were aware of the significance of washing hands before handling food and the
majority of the participants (approximately 98%) reportedly washed their hands
several times during the day with water and detergent. This report was in agreement
with the findings of the microbial analyses during which hands enumerated the low
counts (the majority the counts were < 5 CFU.cm-2 according to the BCCDC guide)
for all detected organisms. To further minimize cross-contamination, the majority of
the participants (53%) reportedly cleaned surfaces with water and detergent while
some (47%) also claimed to add a disinfectant. All participants claimed to maintain
the cleanliness of surfaces and equipment utilized during food preparation.
However, upon conducting the surface microbial analysis, preparation surfaces
yielded counts that were unsatisfactory (when compared to the BCCDC guide) for
the detected organisms. Furthermore, the presence of total coliforms, E. coli and S.
aureus indicated a necessity for improved sanitation practices. In addition,
participants who wore aprons purported to wash their aprons daily; however the
aprons were highly contaminated with yeasts and moulds. Food safety education
and training may prove significant toward improving of the efficiency of the NSNP in
schools because the knowledge and skill gained through training influences the
perceptions and attitudes towards food safety which may determine the behaviour
and may ultimately result in practising proper food hygiene.
In addition, the infrastructural limitations and the lack of resources that were
observed may prove challenging in the preservation of food hygiene and
manufacturing practices. Moreover, these challenges may negatively impact the
maintenance of the optimum quality of the nutritional status of the foodstuffs.
Storage is a contributing factor in food safety and more evidently in the nutritional
quality of food. In order to operate effectively, it therefore has become a necessity to

111
provide additional infrastructure and resources to ensure the safety and nutritional
quality of foodstuffs served to children via the NSNP.
5.3. RECOMMENDATIONS
In developing countries, inadequate practices and surveillance systems persist with
respect to food safety (Department of Health, 2000). According to Moore and
Griffith (2002), preventative risk-based food safety management systems such as
HACCP require that hygiene monitoring should provide results rapidly and in time for
remedial action to regain control of the process and product to be implemented.
Rapid hygiene monitoring kits are available to the food industry and results may be
obtained in a much shorter time (Moore and Griffith, 2002). The detection and
enumeration of indicator organisms, as discussed in Chapter 3 of this dissertation,
are widely used to assess the efficacy of sanitation programmes. The DBE may
incorporate such kits and programmes to render the school cleaning routines more
effective. Additionally, documented food safety management systems and cleaning
schedules may contribute to effective monitoring of cleaning procedures. Therefore,
deficiencies in the correct use of cleaning methods may be identified. Cleaning
practices should be outlined in a cleaning schedule and cleaning records should be
maintained. Although budget constraints might be a limiting factor, the DBE may
also conduct regular microbiological test to assist in the monitoring of sanitation
practices as well as employ the services of pest control companies.
The primary focus should be on the improvement of infrastructure and the expansion
of resources. Storage conditions and practices should also be monitored. The first-
in-first-out principle should be adhered to at all times as prolonged storage of food
may result in the deterioration of nutrients. Furthermore, establishment of cooking
methods which preserve nutrients in food may prove beneficial. Regular training of
all personnel, which is not limited to food handlers, in areas of food safety and
nutrition should be a priority and the DBE should take strong ownership in this
regard.

112
5.4. FUTURE RESEARCH
Pathogenic microorganisms of food items and meals served to children in feeding
schemes such as the NSNP require further investigation. Additionally, determination
of the impact of training on knowledge, attitude and practices (KAP) with regards to
food safety and nutrition is required as well as the effects of storage conditions and
practices on possible microbial growth and the nutritional deterioration of food
should be established. The potential effect of bacterial contamination on the
nutritional quality of foodstuffs should be further investigated. Microbiological and
nutrition analyses of individual food items, before and after preparation, would be
beneficial in providing clarity on optimum nutrition preservation methods during food
preparation. Such analyses will also assist in identifying critical control points.
Conducting a nutrient analysis of school meals using menus for a one-week period
may further assist in identifying areas that require improvement in menu planning.
Numerous studies have been conducted with regards to school feeding schemes,
including the NSNP, and have yielded results similar to those reported in the present
study. However, information regarding the impact of these studies is limited and
strategies should be developed to create awareness and stimulate action in the DBE
and the management at schools.
113
REFERENCES
Clark, M.A. and Fox, M.K. (2009). Nutritional quality of the diets of US public school
children and the role of the school meal programs. Journal of American Diet
Association. 109, S44–S56.
Department of Health, South Africa. (2000). Guidelines for environmental health
officers on the interpretation of microbiological analysis data of food. Pretoria:
Directorate of Food Control, Government Printer.
Moore, G. and Griffith, C. 2002. A comparison of surface sampling methods for
detecting coliforms on food contact surfaces. Food Microbiology. 19, 65–73.
Wardlaw, G.M., Hampl, J.S. and DiSilvestro, R.A. (2004). Perspectives in nutrition.
6th edition. Boston: McGraw-Hill.


