Hygroscopic growth of submicron and supermicronaerosols in the marine boundary layerXiaolu Zhang1, Paola Massoli2, Patricia K. Quinn3, Timothy S. Bates3,4, and Christopher D. Cappa1
1Department of Civil and Environmental Engineering, University of California, Davis, California, USA, 2Aerodyne Research,Billerica, Massachusetts, United States, 3Pacific Marine Environmental Laboratory, National Oceanic and AtmosphericAdministration, Seattle, Washington, USA, 4Now at Joint Institute for the Study of the Atmosphere and Ocean, University ofWashington, Seattle, Washington, USA
Abstract We investigate hygroscopic growth of marine aerosols from three research cruises: Texas AirQuality Study-Gulf of Mexico Atmospheric Composition and Climate Study (TexAQS-GoMACCS) 2006,International Chemistry Experiment in the Arctic Lower Troposphere (ICEALOT) 2008, and California Researchat the Nexus of Air Quality and Climate Change (CalNex) 2010. Particle hygroscopic growth was characterizedby measuring the effect of water uptake under subsaturated conditions on the aerosol light extinction at532 nm. Mie theory calculations were utilized to convert the observed optical growth factors (fext(RH)) intophysical growth factors (GF) at 85% RH. GF is found to be a more robust measure of aerosol hygroscopicgrowth than fext(RH), which can be biased by changes in aerosol dry size. Consistent with previous observations,the overall GF(85%) for submicron aerosol depended on the fraction of organics. The submicron GFOM(85%)specifically was found to range from1.0 to 1.3 for all three campaigns. A robust positive linear dependence of theoverall supermicron GF(85%) on the mass fraction of sea salt was observed. During TexAQS, two types of dustparticles with distinct hygroscopic properties were identified in the supermicronmode; one that originated fromthe Sahara desert was moderately hygroscopic (GFdust(85%)=~1.4) and the other from continental sourceswas nearly hydrophobic. The GF(85%) of supermicron organics was estimated through hygroscopicity closurecalculations. Supermicron organics that originated from marine sources were found to be substantially morehygroscopic than those from continental sources, with the latter having a GF(85%) similar to that of thesubmicron organics. This study demonstrates the potential of using aerosol optical measurements toretrieve hygroscopic growth factor and underlines the importance and need for future investigations onthe hygroscopic properties of marine supermicron aerosols.
1. Introduction
Atmospheric aerosols affect Earth’s radiative balance and climate directly through absorption and scattering ofthe incoming solar radiation and indirectly through modification of cloud properties [IntergovernmentalPanel on Climate Change, 2007]. Hygroscopicity, which characterizes the ability of aerosols to take up waterunder subsaturated and supersaturated conditions, is a key parameter determining both the direct and indirectclimate effects of aerosols. It is well known that the hygroscopic growth of soluble particles can be described bythe Köhler theory [Köhler, 1921, 1936]. Nonetheless, it remains challenging to characterize the hygroscopicbehaviors of the dynamic and complex atmospheric aerosol consisting of particles with a wide range of sizesand chemical composition. As such, it is not surprising that representations of aerosol hygroscopicity incurrent atmospheric chemistry, and climate models are highly simplified and uncertain [Malm and Kreidenweis,1997; Kinne et al., 2003; Ghan et al., 2012]. Numerous efforts have been made to develop instruments andtechniques that quantitatively determine atmospheric aerosol hygroscopicity in situ. These measurementscombined with chemical speciation data provide direct observational constraints for improving modelparameterizations of hygroscopic properties of atmospheric aerosols.
Hygroscopic growth under subsaturated condition can be described by the hygroscopic growth factor (GF),which is the ratio of equilibrium particle diameters (Dp) under dry and wet conditions:
GF RHð Þ ¼ Dp;wet
Dp;dry(1)
In principle, GF can be derived from the detected changes in particle size, mass, or optical properties due towater uptake. Instruments for direct quantification of GF based on particle sizemeasurements (direct or inferred
Citation:Zhang, X., P. Massoli, P. K. Quinn,T. S. Bates, and C. D. Cappa (2014),Hygroscopic growth of submicronand supermicron aerosols in the marineboundary layer, J. Geophys. Res. Atmos.,119, 8384–8399, doi:10.1002/2013JD021213.
Received 19 NOV 2013Accepted 5 JUN 2014Accepted article online 10 JUN 2014Published online 14 JUL 2014
from light scattering), such as the Hygroscopicity Tandem Differential Mobility Analyzer (H-TDMA) [Liu et al.,1978; Rader and McMurry, 1986] and the Differential Aerosol Sizing and Hygroscopicity Spectrometer Probe(DASH-SP) [Hersey et al., 2009; Sorooshian et al., 2008], have been deployed to determine subsaturated aerosolhygroscopic growth in a wide range of atmospheric environments. The link between submicron aerosol GFand chemical composition has been extensively studied [e.g., Gysel et al., 2007; Hersey et al., 2009; Cerully et al.,2011; Duplissy et al., 2011; Stock et al., 2011; Hersey et al., 2013;Wu et al., 2013]. However, an important limitationof these techniques is that they are only applicable for small particles due to the restriction of particle sizerange by the Differential Mobility Analyzers (typically dry diameter< 300nm for high relative humidity (RH)conditions). GF measurements of larger (e.g., coarse) particles require different techniques and are sparse in theliterature [Hitzenberger et al., 1997; Hegg et al., 2006, 2008; Stock et al., 2011].
Besides these techniques for direct measurement of GF, an optical approach that involves measurements ofaerosol light extinction (or scattering) at dry and humidified conditions has also been utilized to characterizethe impact of particle water uptake on optical properties [e.g., McInnes et al., 1998]. The ratio between theextinction coefficients (bext) of the humidified and dried aerosols is defined as the optical growth factor, oftenreferred to as fext(RH):
f ext RHð Þ ¼ bext;wetbext;dry
(2)
Since this optical approach does not require the direct measurement of wet particle diameter, it is in principleapplicable for a wider range of particle sizes. Some studies have further converted fext(RH) to an approximatelyRH-independent single-parameter, γext, which represents a presumed power law continuous growth ofaerosol light extinction as the RH approaches 100% [Gassó et al., 2000;Quinn et al., 2005; Kim et al., 2006;Massoliet al., 2009]. f(RH) and γext have been extensively characterized in field and laboratory studies in which thedependence of f(RH) and γext on aerosol chemical composition have been investigated [Carrico et al., 2003;Malm and Day, 2001; Malm et al., 2003; Quinn et al., 2005, 2006; Wang et al., 2007; Ziemba et al., 2013; Zhanget al., 1994]. For example, fext(RH) and γext were both found to exhibit a negative correlation with the massfraction of particulate organic matter (POM) in submicron aerosols sampled during New England Air QualityStudy (NEAQS) 2004 [Quinn et al., 2006] and Texas Air Quality Study-Gulf of Mexico Atmospheric Compositionand Climate Study (TexAQS-GoMACCS) 2006 [Massoli et al., 2009], respectively.
In more recent studies, an optically weighted hygroscopic GF was retrieved from the measured fext(RH) forlaboratory-generated aerosols [Cappa et al., 2011; Flores et al., 2012; Prather et al., 2013]. This inverse approach,based on Mie theory under the assumption of spherical particles, takes into account the changes in both thephysical size and the refractive index of aerosols due to water uptake. Compared to fext(RH) and γext, theoptically weighted GF is more straightforwardly linked to model parameterizations. It should be noted thatalmost all these previous applications of the optical hygroscopic growth measurement techniques have onlyinvestigated submicron particles, although the method does allow for the extension to larger size ranges.
In this work, fext(RH) measurements and complementary aerosol chemical composition data for PM1 and PM10
aerosols from three research cruises are analyzed. The algorithm developed by Cappa et al. [2011] has beenused for the first time to retrieve hygroscopic GF from fext(RH) for both submicron and supermicron aerosolscollected in coastal andmarine boundary layer atmospheres during these cruise campaigns. Variations in GF for arelatively wide range of chemical composition sampled in different regions are examined. In particular, theresults on the hygroscopic properties of supermicron aerosols, for which in situ observational studies are scarceand in need, are highlighted. Results from this study will be a valuable addition to the understanding ofhygroscopicity of marine aerosols, especially in the supermicron range, and provide observational constraintsfor the representation of marine aerosol hygroscopic growth in climate models.
2. Methods2.1. Field Campaigns
The data sets analyzed in this study were collected from three NOAA sponsored research cruises (data availablefor download at http://saga.pmel.noaa.gov/data/). A map that shows the cruise tracks is presented in Figure S1in the supporting information. The TexAQS-GoMACCS (Texas Air Quality Study-Gulf of Mexico AtmosphericComposition and Climate Study) took place during the period of 27 July to 11 September 2006 near the Texas
Journal of Geophysical Research: Atmospheres 10.1002/2013JD021213
Gulf coastal region, with the goals of better understanding the sources, atmospheric processes, and radiativeproperties of aerosols over the Gulf of Mexico [Bates et al., 2008]. Aerosol optical and chemical compositionmeasurements were made on board the NOAA R/V Ronald H. Brown. The ICEALOT (International ChemistryExperiment in the Arctic Lower Troposphere) campaign was conducted in the spring of 2008 (19 March to 24April 2008) to characterize the sources and distribution of gas and aerosol phase pollutants within the Arcticmarine boundary layer. Measurements used in this study were made aboard the Woods Hole OceanographicInstitute (WHOI) R/V Knorr, most of the time cruising in an ice-free region of the Arctic during the campaign[Frossard et al., 2011]. The CalNex (California Research at the Nexus of Air Quality and Climate Change)campaign, conducted in the spring-summer time of 2010, was a multiplatform field study that aimed tounderstand the interactions between regional air quality and climate change issues [Ryerson et al., 2013].As part of CalNex, aerosol measurements were made aboard the WHOI R/V Atlantis along the Californiacoast from mid-May to mid-June 2010. A large fraction of the data were collected near the Los Angelescoastal region sampling air masses influenced by urban and ship emissions.
During these cruises, aerosol particles were sampled ~18m above the sea surface through a ~5m tall inletmast. The inlet nozzle was designed to rotate with wind to maintain a nominally isokinetic flow and tominimize the loss of supermicron particles. The lower part of the mast was moderately heated so that thesampled air was maintained at <25% relative humidity (RH) during ICEALOT and <60% RH during TexAQSand CalNex. The sampled aerosols were directed to a variety of instruments and impactors via 1.9 cmdiameter stainless steel or conductive polyethylene tubes that extended into the heated zone of the inlet.Further details about the sampling mast were provided by Bates et al. [2002].
2.2. Measurements2.2.1. CRD-AES Light Extinction and fext(RH)Aerosol extinction (bext) and subsaturated hygroscopic growth fext(RH) measurements were made with a cavityring-down aerosol extinction spectrometer (CRD-AES) similar to that described in Langridge et al. [2011]. Anautomated valve was placed upstream of the CRD-AES to switch the sample flow between two Berner-typeimpactors [Berner et al., 1979] to select either sub-10 μm (PM10) or sub-1 μm particles (PM1). Extinction dueto supermicron particles (PMsuper) was determined by taking the difference between the observed bext(PM10)and the average bext(PM1) as measured just prior to and just after the PM10 measurement. The CRD-AES usedduring the three campaigns had four channels operating at 532 nm, one channel at 355 nm, and one at1064nm. The effect of water uptake on the light extinction was measured by operating one of the 532nmchannels under dry RH (<30%) with a Nafion diffusion dryer (Perma Pure) and two of the 532nm channels at anelevated RH (i.e., 75% and 85%) with custom-built humidifiers. The RHs in the cavity were monitored usingcalibrated RH and temperature probes (Rotronic Inc.). The fourth 532nm channel was dried and filtered todetermine the interference from gas-phase species to the observed signal. The particle loss in the Nafion dryerwas estimated to be ~10%. The accuracy of the RH measurement is ±2%. Not counting particle losses, theuncertainty is estimated to bewithin ±3% for the PM1 and PM10 CRD extinctionmeasurements. The uncertaintyin the derived supermicron particle extinction depends on the PM10/PM1 extinction ratio. As this ratio increases,the uncertainty in supermicron extinction decreases. For a PM10/PM1 extinction ratio >1.25, the propagateduncertainty in supermicron extinction is <20%.
The fext(RH) was calculated using the measured 532 nm aerosol extinction coefficients (bext) at dry(RH< 30%) and humidified (RH = 75%~ 90%) conditions (equation (2)). Because the RHs for the humidifiedcells were not actively controlled, and thus exhibited some fluctuations in time, a dimensionless, RH-independent parameter, γext, was obtained by combining the three CRD 532 nm extinction measurementsat dry and elevated RH:
γextlog�f ext RHð Þ�
log 100� RHdry� �
= 100� RHð Þ� � (3)
where in our study RHdry is 25%. Using equation (3), fext(RH) at exactly 85% RH was determined to facilitatecomparison between different time periods and to further allow for retrieval of the optically weighted GF at85% RH (detailed in section 3). The uncertainty of the derived fext(85%) for submicron particles is largelydetermined by the accuracy of the RH measurement. A ± 2% error in RH measurement translates to anuncertainty of ±7% in fext(85%) for a typical γext value of 0.5.
Journal of Geophysical Research: Atmospheres 10.1002/2013JD021213
It is possible that particle losses between the humidifier and humidified channels were increased relativeto the dry channel due to the increase in particle aerodynamic diameter with water uptake, with such aneffect being most important for the supermicron particles. Loss of semivolatile aerosol components (i.e.,ammonium nitrate) upon inlet heating during TexAQS and CalNexmay have also occurred. Such losses wouldlead to a low bias in the observed fext(RH) and derived GF, and thus, the reported GFs are lower limits.However, as will be shown below, the magnitude of the derived GFs from CalNex and TexAQS when the sea-salt fraction is large suggests that the supermicron GFs are not substantially underestimated. The fext(RH)data for supermicron particles from ICEALOT were discarded due to additional biases introduced by thedifferent conditions under which the measurements were made. The ambient temperature in ICEALOT (oftennear or below the freezing point) was substantially lower than the indoor temperature, while for both TexAQSand CalNex the indoor temperature was much more similar to the outdoor temperature. As a result, thesampled particles were effectively dried during ICEALOT from warming, while the sampling line RH duringTexAQS and CalNex was close to ambient RH. When sampling PM10, we suspect that the residence timein the CRD-AES humidifier during ICEALOT was insufficient to allow for sufficient water uptake given the largeabsolute amount of water required and the small starting RH. For PM1, much less water needed to betransferred to the particles, and it is believed that the particles were able to reach equilibrium. Comparison ofthe fext(RH) data for PM1 to similar data collected during ICEALOT for particle scattering (i.e., fsca(RH)) indicatesthat there is no substantial bias in the submicron fext(RH) observations.2.2.2. Aerosol Chemical CompositionTime series concentrations of nonrefractory (NR) submicron aerosol NH4
+, NO3�, SO4
2�, and particulateorganic matter (POM) were determined with a Quadrupole Aerosol Mass Spectrometer (Q-AMS) (AerodyneResearch Inc.) [Jayne et al., 2000; Allan et al., 2003] sampling downstream of a PM1 impactor. The collectionefficiency of the AMS varied from 0.54 to 1, dependent upon aerosol chemical composition, and thereforewas assigned to each 5 min sample based on AMS ammonium to sulfate molar ratio. The overallmeasurement uncertainty was estimated to be 20%. Further details about the Q-AMS operation andcalibration are reported by Bates et al. [2008].
PM1 and PM10 particles (50% aerodynamic cutoff diameters) were collected using multijet cascade impactors[Berner et al., 1979] with sampling times ranging from 2 to 23 h. The total number of impactor sampleswas 107, 52, and 49 for TexAQS, ICEALOT, and CalNex, respectively. The collected particles were analyzedoffline for organic carbon (OC), elemental carbon (EC), trace elements, inorganic ions, and particle mass [Bateset al., 2008]. Two-stage and one-stage impactors were used to collect PM1 and PM10 particles for OC/ECanalysis, respectively. A denuder was deployed upstream of the submicron impactor to minimizeinterference from gas-phase organic species. OC and EC concentrations were determined with a SunsetLaboratory OC/EC analyzer following the National Institute for Occupational Safety and Health (NIOSH) [1996]protocol. The difference in concentrations between the two impactors was attributed to supermicronparticles with aerodynamic diameter between 1 and 10μm. Submicron organic aerosol mass (OM) wasdetermined using the Q-AMS measurements. Supermicron OM was determined by multiplying the impactorOC concentration by a constant factor of 2.0 [Turpin and Lim, 2001; Bates et al., 2008]. The uncertainty of theimpactor OC was estimated to be ±13% for OC and ±33% for supermicron OM (including ±31% uncertaintyassociated with the OM/OC ratio) [Bates et al., 2008]. Seven-stage impactors were used for inorganic ionanalysis. The four smaller stages were combined to get submicron concentrations, and the three largerstages were combined to get supermicron concentrations. Cation (Na+, NH4
+, K+, Mg2+, and Ca2+) andanion (Cl�, NO3
�, and SO42�) concentrations were quantified using ion chromatography. Measurement
uncertainty of the water-soluble ions was estimated to be ±8.5%. Sea-salt (SS) aerosol mass concentration(μgm�3) was calculated as follows:
SS½ � ¼ Cl�½ � þ Naþ½ ��1:47 (4)
Concentrations of trace elements (Na, Mg, Al, Si, P, Cl, K, Ca, Ti, V, Cr, Mn, Fe, Ni, Cu, Zn, Ba, As, and Pb) weredetermined using thin-film X-ray primary and secondary emission spectrometry [Bates et al., 2004]. Theinorganic oxidized material (IOM) that was mainly composed of dust, and/or fly ash was constructed basedon elemental data as follows:
[Malm et al., 1994]. The average overalluncertainty in the IOMmass was ±12%[Bates et al., 2008]. In the followinganalysis and discussion, IOM is used asa surrogate of the dust component insubmicron and supermicron particles.2.2.3. Particle NumberSize DistributionsParticle number size distributions in thediameter range of 20–800nm Stokesdiameter weremeasured by combiningan “Aitken” Differential Mobility ParticleSizer (DMPS) (20–200 nm) andan “accumulation” DMPS (200–800nm).The number size distributions ofparticles in the diameter range of0.8–10 μm aerodynamic diameterwere determined with an AerodynamicParticle Sizer (APS). The two sizedistributions were merged byconverting the APS data fromaerodynamic diameters to Stokesdiameters using particle densities
calculated from measured aerosol chemical composition [Bates et al., 2008]. The use of Stokes diametersover aerodynamic diameters is more appropriate for optical calculations as they represent the physicalsize of the particle under the assumption of spherical particles. The APS data adjustment also accountedfor nonspherical particle shape [Quinn et al., 2004]. The estimated uncertainty in the number concentrationin each size bin was ±10%.
All of the size measurements were made at the inlet mast RH (<25% for ICEALOT and <60% for TexAQS andCalNex), whereas the “dry” optical property measurements were made at ~25% RH. If the particles retainwater at 60% RH, the measured particle size would be overestimated relative to the optical propertymeasurements. This would influence the ability to obtain absolute optical closure but has only a smallinfluence on the conversion of fext(RH) to GF(85%), as illustrated through sensitivity tests shown in Figure S2.
3. Derivation of Hygroscopic GF
Following Cappa et al. [2011], an iterative algorithm, illustrated in Figure 1, was applied to retrieve GF at 85%RH using measured fext(85%) and dry particle size distribution for both submicron and supermicron data sets.Specifically, bext,532nm values were calculated using Mie theory for both the dry particle size distribution andfor a humidified (at 85% RH) particle size distribution [Bohren and Huffman, 1983]. The ratio between thediameters of the humidified particles and the dried particles correspond to GF(85%). The value of GF(85%)that corresponds to the observed fext(85%) was determined by increasing the GF(85%) from some initialguess value (typically GF = 1.0) in steps of 0.005 until the calculated fext(85%) agreed with the observed fext(85%) to within ±1%. The algorithm returns a null value for GF if the derived GF(85%) was unrealistically high(i.e., GF> 2.1). This was done separately for submicron and supermicron particles to determine values ofGFsub and GFsuper at 85% RH, respectively. The temporal resolution of the retrieved GF(85%) is 10min, basedon the alternating sampling of PM1 and PM10. GFsuper(85%) data were averaged to the impactor samplingperiods (2–23 h) for further analysis. There is generally good agreement between the observed andcalculated bext,532nm for both submicron and supermicron particles (Figure S3), which suggests that theassumption of spherical particles in the Mie calculations is reasonable.
Values of several parameters used in this process need to be estimated prior to the GF derivation. For instance,the real part (n) of the dry particle refractive index (RIdry) was assumed to be 1.50 based on measuredaerosol chemical composition. The imaginary part (k) of RIdry was set to scale with the black carbon (BC)
Figure 1. Schematic representation of the iterative algorithm for retrievingthe hygroscopic growth factor (GF) at 85% RH from the fext(RH) measurement.
Journal of Geophysical Research: Atmospheres 10.1002/2013JD021213
concentrations inferred from measured lightabsorption at 532nm using a photoacousticspectrometer, under the assumption thatorganics are nonabsorbing at 532 nm [Lambeet al., 2013]. The wet particle refractive index(RIwet) was determined using volumemixing rulesassuming RIwater = 1.33. A particle Stokesdiameter of 684.2 nm (Dp,cut) was used toseparate submicron and supermicron dry particlenumber size distributions. The use of 684.2 nm,as opposed to 1μm, is appropriate since thecutoff size of the impactors was aerodynamicdiameter and the particle density was mostlikely >1g cm�3. This particular value wasdetermined by minimizing the differencebetween calculated and measured dry particlebext,532nm for both submicron and supermicronparticles, which was generally within 15%. Themodel also assumes that the particle chemicalcomposition is size independent within a given
mode (submicron versus supermicron) and that all particle components are internally well mixed. To estimatethe uncertainty of the retrieved GF(85%) introduced by the various model assumptions and from themeasurement uncertainties of fext(85%) (±7%) and particle number concentration (±10%), a series of sensitivitytests have been performed, the results from which are summarized in Figures S4 and S5. It was found that GF(85%) was relatively insensitive to the changes in RI and Dp,cut. For example, varying the Dp,cut by 22%(equivalent to ±150nm in Stokes diameter) only introduced on average 2.5% change in the calculated GF foreither submicron or supermicron particles, although it does have a substantial impact on the calculatedabsolute bext,532nm. The estimated uncertainty in the overall submicron and supermicron GF(85%) resultingfrom measurement uncertainties associated with fext(85%) was ±4% and ±18%.
4. Results and Discussions4.1. The fext(RH) and GF for Submicron and Supermicron Aerosols
The fext(RH) (and γext) depends on both dry aerosol size and the water content of the particle, with only thelatter being associated with particle hygroscopic properties. As shown in Figure 2, in the submicron sizerange smaller particles will theoretically exhibit much larger fext(RH) values for a given GF (in this case GF = 1.5or 2.0). The sensitivity of fext(RH) to size is much reduced in the supermicron range. Therefore, in theory, fext(RH)values provide only an approximate measure of particle hygroscopic growth as they are subject to variations inthe particle dry size distribution, especially for submicron particles. The example shown in Figure 2 useslognormally distributed particles (σ =1.5) to illustrate the point. A distribution of atmospheric aerosols willexhibit overall smaller sensitivities to variations in particle size, as is indicated by the general insensitivity in thederived GF(85%) values to small errors in particle size discussed above. However, in comparing betweendifferent campaigns, where the nature of the observed size distributions may be quite different, conversion ofthe observed fext(RH) values to equivalent optically weighted GF values should provide a more robustquantitative measure of hygroscopic growth since variations in dry particle size are inherently accounted for inthe inversion process.
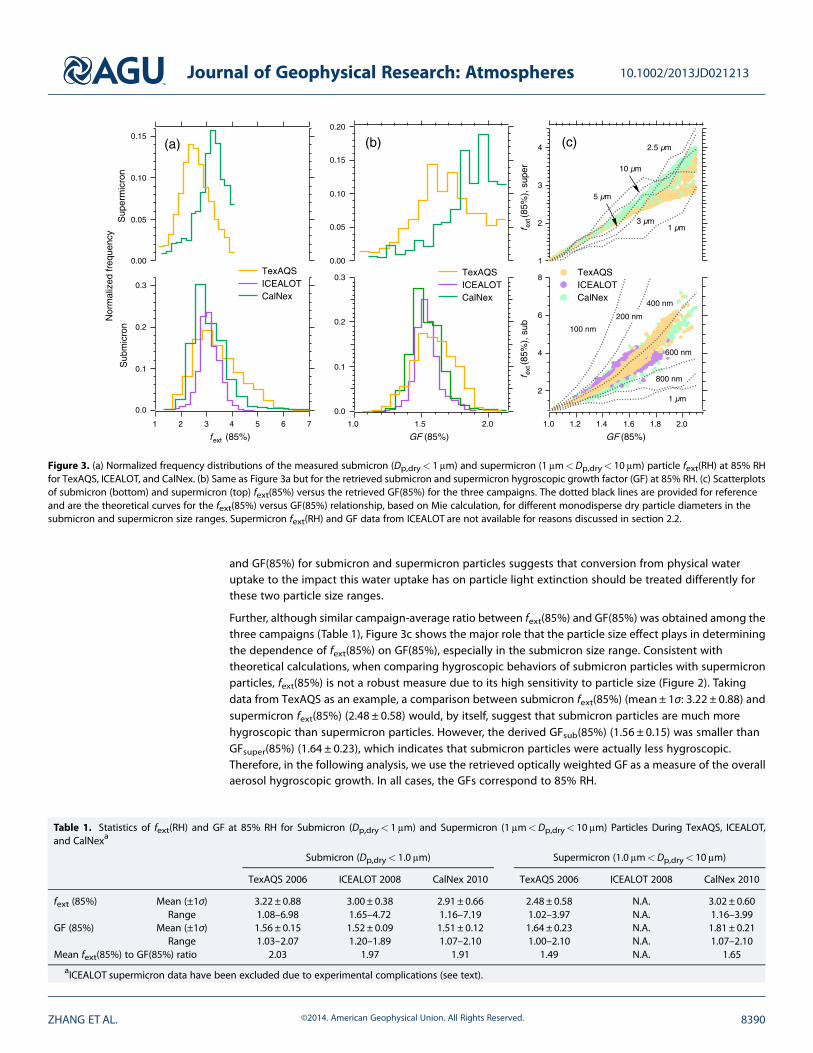
Normalized frequency distributions of fext(85%) and GF(85%) for the three campaigns are shown inFigures 3a and 3b, respectively. For submicron aerosols, fext(85%) and GF(85%) exhibited similardistribution patterns and were in general proportional to each other with a relatively constant campaign-average ratio between fext(85%) and GF(85%) that ranged from 1.91 to 2.03 (Table 1). For supermicronaerosols, the fext(85%) to GF(85%) ratio was also similar for TexAQS and CalNex (1.49 and 1.65, respectively),but the distributions of GF(85%) are much broader than fext(85%). The distinct ratio between fext(85%)
Figure 2. Variations in fext(RH) at 532 nm as a function of dryparticle diameter (nm) for a constant growth factor of 1.5 or2.0. fext(RH) is calculated based on Mie theory for lognormallydistributed particles (σ=1.5).
Journal of Geophysical Research: Atmospheres 10.1002/2013JD021213
and GF(85%) for submicron and supermicron particles suggests that conversion from physical wateruptake to the impact this water uptake has on particle light extinction should be treated differently forthese two particle size ranges.
Further, although similar campaign-average ratio between fext(85%) and GF(85%) was obtained among thethree campaigns (Table 1), Figure 3c shows the major role that the particle size effect plays in determiningthe dependence of fext(85%) on GF(85%), especially in the submicron size range. Consistent withtheoretical calculations, when comparing hygroscopic behaviors of submicron particles with supermicronparticles, fext(85%) is not a robust measure due to its high sensitivity to particle size (Figure 2). Takingdata from TexAQS as an example, a comparison between submicron fext(85%) (mean ± 1σ: 3.22 ± 0.88) andsupermicron fext(85%) (2.48 ± 0.58) would, by itself, suggest that submicron particles are much morehygroscopic than supermicron particles. However, the derived GFsub(85%) (1.56 ± 0.15) was smaller thanGFsuper(85%) (1.64 ± 0.23), which indicates that submicron particles were actually less hygroscopic.Therefore, in the following analysis, we use the retrieved optically weighted GF as a measure of the overallaerosol hygroscopic growth. In all cases, the GFs correspond to 85% RH.
Figure 3. (a) Normalized frequency distributions of the measured submicron (Dp,dry< 1μm) and supermicron (1μm<Dp,dry< 10μm) particle fext(RH) at 85% RHfor TexAQS, ICEALOT, and CalNex. (b) Same as Figure 3a but for the retrieved submicron and supermicron hygroscopic growth factor (GF) at 85% RH. (c) Scatterplotsof submicron (bottom) and supermicron (top) fext(85%) versus the retrieved GF(85%) for the three campaigns. The dotted black lines are provided for referenceand are the theoretical curves for the fext(85%) versus GF(85%) relationship, based on Mie calculation, for different monodisperse dry particle diameters in thesubmicron and supermicron size ranges. Supermicron fext(RH) and GF data from ICEALOT are not available for reasons discussed in section 2.2.
Table 1. Statistics of fext(RH) and GF at 85% RH for Submicron (Dp,dry< 1μm) and Supermicron (1μm<Dp,dry< 10μm) Particles During TexAQS, ICEALOT,and CalNexa
It is instructive to compare GF(85%) valuesamong the campaigns and with thosereported by previous studies. GFsub(85%)showed similar distributions for the threecampaigns, with ICEALOT GFsub(85%)having a slightly narrower range,indicating less variability in the hygroscopicbehaviors of submicron particles in theArctic marine boundary layer than in urbancoastal marine regions. This is consistentwith the reasonably constant submicronparticle composition observed duringICEALOT [Frossard et al., 2011]. For CalNex,the mean GFsub of 1.51 is comparableto the GF(85%) range of 1.45–1.72 for150–200 nm particles measured with aDASH-SP off the coast of Central Californiaduring MASE-II [Hersey et al., 2009]. TheGFsuper(85%) distributions were muchbroader and had larger mean values thanGFsub(85%) for both TexAQS and CalNex(Figure 3 and Table 1). Values of GFsuper(85%)~2.0 were observed in both regions.(For reference, the GF(85%) for NaCl, theprimary inorganic component of seaspray, is ~2.1.) These results indicate that,in general, supermicron particles are morehygroscopic than submicron particles inthese marine boundary layers. However,in contrast to the generally largeGFsuper(85%) distributions observed inthis study, Hegg et al. [2006, 2008] reporteddescriptive hygroscopic GF (DHGF) valuesof only ~1.1–1.3 for 1–3.5μm particles
measured using an Aerosol Hydration Spectrometer on board the Center for Interdisciplinary Remotely-PilotedAircraft Studies (CIRPAS) Twin Otter aircraft sampling at 30–500m above sea level off theMonterey Bay, California.They typically observed lower values at 30m altitude compared to 250m and attributed the relatively lowsupermicron DHGF values to either inhibition of hygroscopic growth due to the presence of fatty acids or tothe substantial presence of dust particles. In the next section, we examine in detail the relationship betweenGF and chemical composition for submicron and supermicron aerosols during the three campaigns.
4.2. Hygroscopic Growth and Chemical Composition
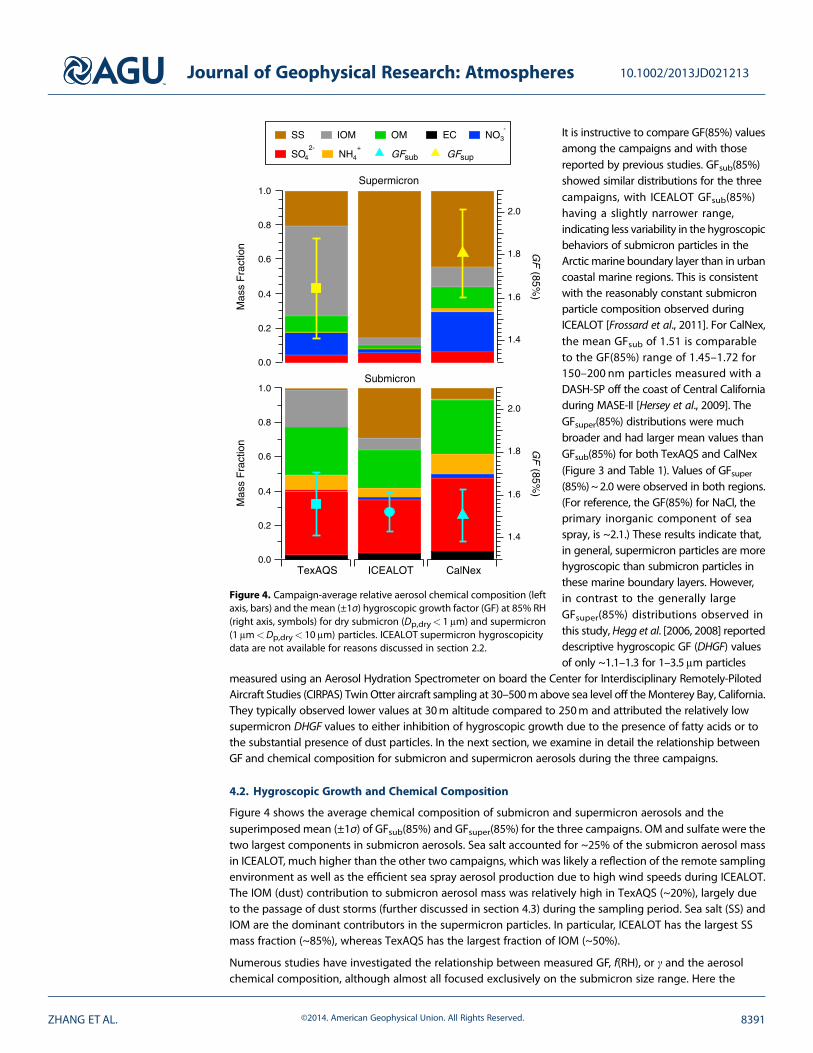
Figure 4 shows the average chemical composition of submicron and supermicron aerosols and thesuperimposed mean (±1σ) of GFsub(85%) and GFsuper(85%) for the three campaigns. OM and sulfate were thetwo largest components in submicron aerosols. Sea salt accounted for ~25% of the submicron aerosol massin ICEALOT, much higher than the other two campaigns, which was likely a reflection of the remote samplingenvironment as well as the efficient sea spray aerosol production due to high wind speeds during ICEALOT.The IOM (dust) contribution to submicron aerosol mass was relatively high in TexAQS (~20%), largely dueto the passage of dust storms (further discussed in section 4.3) during the sampling period. Sea salt (SS) andIOM are the dominant contributors in the supermicron particles. In particular, ICEALOT has the largest SSmass fraction (~85%), whereas TexAQS has the largest fraction of IOM (~50%).
Numerous studies have investigated the relationship between measured GF, f(RH), or γ and the aerosolchemical composition, although almost all focused exclusively on the submicron size range. Here the
Figure 4. Campaign-average relative aerosol chemical composition (leftaxis, bars) and the mean (±1σ) hygroscopic growth factor (GF) at 85% RH(right axis, symbols) for dry submicron (Dp,dry< 1μm) and supermicron(1μm<Dp,dry< 10μm) particles. ICEALOT supermicron hygroscopicitydata are not available for reasons discussed in section 2.2.
Journal of Geophysical Research: Atmospheres 10.1002/2013JD021213
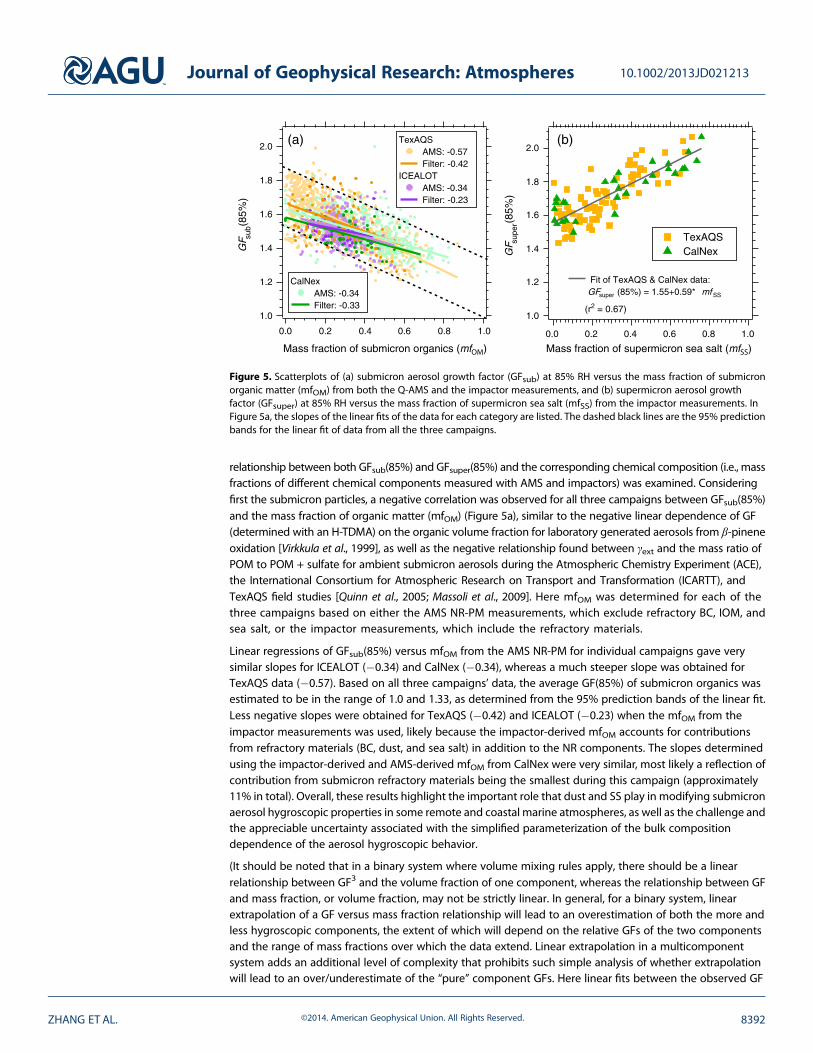
relationship between both GFsub(85%) and GFsuper(85%) and the corresponding chemical composition (i.e., massfractions of different chemical components measured with AMS and impactors) was examined. Consideringfirst the submicron particles, a negative correlation was observed for all three campaigns between GFsub(85%)and the mass fraction of organic matter (mfOM) (Figure 5a), similar to the negative linear dependence of GF(determined with an H-TDMA) on the organic volume fraction for laboratory generated aerosols from β-pineneoxidation [Virkkula et al., 1999], as well as the negative relationship found between γext and the mass ratio ofPOM to POM + sulfate for ambient submicron aerosols during the Atmospheric Chemistry Experiment (ACE),the International Consortium for Atmospheric Research on Transport and Transformation (ICARTT), andTexAQS field studies [Quinn et al., 2005; Massoli et al., 2009]. Here mfOM was determined for each of thethree campaigns based on either the AMS NR-PM measurements, which exclude refractory BC, IOM, andsea salt, or the impactor measurements, which include the refractory materials.
Linear regressions of GFsub(85%) versus mfOM from the AMS NR-PM for individual campaigns gave verysimilar slopes for ICEALOT (�0.34) and CalNex (�0.34), whereas a much steeper slope was obtained forTexAQS data (�0.57). Based on all three campaigns’ data, the average GF(85%) of submicron organics wasestimated to be in the range of 1.0 and 1.33, as determined from the 95% prediction bands of the linear fit.Less negative slopes were obtained for TexAQS (�0.42) and ICEALOT (�0.23) when the mfOM from theimpactor measurements was used, likely because the impactor-derived mfOM accounts for contributionsfrom refractory materials (BC, dust, and sea salt) in addition to the NR components. The slopes determinedusing the impactor-derived and AMS-derived mfOM from CalNex were very similar, most likely a reflection ofcontribution from submicron refractory materials being the smallest during this campaign (approximately11% in total). Overall, these results highlight the important role that dust and SS play in modifying submicronaerosol hygroscopic properties in some remote and coastal marine atmospheres, as well as the challenge andthe appreciable uncertainty associated with the simplified parameterization of the bulk compositiondependence of the aerosol hygroscopic behavior.
(It should be noted that in a binary system where volume mixing rules apply, there should be a linearrelationship between GF3 and the volume fraction of one component, whereas the relationship between GFand mass fraction, or volume fraction, may not be strictly linear. In general, for a binary system, linearextrapolation of a GF versus mass fraction relationship will lead to an overestimation of both the more andless hygroscopic components, the extent of which will depend on the relative GFs of the two componentsand the range of mass fractions over which the data extend. Linear extrapolation in a multicomponentsystem adds an additional level of complexity that prohibits such simple analysis of whether extrapolationwill lead to an over/underestimate of the “pure” component GFs. Here linear fits between the observed GF
Figure 5. Scatterplots of (a) submicron aerosol growth factor (GFsub) at 85% RH versus the mass fraction of submicronorganic matter (mfOM) from both the Q-AMS and the impactor measurements, and (b) supermicron aerosol growthfactor (GFsuper) at 85% RH versus the mass fraction of supermicron sea salt (mfSS) from the impactor measurements. InFigure 5a, the slopes of the linear fits of the data for each category are listed. The dashed black lines are the 95% predictionbands for the linear fit of data from all the three campaigns.
Journal of Geophysical Research: Atmospheres 10.1002/2013JD021213
and mass fractions are used to beconsistent with at least some of theliterature and because, broadlyspeaking, the observed relationshipsare reasonably linear. Nonetheless, itshould be kept in mind that theuncertainties in the derived pure-component GFs, such as that for thesubmicron organics above or some ofthe supermicron components below,may be underestimated from theregression statistics alone because thelinear fit itself is only anapproximation. Further discussion isprovided in the supportinginformation (Figures S6 and S7).
Considering the supermicronparticles, it is found that therelative fraction of sea salt (SS),determined from the impactormeasurements, strongly controls thesupermicron aerosol hygroscopicgrowth in TexAQS and CalNex, assuggested by the tight correlationbetween GFsuper(85%) and themass fraction of supermicron sea salt(mfSS) (Figure 5b). A linear fit to thecombined TexAQS and CalNex datasetsyields a value of GFsuper(85%)=2.14when mfSS=1, consistent with theknown hygroscopic growth of NaClparticle. This consistency suggests thatparticle losses between the humidifierand the extinction measurement cellsdid not substantially influence themeasurements. It is noteworthy that
the GFsuper(85%) whenmfSS= 0 for these two campaigns is 1.55 (based on linear extrapolation), which suggeststhat the non-SS components are, on average, reasonably hygroscopic. This will be examined further for theTexAQS study in the next section.
4.3. Supermicron Particle Hygroscopic Growth: TexAQS Case Study4.3.1. Hygroscopic Growth of Supermicron DustDuring TexAQS 2006, dust was a major component of the supermicron particle mass, especially during theperiod from 27 to 30August 2006 when a major dust event was encountered and impacted the air massessampled at the ship [Lack et al., 2009]. During this period, the total IOM mass loading increased up to41.4μgm�3. The average IOM mass fractions were 53% and 59% for submicron and supermicron aerosols,respectively, which are 14.9 and 8.4 times higher than before the event. Hybrid Single-Particle LagrangianIntegrated Trajectory (HYSPLIT) back trajectories [Draxler and Rolph, 2013] (Figure 7) showed that the airmasses during this particular event had originated from the Saharan region of North Africa and had beenover the Atlantic Ocean for approximately a week before reaching the Gulf of Mexico, under the influence ofthe Azores High [Bates et al., 2008]. The geochemical signatures (i.e., the mass ratio of Ca/Al, Fe/Al, and Si/Al)of the IOM component during the event quantitatively agreed with those of Saharan dust [Formenti et al.,2003], which further confirmed the origin of the dust aerosols encountered during the event. Outside ofthis major dust event, there were some other periods where back trajectories showed a marine origin for the
Figure 6. (top) Pie charts that illustrate the composition of the inorganicoxidized material (IOM) for the type I and type II dust. (bottom) Scatterplotof supermicron growth factor (GFsuper) at 85% RH versus the mass fraction ofsupermicron IOM (mfIOM) for the type I (red and gray circles) and type IIdust (blue triangles). The data during the dust event from 27 to 30 August2006 are highlighted as gray markers. The GFIOM(85%) for type I and II dustwere determined from the linear fits to GFsuper(85%) versus mfIOM extrapo-lated to mfIOM=1.
Journal of Geophysical Research: Atmospheres 10.1002/2013JD021213
air masses sampled, and where the IOM composition was very similar to that during the event, indicatingthat the dust aerosols during these mixed marine/dust periods also originated from the Sahara. The dustencountered during the major dust event and during the mixed marine/dust periods will be referred to asType I dust. A second type of dust, referred to as Type II dust, that had a composition distinct from theSaharan dust and that had a different temporal profile was also encountered during TexAQS. The Type IIdust was mainly sampled in September 2006, the last one third of the cruise, during which the sourcecategory was defined by northerly trajectories (Figure 7) and high radon concentrations. This suggests thatthe air masses with Type II dust that were intercepted by the ship had recently been over the NorthAmerican continent (e.g., from the Ohio River Valley) [Bates et al., 2008;Massoli et al., 2009]. The Type II dusthad a much higher fraction of CaO and lower fractions of SiO2 and Al2O3 compared to Type I dust (Figure 6,top), consistent with the HYSPLIT back trajectories that indicated different source regions for the twodust types.
Interestingly, these two types of dust exhibited very different hygroscopic behaviors. Reasonably tightcorrelations between GFsuper(85%) and the mass fraction of IOM, mfIOM, in supermicron aerosols wereobserved for both Type I and Type II dust (Figure 6, bottom). From a linear fit to GF(85%) versus mfIOMextrapolated to mfIOM = 1, the GF for type I dust (the Saharan dust) was estimated to be 1.38 ± 0.15,suggesting that this type of dust was moderately hygroscopic. (The uncertainty reported is a fit uncertainty;it is possible that the derived GF(85%) for type I dust is somewhat overestimated from limitations of linearextrapolation. Further details are provided in the supporting information (Figure S8).) In contrast, the GF(85%)for Type II dust was 1.01 ± 0.14, indicating that it is overall much less hygroscopic than Type I dust. Thissuggests that the CaO component of dust is less hygroscopic than the SiO2 and Al2O3 components, as CaOmade up a larger fraction of the Type II dust. These results are consistent with the prior findings by Lack et al.[2009], who estimated an average GF(85%) of ~1.25 for 2.1μm dust particles during the same major Saharandust event. For comparison, Pan et al. [2009] reported a mean fsca(80%) of 1.20 during a dust episode inBeijing, and Carrico et al. [2003] determined fsca(82.5%) values of 1.18 and 1.39 for PM10 and PM1 particles,respectively, observed during a dust storm period on board the R/V Ron Brown during ACE-Asia. Also, duringACE-Asia, Kim et al. [2006] observed fsca(85%) as high as 2.00 (±0.27) for PM10 dust particles that hadoriginated from the Gobi desert at a ground site in Korea. Our study, together with the previous findings byLack et al. [2009], suggests that the Saharan dust particles are either inherently somewhat hygroscopic orduring long-range transport over the ocean can become hygroscopic. Whatever the reason, it is evident thatdusts from different sources have different hygroscopicities, hence differently influence the hygroscopicbehavior of the bulk aerosols.4.3.2. Estimation of Supermicron Organics Growth Factor Through Hygroscopicity ClosureOrganic aerosol is an important component in the supermicron size range, yet its hygroscopic propertieshave not been extensively characterized in the ambient atmosphere before. Organics were found tocontribute to the supermicron mass to a similar extent as nonsea-salt inorganic ions (TexAQS) or to bothnonsea-salt inorganic ions and IOM (CalNex) (Figure 4). In this study, the investigation of hygroscopic growthof supermicron organics during TexAQS was possible through an analysis of hygroscopicity closure since theGF(85%) of IOM was explicitly constrained by observations above, and the GFs of the other inorganiccomponents are also known. The basic idea is that in a hygroscopicity closure study the growth factor of themixture (GFmixed) can be estimated from the growth factors of individual aerosol components and theirvolume fraction (ε), using the Zdanovskii-Stokes-Robinson volume-weighted mixing rule [Zdanovskii, 1948;Stokes and Robinson, 1966; Gysel et al., 2007; Hersey et al., 2009]:
GFmixed ¼Xi
εiGF3i
!13
(6)
In equation (6), GFmixed corresponds to the derived GF values determined from inversion of the fext(RH)observations. Assuming a constant growth factor for the supermicron organics (GFOM) at 85% RH thatequals either 1 or 1.3 (i.e., the range of values determined for the submicron OM) leads to substantialunderestimation of the overall supermicron GFmixed(85%) (Figure S9), suggesting that supermicron organicsare largely more hygroscopic than the submicron organics in this study. The absolute values of the bulk-average GFOM(85%) were determined for each observed GF(85%) by minimizing the root mean squareerror between the observed GFsuper(85%) and calculated GFmixed(85%). Table 2 lists the individual
Journal of Geophysical Research: Atmospheres 10.1002/2013JD021213
component GF(85%) and the density used to convert mass fractions into volume fractions for each of thedifferent aerosol components. Based on the ammonium-to-sulfate molar ratio, (NH4)2SO4 was assumed to bethe main form of supermicron sulfate, and NaNO3 was assumed to be the main form of supermicron nitrate.The temporal variation of the volume fractions of the various supermicron aerosol components is presentedin Figure S10. The uncertainty associated with the hygroscopicity closure calculation and the derived GFOM(85%) was systematically assessed through a Monte Carlo analysis. Values for each of the model inputparameters (Table 2), including the overall supermicron GF(85%), were randomly sampled from probabilitydistributions that were assumed to be independent and normally distributed about each parameter’s meanvalue (GFs were constrained to be >1), with the exception of the GF(85%) for the type I dust. For the type Idust, a left-skewed and offset Weibull probability distribution (Figure S11) was used to account for thepossible overestimate of GFIOM(85%) introduced by the extrapolation of the linear fit of GFsuper(85%) versusthe IOM mass fraction (Figure 6). GFOM(85%) values were derived 20,000 times to determine a frequencydistribution of GFOM(85%) values for each observed overall GF(85%). Approximately 35% of the model inputswere unrealistic (e.g., gave a negative organic volume fraction) and therefore were discarded.
Figure 7 shows a time series of the inferred supermicron GFOM(85%) from the hygroscopicity closure with thecalculation uncertainty obtained from the Monte Carlo analysis. The campaign-average GFOM(85%) was 1.59(±0.19), suggesting the appreciable contribution of water uptake from organics for supermicron particles.Despite the relatively large uncertainty associated with the estimated GFOM(85%), variations in the GFOM(85%) during the course of the TexAQS study appear to be linked to the air mass source regions.Consideration of HYSPLIT back trajectories associated with different periods indicate that lower GFOM(85%)values, most frequently encountered near the end of the campaign in September, were mainly associatedwith continental U.S./polluted air mass origins. Comparably higher GFOM(85%) values, typically sampledearlier during the cruise, were linked to air masses that originated from the ocean (Gulf of Mexico or AtlanticOcean) and/or long-range transport from Africa with likely atmospheric processing. For example, thesupermicron GFOM(85%) was estimated to be 1.26, 1.35, and 1.18 on 18 August, 30 August, and 7 September,respectively, when the air mass trajectories were clearly from the continental U.S. (Figure 7). These values arein the range of the submicron GFOM(85%) (~1.0-1.3) determined in this study (Figure 5) and reportedelsewhere [Randles et al., 2004; Hersey et al., 2009; Zamora et al., 2011; Gantt and Meskhidze, 2013], suggestingthat supermicron OM from continental sources may be chemically similar to submicron OM. In contrast,marine or long-range supermicron OM on average had a substantially higher GFOM(85%), which could implya different chemical composition associated with the different particle origins. It is possible that somemarine primary organic aerosols (e.g., fungi and bacteria) make up a large fraction of the supermicron OMmass in the marine boundary layer, and they likely have different hygroscopic behaviors from the organic
Table 2. Parameters (Growth Factor, Density, and Volume Fraction of Each Supermicron Particle Component) and theAssociated Uncertainty Used in the Hygroscopicity Closure With Monte Carlo Analysis
aFor the type I dust, a left-skewed and offset Weibull probability distribution (Figure S11) was adopted to account forthe possible overestimate of GFIOM(85%) introduced by the extrapolation of the linear fit of GFsuper(85%) versus the IOMmass fraction (Figure 6).
bTo be determined as part of the closure.cThe density of organic matter was calculated from the ratio of organic aerosol mass and the difference between the
total aerosol volume determined with an APS and the sum of the volumes of the individual inorganic components.dThe campaign-average volume fraction and the associatedmeasurement uncertainty for each component. Note that
the time-dependent volume fractions associated with each individual GF(85%) measurement are used in the opticalclosure. The total uncertainty in the volume fraction includes those associated with the total particle volume distributionmeasurement and the impactor mass measurement of each component.
Journal of Geophysical Research: Atmospheres 10.1002/2013JD021213
compounds formed from gas-particle conversion [Hawkins and Russell, 2010]. However, since no furtherchemical information regarding the nature of the supermicron OM is available for this study, we cannotcomment on the type of organic compounds or functional groups that may lead to the highly hygroscopicbehaviors of the overall supermicron organics. In addition, given the uncertainty associated with the inversionapproach, the possibility that the mean GFOM(85%) was biased high cannot be completely ruled out.
5. Conclusion
Subsaturated hygroscopic properties of both submicron and supermicron aerosols in the remote and coastalmarine boundary layers during three research cruises, TexAQS-GoMACCS 2006, ICEALOT 2008, and CalNex2010, were investigated using an optical approach. The impact of water uptake on particle light extinction, fext(RH),was quantified with a cavity ring-down aerosol extinction spectrometer (CRD-AES) making extinctionmeasurement at 532nm under dry (<30%) and elevated (i.e., 75% and 85%) RHs. An optically weighted bulkgrowth factor (GF) at 85% RH for both submicron and supermicron aerosols was retrieved from the fext(85%)measurement based on Mie theory calculations. The derived GF(85%) was proved to be a more robustmeasure for hygroscopic growth than fext(85%), which can be confounded by changes in particle dry sizedistribution. The link between aerosol hygroscopic growth and chemical composition was examined forboth size ranges. Broadly consistent with previous studies, a negative correlation was found betweensubmicron GF(85%) (GFsub) and the submicron organic mass fraction (mfOM), although the slopes of the
Figure 7. The central panel shows a time series of the frequency distribution of the inferred supermicron GFOM(85%) fromhygroscopicity closure calculationwith 20,000 runMonte Carlo simulation. The color represents the normalized frequency (between 0 and 1) of the supermicron GFOM(85%) ranged from 1.0 to 2.5 with 0.1 increment.The black squares represent themean supermicron GFOM(85%). The surrounding panels show 5 day (7 day in one case) HYSPLIT back trajectories that indicate airmass originfor selected impactor sampling periods during the cruise. HYSPLIT results were obtained from http://ready.arl.noaa.gov/HYSPLIT.php. The horizontal dashed lines indicatealtitude, and are spaced by 500 m. The line colors indicate the end-point altitude of the air mass: surface (red), 20 m (blue), 500 m (green).
Journal of Geophysical Research: Atmospheres 10.1002/2013JD021213
linear regression fit between the two showed moderate sensitivity to the mass fraction of dust and sea salt.For supermicron aerosols, GFsuper(85%) was reasonably well correlated with the supermicron sea-salt massfraction. Hygroscopic behaviors of other supermicron components (i.e., dust and organics) were studied usingTexAQS 2006 as a case. Two types of dust with distinct hygroscopic properties were identified. The dustaerosols that originated from the Saharan desert were moderately hygroscopic, with an average GF of1.38± 0.15, whereas the dust from continental (possibly industrial) sources was nearly hydrophobic, with anaverage GF of 1.01 ± 0.14. With the GFs for the IOM and other inorganic components constrained, the bulkGF(85%) for supermicron organics (GFOM) was determined with a hygroscopicity closure calculationbased on volume-weighted mixing rule. Uncertainties in the derived GFOM(85%) were estimated through aMonte Carlo analysis that accounted for uncertainties in each of the closure input parameters. Minimizationof the difference between observed and predicted GFs for themixture yielded a campaign-average GFOM(85%)of 1.59 (±0.19) for the supermicron organics, suggesting the important role that the supermicron OM plays ininfluencing the overall aerosol water uptake. The supermicron organics that originated from the marineenvironment were found to have much higher GFOM(85%) values than those that originated from continentalU.S./industrial sources, suggesting that marine organic aerosols likely have distinct chemical composition.The continental supermicron organics had hygroscopicity similar to the submicron organics.
This study provides an addition to the literature of marine aerosol hygroscopic properties and observationalconstraints for climate models, with new insights on the hygroscopic properties of supermicron aerosolcomponents, of which our knowledge are still very limited. The relatively large water uptake potential ofsupermicron marine aerosols underlines their importance in determining the aerosol radiative forcing, yetthe lack of understanding on their chemical composition, sources, and hygroscopic and optical behaviorsposes great challenge in accurately quantifying their climate impact.
ReferencesAllan, J. D., J. L. Jimenez, P. I. Williams, M. R. Alfarra, K. N. Bower, J. T. Jayne, H. Coe, and D. R. Worsnop (2003), Quantitative sampling
using an Aerodyne aerosol mass spectrometer 1. Techniques of data interpretation and error analysis, J. Geophys. Res., 108(D3),4090, doi:10.1029/2002JD002358.
Bates, T. S., D. J. Coffman, D. S. Covert, and P. K. Quinn (2002), Regional marine boundary layer aerosol size distributions in the Indian, Atlantic,and Pacific Oceans: A comparison of INDOEX measurements with ACE-1, ACE-2, and Aerosols99, J. Geophys. Res., 107(D19), 8026,doi:10.1029/2001JD001174.
Bates, T. S., et al. (2004), Marine boundary layer dust and pollution transport associated with the passage of a frontal system over easternAsia, J. Geophys. Res., 109, D19S19, doi:10.1029/2003JD004094.
Bates, T. S., et al. (2008), Boundary layer aerosol chemistry during TexAQS/GoMACCS 2006: Insights into aerosol sources and transformationprocesses, J. Geophys. Res., 113, D00F01, doi:10.1029/2008JD010023.
Berner, A., C. Lürzer, F. Pohl, O. Preining, and P. Wagner (1979), The size distribution of the urban aerosol in Vienna, Sci. Total Environ., 13,245–261, doi:10.1016/0048-9697(79)90105-0.
Bohren, C. F., and D. R. Huffman (1983), Absorption and Scattering of Light by Small Particles, 530 pp., John Wiley, New York.Cappa, C. D., D. L. Che, S. H. Kessler, J. H. Kroll, and K. R. Wilson (2011), Variations in organic aerosol optical and hygroscopic properties upon
heterogeneous OH oxidation, J. Geophys. Res., 116, D15204, doi:10.1029/2011JD015918.Carrico, C. M., P. Kus, M. J. Rood, P. K. Quinn, and T. S. Bates (2003), Mixtures of pollution, dust, sea salt, and volcanic aerosol during ACE-Asia:
Radiative properties as a function of relative humidity, J. Geophys. Res., 108(D23), 8650, doi:10.1029/2003JD003405.Cerully, K. M., et al. (2011), Atmos. Chem. Phys., 11, 12,369–12,386, doi:10.5194/acp-11-12369-2011.Draxler, R. R., and G. D. Rolph (2013), HYSPLIT (Hybrid Single-Particle Lagrangian Integrated Trajectory) model access via NOAA ARL READY
website. [Available at http://www.arl.noaa.gov/HYSPLIT.php.] NOAA Air Resources Laboratory, College Park, Md.Duplissy, J., et al. (2011), Relating hygroscopicity and composition of organic aerosol particulate matter, Atmos. Chem. Phys., 11, 1155–1165,
doi:10.5194/acp-11-1155-2011.Flores, J. M., R. Z. Bar-Or, N. Bluvshtein, A. Abo-Riziq, A. Kostinski, S. Borrmann, I. Koren, I. Koren, and Y. Rudich (2012), Absorbing
aerosols at high relative humidity: Linking hygroscopic growth to optical properties, Atmos. Chem. Phys., 12, 5511–5521,doi:10.5194/acp-12-5511-2012.
Formenti, P., W. Elbert, W. Maenhaut, J. Haywood, and M. O. Andreae (2003), Chemical composition of mineral dust aerosol during theSaharan Dust Experiment (SHADE) airborne campaign in the Cape Verde region, September 2000, J. Geophys. Res., 108(D18), 8576,doi:10.1029/2002JD002648.
Frossard, A. A., P. M. Shaw, L. M. Russell, J. H. Kroll, M. R. Canagaratna, D. R. Worsnop, P. K. Quinn, and T. S. Bates (2011), Springtime Arctichaze contributions of submicron organic particles from European and Asian combustion sources, J. Geophys. Res., 116, D05205,doi:10.1029/2010JD015178.
Gantt, B., and N. Meskhidze (2013), The physical and chemical characteristics of marine primary organic aerosol: A review, Atmos. Chem.Phys., 13, 3979–3996, doi:10.5194/acp-13-3979-2013.
Gassó, S., et al. (2000), Influence of humidity on the aerosol scattering coefficient and its effect on the upwelling radiance during ACE-2, TellusB, 52, 546–567, doi:10.1034/j.1600-0889.2000.00055.x.
Ghan, S. J., X. Liu, R. C. Easter, R. Zaveri, P. J. Rasch, and J.-H. Yoon (2012), Toward a minimal representation of aerosols in climate models:Comparative decomposition of aerosol direct, semidirect, and indirect radiative forcing, J. Clim., 25, 6461–6476.
AcknowledgmentsThis analysis was supported by theNOAA Climate Program Office(NA09OAR4310124) and the U.S.Environmental Protection Agencyunder a STAR research assistanceagreement (RD834558). This work hasnot been formally reviewed by any ofthe funding agencies. The viewsexpressed in this document are solelythose of the authors, and the fundingagencies do not endorse any productsor commercial services mentioned inthis publication. The three cruises wereprimarily supported by NOAA withadditional support from the CaliforniaAir Resources Board (CalNex) and theTexas Air Quality Study (TexAQS). Theauthors would like to acknowledgeDerek Coffman and Kristen Schulz atNOAA PMEL for the collection of the sizedistribution and impactor data, respec-tively. We also thank the crews of NOAAR/V Ronald H. Brown, WHOI R/V Knorr,and the WHOI R/V Atlantis who madethis study possible.
Journal of Geophysical Research: Atmospheres 10.1002/2013JD021213
Gysel, M., J. Crosier, D. O. Topping, J. D. Whitehead, K. N. Bower, M. J. Cubison, P. I. Williams, M. J. Flynn, G. B. McFiggans, and H. Coe (2007), Closurestudy between chemical composition and hygroscopic growth of aerosol particles during TORCH2, Atmos. Chem. Phys., 7, 6131–6144.
Hawkins, L. N., and L. M. Russell (2010), Polysaccharides, proteins, and phytoplankton fragments: Four chemically distinct types of marineprimary organic aerosol classified by single particle spectromicroscopy, Adv. Meteorol., 2010, doi:10.1155/2010/612132.
Hegg, D. A., D. S. Covert, K. K. Crahan, H. H. Jonsson, and Y. Liu (2006), Measurements of aerosol size-resolved hygroscopicity at sub andsupermicron sizes, Geophys. Res. Lett., 33, L21808, doi:10.1029/2006GL026747.
Hegg, D. A., D. S. Covert, and H. H. Jonsson (2008), Measurements of size-resolved hygroscopicity in the California coastal zone, Atmos. Chem.Phys., 8, 7193–7203.
Hersey, S. P., A. Sorooshian, S. M. Murphy, R. C. Flagan, and J. H. Seinfeld (2009), Aerosol hygroscopicity in the marine atmosphere: A closurestudy using high-time-resolution, multiple-RH DASH-SP and size-resolved C-ToF-AMS data, Atmos. Chem. Phys., 9, 2543–2554.
Hersey, S. P., et al. (2013), Composition and hygroscopicity of the Los Angeles Aerosol: CalNex, J. Geophys. Res. Atmos., 118, 3016–3036,doi:10.1002/jgrd.50307.
Hitzenberger, R., A. Berner, U. Dusek, and R. Alabashi (1997), Humidity-dependent growth of size-segregated aerosol samples, Aerosol Sci.Technol., 27, 116–130, doi:10.1080/02786829708965461.
Intergovernmental Panel on Climate Change (2007), IPCC: Intergovernmental Panel on Climate Change, Fourth Assessment Record, CambridgeUniv. Press, Cambridge, U. K., and New York.
Jayne, J. T., D. C. Leard, X. F. Zhang, P. Davidovits, K. A. Smith, C. E. Kolb, and D. R. Worsnop (2000), Development of an aerosol mass spec-trometer for size and composition analysis of submicron particles, Aerosol Sci. Technol., 33, 49–70, doi:10.1080/027868200410840.
Kim, J., S. C. Yoon, A. Jefferson, and S. W. Kim (2006), Aerosol hygroscopic properties during Asian dust, pollution, and biomass burningepisodes at Gosan, Korea in April 2001, Atmos. Environ., 40, 1550–1560, doi:10.1016/j.atmosenv.2005.10.044.
Kinne, S., et al. (2003), Monthly averages of aerosol properties: A global comparison amongmodels, satellite data, and AERONETground data,J. Geophys. Res., 108(D20), 4634, doi:10.1029/2001JD001253.
Köhler, H. (1921), Zur Kondensation des Wassers in der Atmosphäre, Meteorol. Z., 38, 168–171.Köhler, H. (1936), The nucleus in and the growth of hygroscopic droplets, Trans. Faraday Soc., 32, 1152–1161.Lack, D. A., et al. (2009), Relative humidity dependence of light absorption by mineral dust after long-range atmospheric transport from the
Sahara, Geophys. Res. Lett., 36, L24805, doi:10.1029/2009GL041002.Lambe, A. T., et al. (2013), Relationship between oxidation level and optical properties of secondary organic aerosol, Environ. Sci. Technol., 47,
6349–6357, doi:10.1021/es401043j.Langridge, J. M., M. S. Richardson, D. Lack, D. Law, and D. M. Murphy (2011), Aircraft instrument for comprehensive characterization of
aerosol optical properties. Part I: Wavelength-dependent optical extinction and its relative humidity dependence measured using cavityringdown spectroscopy, Aerosol Sci. Technol., 45, 1305–1318, doi:10.1080/02786826.2011.592745.
Liu, B. Y. H., D. Y. H. Pui, K. T. Whitby, D. B. Kittelson, Y. Kousaka, and R. L. McKenzie (1978), Aerosol mobility chromatograph—New detector forsulfuric-acid aerosols, Atmos. Environ., 12, 99–104, doi:10.1016/0004-6981(78)90192-0.
Malm, W. C., and D. E. Day (2001), Estimates of aerosol species scattering characteristics as a function of relative humidity, Atmos. Environ., 35,2845–2860.
Malm, W. C., and S. M. Kreidenweis (1997), The effects of models of aerosol hygroscopicity on the apportionment of extinction, Atmos.Environ., 31, 1965–1976, doi:10.1016/s1352-2310(96)00355-x.
Malm, W. C., J. F. Sisler, D. Huffman, R. A. Eldred, and T. A. Cahill (1994), Spatial and seasonal trends in particle concentration and opticalextinction in the United States, J. Geophys. Res., 99, 1347–1370, doi:10.1029/93JD02916.
Malm, W. C., D. E. Day, S. M. Kreidenweis, J. L. Collett, and T. Lee (2003), Humidity-dependent optical properties of fine particles during the BigBend Regional Aerosol and Visibility Observational Study, J. Geophys. Res., 108(D9), 4279, doi:10.1029/2002JD002998.
Massoli, P., T. S. Bates, P. K. Quinn, D. A. Lack, T. Baynard, B. M. Lerner, S. C. Tucker, J. Brioude, A. Stohl, and E. J. Williams (2009), Aerosol opticaland hygroscopic properties during TexAQS-GoMACCS 2006 and their impact on aerosol direct radiative forcing, J. Geophys. Res., 114,D00F07, doi:10.1029/2008JD011604.
McInnes, L., M. Bergin, J. Ogren, and S. Schwartz (1998), Apportionment of light scattering and hygroscopic growth to aerosol composition,Geophys. Res Lett., 25, 513–516, doi:10.1029/98GL00127.
National Institute for Occupational Safety and Health (1996), NIOSH elemental carbon (diesel particulate): Method 5040, in NIOSH Manual ofAnalytical Methods, Cincinnati, OH, National Institute for Occupational Safety and Health.
Pan, X. L., P. Yan, J. Tang, J. Z. Ma, Z. F. Wang, A. Gbaguidi, and Y. L. Sun (2009), Observational study of influence of aerosol hygroscopic growthon scattering coefficient over rural area near Beijing mega-city, Atmos. Chem. Phys., 9, 7519–7530.
Prather, K. A., et al. (2013), Bringing the ocean into the laboratory to probe the chemical complexity of sea spray aerosol, Proc. Natl. Acad. Sci.U.S.A., 110, 7550–7555, doi:10.1073/pnas.1300262110.
Quinn, P. K., and T. S. Bates (2003), North American, Asian, and Indian haze: Similar regional impacts on climate?, Geophys. Res. Lett., 30(11),1555, doi:10.1029/2003GL016934.
Quinn, P. K., et al. (2005), Impact of particulate organic matter on the relative humidity dependence of light scattering: A simplified para-meterization, Geophys. Res. Lett., 32, L22809, doi:10.1029/2005GL024322.
Quinn, P. K., et al. (2006), Impacts of sources and aging on submicrometer aerosol properties in the marine boundary layer across the Gulf ofMaine, J. Geophys. Res., 111, D23S36, doi:10.1029/2006JD007582.
Rader, D. J., and P. H. McMurry (1986), Application of the tandem differential mobility analyzer to studies of droplet growth or evaporation,J. Aerosol Sci., 17, 771–787, doi:10.1016/0021-8502(86)90031-5.
Randles, C. A., L. M. Russell, and V. Ramaswamy (2004), Hygroscopic and optical properties of organic sea salt aerosol and consequences forclimate forcing, Geophys. Res. Lett., 31, L16108, doi:10.1029/2004GL020628.
Ryerson, T. B., et al. (2013), The 2010 California Research at the Nexus of Air Quality and Climate Change (CalNex) field study, J. Geophys. Res.Atmos., 118, 5830–5866, doi:10.1002/jgrd.50331.
Sorooshian, A., S. Hersey, F. J. Brechtel, A. Corless, R. C. Flagan, and J. H. Seinfeld (2008), Rapid, size-resolved aerosol hygroscopic growthmeasurements: Differential aerosol sizing and hygroscopicity spectrometer probe (DASH-SP), Aerosol Sci. Technol., 42, 445–464,doi:10.1080/02786820802178506.
Stock, M., Y. F. Cheng, W. Birmili, A. Massling, B. Wehner, T. Muller, S. Leinert, N. Kalivitis, N. Mihalopoulos, and A. Wiedensohler (2011),Hygroscopic properties of atmospheric aerosol particles over the Eastern Mediterranean: Implications for regional direct radiative forcingunder clean and polluted conditions, Atmos. Chem. Phys., 11, 4251–4271, doi:10.5194/acp-11-4251-2011.
Stokes, R. H., and R. A. Robinson (1966), Interactions in aqueous nonelectrolyte solutions. I. Solute-solvent equilibria, J. Phys. Chem., 70,2126–2130.
Journal of Geophysical Research: Atmospheres 10.1002/2013JD021213
Turpin, B. J., and H. Lim (2001), Species contribution to PM2.5 concentrations: Revisiting common assumptions for estimating organic mass,Aerosol Sci. Technol., 35, 602–610, doi:10.1080/02786820152051454.
Virkkula, A., R. Van Dingenen, F. Raes, and J. Hjorth (1999), Hygroscopic properties of aerosol formed by oxidation of limonene, α-pinene, andβ-pinene, J. Geophys. Res., 104, 3569–3579, doi:10.1029/1998JD100017.
Wang, W., M. J. Rood, C. M. Carrico, D. S. Covert, P. K. Quinn, and T. S. Bates (2007), Aerosol optical properties along the northeast coast ofNorth America during the New England Air Quality Study—Intercontinental Transport and Chemical Transformation 2004 campaign andthe influence of aerosol composition, J. Geophys. Res., 112, D10S23, doi:10.1029/2006JD007579.
Wu, Z. J., et al. (2013), Relating particle hygroscopicity and CCN activity to chemical composition during the HCCT-2010 field campaign,Atmos. Chem. Phys., 13, 7983–7996, doi:10.5194/acp-13-7983-2013.
Zamora, I. R., A. Tabazadeh, D. M. Golden, and M. Z. Jacobson (2011), Hygroscopic growth of common organic aerosol solutes, includinghumic substances, as derived from water activity measurements, J. Geophys. Res., 116, D23207, doi:10.1029/2011JD016067.
Zdanovskii, A. (1948), New methods for calculating solubilities of electrolytes in multicomponent systems, Zhur. Fiz. Khim., 22, 1475–1485.Zhang, X., B. J. Turpin, P. H. McMurry, S. V. Hering, and M. R. Stolzenburg (1994), Mie theory evaluation of species contributions to 1990
wintertime visibility reduction in the Grand Canyon, J. Air Waste Manag. Assoc., 44, 153–162.Ziemba, L. D., et al. (2013), Airborne observations of aerosol extinction by in situ and remote-sensing techniques: Evaluation of particle