Page 1
Hypoxia imaging in brain tumors
F. Zerrin Yetkin, MD*, Dianne Mendelsohn, MD
Division of Neuroradiology, Department of Radiology, University of Texas Southwestern Medical Center at Dallas,
Dallas, TX 75390-8896, USA
Assessment of the oxygenation status of brain
tumors has been of increasing interest under the light
of recent advances in oncology. Extensive experi-
mental and in vivo studies have documented that
tissue oxygen tension is a critical factor influencing
the tumor response to radiation and some chemo-
therapeutic agents. Hypoxia compromises the effect
of irradiation on tumor cells. Oxygen increases the
efficiency of x or gamma radiation [1]. The oxygena-
tion status of a tumor is also a factor in the regulation
of gene expression for malignant progression [2].
Furthermore, in head and neck tumors, pretreatment
oxygenation status of the tumor predicts the radiation
response and regional tumor control [3,4]. As for
brain tumors, high-grade gliomas have large propor-
tions of hypoxic tissue that contribute to resistance to
radiation [5,6].
A number of strategies to increase tumor oxygena-
tion have been developed to improve outcome. Ad-
ministration of nicotinamide [7,8], inhalation of 100%
oxygen [9], hyperbaric oxygen [10–12], or high
oxygen mixtures, such as carbogen (95% oxygen
and 5% carbon dioxide) [7,8,13–17] are suggested
to increase the tumor’s sensitivity to radiation therapy.
Different types of tumors display variable hypoxic cell
proportions and response to reoxygenation strategies
[18,19]. Radiation therapy, however, changes the
oxygenation status of the tumor tissue along with
the vascularization and perfusion of tumors that are
tied closely to oxygen distribution. Oxygen tension in
a tumor may decrease or increase during radiation
therapy [20–22]. Additionally, successful results of
experimental studies on tumor oxygenation strategies
do not apply to clinical trials [23–25] necessarily.
Existing methods to measure the efficacy of a tumor
oxygenating treatment in clinical studies are confound-
ed by the heterogeneity of the patients and tumor
response [22,24]. The lack of information regarding
the behavior of individual tumors limits evaluation of
treatment strategies. Noninvasive imaging techniques
capable of detecting and measuring oxygenation sta-
tus are needed to assess hypoxic fraction of tumors.
The advent of new imaging techniques can facilitate
studying the efficacy of adjuvant therapies increasing
tumor oxygenation, identifying patients who might
benefit from radiosensitizers, and planning treatment
such as fractionation of radiation and hypoxia selec-
tive drugs [22,26].
Diagnostic imaging studies for brain tumors
mainly has investigated morphological characteristics
of the tumors and evaluated the response to therapy
based on the changes in tumor size. As the complex
nature of tumor metabolism is investigated, the need
for additional information on the metabolic features of
brain tumors is recognized increasingly. In recent
years, the emphasis of imaging studies is shifted to
evaluation of metabolic activity of brain tumors for
diagnostic purposes and assessment of the response to
therapeutic regimens. Diagnostic and prognostic val-
ues of several tumor characteristics such as vascular-
ization, perfusion, glucose consumption, and oxygen
use have been shown for various tumors. A variety of
invasive and noninvasive methods have been used to
evaluate the oxygenation status of tumors such as
polarographic oxygen microelectrodes [26–29], sin-
gle photon emission tomography [30–33], positron
emission tomography [34–48], MR spectroscopy
[49–53], and MR imaging [24,54–57]. Polarographic
needle allows direct measurement of tumor oxygena-
1052-5149/02/$ – see front matter D 2002, Elsevier Science (USA). All rights reserved.
PII: S1052 -5149 (02 )00029 -1
* Corresponding author.
E-mail address: [email protected]
(F.Z. Yetkin).
Neuroimag Clin N Am 12 (2002) 537–552
Page 2
tion; however, this technique is invasive, and only a
portion of the tumor can be sampled [26–29]. Sen-
sitivity and accuracy of the polarographic needle
measurements have been reported at varying levels
[27]. Existing neuroimaging modalities provide an
indirect evaluation of the brain tumor oxygenation.
Following sections include relevant information on
tumor oxygenation obtained using neuroimaging
modalities and present emerging techniques designed
to image cerebral oxygen saturation in normal and
diseased states.
Radionuclide imaging modalities
Positron emission tomography (PET) is used com-
monly to evaluate metabolic components of brain
tumors. Various radioisotopes are used to evaluate
different aspects of tumors. In an effort to evaluate
tumor oxygenation, nuclear medicine studies have
focused on the development of tissue hypoxia mark-
ers. Azomycin arabinoside, an indicative of hy-
poxia, has been studied in patients with decreased
perfusion as determined with technetium-hexamethyl-
propyleneamine oxime (99mTc-HMPAO) and
patients exhibited an increased avidity for azomycin
[58,59]. Several technical issues are yet to be
resolved, however, such as distinguishing between
marker avidity arising from hypoxic mechanisms
versus tumor perfusion [30].
Positron emitters such as carbon11 [51,60–62],
oxygen15 [41,46,63,], and [18F]Fluoromisonidazole
([18F]FMISO) have been used to assess tumor metab-
olism in PET studies and [18F] flurodeoxygluxcose
has been the most widely used radiotracer to evaluate
glucose metabolism of brain tumors [64]. Tumors
frequently exhibit increased glucose consumption
compared with normal tissue. The suggested mecha-
nisms of increased glucose metabolism in tumors
include increased anaerobic metabolism resulting
from oxygen starvation [35,50,51]. Technical prob-
lems associated with the use of flurodeoxygluxcose
include the difficulties in differentiating normal brain
accumulation from tumor uptake and the detection of
graded uptake of flurodeoxygluxcose in various
lesions such as necrosis, infarct, and inflammatory
lesions [35]. Regional cerebral blood flow, cerebral
blood volume, oxygen extraction fraction, and oxygen
and glucose use in brain tumors are measured quanti-
tatively using the oxygen-15 steady state inhalation
technique [46,65–68]. Several studies have reported
reduced oxygen extraction fraction in tumor tissue.
Lammertsma et al [41], however, showed that tissue
heterogeneity might affect the results of oxygen
extraction fraction in tumors and suggested that the
oxygen-15 steady state has limited value in the assess-
ment of pathophysiology of tumors.
[18F]FMISO is a hypoxia binding radiopharma-
ceutical used for imaging hypoxic regions in tumors
[45]. In vitro studies using [18F]FMISO have shown
the need for very low levels of oxygen for significant
uptake, however, high proportion of hypoxia in a
variety of tumors was reported. The heterogeneity of
oxygenation in individual tumors also was docu-
mented using PET of [18F]FMISO [45].
MR spectroscopy
Proton (1H) and phosphorous (31P) MR spectros-
copy are used to detect in vivo metabolite differences
between the normal brain tissue and tumor. Associa-
tion between the distribution of various metabolite
concentrations and the tumor histology and tumor
grade has been investigated widely [12,50 –53,
69–76]. A limited number of clinical studies have
investigated the correlation between the brain tumor
oxygenation and MR spectroscopy findings.
Proton MR spectroscopy studies include investi-
gations of the association between the MR spectros-
copy findings and the indirect measures of tumor
oxygenation such as regional metabolites [51] and
cerebral blood volume [77]. Proton MR spectroscopy
shows the distributions of various metabolite concen-
trations. N-acetyl-L-aspartate, N-phosphocholine
(choline), and lactate are evaluated frequently for brain
tumors [69,71,76,78–80]. Increased choline and/or
creatinine and decreased N-acetyl-L-aspartate and/or
creatinine reflect the neuronal tissue loss and increased
membrane synthesis that are known to occur in glio-
blastomas and astrocytomas [51]. Lactate is an end
product of glycolysis, a frequent feature of gliomas,
and is reported to increase in brain tumors. The
increased lactate/creatinine ratio in the core of malig-
nant gliomas may reflect the anaerobic glycolysis
possibly in conjunction with hypoxia, whereas, in
the edematous tissue, higher lactate/creatinine ratios
may be the result of hypoxia caused by compromised
regional perfusion [51]. Lactate, however, is not spe-
cific to hypoxia, since it can reflect the dominance of
glycolysis, a frequent feature of glioblastomas. The
lack of correlation between increased tumor metabo-
lism and lactate accumulation as detected with 1H-MR
spectroscopy also was reported, and this finding was
questioned as a possible indication of oxygen depriva-
tion in tumor tissue [50]. In 19 patients with glioma,
comparison of the 1H-MR spectroscopy findings with
the regional cerebral blood volume, an indirect param-
F.Z. Yetkin, D. Mendelsohn / Neuroimag Clin N Am 12 (2002) 537–552538
Page 3
eter of tumor oxygenation, revealed that regional
cerebral blood volumes are proportional to the choline
values in high-grade tumors [77].
Animal models employing different lines of
tumors studied 31P-MR spectroscopy as a tool to
detect tumor metabolism. 31P-MR spectroscopy was
used in evaluating tumor growth [81,82], oxygen
tension (pO2) [83], perfusion [84], and intravascular
oxyhemoglobin concentration [85]. Metabolism of
cell membrane phospholipids is important in monitor-
ing tumors. Phosphomonoester is a precursor, and
phosphodiester is a product of membrane phospho-
lipid metabolism. The ratio of phosphomonoester to
phosphodiester is related to cell membrane synthesis
and metabolic turnover, which are different in tumors
then normal tissue [76]. A negative correlation
between the tumor oxygen tension and ratio of phos-
phomonoester to nucleoside triphosphate was
reported, suggesting that 31P-MR spectroscopy can
detect changes in tumor bioenergetic status. Further
investigation of the rate of glycolysis in tumors under
hypoxic and well-oxygenated conditions in tumor
models, using tumor specific 13C-CP nuclear mag-
netic resonance spectroscopy showed that some line
of tumors can maintain the same level of bioenergetic
status as detected with b nucleoside triphosphate to Piratio under hypoxic conditions, however. Decrease in
the ratio of b nucleoside triphosphate to Pi and
increased lactate levels were not observed until tumor
blood flow was decreased by 90% [86]. The effect of
oxygen and nutrient supply on the global bioenergetic
status of a tumor as measured with the Pi to nucleoside
triphosphate ratio was studied using a glioma model.
The change of tumor metabolism from aerobic to
anaerobic was observed at intravascular distances
larger than approximately 200mm. The Pi to nucleo-
side triphosphate ratio was increased as the mean
intravascular distance increased. Moreover, a linear
relationship between the increased ratio of Pi to
nucleoside triphosphate, and the fraction of the non-
perfused tumor areas was detected [53]. These find-
ings possibly indicate that a major determinant of
tissue oxygenation in the glioma is the limited supply
of oxygen. The results of 31P-MR spectroscopy
experiments obtained with high strength magnets are
not yet translated to applications in humans, however.
MR imaging
Contrast-enhanced MR imaging
There are numerous parameters to characterize
tumor vasculature, including vascular volume, blood
flow, and vascular permeability [87–89]. Neovascu-
larization is essential for tumor growth and is induced
through release of various angiogenic factors such as
vascular endothelial growth factor. Vascular perme-
ability also is promoted by vascular endothelial
growth factor [89,90]. Incidentally, a hypoxic environ-
ment provokes production of vascular endothelial
growth factor. The close linkage between tumor me-
tabolism, hypoxia, angiogenesis, and vascular per-
meability places a special emphasis on enhancement
patterns of brain tumors [52,87,91–93]. T1-weighted
MR images obtained with intravenous gadolinium
diethylenetriamine pentaacetic acid compound con-
trast material administration show the fraction of
tumor capillaries with decreased permeability. Gado-
linium diethylenetriamine pentaacetic acid used for
contrast enhancement is a low molecular weight
agent that easily can leak into interstitial space in
the presence of brain-blood barrier disruption. The
leakage of contrast agent from tumor microvascula-
ture may be limited by decreased flow and perme-
ability of the capillaries [87]. Capillary permeability in
a tumor can be quantified using dynamic T1 measure-
ments [88,89,93,94].
There is a positive correlation between the degree
of decreased permeability of tumor vasculature and
the metastatic potential of a tumor [89,90,95,96]. The
rate of gadolinium diethylenetriamine pentaacetic acid
uptake is proportional to the number of functional
microvessels with a disrupted brain-blood barrier in
gliomas. In a recent study using dynamic T1 mapping,
it was shown that the number of capillaries with
increased permeability correlated with the hypoxic
fraction. Rapidly growing tumors are reported to have
high vascular permeability compared with tumors
with slow growth rates [89].
Gadolinium diethylenetriamine pentaacetic acid
enhancement of tumors is not specific to neovas-
cularization. Presence of enhancement of necrotic
brain tissue decreases the use of contrast enhance-
ment to evaluate the degree of tumor vascular
permeability. Another limitation of T1-weighted con-
trast enhanced MR images is that tumor microvessel
density cannot be determined accurately in the
presence of capillaries without brain-blood barrier
disruption [52,91,97].
Dynamic susceptibility contrast MR imaging
Basic information regarding the pathophysiology
and metabolism of brain tumors is essential to use the
dynamic contrast imaging modalities. The complex
relationship between tumor vascularization, metabo-
lism, hypoxia, and behavior is affected with tumor
F.Z. Yetkin, D. Mendelsohn / Neuroimag Clin N Am 12 (2002) 537–552 539
Page 4
type, grade, and status of treatment [5,20,29,54,
96,98–101].
Tumor hypoxia is related closely to insufficient
blood flow caused by chaotic and partially nonfunc-
tional tumor vasculature [100]. Two forms of hypoxia
are described in tumor tissue: (1) diffusion limited
chronic hyperoxia where the oxygenation of tumor
cells are decreased as their distance from the vessel is
increased and (2) acute hypoxia originating from the
irregularities of the blood flow leading to limited
perfusion around blood vessels [98,100]. In addition
to the chaotic organization and nonfunctional charac-
ters of tumor vessels, a transient perfusion also is
shown in animal tumor models. Tumor vessels that
appear nonfunctional or closed may be open tran-
siently and functional at different times. Existence of
viable tumor cells near nonfunctional tumor vessels
might be explained with this phenomenon. Fluctua-
tions in tumor vessel patency indicate that hypoxia
may occur without the total vascular stasis [98]. The
degree of vascularization and perfusion in a tumor is
not identical. The proportion of vascular structures that
show perfusion varies among animal tumor lines,
ranging from 20% to 80%. The perfusion fraction
per unit tumor area is not a determining factor for
tumor tissue perfusion, since it is not known what
proportion of nonperfused vessels is permanently or
temporarily nonfunctional [96]. The fact that most of
the vascular structures are not perfused at a given time
suggests that extensive areas of tumors are hypoxic
and not accessible by therapeutic agents causing
decreased response to treatment. The relationship
between the morphologic characters of the tumor
vasculature, perfusion, and the level of oxygenation
is a complex issue.
Rijkin et al [100] have provided a sophisticated
digital imaging system that documents the architec-
ture and the functional status of the tumor vascular
network and oxygenation level. The spatial relation-
ship of each physiologic parameter was displayed by
combining the histological images obtained with
markers for vessel, hypoxia, and perfusion. Fig. 1A
is an example of composite digital images obtained
from a whole tumor cross-section, simultaneously
displaying the relationship of vessels, perfusion, and
hypoxic regions. A detailed photograph of a histologic
section after exposure to three different markers is
shown in Fig. 1B. Hypoxic regions are localized at a
distance of 70 mm to 80 mm from the perfused vessels,
and numerous investigators have shown that viable
tumor cells are found in these hypoxic regions [102].
The distance at which oxygen tension falls to zero is
Fig. 1. (A) Pseudocolored image of a human glioma xenograft (E106). Composite digital image is obtained after sequential
scanning for Hoechst perfusion (blue), hypoxia with pimonidazole as a marker (green), and endothelium (red) in tumor sections.
(B) Detailed photograph of a histologic section after triple exposure to same markers. (From Rijken P, Bernsen H, Peters J, et al.
Spatial relationship between hypoxia and the (perfused) vascular network in a human glioma xenograft: a quantitative multi-
parameter analysis. Int J Radiat Oncol Biol Phys 2000;48:571–82; with permission.)
F.Z. Yetkin, D. Mendelsohn / Neuroimag Clin N Am 12 (2002) 537–552540
Page 5
between 80 mm and 180 mm [5,53,96,102]. In addition
to variations in the fraction of perfused vessels, the
architecture of the vessels (ie, the distance and the
order between the capillaries) is known to affect
oxygen gradient. Intercapillary distance is one of the
parameters used in evaluation of tumor vascularity.
The introduction of the dynamic susceptibility
magnetic perfusion technique provides information
additional to that obtained by contrast MR images
[95,100,103–110]. Dynamic susceptibility contrast
MR imaging is based on tracking the passage of an
intravenously injected bolus of contrast media through
the tissue. Relative cerebral blood volume maps
obtained using dynamic susceptibility contrast MR
imaging has been useful in evaluating tumor vascula-
ture shown to correlate with tumor grade [95]. Cere-
bral blood volume maps obtained using dynamic
susceptibility contrast MR imaging display the func-
tional vessels [105]. It is conceivable that cerebral
blood volume maps reveal the status of oxygenation,
especially acute hypoxia in tumors, to some degree,
since many factors affect tumor oxygenation. Gliomas
are resistant to radiation therapy and characterized by
an exceptionally high degree of vascularization [96].
High proportion of hypoxia also is documented [45].
Tumor vessels are disorganized. Tortuous and mostly
larger than normal vessels contain blind ends and
arteriovenous shunts [90]. Microvascular character-
istics of glioma models are studied using high and low
molecular weight MR contrast agents. High molecular
weight contrast agents remain in the intravascular
compartment and have minimal leakage [89,105].
Good correlation between relative cerebral blood
volume estimates, histology, and quantitative auto-
radiography are shown in experiments using T2-
weighted steady state susceptibility contrast MR
imaging with high molecular weight contrast agents
[105]. Low molecular weight contrast material (gado-
linium diethylenetriamine pentaacetic acid), however,
leaks to the interstitial compartment in the presence of
brain-blood barrier disruption, affecting cerebral
blood volume maps.
The MR imaging acquisition technique selected
for dynamic susceptibility contrast MR imaging (ie,
gradient echo or spin echo) affects the size of the
vessels that can be detected [104,105,109]. Spin echo
technique is sensitive to smaller vessels whereas
gradient echo images can image both small and large
vessels. The accuracy of relative cerebral blood vol-
ume maps, therefore, may be underestimated because
of a number of factors such as contrast extravasation
to interstitium, early arteriovenous shunting, or using
spin echo acquisition for cerebral blood volume map-
ping. Presaturation techniques are reported to over-
come the relaxivity effect of T1 shortening and
increase the accuracy of cerebral blood volume maps
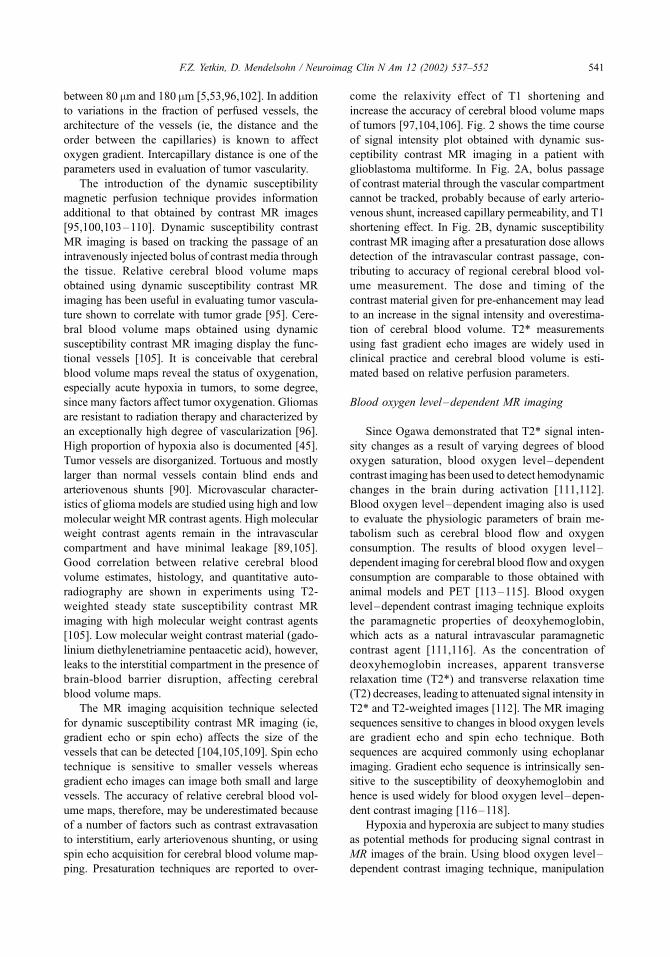
of tumors [97,104,106]. Fig. 2 shows the time course
of signal intensity plot obtained with dynamic sus-
ceptibility contrast MR imaging in a patient with
glioblastoma multiforme. In Fig. 2A, bolus passage
of contrast material through the vascular compartment
cannot be tracked, probably because of early arterio-
venous shunt, increased capillary permeability, and T1
shortening effect. In Fig. 2B, dynamic susceptibility
contrast MR imaging after a presaturation dose allows
detection of the intravascular contrast passage, con-
tributing to accuracy of regional cerebral blood vol-
ume measurement. The dose and timing of the
contrast material given for pre-enhancement may lead
to an increase in the signal intensity and overestima-
tion of cerebral blood volume. T2* measurements
using fast gradient echo images are widely used in
clinical practice and cerebral blood volume is esti-
mated based on relative perfusion parameters.
Blood oxygen level–dependent MR imaging
Since Ogawa demonstrated that T2* signal inten-
sity changes as a result of varying degrees of blood
oxygen saturation, blood oxygen level–dependent
contrast imaging has been used to detect hemodynamic
changes in the brain during activation [111,112].
Blood oxygen level–dependent imaging also is used
to evaluate the physiologic parameters of brain me-
tabolism such as cerebral blood flow and oxygen
consumption. The results of blood oxygen level–
dependent imaging for cerebral blood flow and oxygen
consumption are comparable to those obtained with
animal models and PET [113–115]. Blood oxygen
level–dependent contrast imaging technique exploits
the paramagnetic properties of deoxyhemoglobin,
which acts as a natural intravascular paramagnetic
contrast agent [111,116]. As the concentration of
deoxyhemoglobin increases, apparent transverse
relaxation time (T2*) and transverse relaxation time
(T2) decreases, leading to attenuated signal intensity in
T2* and T2-weighted images [112]. The MR imaging
sequences sensitive to changes in blood oxygen levels
are gradient echo and spin echo technique. Both
sequences are acquired commonly using echoplanar
imaging. Gradient echo sequence is intrinsically sen-
sitive to the susceptibility of deoxyhemoglobin and
hence is used widely for blood oxygen level–depen-
dent contrast imaging [116–118].
Hypoxia and hyperoxia are subject to many studies
as potential methods for producing signal contrast in
MR images of the brain. Using blood oxygen level–
dependent contrast imaging technique, manipulation
F.Z. Yetkin, D. Mendelsohn / Neuroimag Clin N Am 12 (2002) 537–552 541
Page 6
of oxygen content in the inhaled air can provide
qualitative and quantitative information on regional
oxygenation of brain. During hypoxia, concentration
of deoxyhemoglobin is increased and causes decreased
signal intensity on T2*-weighted images. Decreased
signal intensity on T2* images produces a contrast
effect similar to gadolinium diethylenetriamine penta-
acetic acid in the intravascular compartment [119–
122]. Oxygenation, on the other hand, increases local
T2*, causing signal intensity increases [116 –
118,123–125]. The sensitivity of blood oxygen
level–dependent effect has been essential to evaluate
cerebral blood oxygen saturation for a variety of
pathophysiologic conditions in addition to functional
MR imaging.
MR imaging during hyperoxia has been success-
fully used to detect oxygenation of brain tumors
[55,56,126–128]. Inhalation of oxygen or carbogen
decreases blood deoxyhemoglobin concentration
resulting in signal intensity changes on T2* weighted
images. Hemoglobin is saturated almost completely
under normal conditions, and inhalation of 95% to
100% oxygen results in only a small increase in
oxygenation of hemoglobin [116–118,123,124,128].
Signal intensity changes observed during oxygen
inhalation also originate from dissolved oxygen in
Fig. 2. T2* signal intensity changes in a glioblastoma multiforme during injection of gadolinium diethylenetriamine penta-acetic
acid are obtained using a spin echo/echoplanar imaging sequence. The time course of signal intensity changes in the selected
pixels from intact cortex and tumor are displayed in red and black respectively. The tumor pixel was selected from a region with
contrast enhancement. Signal intensity values are expressed in arbitrary units. (A) Early T1 shortening obscuring the transit of
contrast material through vascular compartment. With the advantage of presaturation, the subsequent gradient echo/echoplanar
imaging acquisition from the same tumor pixel exhibited the decrease in signal intensity during passage of gadolinium
diethylenetriamine penta-acetic acid through vascular compartment (B).
F.Z. Yetkin, D. Mendelsohn / Neuroimag Clin N Am 12 (2002) 537–552542
Page 7
the plasma, since the increase in oxyhemoglobin
content is limited. The high magnetic moment of
oxygen is suggested as a cause of image contrast,
since molecular oxygen is a biradical with direct ef-
fect on the relaxation of water proton and has bulk
magnetic susceptibility effect [116,118,123,126]. The
contrast mechanism of blood oxygen level–depend-
ent imaging is affected by changes in blood flow and
blood volume in addition to intravascular magnetic
susceptibility [124]. Signal intensity changes caused
by hyperoxia, however, are dominated by blood
oxygenation, and the effect of blood volume changes
on signal intensity are minimal [116,118, 121,122].
The sensitivity of blood oxygen level–dependent
contrast MR imaging makes it a powerful tool to study
tumor oxygenation in animal models. Hyperoxia
models have been successful in employing blood
oxygen level–dependent contrast imaging. Various
tumor types have been studied to evaluate the correla-
tion between MR signal changes and tissue oxygena-
tion. Compared with normal vessels, tumor vessels
have a significantly different response to changes in
systemic blood pressure, blood flow, and hyperoxia
[56,126–128]. Oxygen causes vasoconstriction in
normal vessels, whereas most tumor vessels lack
smooth muscle and do not show vasoconstriction
resulting in relatively increased vascular volume in
the tumor region [126]. Tumors with high vascular
density are expected to show increased oxygenation
and large signal increase changes. Significant and
reproducible increases in T2* have been reported in
tumors during hyperoxia [24,55–57,126–128]. His-
tologic assessments of the regions with maximum
signal increase during hypoxia reveal low vascular
density without necrosis. It is suggested that increased
oxygen availability during hypoxia can cause
increased blood flow and tissue oxygenation com-
pared with oxygenated regions. Also, oxygen con-
sumption in hypoxic regions of tumors increases
when more oxygen is available, leading to increased
tumor oxygen tension and T2* signal intensity
[56,57,127]. These features of tumor vasculature have
been exploited to evaluate tumor oxygenation. Differ-
ent patterns of tumor behavior in response to hyper-
oxia also are reported. Regions of decreased T2*
during carbogen breathing have been observed within
hypoxic areas as identified by histology [128]. Animal
models using T2* MR measurements under normoxic
and hypoxic conditions provide clinically relevant
information on tumor blood flow, oxygen tension,
and metabolism.
In people, normobaric hyperoxia is used as a
respiratory challenge to study blood oxygen level–
dependent signal changes. Hyperoxia increases para-
sympathetic influence in the regulation of the heart,
causing bradycardia; however, none of the studies
inducing normobaric hyperoxia in people reported
any discomfort caused by oxygen inhalation [129–
131]. The confounding effect of gaseous oxygen on
T2*-weighted images should be controlled during MR
imaging of hypoxia. There is an artifactual increase of
T2* signal obtained from the object of interest when
gaseous oxygen spreads in the MR scanner [132].
During hyperoxia experiments, oxygen delivery by
way of a closed system would prevent erroneous T2*
signal intensity changes caused by an oxygen leak.
T2* signal intensity increases at the gray matter, and
large veins on gradient echo images acquired during
100% oxygen breathing were observed [117,118,129].
The effect of 100% oxygen inhalation on the T1
shortening in the various tissues outside the brain also
was reported [131].
Recently, blood oxygen level–dependent contrast
imaging has been used to map brain oxygenation
[133,134]. Images of the brain oxygenation have been
acquired using gradient echo/echoplanar imaging
acquisition during breathing room air and a brief
period of (30 seconds) of 100% oxygen (7 L per
minute) inhalation in normal adults. T2* signal
increase consistent with the timing of oxygen breath-
ing is observed in the cortex and basal ganglia.
Mapping of regions with increased T2* signal inten-
sity during pure oxygen breathing displays cortex and
Fig. 3. Example of mapping the brain regions with T2*
signal intensity increase during 100% oxygen breathing in a
healthy young adult. The images are acquired gradient echo/
echoplanar imaging sequence. Regions with significant T2*
signal intensity change are displayed in blue.
F.Z. Yetkin, D. Mendelsohn / Neuroimag Clin N Am 12 (2002) 537–552 543
Page 8
F.Z. Yetkin, D. Mendelsohn / Neuroimag Clin N Am 12 (2002) 537–552544
Page 9
basal ganglia similar to cerebral blood volume maps
obtained using dynamic susceptibility contrast per-
fusion images [135]. The increase in the T2* signal
intensity starting with oxygen inhalation and returning
to baseline of breathing room air after cessation of
oxygen breathing was observed in normal brain tissue.
Fig. 3 shows the mapping of brain regions with
increased oxygenation as detected by an increased
T2* signal.
Under normal conditions, interstitial space and
arterial oxygen levels have a linear relationship.
Hyperoxia does not change cerebral blood flow or
capillary permeability. Capillary permeability to oxy-
gen is reported to decrease slightly in response to acute
or prolonged hyperoxia, however [124]. Arterial oxy-
gen tension, cerebral blood flow, capillary permeabil-
ity to oxygen, and oxygen consumption determine
oxygen tension in interstitial space [114,124]. The
increased signal intensity during hyperoxia can be ex-
plained by decreased deoxyhemoglobin and increased
oxygen saturation in plasma [116,118,123]. MR map-
ping of cerebral oxygenation under hyperoxia also is
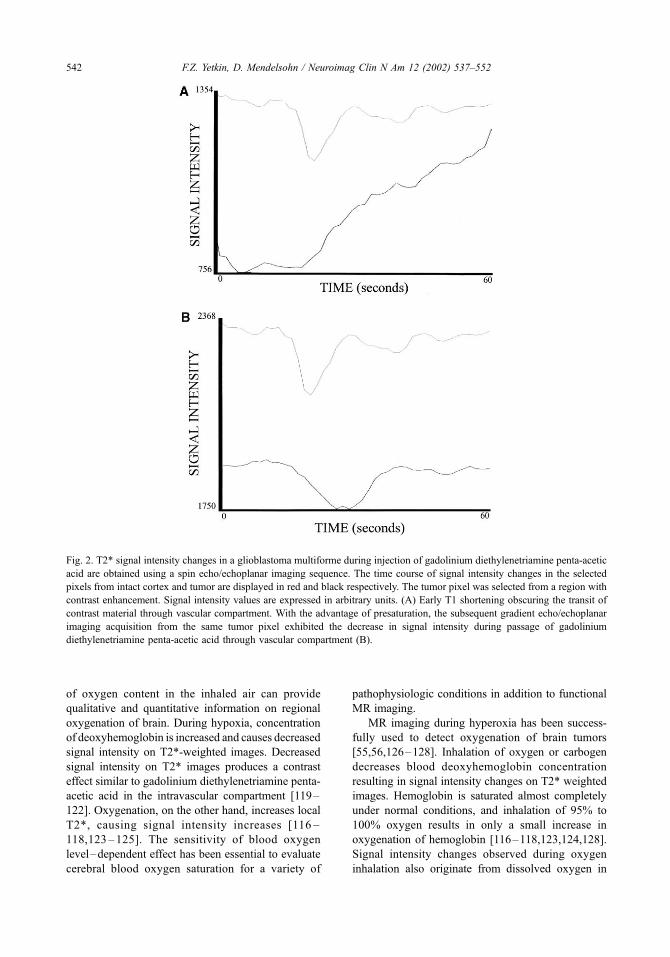
used in patients with brain tumor [133,135]. All
patients displayed signal increases in cortex and basal
ganglia as seen in normal subjects. On the other hand,
changes in the signal intensity of tumors varied among
patients, ranging between no change from baseline to a
heterogeneous distribution of increased T2* signal
over the tumor region (Fig. 4A). The temporal course
of signal intensity change obtained from the tumor
regions displayed different features compared with
that of intact cortex (Fig. 4B, C). The response of the
tumor tissue to hyperoxia may be a function of the
tumor blood flow, oxygenation, and metabolism that
was present under normoxic conditions and provides
more clues on variations of tumor metabolism [126,
127]. In a few cases, tumor regions of increased signal
intensity during hyperoxia were within the regions of
increased cerebral blood volume as detected by sus-
ceptibility perfusion imaging. In some cases, however,
different regions of tumor tissue were displayed for ce-
rebral blood volume maps and oxygen maps, probably
indicating the mismatch between perfusion and oxy-
genation (Fig. 5). This observation of signal increase
caused by oxygen inhalation in regions of tumor with-
out perfusion or no oxygenation in perfused regions
suggests that inhaled oxygen is subject to a different
pathophysiological mechanism than intravascular con-
trast agent. The significance of the additional informa-
tion obtained with oxygen mapping under hyperoxic
conditions merits further investigation.
Animal models and studies on humans successfully
demonstrated that changes in cerebral blood oxygen
saturation can be detected using blood oxygen level–
dependent contrast imaging. Technical difficulties
include variations in the regional cerebral blood flow
and volume [136–138]. The relationship between
various physiologic parameters and cerebral blood
oxygen saturation is studied using blood oxygen
level–dependent effect under a variety of conditions.
Experiments using blood oxygen level–dependent
imaging detected that the relative changes in cerebral
blood flow and cerebral oxygen consumption are
coupled in an approximate ratio of 2:1 and showed
the linear relationship between arterial oxygen tension
and interstitial oxygen tension [114,124]. As different
aspects of the biophysical basis of blood oxygen
level–dependent contrast mechanism are understood
better, the potential for clinical applications will be
increased. MR imaging studies have evaluated cere-
bral blood oxygen saturation in the context of relative
measurements. Attempts to obtain absolute measure-
ments showed the effect of regional cerebral blood
volume variations on the interpretation and quantifica-
tion of T2 and T2 * signal intensity and the importance
of hematocrit level in order to measure blood oxygen
[137,139]. Recently, cerebral oxygen saturation esti-
mated with MR imaging was shown to correlate with
direct measurements of oxygen saturation in the aorta
[140]. Quantification of changes in brain oxygen-
ation would be extremely useful in clinical assess-
ment of ischemic brain disease and brain tumors alike.
Recently, in vivo quantitative mapping of cerebral
oxygenation was accomplished using MR imaging
[141]. In this report, using multiecho gradient and spin
echo sequences, cerebral blood oxygen saturation was
determined as 58.4% F 1.8%, which is in line with
known cerebral blood oxygen saturation under normal
conditions. Their results showed that spatial variations
in cerebral blood oxygen saturation maps were caused
by noise. An overall uniform mapping of cerebral
blood oxygen saturation was obtained, however, and
Fig. 4. (A) Example of blood oxygen level–dependent contrast imaging during 100% oxygen breathing in a patient with
glioblastoma multiforme. (B, C) Regions with significant T2* signal intensity change are displayed in blue. Mapping brain
regions with increased T2* signal intensity shows the increased oxygenation in the cortex and some regions of tumor. The time
course of signal intensity changes in the selected pixels from intact cortex and tumor are displayed. Selected pixel from intact
cortex shows T2* signal intensity change starting with breathing oxygen and returning to baseline immediately after cessation of
oxygen administration (B). (C) Pixel from the tumor region also shows increased signal intensity starting with oxygen
administration. T2* signal intensity, however, displays slow decrease and delayed return to baseline values.
F.Z. Yetkin, D. Mendelsohn / Neuroimag Clin N Am 12 (2002) 537–552 545
Page 10
a lower value for cerebrospinal fluid compared with
that of brain parenchyma was observed. Mapping of
brain oxygenation as detected and quantified using
blood oxygen level–dependent contrast imaging is
shown in Fig. 6. The distribution of cerebral blood
oxygen saturation is displayed in color, red corres-
ponding to regions in which the estimation of cerebral
blood oxygen saturation could not be determined.
Quantification of cerebral blood oxygen saturation
using MR imaging has a promising clinical prospect
as the technical difficulties and confounding factors
are resolved.
Summary
Assessment of the oxygenation status of brain
tumors has been studied increasingly with imaging
techniques in light of recent advances in oncology.
Tumor oxygen tension is a critical factor influencing
the effectiveness of radiation and chemotherapy and
malignant progression. Hypoxic tumors are resistant
to treatment, and prognostic value of tumor oxygen
status is shown in head and neck tumors.
Strategies increasing the tumor oxygenation are
being investigated to overcome the compromising
Fig. 5. Examples of cerebral blood volume mapping obtained with dynamic susceptibility contrast MR imaging and oxygenation
mapping acquired with blood oxygen level–dependent contrast imaging during 100% oxygen breathing in a patient with
recurrent glioblastoma multiforme. (A) Heterogenous contrast enhancement on T1-weighted image. Note the different regions of
brain displayed with cerebral blood volume (B) and oxygenation mapping (C).
F.Z. Yetkin, D. Mendelsohn / Neuroimag Clin N Am 12 (2002) 537–552546
Page 11
effect of hypoxia on tumor treatment. Administration
of nicotinamide and inhalation of various high oxygen
concentrations have been implemented. Existing
methods for assessment of tissue oxygen level are
either invasive or insufficient. Accurate and noninva-
sive means to measure tumor oxygenation are needed
for treatment planning, identification of patients who
might benefit from oxygenation strategies, and assess-
ing the efficacy of interventions aimed to increase the
radiosensitivity of tumors.
Of the various imaging techniques used to assess
tissue oxygenation, MR spectroscopy and MR
imaging are widely available, noninvasive, and clin-
ically applicable techniques.
Tumor hypoxia is related closely to insufficient
blood flow through chaotic and partially nonfunctional
tumor vasculature and the distance between the capil-
laries and the tumor cells. Information on character-
istics of tumor vasculature such as blood volume,
perfusion, and increased capillary permeability can
be provided with MR imaging. MR imaging tech-
niques can provide a measure of capillary permeability
based on contrast enhancement and relative cerebral
blood volume estimates using dynamic susceptibility
MR imaging. Blood oxygen level dependent contrast
MR imaging using gradient echo sequence is intrin-
sically sensitive to changes in blood oxygen level.
Animal models using blood oxygen level–dependent
contrast imaging reveal the different responses of
normal and tumor vasculature under hyperoxia. Nor-
mobaric hyperoxia is used in MR studies as a method
to produce MR contrast in tissues. Increased T2 * sig-
nal intensity of brain tissue has been observed using
blood oxygen level–dependent contrast MR imaging.
Dynamic blood oxygen level–dependent contrast MR
imaging during hyperoxia is suggested to image tumor
oxygenation. Quantification of cerebral oxygen sat-
uration using blood oxygen level–dependent MR
imaging also has been reported. Quantification of
cerebral blood oxygen saturation using MR imaging
has promising clinical applications; however, tech-
nical difficulties have to be resolved.
Blood oxygen level dependent MR imaging is an
emerging technique to evaluate the cerebral blood
oxygen saturation, and it has the potential and versa-
tility to assess oxygenation status of brain tumors.
Upon improvement and validation of current MR
techniques, better diagnostic, prognostic, and treat-
ment monitoring capabilities can be provided for
patients with brain tumors.
References
[1] Cline JM, Thrall DE, Rosner GL, et al. Distribution of
the hypoxia marker CCI-103F in canine tumors. Int J
Radiat Oncol Biol Phys 1944;28:921–33.
[2] Hoeckel M, Schlenger K, Aral B, et al. Association
between tumor hypoxia and malignant progression in
advanced cancer of the uterine cervix. Cancer Res
1996;56:4509–15.
[3] Bussink J, Kaanders JHAM, Rijken PFJW, et al. Vas-
cular architecture and microenvironmental param-
eters in human squamous cell carcinoma xenografts:
effects of carbogen and nicotinamide. Radiother On-
col 1999;50:173–84.
[4] Nordsmark M, Overgaard M, Overgaard J. Pretreat-
ment oxygenation predicts radiation response in ad-
vanced squamous cell carcinoma of the head and
neck. Radiother Oncol 1996;41:31–9.
[5] Bernsen HJJA, Rijken PFJ, Peters H, et al. Hypoxia
in a human intracerebral glioma model. J Neurosurg
2000;93:449–54.
[6] Rockwell S. Oxygen delivery: implications for the bi-
ology and therapy of solid tumors. Oncol Res 1997;
9:383–90.
[7] Fatigante L, Ducci F, Cartei F, et al. Carbogen and
nicotinamide combined with unconventional radio-
therapy in glioblastoma multiforme: a new modality
treatment. Int J Radiat Oncol Biol Phys 1997;37:
499–504.
[8] van der Maazen RWM, Thijssen HOM, Kaanders
Fig. 6. Mapping cerebral blood oxygen saturation using MR
imaging in a healthy volunteer. Color scale indicates the
quantitative measurement of cerebral blood oxygen satu-
ration ranging from 0% to 100%. (From An H, Lin W.
Quantitative measurements of cerebral blood oxygen
saturation using magnetic resonance imaging. J Cereb Blood
Flow Metab 2000;20:1225–36; with permission.)
F.Z. Yetkin, D. Mendelsohn / Neuroimag Clin N Am 12 (2002) 537–552 547
Page 12
JHAM, et al. Conventional radiotherapy combined
with carbogen breathing and nicotinamide for malig-
nant gliomas. Radiother Oncol 1995;35:118–22.
[9] Grau C, Horsman MR, Overgaard J. Improving the
radiation response in a C3H mouse mammary carci-
noma by normobaric oxygen or carbogen breathing.
Int J Radiat Oncol Biol Phys 1992;22:415–9.
[10] Dische S. Hyperbaric oxygen. The medical research
council trials and their clinical significance. Br J Ra-
diol 1978;51:888–94.
[11] Saunders M, Dische S. Clinical results of hypoxic cell
radiosensitisation from hyperbaric oxygen accelerated
radiotherapy, carbogen, nicotinamide. Br J Cancer
1996;74:S271–8.
[12] Shimuzu H, Kumabe T, Tominaga T, et al. Noninva-
sive evaluation of malignancy of brain tumors with
proton MR spectroscopy. AJNR Am J Neuroradiol
1996;17:737–47.
[13] Falk SJ, Ward R, Bleehen NM. The influence of
carbogen breathing on tumour tissue oxygenation in
man evaluated by computerized pO2 histography.
Br J Cancer 1992;66:919–24.
[14] Kruuv JA, Inch WR, McCredie JA. Blood flow and
oxygenation of tumours in mice: effects of breathing
gases containing carbon dioxide at atmospheric pres-
sure. Cancer 1967;20:51–9.
[15] Martin L, Lartigau E, Weeger P, et al. Changes in the
oxygenation of head and neck tumors during carbo-
gen breathing. Radiother Oncol 1993;27:123–30.
[16] Powell MEB, Collingridge DR, Saunders MI, et al.
Improvement in human tumour oxygenation with car-
bogen breathing. Radiother Oncol 1999;50:167–71.
[17] Rojas A. ARCON: accelerated radiotherapy with
carbogen and nicotinamide. Br J Radiol 1992;24:
174–8.
[18] Fenton BM, Raubertas RF, Boyce DJ. Quantification
of micro-regional heterogeneities in tumor oxygena-
tion using intravascular HbO2 saturations. Radiat Res
1995;141:49–56.
[19] Oikawa H, Al-Hallaq HA, Lewis MZ, et al. Spectro-
scopic imaging of water resonance with short repeti-
tion time to study tumor response to hyperoxia. Magn
Reson Med 1997;38:27–32.
[20] Bussink J, Kaanders J, Rijken P, et al. Changes in
blood perfusion and hypoxia after irradiation of a
human squamous cell carcinoma xenograft tumor
line. Radiat Res 2000;153:398–404.
[21] Raleigh JA, Zeman EM, Calkins DP, et al. Distribu-
tion of hypoxia and proliferation associated markers
in spontaneous canine tumors. Acta Oncol 1995;34:
345–9.
[22] Stone HB, Brown JM, Phillips TL, et al. Oxygen in
human tumors: correlations between methods of
measurement and response to therapy. Radiat Res
1993;136:422–34.
[23] Dische S, Rojas A, Rugg T, et al. Carbogen breath-
ing: a system for use in man. Br J Radiol 1992;65:
87–90.
[24] Hallaq-Al HA, River J, Zamora M, et al. Correlation
of magnetic resonance and oxygen microelectrode
measurements of carbogen-induced changes in tumor
oxygenation. Int J Radiat Oncol Biol Phys 1998;41:
151–9.
[25] Rubin P, Hanley J, Keys HM, et al. Carbogen breath-
ing during radiation therapy. Int J Radiat Oncol Biol
Phys 1979;5:1963–70.
[26] Rampling R, Cruickshank G, Lewis AD, et al. Direct
measurement of pO2 distribution and bioreductive
enzymes in human malignant brain tumors. Int J
Radiat Oncol Biol Phys 1994;29:427–31.
[27] Kavanagh MC, Sun A, Hu Q, et al. Comparing
techniques of measuring tumor hypoxia in different
murine tumors: Eppendorf pO2 histograph, [3H]
Misonidazole binding and paired survival assay.
Radiat Res 1996;145:491–500.
[28] Nozue M, Lee I, Yuan F, et al. Interlaboratory varia-
tion in oxygen tension measurement by Eppendorf
‘‘Histograph’’ and comparison with hypoxic marker.
J Surg Oncol 1997;66:30–8.
[29] Pogue BW, Paulsen KD, O’Hara JA, et al. Estimation
of oxygen distribution in RIF-1 tumors by diffusion
model-based interpretation of pimonidazole hypoxia
and eppendorf measurements. Radiat Res 2001;155:
15–25.
[30] Chapman JD, Engelhardt EL, Stobbe CC, et al. Mea-
suring hypoxia and predicting tumor radioresistance
with nuclear medicine assays. Radiother Oncol 1998;
46:229–37.
[31] Groshar D, McEwan A, Parliament MB, et al. Imag-
ing tumor hypoxia and tumor perfusion. Nucl Med
1993;34:885–8.
[32] Hulshof M, Rehmann CJ, Booij J, et al. Lack of
perfusion enhancement after administration of nicoti-
namide and carbogen in patients with glioblastoma:
a 99mTc-HMPAO SPECT study. Radiother Oncol
1998;48:135–42.
[33] Kahn D, Follett KA, Bushnell DL, et al. Diagnosis
of recurrent brain tumor: value of 201Tl SPECT vs.18F-fluorodeoxyglucose PET. AJR Am J Roentgenol
1994;163:1459–65.
[34] Blasberg RG. Prediction of brain tumor therapy
response by PET. J Neurooncol 1994;22:281–6.
[35] Conti PS. Introduction to imaging brain tumor metab-
olism with positron emission tomography (PET).
Cancer Invest 1995;13:244–59.
[36] Di Chiro G, DeLaPaz RL, Briiks RA. Glucose uti-
lization of cerebral gliomas measured by [18] fluoro-
deoxyglucose and positron emission tomography.
Neurology 1982;32:1323–9.
[37] Di Chiro G, Brooks RA, Patronas NJ. Issues in the in
vivo measurement of glucose metabolism of human
central nervous system tumors. Ann Neurol 1984;15:
S138–46.
[38] Eskey CJ, Korestky AP, Domach MM, et al. Role
of oxygen vs. glucose energy metabolism in a
mammary carcinoma perfused ex vivo: direct mea-
surement by 31P NMR. Proc Natl Acad Sci U S A
1993;90:2646–50.
F.Z. Yetkin, D. Mendelsohn / Neuroimag Clin N Am 12 (2002) 537–552548
Page 13
[39] Glantz M, Hoffman JM, Coleman RE, et al. Iden-
tification of early recurrence of primary central
nervous system tumors by [18F]fluorodeoxyglucose
positron emission tomography. Ann Neurol 1991;29:
347–55.
[40] Gross MW, Weber WA, Feldmann HJ, et al. The val-
ue of F-18-fluorodeoxyglucose PET for the 3-D radi-
ation treatment planning of malignant gliomas. Int J
Radiat Oncol Biol Phys 1998;41:989–95.
[41] Lammertsma AA, Jones T. Low oxygen extraction
fraction in tumours measured with the oxygen-15
steady state technique: effect of tissue heterogeneity.
Br J Radiol 1992;65:697–700.
[42] Mineura K, Sasajima T, Kowada M, et al. Perfusion
and metabolism in predicting the survival of patients
with cerebral gliomas. Cancer 1994;73:2386–94.
[43] Mineura K, Shioya H, Kowada M, et al. Blood
flow and metabolism of oligodendrogliomas: a
positron emission tomography study with kinetic
analysis of 18-F-fluorodeoxyglucose. J Neurooncol
1999;43:49–57.
[44] Perlmutter JS, Powers WJ, Herscovitch P, et al. Re-
gional asymmetries of cerebral blood flow, blood vol-
ume, and oxygen utilization and extraction in normal
subjects. J Cereb Blood Flow Metab 1987;7:64–7.
[45] Rasey JS, Koh WJ, Evans ML, et al. Quantifying
regional hypoxia in human tumors with positron
emission tomography of [18F]Fluotromisonidazole:
a pretherapy study of 37 patients. Int J Radiat Oncol
Biol Phys 1996;36:417–28.
[46] Tyler JL, Diksic M, Villemure J, et al. Metabolic and
hemodynamic evaluation of gliomas using positron
emission tomography. J Nucl Med 1987;28: 1123–33.
[47] Witte O, Levivier M, Violon P, et al. Prognostic value
of positron emission tomography with [18F]Fluoro-2-
deoxy-D-glucose in the low-grade glioma. Neurosur-
gery 1996;39:47–77.
[48] Witte O, Lefrane F, Levivier M, et al. FDG-PET as a
prognostic factor in high-grade astrocytoma. J Neuro-
oncol 2000;49:157–63.
[49] Alavi A, Alavi JB, Lenkinski RE. Complementary
roles of PET and MR spectroscopy in the manage-
ment of brain tumors. Radiology 1990;177:617–8.
[50] DeSouza BX, Duhaney MO, Inscoe SW, et al. Me-
tabolism of human gliomas: assessment with H-1 MR
Spectroscopy and F-18 Fluorodeoxyglucose PET. Ra-
diology 1990;177:633–41.
[51] Go KG, Kamman RL, Mooyaart EL, et al. Localised
proton spectroscopy and spectroscopic imaging in
cerebral gliomas with comparison to positron emis-
sion tomography. Neuroradiology 1995;37:198–206.
[52] Nelson SJ, Vigneron DB, Dillon WP. Serial evalua-
tion of patients with brain tumors using volume MRI
and 3D 1H MRSI. NMR Biomed 1999;12:123–38.
[53] Van der Sanden B, Rijken P, Heerschap A, et al. In
vivo 31P magnetic resonance spectroscopy and mor-
phometric analysis of the perfused vascular architec-
ture of human glioma xenografts in nude mice. Br J
Cancer 1997;75:1432–8.
[54] Bussink J, Kaanders J, Rijken P, et al. Multiparam-
eter analysis of vasculature, perfusion and prolifera-
tion in human tumour xenografts. Br J Cancer 1998;
77:57–64.
[55] Hallaq-Al HA, Zamora M, Fish BL, et al. MRI mea-
surements correctly predict the relative effects of tu-
mor oxygenating agents on hypoxic fraction in rodent
BA1112 tumors. Int J Radiat Oncol Biol Phys 2000;
47:481–8.
[56] Karczmar GS, River JN, Vijayakumar S, et al. Effects
of hyperoxia on T *2 and Resonance frequency
weighted magnetic resonance images of rodent tu-
mours. NMR Biomed 1994;7:3–11.
[57] Robinson SP, Howe FA, Griffiths JR. Noninvasive
monitoring of carbogen-induced changes in tumor
blood flow and oxygenation by functional magnetic
resonance imaging. Int J Radiat Oncol Biol Phys
1995;33:855–9.
[58] Parliament MB, Chapman JD, Urtasun RC, et al.
Noninvasive assessment of human tumor hypoxia
with 123I-iodoazomycin arabinoside: preliminary re-
port of a clinical study. Br J Cancer 1992;65:90–5.
[59] Urtasun RC, McEwan AJ, Parliament MB, et al.
Measurement of hypoxia in human tumors by SPECT
imaging iodoazomycin arabinoside. Br J Cancer
1996;74:209–12.
[60] Derlon JM, Bourdet C, Bustany P, et al. [11C]l-me-
thionine uptake in gliomas. Neurosurgery 1989;25:
720–8.
[61] Lilja A, Bergstrom K, Hartvig P, et al. Dynamic study
of supratentorial gliomas with L-methyl-11C-methi-
onine and positron emission tomography. AJNR Am
J Neuroradiol 1985;6:505–14.
[62] Mosskin M, Von Holst H, Bergstrom M, et al. Posi-
tron emission tomography with 11C-methionine and
computed tomography of intracranial tumours com-
pared with histopathologic examination of multiple
biopsies. Acta Radiol 1987;28:673–81.
[63] Mineura K, Sasjima T, Itoch Y, et al. Blood flow and
metabolism of central neurocytoma. A positron emis-
sion tomography study. Cancer 1995;76:1224–32.
[64] Leskinen S, Lapela M, Lindholm P, et al. Metabolic
imaging by positron emission tomography in oncol-
ogy. Ann Med 1997;29:271–4.
[65] Ito M, Lammertsma AA, Wise RJS, et al. Measure-
ment of regional cerebral blood flow and oxygen uti-
lisation in patients with cerebral tumours using 15O
and positron emission tomography: analytical tech-
niques and preliminary results. Neuroradiology 1982;
23:63–74.
[66] Lammertsma AA, Wise RJS, Heather JD, et al. Cor-
rection for the presence of intravascular oxygen15-in
steady-state technique for measuring regional oxygen
extraction ratio in the brain: Results in normal sub-
jects and brain tumour and stroke patients. J Cereb
Blood Flow Metab 1983;3:425–31.
[67] Lammertsma AA, Wise RJS, Cox TCS, et al. Mea-
surement of blood flow, oxygen utilisation, oxygen
extraction ratio, and fractional blood volume in hu-
F.Z. Yetkin, D. Mendelsohn / Neuroimag Clin N Am 12 (2002) 537–552 549
Page 14
man brain tumours and surrounding oedematous tis-
sue. Br J Radiol 1985;58:725–34.
[68] Rhodes CG, Wise RJS, Gibbs JM, et al. In vivo
disturbance of the oxidative metabolism of glucose
in human cerebral gliomas. Ann Neurol 1983;14:
614–26.
[69] Arnold DL, Shoubridge EA, Villemure JG, et al.
Proton and phosphorus magnetic resonance spectro-
scopy of human astrocytomas in vivo. Preliminary
observations on tumor grading. NMR Biomed
1990;3:184–9.
[70] Arnold DL, Emrich JF, Shoubridge EA, et al. Char-
acterization of astrocytomas, meningiomas, and pitui-
tary adenomas by phosphorus magnetic resonance
spectroscopy. J Neurosurg 1991;74:447–53.
[71] Chang L, McBride D, Miller BL, et al. Localized in
vivo 1H magnetic resonance spectroscopy and in vitro
analyses of heterogenous brain tumors. J Neuroimag-
ing 1995;5:157–63.
[72] Edzes HT, Teerlink T, van der Knaap MS, et al.
Analysis of phospholipids in brain tissue by 31P
NMR at different compositions of the solvent system
chloroform-methanol-water. Magn Reson Med 1992;
26:46–59.
[73] Hugg JW, Matson GB, Twieg DB, et al. Phospho-
rus-31 MR spectroscopic imaging (MRSI) of normal
and pathological human brains. Magn Reson Imaging
1992;10:227–43.
[74] Lehnhardt FG, Rohn G, Ernestus RI, et al. 1H and
31P-MR spectroscopy of primary and recurrent hu-
man brain tumors in vitro: malignancy-characteristic
profiles of water soluble and lipophilic spectral com-
ponents. NMR Biomed 2001;14:307–17.
[75] Merchant TE, van der Ven LT, Minsky BD, et al. 31P
NMR phospholipid characterization of intracranial tu-
mors. Brain Res 1994;649:1–6.
[76] Peeling J, Sutherland G. High resolution 1H NMR
spectroscopy studies of extracts of human cerebral
neoplasms. Magn Reson Med 1992;24:123–36.
[77] Henry RG, Vigneron DB, Fischbein N, et al. Com-
parison of MRSI and cerebral blood volume imaging
of gliomas. In: Programs and Abstracts of the 5th
Annual Meeting International Society of Magnetic
Resonance in Medicine. Vancouver, British Colum-
bia, Canada; 1997. p. 1123.
[78] Alger JR, Frank JA, Bizzi A, et al. Metabolism of
human gliomas: assessment with H-1 MR spectros-
copy and F-18 fluorodeoxyglucose PET. Radiology
1990;177:633–41.
[79] Damaerel P, Johannik K, Van Hecke P, et al. Local-
ized 1H NMR spectroscopy in fifty new cases of
newly diagnosed intracranial tumors. J Comput Assist
Tomogr 1991;15:67–76.
[80] Kugel H, Heindel W, Ernestus RI, et al. Human brain
tumors: spectral patterns detected with localized H-1
MR spectroscopy. Radiology 1992;183:701–9.
[81] Okunieff PG, Koutcher JA, Gerweck L, et al. Tumor
size dependent changes in murine fibrosarcoma: use
of in-vivo 31P NMR for non-invasive evaluation of
tumor metabolic status. Int J Radiat Oncol Biol Phys
1986;12:793–9.
[82] Wendland MF, Sujata BI, Karen KF, et al. Correla-
tions between in-vivo 31pMRS measurements, tumor
size, cell survival, and hypoxic fraction in the murine
EMT6 tumor. Magn Reson Med 1992;25:217–32.
[83] Vaupel P, Okunieff P, Kallinowski F, et al. Correla-
tions between 31p-NMR spectroscopy and tissue O2
tension measurements in a murine fibrosarcoma. Ra-
diat Res 1989;120:477–93.
[84] Evelhoch JL, Sapareto SA, Nussbaum GH, et al. Cor-
relations between 31P NMR spectroscopy and 15O
perfusion measurements in the RIF-1 murine tumor
in-vivo. Radiat Res 1986;106:122–31.
[85] Rofstad EK, Demuth P, Fenton BM, et al. 31P nuclear
magnetic resonance spectroscopy studies of tumor
energy metabolism and its relationship to intravessel
oxyhemoglobin saturation status and tumor hypoxia.
Cancer Res 1988;48:5440–6.
[86] Nielson FU, Daugaard P, Bentzen L, et al. Effect of
changing tumor oxygenation on glycolytic metabo-
lism in a murine C3H mammary carcinoma assessed
by in vivo nuclear magnetic resonance spectroscopy.
Cancer Res 2001;61:5318–25.
[87] Taylor JS, Tofts PS, Port R, et al. MRI of tumor
microcirculation: promise for the new millennium.
J Magn Reson Imaging 1999;10:903–7.
[88] Tofts PS, Brix G, Buckley DL, et al. Estimating ki-
netic parameters from dynamic contrast-enhanced T1-
weighetd MRI of a diffusible tracer: standardized
quantities and symbols. J Magn Reson Imaging
1999;10:223–32.
[89] Verhoye M, van der Sanden BPJ, Rijken PFJW, et al.
Assessment of the neovascular permeability in glioma
xenografts by dynamic T1 MRI with gadomer-17.
Magn Reson Med 2002;47:305–13.
[90] Gillies RJ, Bhujwalla ZM, Evelvoch J, et al. Applica-
tions of magnetic resonance in model systems: tumor
biology and physiology. Neoplasia 2000;2:139–51.
[91] Barbier EL, Boer JA, Peters AR, et al. A model of the
dual effect of gadopentate dimeglumine on dynamic
brain magnetic resonance images. J Magn Reson
Imaging 1999;10:242–53.
[92] Goda F, Bacic G, O’hara JA, et al. The relationship
between partial pressure of oxygen and perfusion in
two murine tumors after X-ray irradiation: a com-
bined gadopentate dimeglumine dynamic magnetic
resonance imaging and in vivo electron paramagnetic
resonance oximetry study. Cancer Res 1996;56:
3344–9.
[93] Van der Sanden BPJ, Rozijin TH, Rijken PFWJ, et al.
Noninvasive assessment of the functional neovascu-
lature in 9L-Glioma growing in rat brain by dynamic
1H magnetic resonance imaging of gadolinium up-
take. J Cereb Blood Flow Metab 2000;20:861–70.
[94] Tofts PS, Kermode AG. Measurement of the blood-
brain barrier permeability and leak space using dy-
namic MRI. Fundamental concepts. Magn Reson
Med 1991;17:357–67.
F.Z. Yetkin, D. Mendelsohn / Neuroimag Clin N Am 12 (2002) 537–552550
Page 15
[95] Aronen HJ, Gazit IE, Louis DN, et al. Cerebral blood
volume maps of gliomas: comparison with tumor
grade and histologic findings. Radiology 1994;191:
41–51.
[96] Bernsen H, Rijken P, Oostendorp T, et al. Vascularity
and perfusion of human gliomas xenografted in athy-
mic nude mouse. Br J Cancer 1995;71:721–6.
[97] Donahue K, Krouwer HGJ, Rand SD, et al. Utility of
simultaneously acquired gradient-echo and spin-echo
cerebral blood volume and morphology maps in brain
tumor patients. Magn Reson Med 2000;43:845–53.
[98] Dewhirst MW, Kimura H, Rehmus SW, et al. Micro-
vascular studies on the origins of perfusion-limited
hypoxia. Br J Cancer 1996;27:S247–51.
[99] Fenton BM, Paoni SF, Lee J, et al. Quantification of
tumour vasculature and hypoxia by immunohisto-
chemical staining and HbO2 saturation measure-
ments. Br J Cancer 1999;79:464–71.
[100] Rijken P, Bernsen H, Peters J, et al. Spatial relation-
ship between hypoxia and the (perfused) vascular net-
work in a human glioma xenograft: a quantitative
multi-parameter analysis. Int J Radiat Oncol Biol
Phys 2000;48:571–82.
[101] Vaupel P, Kelleher DK, Hockel M. Oxygenation sta-
tus of malignant tumors: pathogenesis of hypoxia and
significance for tumor therapy. Semin Oncol 2001;
28:29–35.
[102] Van der Sanden B, Heerschap A, Simonetti AW, et al.
Characterization and validation of noninvasive oxy-
gen tension measurements in human glioma xeno-
grafts by 19F-MR relaxometry. Int J Radiat Oncol
Biol Phys 1999;44:649–58.
[103] Boxerman JL, Rosen BR, Weiskoff RM. Signal-to-
noise analysis of cerebral blood volume maps from
dynamic NMRI studies. J Magn Reson Imaging
1997;7:528–37.
[104] Kassner A, Annesley DJ, Zhu XP, et al. Abnormalities
of the contrast re-circulation phase in cerebral tumors
demonstrated using dynamic susceptibility contrast-
enhanced imaging: a possible marker of vascular tor-
tuosity. J Magn Reson Imag 2000;11:103–13.
[105] Le Duc G, Peoch M, Remy C, et al. Use of T2-
weighted susceptibility contrast MRI for mapping
the blood volume in the glioma-bearing rat brain.
Magn Reson Med 1999;42:754–61.
[106] Levin JM, Kaufman MJ, Ross MH, et al. Sequential
dynamic susceptibility contrast MR experiments in
human brain: residual contrast agent effect, steady
state, and hemodynamic perturbation. Magn Reson
Med 1995;34:655–63.
[107] Neeman M, Provenzale JM, Dewhirst MW. Magnetic
resonance imaging applications in the evaluation of
tumor angiogenesis. Semin Radiat Oncol 2001;11:
70–82.
[108] Petrella JR, Provenzale JM. MR perfusion imaging of
the brain: techniques and application. AJR Am J
Roentgenol 2000;175:207–19.
[109] Sugahara T, Korogi Y, Kochi M, et al. Perfusion sen-
sitive MRI of gliomas: comparison between gradient-
echo and spin-echo echo-planar imaging techniques.
AJNR Am J Neuroradiol 2001;22:1306–15.
[110] Wong JC, Provenzale JM, Petrella JR. Perfusion MRI
of brain neoplasms. AJR Am J Roentgenol 2000;174:
1147–57.
[111] Kim S, Ugurbil K. Functional magnetic resonance
imaging of the human brain. J Neurosci Methods
1997;74:229–43.
[112] Ogawa S, Lee TM, Kay AR, et al. Brain magnetic
resonance imaging with contrast dependent on blood
oxygenation. Proc Natl Acad Sci U S A 1990;87:
9868–72.
[113] Hoge RD, Atkinson J, Gill B, et al. Investigation of
BOLD signal dependence on cerebral blood flow and
oxygen consumption: the deoxyhemoglobin dilution
model. Magn Reson Med 1999;42:849–63.
[114] Hyder F, Kennan RP, Kida I, et al. Dependence of
oxygen delivery on blood flow in rat brain: A 7 tesla
nuclear magnetic resonance study. J Cereb Blood
Flow Metab 2000;20:485–98.
[115] Zhu X, Kim S, Anderson P, et al. Simultaneous oxy-
genation and perfusion imaging study of functional
activity in primary visual cortex at different visual
stimulation frequency: quantitative correlation be-
tween BOLD and CBF changes. Magn Reson Med
1998;40:703–11.
[116] Kennan RP, Scanley BE, Gore JC. Physiologic ba-
sis for BOLD MR signal changes due to hypoxia/
hyperoxia: separation of blood volume and mag-
netic susceptibility effects. Magn Reson Med
1997;37:953–6.
[117] Kwong KK, Wanke I, Donahue K, et al. EPI imaging
of global increase of brain MR signal with breath-
hold preceded by breathing O2. Magn Reson Med
1995;33:448–52.
[118] Rostrup E, Larsson HB, Toft PB, et al. Signal
changes in gradient echo images of human brain in-
duced by hypo- and hyperoxia. NMR Biomed 1995;
8:41–7.
[119] deCrespigny A, Wendland MF, Derugin NN, et al.
Real-time observation of transient focal ischemia
and hyperemia in cat brain. Magn Reson Med 1992;
27:391–7.
[120] Houston GC, Papadakis NG, Carpenter TA, et al.
Mapping of the cerebral response to hypoxia mea-
sured using graded asymmetric spin echo EPI. Magn
Reson Imaging 2000;18:1043–54.
[121] Jezzard P, Heineman F, Taylor J, et al. Comparison of
EPI gradient-echo contrast changes in cat brain
caused by respiratory challenges with direct simula-
tion evaluation of cerebral oxygenation via a cranial
window. NMR Biomed 1994;7:35–44.
[122] Turner R, Le Bihan D, Moonen C, et al. Echoplanar
time course MRI of cat brain oxygenation changes.
Magn Reson Med 1991;22:159–66.
[123] Berkowitz BA. Role of dissolved plasma oxygen hy-
peroxia-induced contrast. J Magn Reson Imaging
1997;15:123–6.
[124] Duong T, Iadecola C, Kim S. Effect of hyperoxia,
F.Z. Yetkin, D. Mendelsohn / Neuroimag Clin N Am 12 (2002) 537–552 551
Page 16
hypercapnia, and hypoxia on cerebral interstitial oxy-
gen tension and cerebral blood flow. Magn Reson
Med 2001;45:61–70.
[125] Zhong J, Kennan RF, Fulbright RK, et al. Quantifi-
cation of intravascular and extravascular contribu-
tions to BOLD effects induced by alteration in
oxygenation or intravascular contrast agents. Magn
Reson Med 1996;40:526–36.
[126] Karczmar GS, Kuperman VY, River JN, et al. Mag-
netic resonance measurement of response to hyper-
oxia differentiates tumors from normal tissue and
may be sensitive to oxygen consumption. Invest Ra-
diol 1994;29:S161–3.
[127] Kuperman VYu, River JN, Lewis MZ, et al. Changes
in T2*-weighted images during hyperoxia differenti-
ate tumors from normal tissue. Magn Reson Med
1995;33:318–25.
[128] Robinson SP, Collingridge DR, Howe FA, et al. Tu-
mour response to hypercapnia and hyperoxia moni-
tored by FLOOD magnetic resonance imaging. NMR
Biomed 1999;12:98–106.
[129] Kolbitsch C, Schocke M, Hormann C, et al. Effects of
hyperoxia and hypocapnia on regional venous oxygen
saturation in the primary visual cortex in conscious
humans. Br J Anaesth 1999;83:835–8.
[130] Lund VE, Kentala E, Scheinin H, et al. Heart rate
variability in healthy volunteers during normobaric
and hyperbic hyperoxia. Acta Physiol Scand 1999;
167:29–35.
[131] Tadamura E, Hatabu H, Li W, et al. Effect of oxygen
inhalation on relaxation times in various tissues.
J Magn Reson Imaging 1997;7:220–5.
[132] Bates S, Yetkin Z, Jesmanowicz A, et al. Artifacts in
functional magnetic resonance imaging from gaseous
oxygen. J Magn Reson Imaging 1995;4:443–5.
[133] Yetkin FZ, Mendelsohn D, Purdy P, et al. Magnetic
resonance imaging of oxygenation in human brain
and tumors. Radiology 2001;218:614.
[134] Yetkin Z, Mendelsohn D, Purdy P. Oxygen as a con-
trast agent in brain imaging: technique and MRI char-
acteristics. In: Proceedings of the 39th Annual
Meeting of American Society of Neuroradiology,
Boston: 2001. p. 114.
[135] Yetkin Z, Mendelsohn D, Purdy P, et al. Evaluation of
brain tumor oxygenation using MRI. In: Proceedings
of the 39th Annual Meeting of American Society of
Neuroradiology, Boston (MA): 2001. p. 43.
[136] Lin W, Paczynski R, Celik A, et al. Experimental
hypoxemic hypoxia: Changes in R2* of brain paren-
chyma accurately reflect the combined effects of
changes in arterial and cerebral venous oxygen satu-
ration. Magn Reson Med 1998;39:474–81.
[137] LinW, Celik A, Paczynski RP, et al. Quantitative mag-
netic resonance imaging in experimental hypercapnia:
improvement in the relation between changes in brain
R2* and the oxygen saturation of venous blood after
correction for changes in cerebral blood volume.
J Cereb Blood Flow Metab 1999;19:853–62.
[138] Wright GA, Hu Bob S, Macovski A. Estimating oxy-
gen saturation of blood in vivo with MRI at 1.5 T.
Magn Reson Imaging 1991;1:275–83.
[139] Zijl PCM, Eleff SM, Ulatowski JA, et al. Quantitative
assessment of blood flow, blood volume and blood
oxygenation effects in functional magnetic resonance
imaging. Nat Med 1998;4:159–67.
[140] Foltz WD, Merchant N, Downar E, et al. Coronary
venous oximetry using MRI. Magn Reson Med
1999;42:837–48.
[141] An H, Lin W. Quantitative measurements of cerebral
blood oxygen saturation using magnetic resonance
imaging. J Cereb Blood Flow Metab 2000;20:
1225–36.
F.Z. Yetkin, D. Mendelsohn / Neuroimag Clin N Am 12 (2002) 537–552552