/ I 1: i’, :c?q ~,~;.,?~~~~ii”,,i’ ‘” ,~< -, “~ l,%:,, J,305F$j6 I I I I I I I I 1 I I I I I 1 1 I I DOEEA-0381 Envirhmental Assess-ment Gas Reburning-Sorbent Injection Project at Springfield city Water Light and Power Lakeside Station A Project Proposed By Energy and Environmental Research Corporation 1989 U.S. Department of Energy Assistant Secretary for fossil Energy
Transcript
/ I 1:
i’, :c?q ~,~;.,?~~~~ii”,,i’ ‘” ,~< -, “~ l,%:,,
J,305F$j6
I I I I I I I I 1 I I I I I 1
1 I I
DOEEA-0381
Envirhmental Assess-ment
Gas Reburning-Sorbent Injection Project at Springfield city Water Light and Power Lakeside Station
A Project Proposed By Energy and Environmental Research Corporation
1989
U.S. Department of Energy Assistant Secretary for fossil Energy
I I
ENVIRONMENTAL ASSESSMENT
FOR ENHANCING THE USE OF EASTERN AND MIDWESTERN COALS
BY GAS REBURNING-SORBENT INJECTION AT CWLP LAKESIDE STATION, BOILER NO. 7
September 1989
Prepared for
PITTSBURGH ENERGY TECHNOLOGY CENTER
TABLE OF CONTENTS
Section
1.
2.
3.
INTRODUCTION .......................
PROPOSED ACTION AND ALTERNATIVES. ............. 2.1 PROPOSED ACTION. ...................
2.1.1 Site Description. ............... 2.1.2 Existing Plant Operation. ........... 2.1.3 Engineering Description of the Proposed Action. 2.1.4 Project Source Terms. .............
2.2 ALTERNATIVES TO THE PROPOSED ACTION. ......... 2.2.1 The No Action Alternative ........... 2.2.2 Alternative Technologies. ........... 2.2.3 Alternative Sites ...............
EXISTING ENVIRONMENT. ................... 3.1 ATMOSPHERIC RESOURCES. ................ 3.2 LAND RESOURCES .................... 3.3 WATER RESOURCES. ................... 3.4 ECOLOGICAL RESOURCES ................. 3.5 SOCIOECONOMIC RESOURCES. 3.6 ENERGY AND MATERIALS RESOURCES ..................... : : :
4.1.1 Atmospheric Impacts ............... 4.1.2 Land Impacts. .................. 4.1.3 Water Quality Impacts .............. 4.1.4 Ecological Impacts. ............... 4.1.5 Socioeconomic Impacts .............. 4.1.6 Energy and Materials Impacts. .......... 4.1.7 Impact Summary. .................
4.2 IMPACTS OF THE ALTERNATIVES. .............. 4.2.1 No Action .................... 4.2.2 Alternative Technologies. ............ 4.2.3 Alternative Sites ................
Clean Coal Technology Code of Federal Regulations Central Illinois Light Company City Water Light & Power (U.S.) Department of Energy Energy and Environmental Research Corporation Environmental, Health, Safety, and Socioeconomic Illinois Department of Energy and Natural Resources (U.S.) Environmental Protection Agency Electric Power Research Institute Electrostatic Precipitator Federal Register grams/liter Gas Reburning with Sorbent Injection Illinois Environmental Protection Agency Million British thermal units Million Gallons per Day Milligrams per liter Million Gallons per Year Mega Watts of energy National Environmental Policy Act (1970) Nitrogen dioxide Nitrogen oxides National Pollutant Discharge Elimination System New Source Performance Standards National Technical Information Service Occupational Safety and Health Administration Program Opportunity Notice Pounds per square inch gauge Resource Conservation and Recovery Act (1976) Standard cubic feet per minute Sulfur dioxide Sulfur oxides Tons per year Total Suspended Particulates Total Suspended Solids
In December 1985, Congress made funds available for a Clean Coal
Technology (CCT) Program in Public Law No. 99-190, An Act Making
Appropriations for the Department of Interior and Related Agencies for the
Fiscal Year Ending September 30, 1986, and for Other Purposes. This Act provided funds... "for the purpose of conducting cost-shared Clean Coal Technology projects for the construction and operation of facilities to
demonstrate the feasibility for future commercial applications of such
technology...", and authorized DOE to conduct the CCT program. DOE issued a
Program Opportunity Notice (PON) on February 17, 1986, to solicit proposals for conducting cost-shared CCT demonstrations.
An overall strategy for compliance with the National Environmental Policy Act (NEPA) was developed for the CCT Program consistent with the Council on Environmental Quality NEPA regulations (40 CFR 1500-1508) and the DOE guidelines for compliance with NEPA (52 FR 47662, December 15, 1987). This strategy includes both programmatic and project-specific environmental
impact considerations, during and subsequent to the selection process. This
strategy has three major elements. The first involves preparation of a
comparative programmatic environmental impact analysis', based on information provided by the offerors and supplemented by DOE, as necessary. This
environmental analysis ensures that relevant environmental consequences of the
CCT Program and reasonable programmatic alternatives are evaluated in the selection process.
The second element involves preparation of a pre-selection project-
specific environmental review based on project-specific environmental data and
analyses that offerors supplied as a part of their proposal. This analysis
contained a discussion of the site-specific environmental, health, safety, and socioeconomics issues associated with the demonstration project. It included, to the maximum extent possible, a discussion of alternative sites and/or processes reasonably available to the offeror, a discussion of the environmental impacts of the proposed project and practical mitigating
measures, and a list of permits, to the extent known, that must be obtained to
l-l
implement the proposal. It also contained the strengths and weaknesses of
each proposal relative to the demonstration project environmental and site- related criterion.
The third element provides for preparation by DOE of site-specific documents for each project selected for financial assistance under the PON.
This Environmental Assessment describes the actions to be taken at one of the CCT project sites.
After considering the evaluation criteria, the program policy'
factors, and the NEPA strategy, the proposal submitted by Energy and
Environmental Research Corporation (EER), Irvine, California, was one of the proposals selected for award.
EER proposes to demonstrate that Gas Reburning and Sorbent Injection (GR-SI), a control technology for the acid rain precursors, SO2 and NO,, is
suitable for retrofit applications, particularly in utility plants constructed before New Source Performance Standards went into effect. The goal of this
program is to prove the technical and economical feasibility of the GR-SI
technology. If successful, it will achieve up to 60% NO, and 50% or more SO2 reduction at about the same cost as wet flue gas desulfurization processes
which capture only SO2.
Gas Reburning-Sorbent Injection is a two part process in which gas reburning is used to control NOx while sorbent injection is used to control
so2. Nitrogen oxides, or NO,, are formed when nitrogen included in the fuel,
oxidizes or when nitrogen contained in the combustion air is oxidized.
Special combustion techniques are required to reduce NO, formation and
emissions and one that has been developed is gas reburning (GR), part of the
GR-SI process. This process is applicable to all types of combustors currently used for firing pulverized coal. In gas reburning, NO, is reduced to molecular nitrogen (N2).
l-2
The primary fuel is coal and the reburning fuel is natural gas. The use of natural gas instead of a coal or oil as the reburning fuel avoids
introduction of additional fuel bound nitrogen into the process.~ Additional
air is injected above the reburning zone to burn the fuel fragments and this
produces water vapor and carbon dioxide.
The net effect of this combustion technique is up to a 60% reduction in NO, formation without increases in the emission of other undesirable
chemical compounds or a waste of fuel. In addition, since natural gas
contains no sulfur, there is a reduction in SO2 emissions commensurate with the fraction of gas fired.
Sulfur oxides, predominantly SO2, are formed from the oxidation of
sulfur compounds in the coal and its ash. The SO2, if not controlled, is
discharged to the atmosphere with the balance of the flue gas. One method of removing the SO2 is by dry sorbent (lime) injection as used in this process. In the GR-SI process, sorbent is injected into the flue gas in the upper part
of the boiler combustion zone. After absorbing the SO2, the spent sorbent is
removed in an electrostatic precipitator (ESP).
The technology demonstration program to be conducted by EER will
focus on three Illinois utility boilers representing an appropriate the range
of boiler technology in existing electric utility plants:
0 Illinois Power Company (IP), Hennepin Station, Unit 1; 71 MWe
(net) Tangentially-Fired
0 Central Illinois Light Company (CILCO), Edwards Station, Unit 1;
117 MWe (net) Front Wall-Fired
0 City Water Light & Power (CWLP), Lakeside Station Unit 7; 33 MWe (net) Cyclone-Fired
1-3
For all three test sites, the nominal test design basis is for 15
percent of the heat input obtained by gas firing and 85 percent by coal
firing. Due to the lower coal consumption, the quantity of bottom ash is
reduced and, due to sorbent injection, the amount of precipitator solid waste
is increased. The net 'impact is an increase in solid waste.
This Environmental Assessment describes the actions to be taken at Lakeside Station and the environmental impacts of these actions.
l-4
2. PROPOSED ACTION AND ALTERNATIVES
This section describes the existing facility at Lakeside Station,
presents a brief technical description of the GR-SI technology demonstration
project, describes anticipated project activities, and defines project
resource requirements and discharges.
2.1 PROPOSED ACTION
2.1.1 Site Descriotion
Lakeside Station and the adjacent Dallman Station occupy a 75-acre
site on the northwest shore of Lake Springfield, in the southeast section of
the city of Springfield in Sangamon County, Illinois. Figure 2-l shows the
location of Springfield and Sangamon County (shaded) in Illinois. Figure 2-2
provides additional detail regarding the CWLP plant location with respect to the city and other regional features. Both stations are owned and operated by
CWLP. Since the GR-SI project will be conducted in Unit 7 of Lakeside Station, the discussion in this volume is focused toward Lakeside Station.
However, the proximity to Dallman Station and the use of some of the same
facilities (e.g., ash disposal ponds) necessitates inclusion of some relevant
background information for Dallman Station. In this volume, "CWLP plant"
refers to both stations combined. The individual stations are referred to by
name.
The layout of the CWLP plant is illustrated in the aerial view of Figure 2-3. The building in the upper right (northeast) portion of the
photograph houses the Lakeside Station boilers and generators. Dallman
Station is located slightly below center on the right side of the photo. Lake
Springfield borders the plant on the east, south and southwest. U.S.
Interstate Highway 55 and Adlai Stevenson Drive comprise the plant boundaries on the west and north, respectively. The CWLP plant also contains a water
treatment plant, shown just above the center of Figure 2-3. A second aerial
photograph, included as Figure 2-4, shows the ash disposal area located due
north of Lake Springfield, separated by the Spaulding Dam. Ash from Lakeside
Figure 2-1. Location of Springfield and Sangamon County in Illinois
2-2
, 1 I III
L
2-3
1000 Ft O-
Figure 2-3. Aerial View of CWLP Lakeside and Dallman Stations
2-4
0 loo0 2000 Ft I i
Figure 2-4. Aerial View of Lakeside/Dallman Ash Disposal Area
2-5
Station is currently sluiced to the large quadrilateral pond located just
above the center of the photo. The smaller triangular pond directly below the
Lakeside ash pond is used as a secondary clarification pond. The discharge
structure to Sugar Creek can be seen on the left side of the clarification
pond. Sugar Creek begins at the Spaulding Dam spillway (left end of the dam)
and traverses the west and north boundaries of the ash disposal site. Beyond the photograph, Sugar Creek continues in a meandering path until it empties into the Sangamon River, about 5 miles northeast of the CWLP plant. The three
impoundments located to the right of the Lakeside ash pond are the dry
landfill cells that are currently used for disposal of dewatered scrubber
sludge from Dallman Station. Additional Lakeside Station site features are
identified on the station plot plan presented in Figure 2-5.
Lakeside Station is accessible by rail and truck. The Illinois
Terminal, Gulf Mobile and Ohio, Illinois Central, Norfolk and Western, and
Baltimore and Ohio Railroads all have traffic lines running within 3 miles of
the plant site. An Illinois Terminal Railroad spur line is in place and
operational though not used. Interstate Highway 55 runs adjacent to the plant site. Water supplies for Lakeside Station ares taken from Lake Springfield.
CWLP also operates a water treatment plant on the site which supplies potable water to the Lakeside Station and to the entire city of Springfield. A major
gas pipeline currently provides natural gas to the Dallman Station on the
south end of the site.
Lakeside Station has three operational electrical generating units.
The GR-SI technology demonstration will be conducted in Unit 7. All of the
boilers at Lakeside and Dallman stations burn bituminous coal from Logan County, located about 15 miles northeast of Springfield. This coal (as received) contains 9.1 percent ash and 2.7 percent sulfur, and has a heating
value of 10,400 Btu/lb. Coal is delivered to Lakeside Station by truck and
unloaded into a storage pile in which a minimal reserve capacity is maintained. Lakeside coal pile runoff is intermittent (i.e., runoff occurs
only during and after precipitation) and has an annualized average flow rate
of 0.019 million gallons per day (MGD), based on measurements made by CWLP
2-6
held
Coal //V/ storage
From Dallman SI tation'
Approximate Scale (feet) 190 0 100 200
Figure 2-5. Existing Lakeside Station Plot Plan
2-7
personnel. Runoff is collected in a pond, and pond water is discharged into
Lake Springfield under the plant NPDES permit.
2.1.2 Existina
Lakeside Station currently operates two coal-fired steam electric
generating units with a total net generating capacity of 66 MW,. Two
additional 20 MW, units are licensed but have not been used in the past five
years. The project will be conducted in Unit 7, a 33 MW, cyclone-fired
boiler. Based on the Unit 7 peak net generating capacity of 39.8 MW,, the
full load coal firing capacity of Unit 7 is approximately 39,700 lb/hr. Plant
records indicate that in 1986 Unit 7 fired 41,700 tons of coal, and the two
generating stations on the CWLP site fired 815,000 tons of coal. Therefore, in 1986, Unit 7 accounted for about 5.1 percent of the coal usage for Lakeside
and Dallman stations. The Lakeside Unit 7 capacity factor for 1986 was 24.0
percent.
An electrostatic precipitator (ESP) is used to control particulate
emissions. The ESP is a cold side unit, i.e. it operates downstream of the
air preheater. The ESP, which serves all three units in Lakeside Station, has
a specific collection area (SCA) ranging from 333-1000 ft2/(1000 ft3/min), depending on the number of units in operation at a given time.
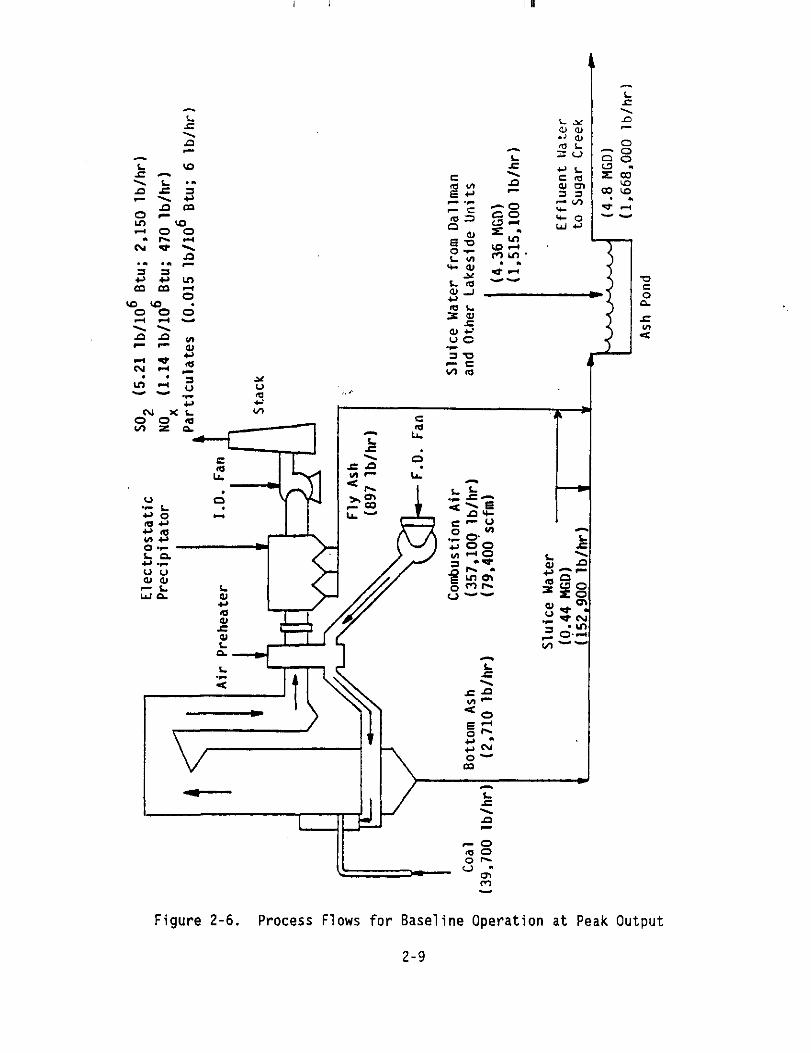
Solid waste streams from the boiler include the fly ash collected by
the plant ESP and the furnace bottom ash. These waste streams are exempted
from RCRA Subtitle C Hazardous Waste regulations by 40 CFR Part 261.4(b)(4).
Based on 1) the full load coal firing rate (39,700 lb/hr), 2) the coal ash
content (9.10 percent), 3) CWLP data indicating that 75 percent of the ash
leaves the furnace as bottom ash while the remaining 25 percent goes to fly
ash, and 4) the measured (1987) full load particulate emission rate (6 lb/hr), the approximate rate of production of fly ash from Unit 7 during full load
operation is 897 lb/hr. On the same basis, the approximate full load flow rate of bottom ash to the ash pond is 2710 lb/hr. These flow rates are presented in the form of a process flow diagram in Figure 2-6, representing
the baseline conditions for Unit 7 at full load. Based on the 1986 Unit 7
2-8
< L .I f!f3
om 51’ - 0% -I-r( N-4 .I .” fi
23, ..” -
Figure 2-6. Process Flows for Baseline Operation at Peak Output
2-9
coal consumption reported by the plant (41,700 tons) and the coal ash content
(9.10 percent), Unit 7 generated approximately 3795 tons of ash in 1986.
Assuming that ESP emissions are a constant 0.015 lb/MBtu (based on
precipitator evaluation tests conducted in June, 1987) the approximate
distribution of the ash generated by Unit 7 in 1986 was:
bottom ash - to pond fly ash - to pond
;;;6t;yWear (tpy)
fly ash - stack emissions 6.3 tpy
These ash generation data are presented in the form of a process flow diagram
in Figure 2-7, representing annual process flows based on Lakeside Station
1986 operating data. The British Petroleum Coal Handbook indicates that
typical furnace bottom ash dry densities range from 40 to 53 lb/ft3 while
typical dry fly ash ranges from 42 to 65 lb/ft3. Thus, ash volumes for
Lakeside Unit 7 were calculated using the high end of the dry density range as
a conservative best estimate, i.e. bottom ash and fly ash densities of 53
lb/ft3 and 65 lb/ft3, respectively. Based on these densities, the gravimetric ash data presented above represent 107,400 ft3/yr (2.47 acre-ft/yr) of bottom
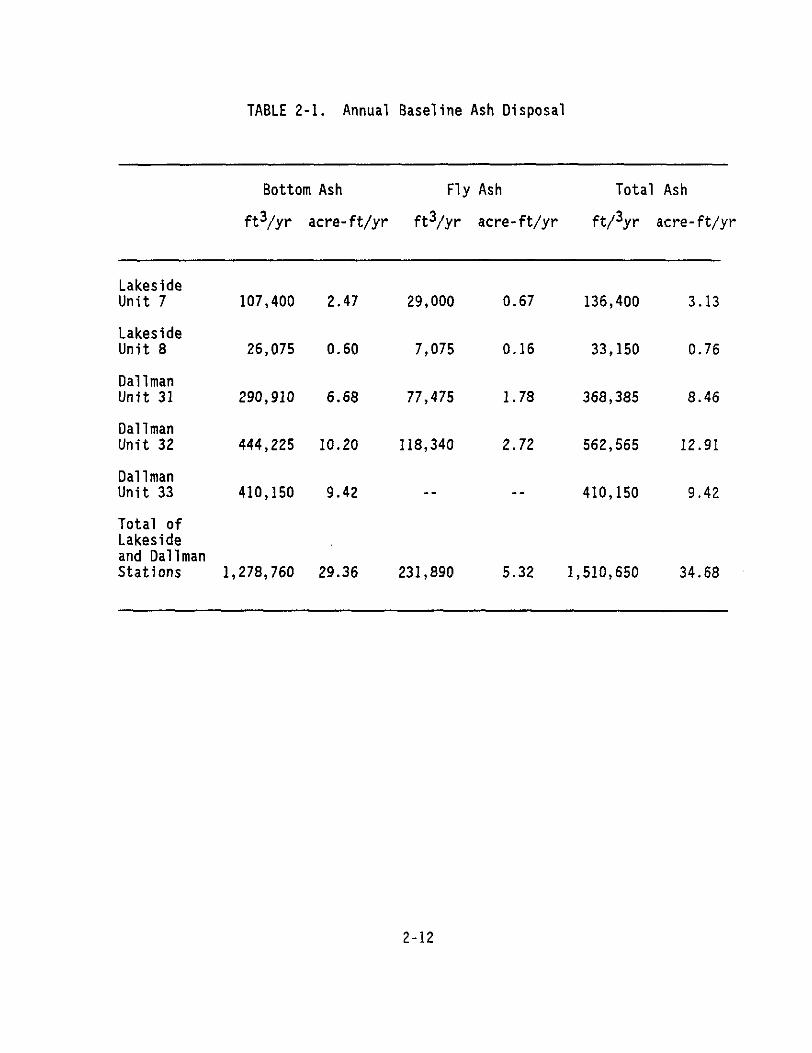
ash and 29,000 ft3/yr (0.67 acre-ft/yr) of fly ash. Based on CWLP 1986 operating data, the total bottom and fly ash quantities sluiced to the ash
pond from all units at Lakeside and Dallman Stations were calculated. These
data, presented in Table 2-1, indicate that Lakeside Unit 7 accounted for
approximately 9.0 percent of the total ash sluiced to the pond in 1986. The
fly ash from Dallman Unit 33 was not included in the Table since this unit is
equipped with a wet scrubber to collect the fly ash. The scrubber sludge is
disposed dry into separate landfill cells at the ash disposal site. It should
be noted that Dallman Unit 33 is wall-fired, while Units 31 and 32 are
cyclone-fired.
The waste disposal site is located immediately to the north of Lake
Springfield. The disposal site includes three ash ponds for wet disposal of bottom ash from the two stations, and three clay-lined dry landfill cells used for disposal of dewatered flue gas desulfurization sludge from Dallman
Station. The ash pond receiving waste from Lakeside Unit 7 is shown in Figure
2-4. The pond covers approximately 40 acres and is reported by CWLP to have a
remaining life of six years. The discharge from the pond is routed through a
2-10
T- “3; %* 4
5 - -
,, 4
-0 zs = Y; cue mm I= ^” -1
Figure 2-7. Process Flows for Baseline Operation - 1986 Annual Data
Lakeside Unit 7 107,400 2.47 29,000 0.67 136,400 3.13
Lakeside Unit 8 26,075 0.60 7,075 0.16 33,150 0.76
Dallman Unit 31 290,910 6.68 77,475 I.78 368,385 8.46
Dallman Unit 32 444,225 10.20 118,340 2.72 562,565 12.91
Dallman Unit 33 410,150 9.42 -- -- 410,150 9.42
Total of Lakeside and Dallman Stations 1,278,760 29.36 231,890 5.32 1,510,650 34.68
2-12
triangular shaped clarification pond of nine acres before being discharged to Sugar Creek. The three waste landfill cells, to the east of the ash pond
encompass a total area of 33 acres. Two are currently empty, and the third is
filled to approximately one-third capacity with dewatered scrubber sludge from
Dallman Station.
Process water from Lake Springfield is currently used for cooling
applications and for transporting fly ash and bottom ash. Cooling water is pumped once through condenser tubes which cool the steam from the turbines
back to water. The cooling water does not come into direct contact with the
boiler water. Process water flow rates as measured by the utility are
summarized in Table 2-2. The Lakeside coal pile runoff pond has approximately
600,000 gallon capacity, and catches runoff from three areas: a parking area,
a site access road, and the Lakeside coal handling/storage area. Discharge
from the pond is intermittent and controlled; current procedure calls for a
24-48 hour settling time after a major precipitation event. The pond is then
drained and sampled according to NPDES permit provisions. Based on measurements made by CWLP personnel, the annualized average flow rate for 1987 was 0.019 MGD, with actual discharges occurring during five months. The average flow for these five months was 0.046 MGD. Documentation from CWLP
supporting these data are included in Appendix B. The Unit 7 sluice water
requirement averages 0.44 MGD. Effluent water from the ash pond is discharged
under an NPDES permit into Sugar Creek, which runs from Lake Springfield to
the Sangamon River. The NPDES permit for the combined Dallman and Lakeside
discharge requires the plant to file monthly effluent water quality monitoring
reports detailing flow rate, pH, total suspended solids, and amounts of oil
and grease in the effluent from all Lakeside and Dallman units. Average values of these parameters for 1986, as determined from monthly reports, are
presented in Table 2-3. Current ash pond sulfate concentration is about 0.32
g/l * Based on the full load coal firing rate and the coal elemental
analysis, the stoichiometric combustion air requirement for Unit 7 is approximately 310,500 lb/hr, or about 69,000 standard cubic feet per minute
(scfm). Lakeside Unit 7 typically operates at 15 percent excess air; thus,
typical full load air consumption is approximately 357,100 lb/hr (79,400 Table
2-13
TABLE 2-2. Process Water Flow Rates
Source Flow Rate (MGD - million qallons Der day)
Lakeside Circulating Boiler Water
Lakeside Cooling Water
Unit 7 Sluice Water
Lakeside Coal Pile Runoff
0.92
290.0
0.44
0.019 (intermittent)
2-14
TABLE 2-3. Average Ash Pond Effluent Water Parameters in 1986*
Parameter High Low Average Permit Limit
Flow Rate (MGD) 7.05 2.88 4.80 --
PH 9.06 8.40 8.77 6.0-9.0
TSS (w/l) 14.88 6.20 9.88 15.0
Oils/grease (mg/l) 3.30 0.05 1.10 15.0
*from all Lakeside and Dallman Units
2-15
scfm), as indicated in Figure 2-6. Air emissions of potential concern for the
GR-SI project include S02, NO,, and particulates. Based on the full load coal
firing rate for Unit 7 (39,700 lb/hr) and the as-fired coal sulfur content
(2.7 percent), and assuming 100 percent conversion of coal sulfur to S02, the
full load SO2 emission rate is approximately 2150 lb/hr (5.21 lb/MBtu).
Preliminary baseline emissions tests conducted by Clean Air Engineering at
Unit 7 in April, 1988 indicated that Unit 7 NO, emissions average about 470
lb/hr (1.14 lb/MBtu). Based on ESP performance tests conducted in June, 1987
by Clean Air Engineering, the full load particulate emission rate for Unit 7
is approximately 6 lb/hr (0.015 lb/MBtu).
2.1.3 Enqineerinq Description of the Prooosed Action
The objectives of the project are to provide a comprehensive data
base of full-scale experience demonstrating the performance of GR-SI in pre-
NSPS utility boiler applications and to promote commercialization of this combination of technologies. Figure 2-8 illustrates the application of GR-SI
to a cyclone fired boiler. Natural gas is injected above the main heat
release zone to reburn NO that is produced in that zone. NO is reduced by a
hydrocarbon radical (CH) producing HCN which allows the formation of NH via
NCO. Molecular nitrogen is produced by the reaction of NO with N at high
temperature and with NH2 at lower temperatures (<2200°F). The GR-SI system will provide 60 percent NO, control, which can be attributed to reductions during the reburning process as well as from reductions due to lower coal
usage. The pre-NSPS Lakeside unit does not have an NO, emission regulatory
constraint. Thus, this NO, emission reduction could be useful to the plant in
response to potential future NO, regulations.
The sorbent will be injected into the upper furnace. For the cyclone
fired Unit 7 boiler, the SO2 strategy will be to reduce SO2 emissions by 50
percent while firing the existing Illinois coal. This emission reduction is not required by existing regulations but could be used for compliance with any future SO2 regulations. Sorbent injection will increase the amount of solid material in the flue gas; thus, the amount of solid waste being generated will
increase.
2-16
1 .to precipitator
?--rLT
\ \ I , .
: ,
Overfire air
V
Sorbent System
Figure 2-8. Application of Gas Reburning-Sorbent Injection for NO,/S02 Control
2-17
The solid waste from GR-SI is a blend of spent and unreacted calcium-
based sorbent with fly ash which, due to the presence of unreacted lime, has
similar characteristics to lime/fly ash/scrubber sludge prepared for sludge
disposal or the solid product from lime-based spray dryer systems. The fly
ash will be managed by using dry transport to a permitted off-site landfill.
Bottom ash will continue to be sluiced approximately 0.25 miles to the
existing on-site ash pond.
The on-site installation work will be divided into two steps: an
initial installation step where all work is conducted during normal unit
operation and the final installation step which requires a unit outage. The
following equipment will be installed during normal unit operation:
1. Sorbent unloading and storage equipment
2. Sorbent feeding and transport equipment
3. Sorbent piping and injection equipment assembly 4. Sorbent injection control assembly
5. Gas piping and controls assembly
6. Gas injector assembly
7. Instrumentation installation except for final connections
A plot plan of Lakeside Station showing the location of the sorbent storage
silo is shown in Figure 2-9.
The intent is to complete the initial installation in time to provide flexibility on completing the final installation during a scheduled outage.
The following equipment must be installed during an outage:
1. Windbox modifications 2. Furnace or duct penetrations for gas injectors, overfire air
ports or sorbent injectors 3. Final connections for control equipment 4. Final gas plumbing 5. Final instrumentation connections 6. ESP upgrades, if required
2-18
N A Ash
* Disposal
Lipe - \ /or Building
( Pond \
LAKESIDE (Cyclone)
From Dallman Station
Approximate Scale (feet)
1p0 P 190 30
Figure 2-9. Proposed Plot Plan of Lakeside Station
2-19
Boiler tubes are lined with asbestos to minimize heat loss, and some
asbestos handling will be required. All boiler modification work will be
conducted by a contractor qualified to work with asbestos materials. EER will
include in the contractor's specifications a requirement that all applicable
OSHA and EPA regulations be satisfied, including asbestos removal guidelines,
air monitoring requirements, and proper disposal considerations.
A feeder pipeline, 1400 feet long, will be constructed connecting
Unit 7 to the existing natural gas pipeline at the west boundary of the site.
Construction of the natural gas pipeline at Lakeside Station will include the
following steps:
0 Final route selection
0 Materials and equipment procurement 0 Excavation
0 Pipefitting
Each of these steps will be coordinated by CILCO, owner of the trunk pipeline
and will occur during Phase 2 of the demonstration project. The tentative
route selected for installation of the Lakeside Station natural gas pipeline is shown in Figure 2-10. This route lies entirely within the boundaries of the CWLP plant. The pipeline installation will be conducted by the Gas
Division of CILCO. The materials and equipment required for the pipeline
construction include piping, fittings, welding supplies, excavation equipment,
and material handling equipment. All materials will meet applicable
codes and common industrial practices will be matched. Pipeline construction will require excavation of a trench approximately two feet wide and four feet
deep. A clearance path, 33 feet wide, is required for equipment access. The pipeline will be routed to convenient termination adjacent to Unit 7.
2-20
) \ pp.‘.“.” ‘1 ’ //. Approximate Scale (feet
500 0 I 5po
N 4
lo)00
Figure Z-10. Tentative Route of Natural Gas Pipeline to Lakeside Station
2-21
2.1.4 Pro.iect
This section characterizes all of the source terms of the GR-SI
technology demonstration project. Source terms can be divided into the
categories of resource requirements and project discharges.
2.1.4.1 Project Resource Requirements
Effected project resource requirements include energy, land, water,
labor, materials, and transportation. Figures 2-11 and 2-12 detail important
GR-SI process flow rates for full load and annualized operation, respectively.
The resource requirements associated with the GR-SI technology demonstration
project are identified below.
Enerqv Reauirements. Additional energy requirements associated with the GR-SI
technology demonstration include electrical power to run sorbent equipment and
natural gas required as reburning fuel. The estimated increase in electrical
power consumption for the Lakeside Station is about 400 kW-hr/hr. This increased electrical load will occur whenever the GR-SI system is in
operation. Based on CWLP's projection of the Unit 7 capacity factor for the
year in which the GR-SI testing will be conducted (25 percent), the total
operating time of the GR-SI system will be between 876 and 2190 hours. The
lower end of the operating range (876 hours) was calculated assuming the GR-SI
system operates 40 percent of the time that Unit 7 is in operation, and Unit 7 operates at full load for 25 percent of the available hours in a 365-day year.
The upper end of the range (2190 hours) was determined assuming the GR-SI
system operates 100 percent of the time that Unit 7 is in operation, and Unit 7 operates at 25 percent of full load for 100 percent of the available hours
in a 365-day year. Based on these estimated boundary conditions, the total increase in electrical consumption over the course of the one-year GR-SI
demonstration will be between 350 and 876 MW-hr. The upper boundary condition, which has a very low probability of occurrence, represents less than five percent of the projected electrical output of Lakeside Unit 7 and less than 0.5 percent of the projected electrical output of the CWLP plant.
2-22
f
-ID zcoo Zm,C .a . . s 33ul *cog
ww o+ 2 d . . . s,o IfI 2 c;?z . 2 2 ._ :
r
r
Figure 2-11. Process Flows for GR-SI Operation During Peak Output
2-23
20” 2 In v)~co.
II. 2 - LL
Figure 2-12. Process Flows for GR-SI Operation - Projected Annual Data
2-24
It is estimated that the natural gas consumption rate for the host
site at full operating capacity will be 1250 scfm. This value is calculated
by assuming that the Unit 7 peak generation rating will remain at its present
level of 39.8 MWe net, and that the stoichiometric oxygen ratios in the
combustion, reburn, and burnout zones will be 1.1, 0.9, and 1.15 respectively.
These ratios were found to be optimal in previous gas reburning studies
(Greene et al. 1985). Records from the Gas Division of CILCO indicate that
the natural gas will have a heating value of 21,650 Btu/lb and a density of
0.046 lb/ft3. The Illinois coal that is currently used will continue to be
used during the GR-SI demonstration. Coal usage will decrease due to the
additional heat input associated with the natural gas. Full load coal feed
rate will decrease by approximately 18 percent to 32,500 lb/hr. Projections made by CWLP personnel indicate that the Unit 7 capacity factor will increase
slightly from its present value of 24 percent to 25 percent for the year in
which GR-SI testing will be done. This corresponds to an annual consumption
of about 35,600 tons of coal. Assuming that coal usage at other Lakeside
units and all Dallman units will remain at present levels, the total annual
CWLP plant coal usage will be approximately 808,900 tons, and Lakeside Unit 7
will account for about 4.4 percent of CWLP plant coal use.
Land Reauirements. There is no anticipated requirement for additional land
outside the existing plant boundaries. The GR-SI technology demonstration
involves the retrofit of two emission control procedures on an existing
utility boiler with no change in the expected service life of the boiler. The
natural gas pipeline will be constructed entirely within CWLP plant
boundaries. The GR-SI technology itself is implemented within the existing
boiler structure. The ancillary systems associated with GR-SI are relatively
compact. The host site has been examined to ensure that adequate space is
available on site for the pipeline and installation of the sorbent storage and
feeding equipment. Sufficient space is available for convenient location of
all required hardware.
Fly ash captured by the particulate control equipment will be trans-
ported dry to a permitted off-site landfill for disposal. During the year-
long GR-SI demonstration, it is estimated that 181,500 ft3 (4.17 acre-ft) of
2-25
fly ash from Unit 7 will be placed in the landfill. CWLP has already contacted one permitted landfill (Christian County Landfill) which has
expressed interest in accepting the GR-SI waste.
Bottom ash will continue to be sluiced to the on-site ash pond.
Plant personnel estimate that, at the present usage rate, the 40-acre pond has
a remaining usable life of six years. As discussed in Section 2.1.2,
approximately 136,400 ft3 (3.13 acre-ft) of ash from Unit 7 enter the ash pond
annually. During the one-year GR-SI demonstration, approximately 91,700 ft3 (2.11 acre-ft) of waste from Unit 7 will be sluiced to the pond. Therefore,
the ash pond will fill more slowly as a result of the GR-SI project.
Water Reauirements. The GR-SI process does not require the utilization of
water, per se. Less sluice water will be required because fly ash will be
transported dry to an off-site landfill during GR-SI operation. As discussed
in Section 2.1.2, Unit 7 currently generates about 3795 tons of ash per year
and has a 'sluice water requirement of approximately 0.44 MGD. During GR-SI operation, bottom ash will continue to be sluiced to the pond and will be
generated at the rate of approximately 2430 tons per year. Assuming that the relative ratio of sluice water to ash loading will remain constant,
approximately 0.28 MGD of sluice water will be required during GR-SI
operation. Assuming that sluice water requirements for the other Lakeside and
Dallman units will remain constant, the total CWLP plant sluice water requirement will decrease from its present level of about 4.80 MGD to
approximately 4.64 MGD.
Labor Reauirements. Labor will be required for installation of the GR-SI
equipment, operation and maintenance of the hardware, and verification of
system performance. Although the equipment installation represents the
largest labor requirement, it is still a relatively small effort which can be
managed by EER using locally available labor to provide both general and
specialized skills. A breakdown of labor requirements is presented in Table 2-4.
2-26
TABLE 2-4. Construction Labor Requirements
Task Duration Community Supplied (months) Labor (hrs)
Phase 1: Baseline Testing 1 240
Phase 2: Construction 16 3,360
Phase 3: GR-SI Testing 12 2,000
Total 29 5,600
2-27
Operation and maintenance of the GR-SI systems requires very little additional
labor; it is anticipated that these tasks may be conducted by the existing
Lakeside Station operations staff upon completion of a brief training program. During test periods, EER test crew personnel will also be available to oversee
operation and maintenance procedures.
Performance verification tasks will be conducted by EER test crews.
No additional labor will be required for these tests.
mReauirements. The primary material requirement for the GR-SI
technology demonstration is a calcium-based sorbent. During operation,
approximately 4070 lb/hr of Ca(OH)2 sorbent will be required. Over the course
of the one-year demonstration, approximately 4460 tons of sorbent are expected
to be used at the site. Approximately 150 tons of sorbent will be stored in
the site's sorbent silo. The raw material for sorbent is limestone for which the state of Illinois is a major producer. The sorbent to be tested will be
selected as part of the demonstration process.
Construction materials will be purchased from local distributors.
Construction materials include sorbent silo and handling equipment, piping and small hardware items.
Transoortation Reauirements. The main factors impacting transportation will
be a decrease in coal usage and an increase in sorbent usage. Coal is
currently delivered to Lakeside by ZO-ton trucks; six truck loads per day are
needed to supply the Unit 7 coal requirements, assuming coal is delivered 365
days per year. Because total coal usage will decrease, only five trucks per
day will be required for coal delivery after GR-SI is implemented. The sorbent will be trucked in and will require approximately one truck per day
for delivery. Also, one truck load per day of GR-SI fly ash will require transport to a local permitted landfill. Therefore, the total truck traffic
for Unit 7 will increase to seven trucks per day. Overall, 112 trucks per day
are required to supply the current coal requirements of Lakeside and Dallman
Stations, and about eight trucks per day are required to transport the Dallman Station scrubber sludge to the ash disposal area.
2-28
2.1.4.2 Project Discharges
Significant waste discharge streams from the boilers employing the
GR-SI technology include stack emissions and a solid waste consisting of fly
ash and spent sorbent. Emission reduction targets of 60 and 50 percent for
NO, and S02, respectively, have been established for the GR-SI demonstration
in Lakeside Unit 7. The NO, emission rate from Unit 7 is expected to decrease
to about 188 lb/hr (0.46 lb/MBtu). The SO2 emission rate is expected to
decrease to about 1080 lb/hr (2.61 lb/MBtu). Annual emissions of NOx and SO2
during the GR-SI demonstration will be about 206 and 1180 tpy, respectively,
based on expected emission rates and projected capacity factor.
No changes in CD, unburned hydrocarbons, or particulate emission
rates are anticipated as a result of the GR-SI project. Although annual
particulate emissions will increase from the 1986 level of approximately 6.3 tons to about 6.6 tons during the one-year GR-SI demonstration, this change is
due to the increase in capacity factor and does not reflect any change in
instantaneous particulate emission rate. The increase in projected capacity factor is not related to the GR-SI program, but is based on CWLP electricity
demand projections.
During initial GR-SI equipment testing, some variation in SO2 control
efficiency is expected. However, no permit limits for SO2 will be exceeded
since the coal currently fired in Lakeside Unit 7 (which will also be fired
during the GR-SI demonstration) complies with the SD2 permit level without
controls.
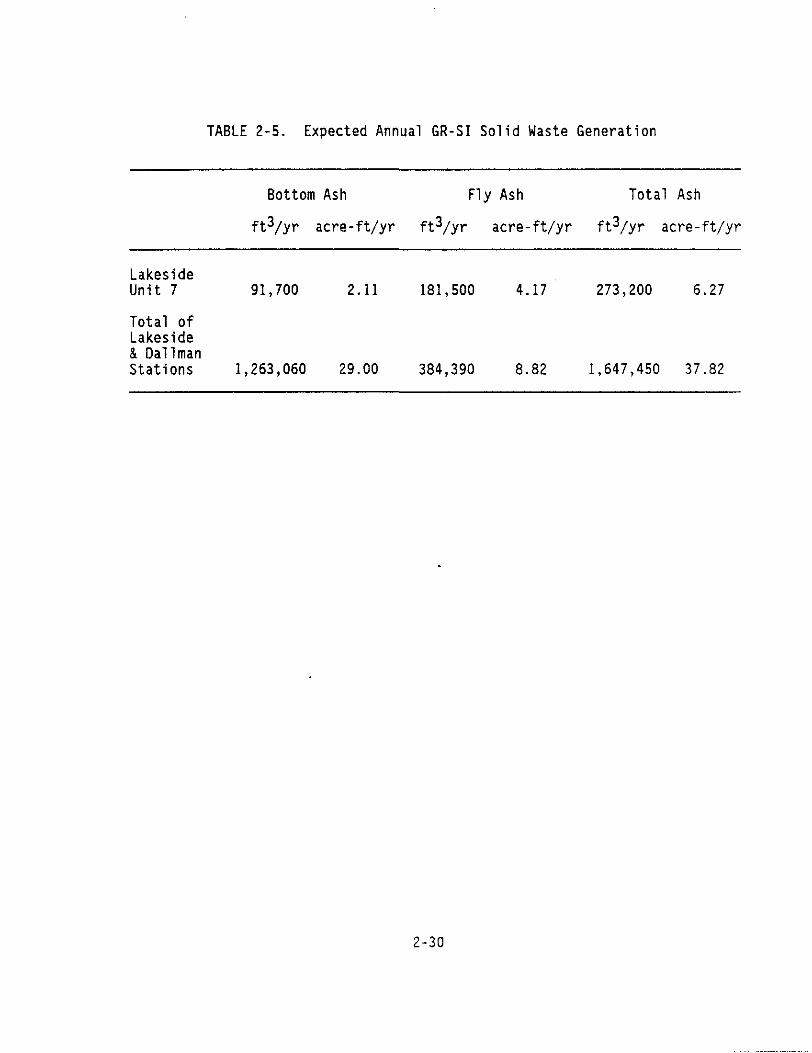
Solid waste will change in both composition and flow rate due to the change in coal firing rate and the addition of sorbent. Projected annual
solid waste production for Lakeside Unit 7 and the entire CWLP plant is
summarized .in Table 2-5, which assumes that all Dallman and Lakeside Station
units other than Lakeside Unit 7 will continue to generate ash at their
present rates. Based on the decreased coal feed rate and the sorbent injection rate, the flow rate of fly ash collected by the ESP during full load
Lakeside Unit 7 91,700 2.11 181,500 4.17 273,200 6.27
Total of Lakeside & Dallman Stations 1,263,060 29.00 384,390 8.82 1,647,450 37.82
2-30
operation is expected to increase to about 5380 lb/hr (compare Figures 2-6 and
2-11). The GR-SI fly ash composition will be approximately 14 percent coal
ash, 27 percent CaS04, and 59 percent Ca(OH)2. Based on the projected
capacity factor (25 percent), the annual fly ash generation rate will increase
to about 5900 tpy (compare Figures 2-7 and 2-12). Assuming that fly ash
density will remain at 65 lb/ft3, the annual fly ash volume will increase to
approximately 181,500 ft3/yr (4.17 acre-ft/yr).
Bottom ash flow rate will decrease to about 2220 lb/hr during full
load operation due to reduced coal consumption. Annual bottom ash flow rate
will decrease to approximately 2430 tpy. Assuming that bottom ash density
will remain at 53 lb/ft3, the annual bottom ash volume will decrease to
approximately 91,700 ft3/yr (2.11 acre-ft/yr). Note that these figures,
including the data in Table 2-5, do not include dewatered scrubber sludge from
Oallman Station.
Bottom ash will continue to be sluiced to the existing ash pond. Because less ash will be sluiced to the pond, sluice water requirement and
effluent water discharge to Sugar Creek will decrease. Pond discharge is
expected' to decrease from its present value of 4.80 MGD to 4.64 MGO. Composition of the waste being sluiced and ratio of sluice water to ash are
expected to remain at their present values. Bottom ash composition from
Lakeside Unit 7 is not expected to change since 1) the same coal will be fired
during the GR-SI demonstration as is currently fired, and 2) sorbent injection
will occur near the top of the furnace at the inlet to the convective section. Thus, all of the sorbent is expected to enter the convective section, where it
will react with gas phase SO2 and, ultimately, be captured in the ESP.
Therefore, no changes are anticipated in ash pond pH, total suspended solids,
or oil and grease concentrations. Because a slight decrease is expected in
pond discharge rate, a slight decrease is also expected in annual loading of pollutants to Sugar Creek. Coal pile size is not expected to change and thus coal pile runoff will not change.
The GR-SI fly ash will be transported off-site by truck to a landfill permitted by IEPA to accept this type of waste. CWLP personnel have visited
2-31
the Christian County Landfill to discuss the potential for disposal of the GR-
SI ash there. Christian County Landfill operators are experienced in the
handling of AFBC ash, which has many similar characteristics, and expressed an interest in handling the GR-SI ash. The permitted landfill is also equipped
with liner and leachate collection systems to minimize impact to groundwater.
2.2 ALTERNATIVES TO THE PROPOSED ACTION
This subsection identifies and characterizes three alternatives to
the proposed action: no action, use of alternative technologies, and use of
alternative sites.
2.2.1 The No Action Alternative
Under the No Action alternative, DOE would not provide funds to place
GR-SI technologies at Lakeside Station. Under this alternative, testing of these technologies would be undertaken only at the Hennepin and Edwards sites,
as discussed in Section 1.0. The existing plant engineering design and
station configuration would remain as described in Section 2.1.2. Conditions
at the Lakeside site would remain unmodified. Excluding Lakeside Station as a test site would eliminate the cyclone fired boiler from the types of boilers
being tested in this demonstration project.
2.2.2 Alternative Technoloaies
The proposed action is to install GR-SI technologies atthe Lakeside
site to provide a demonstration of the effectiveness of these combined
technologies in reducing SO2 and NO, emissions. Other technologies could be
installed at this location to achieve similar environmental objectives.
Two competing methods for SO2 control are presently in commercial operation on coal-fired power plants: wet limestone flue gas desulfurization and spray dryers. Both of these are high in capital cost and require a
significant amount of space for installation, and both produce waste streams
2-32
that require disposal considerations similar to those for GR-SI. GR-SI has
the advantage of relatively low capital cost and minimal installation space.
Combustion modifications which inhibit the formation of NO, in the
furnace as it burns include low NO, burners, multi-stage combustion, reburning
and overfire air. Gas reburning is the only near term NO, control option
available in cyclone furnaces where combustion takes place in a horizontal
cylinder attached to the outside of the furnace. Other furnaces using
pulverized coal employ circular or cell type burners in wall-fired or
tangentially-fired arrangements and can take advantage of low NO, burner
technology. Post-combustion treatments such as selective catalytic reduction
which removes flue gas down-steam of the boiler are plagued by complex operational issues and higher costs than in-furnace NO, reduction.
The limitations associated with these existing emissions control
technologies emphasize the need for exploring additional options and do not
provide a reasonable alternative to GR-SI.
2.2.3 Alternative Sites
The available population of coal-fired electric utility plants having
the appropriate characteristics and boiler configuration to be suitable for
retrofit with GR-SI technology were surveyed using MEGABASE, a commercially
available computerized database of all fossil fuel-fired utility boilers east
of the Mississippi River. Only those sites currently available for
demonstration purposes were considered as acceptable alternatives. Results of the survey indicated that 67 coal-fired utility boilers were operating in
Illinois as of January 1980. To minimize environmental impact, only those
alternative sites were evaluated that had been previously disturbed, were
previously allocated to electric power production, and for which the necessary
permits had already been obtained. The alternative sites meeting these
criteria and having net generating capacities below 100 MWe (the maximum
feasible size with which to conduct the demonstration within the designated level of funding) were Hennepin Station, Edwards Station, and the proposed site at Lakeside Station.
2-33
The boiler at Hennepin Station is tangentially-fired and, because the
goal of this project is to demonstrate GR-SI in a cyclone-fired boiler,
Hennepin could not be used. The boiler at Edwards Station is front wall-
fired, so could also not be used for this project. The proposed GR-SI
demonstration project at Edwards Station is described in an environmental
assessment (DOE/EA-0382), and that at Hennepin Station in a Memorandum-to-File
dated May 9, 1988. Since no sites other than Lakeside were available that
offer the minimal environmental impact to be expected from these previously allocated sites, no further alternative sites were evaluated.
2-34
/
3. EXISTING ENVIRONMENT
This section describes the environmental setting at Lakeside Station,
focusing on environmental features that might be impacted by the proposed
action. The environment is divided into the six categories that are
characterized individually in this section.
3.1 ATMOSPHERIC RESOURCES
The area of central Illinois in which the demonstration site is
located provides a typical continental climate with warm summers and fairly
cold winters. Figure 3-1 shows wind roses for Springfield for four months
representing the four seasons. For most of the year, prevailing winds tend to
be from the south. According to the Illinois State Climatologist, who is an
agent of the Illinois State Water Survey, average annual precipitation for
Springfield is 33.8 inches. The climate is typical of the entire midwestern
states area and not representative of a local specialized environment.
The air quality in the area of Lakeside Station is generally good.
Sangamon County is in Federal Air Quality Control Region 75 (West Central
Illinois Intrastate), and is a primary attainment area for the U.S. EPA
criteria pollutants S02, NO,, and total suspended particulates (Illinois EPA
1985). The region is a secondary non-attainment area for total suspended
particulates. A survey of Illinois EPA's Air Emissions Inventory revealed
that in Sangamon County, 145 businesses and industrial plants emit air
pollutants, of which 86 emit particulates, 18 emit S02, and 24 emit NO,.
Lakeside Station is in close proximity to the city of Springfield, as
well as to several railroads, highways, and other industrial plants. Current
noise levels at Lakeside Station are attributable to normal plant operation
(e.g., coal pile shaping and coal feeding) and coal delivery trucks for both
Lakeside and Dallman Stations.
3-l
,NUARY EO-YEAR TOTAL (1901-80)
JULY SO-YEAR TOTAL (1901-80)
APRIL EO-YEAR TOTAL (1901-80)
OCTOBER 80-YEAR TOTAL (1901-80)
Key: For each concentric circle, the wind blows 1 percent of the time from the direction of the line. Thus a line directed vertically downward from the city that passed through 10 circles'would indicate that the wind blew from the south 10 percent of the time.
Figure 3-l. Wind Roses for Springfield, Illinois
3-2
3.2 LAND RESOURCES
Lakeside Station is situated adjacent to Lake Springfield in the
Springfield Plain of the Central Lowlands Physiographic Province. The Plain is characterized by broad upland divides with mature valleys. No large hills
exist in the vicinity, but rolling terrain is found near the Sangamon River.
Approximately 10 feet of loess covers the Illinoisan age glacial drift which is itself underlain by pre-Illinoisan glacial drift and Pennsylvania age
bedrock. The floodplain map of the Lakeside Station area given in Figure 3-2
shows that the plant itself is in a Zone C area, while the ash ponds are in a
Zone A6 area. Zone C areas experience minimal flooding, while Zone A6
represents the loo-year floodplain, i.e., areas with a one percent probability
of being flooded in any one year.
Although much of the land surrounding Lakeside Station is urbanized,
some farmlands are found in the area. According to the Sangamon County Soil
and Water Conservation District, a branch of the U.S. Department of
Agriculture, the soil in this area is classified as Fayette silt loam, and is
not considered prime or unique farmland. Floodplain and wetland areas and the
impact of the GR-SI project upon these areas are described more completely in the Floodplain/Wetlands Assessment attached to this volume as Appendix A.
3.3 WATER RESOURCES
Effluent water from the Lakeside and Oallman ash ponds is discharged
to Sugar Creek. Ambient water quality data for Sugar Creek near Lakeside
Station are summarized in Table 3-1, including flow rates and concentrations
of contaminants. Also included are the Illinois General Use Water Quality
Standards for various parameters, which must be met in waters of the state for which there is no specific designation. Table 3-l indicates that dissolved
oxygen, boron, and iron occasionally fail to meet Illinois general use water quality standards. Creek flow rate depends on a number of factors, including
rainfall and amount of water spilling over the Spaulding Dam from Lake
3-3
Figure 3-2. Flood Zones Near Lakeside Station
3-4
TABLE 3-l. Water Quality Data for Su ar Creek Near Springfield for 1985 1
Parameter High Low
Illinois General Use Water Quality
Average Standard
PH 8.0
Flow Rate (ft3/s) 159.0
Dissolved Oxygen (ms/l 1
Barium (mg/l) 0.071
Boron (mg/l) 3.6*
Cadmium (mg/l) CO.003
Chloride (mg/l) 0.052
Chromium (mg/l) 0.008
Cower (w/l 1 <0.005
Iron (mg/l) 2.7*
Lead (mg/l) to.05
Manganese (mg/l) 0.25
Nickel (mg/l) 0.011
Silver (mg/l) <0.003
Sulfate (mg/l) 210.0
Zinc (mg/l) <0.05
13.0
7.1 7.7
4.6 60.0
5.2* 8.8
0.045
0.1
0.019
co.005
0.26
0.047
<0.005
40.0
0.059 <5.0
1.73* Cl.0
<0.003 to.05
0.033 c500.0
0.005 <l.O
co.005 <0.02
0.87 <I.0
to.05 co.1
0.113 <l.O
0.005 <l.O
<0.003 <0.005
114.0 t500.0
<0.05 (1.0
6.9
>6.0
*Value not meeting water quality standard.
a(U.S. Geological Survey 1986)
3-5
Springfield. Creek flow rate generally does not fall below 3 MGD (4.6
ft3/sec)due to dam spillage and pond discharge. There are no other industrial
plants discharging into Sugar Creek.
3.4 ECOLOGICAL RESOURCES
The ~region of Lakeside Station is part of the Prairie Peninsula
Section of the Oak-Hickory Forest Region (Braun 1950). Forests of the area
are predominantly oak-hickory and, although widely distributed, are generally
limited to slopes of shallow and ill-defined ravines or of low morainal
ridges. Historically, prairie occupied the gently rolling to flat intervening
areas (Braun 1950) but former prairie areas are now extensively used for
agricultural crops, industrial sites, and residential areas. The area in the
immediate vicinity of the plant site is a mosaic of industrial properties,
highways, residential and farmland with some woodlands interspersed north of
the power station (see Figure 2-4). Lakeside Station is bordered on its east
and south boundaries by the open waters of Lake Springfield.
A search of the Illinois Natural Areas Inventory data base in 1988 yielded nine natural area sites within a 25-mile radius of Lakeside Station.
Table 3-2 lists these natural areas. Their locations are mapped in Figure
3.3. According to the U.S. Fish and Wildlife Service, there are no federally
designated critical habitats near Lakeside Station (Bade. Personal
communication, 1988).
The Illinois Natural History Survey has also identified approximately
1310 plant species within 25 miles of Lakeside Station. According to the
Great Lakes Area Regional Office of the U.S. Fish and Wildlife Service, no
species of flora in Sangamon County are federally listed as endangered or
threatened (Refsnider. Personal communication, 1988).
The Illinois Natural History Survey also identified 476 bird, fish,
mollusk, amphibian, and reptile species within 25 miles of Lakeside Station.
According to the U.S. Fish and Wildlife Service, two of these species, the
Indiana bat (Mvotis sodalis) and the bald eagle (Haliaetus leucoceohalus), are
3-6
TABLE 3-2. Natural Areas in the Lakeside Station Regional Environment
Reference Number Area Name Acreage
279 178
8:;* 245 801
85 84 13
Porta School Natural Area Elkhart Hill Carpenter Park Norfolk & Western Railroad Prairie Sangamon State University Natural Area Abraham Lincoln Memorial Garden Long Point Slough (West) Long Point Slough (East) Berry's Woods
25.0 157.0 237.0
4A.A 77:o 89.0 73.0 23.0
*Dedicated Nature Preserve
3-7
/yI - I . I
Figure 3-3. Natural Areas in the Lakeside Station Regional Environment (numbers refer to Natural Areas listed in Table 3-2)
3-8
endangered. Both species have a statewide distribution, but have no critical
habitat in the vicinity of Lakeside Station.
Lake Springfield, located to the east and south of the station, is
one of 2900 lakes in Illinois (Bhowmik, et al. 1987). Some 258 square miles
of land comprise the watershed draining into Lake Springfield (Stall and Lee
1980). Even though Lake Springfield receives approximately a ton of sediment
per acre per year through soil erosion in the watershed, bottom-dwelling
species such as mollusks have remained fairly stable. Of the nine mollusk
species surveyed in a 1953 study, all nine plus four previously unrecorded
species were found at these identical locations in 1978 (Klippel and Parmalee 1979). No specific data are available to characterize the fauna of Sugar
Creek near the Lakeside Station but the creek is known to support permanent
fish populations (Roseboom, et al. 1986).
3.5 SOCIOECONOMIC RESOURCES
The Lakeside site is located immediately adjacent to the city of
Springfield in Sangamon County. Springfield has a population of approximately
100,000 (U.S. Department of Commerce, 1983), while a total of 176,000 people
reside in the county. The local area provides an economic base of labor and
materials to the Lakeside plant.
Means of transportation of materials and manpower to the plant are
provided by nearby railroads and Interstate Highway 55.
3.6 ENERGY AND MATERIALS RESOURCES
The main material resources of interest for this project are
limestone, coal, and natural gas. Limestone is in abundant supply, with a
capacity to deliver over 17 million tons per year to the U.S. market
(Gutschick 1987, p. 2). There are over 160 limestone quarries in Illinois and Missouri (Boynton 1980, p. 14). Coal is trucked in from Logan County in
central Illinois. Lakeside has a contract running through 2005 with its coal
supplier; thus, no problem is expected with coal availability. A natural gas
3-9
pipeline will be constructed at the site. Natural gas is also in abundant
supply, with capacity existing to deliver an additional 6.5 x 10⁶ scfm beyond
current consumption to the U.S. market (American Gas Association 1985).
3-10
4. ENVIRONMENTAL CONSEUUENCES
4.1 IMPACTS OF THE PROPOSED ACTION
Demonstration of GR-SI technologies in a pre-NSPS utility boiler has the potential to impact the environment in several ways. The discussion that
follows considers the consequences of both construction and operation. Plans
for mitigating possible detrimental impacts are also discussed. In this way, it will be shown that this project will have. no significant EHSS impacts.
Although Hennepin Station, Edwards Station, and Lakeside Station are all
located near the Illinois River, they are at a substantial distance from one
another; therefore, cumulative impacts from development at all three locations
is not expected.
4.1.1 mosoheric Imoacts
During construction, the only air emissions at the Lakeside Station
are expected to be fugitive emissions from equipment installation and minor
landscaping. The area affected by installation of the sorbent silo and
natural gas pipeline will be less than one-tenth of an acre. Therefore, fugitive emissions resulting from construction are expected to have a
negligible impact upon air quality. Transportation requirements for the CWLP
plant will increase from 120 to 121 trucks per day. This negligible change
should have no impact upon air quality.
Several air quality impacts are anticipated during project operations. Emission rates of NO, and SO2 are expected to decrease by 60
percent and 50 percent, respectively. In addition to the potential public
health benefits of these emission reductions, the utility plant could also
benefit if stricter air pollution laws were passed. It is anticipated that the electrostatic precipitator will have sufficient specific collection area
to counteract the increase in particulate loading. Thus, the particulate emission rate from Unit 7 is expected to remain at 6 lb/hr (0.015 lb/MBtu).
Total annual particulate emissions from Unit 7 will increase from 6.3 to 6.6
tons/year, but this increase is due to the higher projected capacity factor,
4-l
which is independent of the GR-SI project. Fugitive emissions may decrease
slightly due to the smaller quantity of coal that will be loaded to Unit 7.
Dust control measures will be used to prevent fugitive emissions of fly ash
during transportation to the landfill cells.
The handling and use of dry, calcium-based sorbents presents several
unique problems. Sorbent handling requires special care to prevent inhalation
of the dust or contact with the eyes, since the sorbent is not only abrasive,
but somewhat alkaline. Also, the potential exists for fugitive dust emissions
during the transportation and storage of sorbents. To minimize fugitive
emissions, a dustless pneumatic handling system will be used. Sorbent will be
transported to the site in fully enclosed tanker trucks, and will be trans-
ferred pneumatically to the sorbent storage tank. The only exposure of
limestone to the atmosphere will be through vents in the storage silo; these
vents will be equipped with bag filters. If a need arises for workers to
handle limestone, mitigating measures to minimize risks to workers will
include mandatory use of protective apparatus such as enclosed safety goggles
and inhalation dust filters.
Noise from the addition of the GR-SI process will be generated mainly by construction activities. The State of Illinois Noise Pollution Regulations
(35 Ill. Adm. Code 901.107 part d) state that equipment used for construction
is exempt from general regulations governing allowable noise levels.
Therefore, construction activities will not violate Illinois noise
regulations. Construction will be short-term and will not have a lasting
effect on no.ise levels. Construction will also occur against a background of
the ambient operational noise from other power plant activities. Incremental operational noise from the GR-SI project will be negligible compared to
current plant noise. Because few residences are in close proximity to the
plant, no significant noise impact is expected.
4-2
4.1.2 Land Imoacts
All construction activities will occur on-site. Thus, no land
impacts beyond plant boundaries are expected. The natural gas pipeline will
be installed entirely on-site and is not expected to impact any land values.
Fly ash will be transported dry to a permitted off-site landfill.
Only about 4.17 acre-ft of GR-SI fly ash will be transported to an off-site landfill if this option is selected. Assuming a disposal depth of 10 feet,
only about 0.42 acres of land already allocated for waste disposal would be consumed during this project. Studies have shown that coal fly ash/spent
sorbent mixtures have good landfill characteristics due to their pozzolanic
properties, which allow the solid waste to harden into a cement-like substance
after drying (Electric Power Research Institute 1988). Bottom ash will
continue to be sluiced to the ash pond. As discussed in Section 2.1.3.3, the
amount of waste from Unit 7 entering the pond will decrease from its present
value of 136,400 ft3 (3.13 acre-ft) to 91,700 ft3 (2.11 acre-ft) during the
year-long GR-SI demonstration. Thus, the ash pond will fill more slowly as a
result of the GR-SI project.
The project is not expected to have-any land impacts beyond plant
boundaries. Therefore, there should be no archaeological, cultural, or
historical impacts of the project.
4.1.3 Water Bualitv Imoacts.
Bottom ash, is expected to have the same composition as the baseline
bottom ash, and will be sluiced to the ash pond for disposal, in keeping with
current practice. The Unit 7 sluice water requirement will decrease from its
present value of 0.44 MGD to 0.28 MGD. The GR-SI project will not affect any
other plant water flow rates. While the decrease mentioned above represents a
reduction of approximately 36 percent in the Unit 7 sluice water requirement,
this process water use is insignificant when compared with the Lakeside
Station cooling water requirement of 290 MGD. Thus, the project will have a
negligible impact on water usage.
4-3
The decrease in Unit 7 sluice water will cause a reduction in the ash
pond effluent water discharge rate from the present value of 4.80 MGD to 4.64
MGD. The GR-SI project is not expected to have any effect on ash pond pH,
total suspended solids, or oil and grease concentrations. Annual loadings
will decrease slightly due to the decrease in effluent water flow rate. Thus,
the project is expected to have a negligible impact on Sugar Creek water
quality.
The GR-SI fly ash will be disposed of in a permitted off-site
landfill. The waste will be transported to a landfill permitted by IEPA to
accept this waste type. IEPA requires permitted landfills to have liners and
leachate collection systems to prevent groundwater contamination.
4.1.4 Ecoloaical Imoacts
Construction of the 1400-foot gas feeder pipeline will temporarily
disturb approximately one acre of roads and grass-covered property entirely
within plant site boundaries. Soil loss in the Lake Springfield Watershed
from 1930 to 1978 is estimated to have averaged 3.96 tons per acre per year with 24% deposited in Lake Springfield (Stall and Lee 1980). Given the low
topographic relief of the pipeline route, and assuming good erosion control
practices are followed during pipeline construction, soil erosion is expected
to be minimal and corresponding impacts to Lake Springfield biota would also
be minimal. After pipeline installation, the disturbed area will be contoured
and reseeded, and habitat recovery will be rapid.
Construction activities will contribute some noise and fugitive dust
emissions to the environment. However, noise and dust emissions from these activities will have a negligible impact upon area biota because construction will be short-term and is similar to other ongoing minor construction
activities characteristic of this industrial site.
Transportation requirements will increase slightly (1 truck per day)
but insignificantly compared to the 120 trucks per day currently servicing
4-4
Lakeside and Dallman Stations. This small increase in noise and diesel engine
emissions would result in a negligible adverse impact to area biota.
The GR-SI project is expected to substantially improve air quality by
reducing NO, and SO2 emissions by 60 and 50 per cent, respectively. These
reductions would have a minor beneficial impact on area biota.
Coal pile runoff will remain unchanged and no changes are anticipated in ash pond pH, total suspended solids, or oil and grease. A slight decrease
in annual loadings of pollutants to Sugar Creek will likely have a minor
beneficial effect to stream organisms.
The proposed action is not expected to affect any of the nine natural areas listed in Section 3.4 either directly or indirectly. The GR-SI project
will not impact any federally listed threatened or endangered species, and no
ecologically sensitive areas will be disrupted.
4.1.5 Socioeconomic Imoacts
The labor requirements for the GR-SI project were detailed in Section
2.1.4.1. The total labor required from the local community is expected to be about 5600 man-hours for construction, to be spread over an eight-month
period. This requirement will involve less than 20 new personnel. Pipeline
construction will be coordinated by CILCO using CILCO personnel, and will have
a minimal impact upon the area's economy. Operational manpower requirements
should remain at current levels. Due to the availability of an ample labor
force within commuting distance and the small labor requirement of the
project, the GR-SI project will have a minimal positive impact on local
employment. The four construction supervisors will be non-local EER
personnel; therefore, no adverse impact on housing and support facilities is
anticipated, especially since the host site is within commuting distance of metropolitan areas. In addition, miscellaneous, small pieces of equipment and pH adjustment materials may be purchased locally. Thus, the GR-SI project
should have a small positive impact upon the Lakeside area economy.
4-5
As described in Section 2.1.4.1, the project will result in a
decrease in coal use at Unit 7 from 41,700 tpy (1986 data) to approximately
35,600 tpy. This represents a decrease of 6,100 tons of Illinois coal during
the life of the project (one year), which would produce a negligible adverse
impact on the Illinois coal economy.
The GR-SI project will require one truck per day for sorbent
delivery, five trucks per day for coal delivery, and one truck per day for fly
ash removal, a total of seven trucks per day. Since the current traffic
volume is six trucks per day for coal delivery to Lakeside Unit 7, an increase of one truck per day is expected. Contrasted with the current requirement of
about 120 trucks per day for the entire CWLP plant, the GR-SI project will have only a minimal impact on transportation requirements.
4.1.6 Fnerov and Materials Impacts
The estimated increase in electrical power consumption rate due to
GR-SI is about 400 Kw-hr/hr. Although this rate of electrical consumption is
not negligible, it represents only 1.1 percent of the total net generating capacity of Unit 7, 0.4 percent of the Lakeside Statlon capacity, and 0.09
percent of the CWLP plant capacity. This additional energy requirement, then,
will have minimal impact on the availability of electrical power beyond the
plant boundaries.
The possible areas of materials impact are coal usage, natural gas
usage, and sorbent usage. Implementation of GR-SI technology will result in
direct replacement of approximately 18 percent of the baseline coal input with
natural gas. Full-load coal usage will decrease from approximately 39,700
lb/hr to about 32,500 lb/hr. Because Unit 7 accounts for only 5.1 percent of
the total CWLP plant coal usage, an 18 percent reduction in Unit 7 coal usage will have a minimal impact upon CWLP plant coal consumption.
During full-load GR-SI operation, Unit 7 will consume approximately
1250 scfm of natural gas. General availability of natural gas resources is
not expected to present any problem; capacity exists to deliver an additional
4-6
6.5 x 10⁶ scfm beyond current consumption to the U.S. market. This surplus
represents 20 percent of the current U.S. consumption, and the increased
consumption for Lakeside Station amounts to less than 0.02 percent of the
current excess capacity.
The year-long test phase of the project will require about 4,470 tons
of limestone-based sorbent. Capacity exists to deliver 17 million tons per
year of limestone to the U.S. market. Therefore, the project will require
only 0.03 percent of the U.S. limestone supply. Limestone availability is not
a problem because over 160 quarries exist in Illinois and Missouri.
4.1.7 Jmoact Summary
In summary, no significant EHSS impacts are anticipated during the
construction and operation phases of the GR-SI technology demonstration, other
than the beneficial impact of the reduction in NO, and SO2 emissions. Disposal
of the GR-SI systems at the end of the demonstrations (if required by the host
utilities) would incur the same types of impacts and levels of risk associated
with the on-site construction activities; i.e., minimal to negligible EHSS
impacts are anticipated for any disposition activities, if required.
4.2 IMPACTS OF THE ALTERNATIVES
This subsection addresses three alternatives to the proposed action:
no action, the use of alternative technologies, and the use of alternative
sites.
4.2.1 No Action
Under this alternative, the GR-SI technologies would not be installed
at Lakeside Station. As a result, environmental conditions at the site would
be no different than under existing conditions. In particular, NO, and SO2
emissions would remain unchanged from current operating conditions. The
benefits gained from reducing these emissions by using the GR-SI process would
not be realized.
4-7
4.2.2 Alternative Technoloaies
Installation of alternative emission control technologies at Lakeside
Station would not provide DOE with information on the effectiveness of GR-SI.
In particular, information would be lacking on the effect of GR-SI with a
cyclone-fired boiler. Thus, installing alternative technologies is not a
practical option and requires no further impact analysis.
4.2.3 Alternative Sites
Two alternative sites, Edwards and Hennepin, are considered by the
applicant (EER) to be suitable for installation of GR-SI technologies. The
environmental impacts of installing the GR-SI process at these alternative
sites are evaluated in independent NEPA compliance actions. Hennepin Station
is evaluated in U.S. Department of Energy, Memo-to-File dated May 9, 1988, and
the Edwards site is evaluated in a U.S. Department of Energy Environmental
Assessment (DOE/EA-0382).
4-8
5. REGULATORY COMPLIANCE
This section describes current permit requirements and regulations
governing plant operation, and outlines the anticipated permit modifications
and the process by which they will be obtained.
5.1 REGULATIONS AND PERMIT REQUIREMENTS
Demonstration of the GR-SI technologies will be on a retrofit basis
for the Lakeside boiler; therefore, the host site currently has all necessary
permits for air emissions, land use, water use, and water discharges.
The Division of Air Pollution Control of the Illinois Environmental
Protection Agency (IEPA) has issued a permit to CWLP for operation of Unit 7
at Lakeside Station. Particulate emissions are limited to 0.1 lb/MBtu and
there is a limit of 30 percent for opacity measurements. An SO2 emissions
limit of 6.0 lb/MBtu also exists. The utility is required to submit quarterly
operating reports that describe all excess opacity incidents including date,
length of occurrence, and reason for occurrence.
Bottom ash wastes from the boiler will be handled by wet transport to
a settling pond. The ash pond discharges to surface waters are regulated by
the National Pollutant Discharge Elimination System (NPDES). The Illinois EPA
Division of Water Pollution Control has issued an NPDES permit to CWLP to
regulate ash pond discharge to Sugar Creek. The existing permit contains
concentration limits for various parameters as well as monitoring
requirements. The monitoring requirements and the limits imposed are
described in Table 5-l.
5.2 ANTICIPATED PERMIT MODIFICATIONS
5.2.1 Air Permit Modifications
Lakeside Station is located in Sangamon County which is designated as
an attainment area for N02, SO2, 03, and CO, but is a secondary non-
5-l
TABLE 5-l. Effluent from Ash Pond At Lakeside Station - Measurement Plan and Permit Limits
Parameter Measurement Measurement Permit Limit
Method Frequency 30-Day Avg. Daily max.
Flow Rate
PH
Single Reading Once/Week -
Grab Sample Twice/Week 6-9 6-9
Total Suspended 24-hour Twice/Week 15.0 mg/l 15.0 mg/l Solids Composite
Oil and Grease Grab Sample Twice/Week 15.0 mg/l 20.0 mg/l
5-2
attainment area for total suspended particulates (TSP). After reviewing the
nature of the GR-SI technologies demonstration, the Illinois EPA (IEPA)
indicated that modifications to existing air permits, rather than new permits,
will be required (Patrick Dennis, IEPA. Personal communication, September
1987). Emissions limits in the permits will not change, but the permit must
be written to describe the full operation of the facility and all attendant
equipment. Specifically, required information will include descriptions of
boiler modifications, sorbent storage and injection equipment, projected coal
input, ESP modifications and estimated efficiency, trucking changes, and
fugitive dust control measures.
It may also be necessary to obtain approval for emissions resulting
from initial startup and testing of the GR-SI process. Since startup and
testing will be relatively short-term, IEPA has indicated that there should be
no difficulty in obtaining such a variance. In applying for a variance, it
will be necessary to submit a schedule of construction and testing activities.
All preparation, including engineering calculations and design work,
will be done so that permit modification applications will be ready for
submittal at the end of Phase 1 of the project. Permit applications will then
be submitted early in Phase 2. IEPA is required to respond to permit applica-
tions within 90 days. In the experience of the utility, 60 to 90 days are
usually required for permit approval. Sufficient lead time will be allocated
for permit applications to allow Phase 2 construction and startup activities
to begin as scheduled.
5.2.2 Solid Waste/Water Permit Modifications
Management of the fly ash/sorbent waste generated during this program
will be conducted in accordance with all applicable federal, state, and local
regulatory requirements. Solid waste streams from coal firing and flue gas
emission control procedures are exempt from classification as hazardous wastes
1. Adm. Code 721.104) under both federal (40 CFR 261.4) and Illinois (35
regulations.
I1
5-3
The current method of ash disposal by wet transport to a settling
pond will be used for disposal of the GR-SI system bottom ash. Therefore, the
NPDES limits on ash pond discharge will be applicable to the waste generated.
The IEPA Division of Water Pollution Control has indicated that a new NPDES
permit will not be required, and that modifications to the existing permit
will be sufficient (Gary Cima, IEPA. Personal communication, September 1987).
In applying for NPDES permit modifications, it will be necessary to describe
to IEPA all projected changes in the water and solid waste entering the ash
pond, and in the effluent water leaving the ash pond. Permit modifications
applications will be prepared at the end of Phase 1 and submitted early in
Phase 2. In the experience of the utility, 60 to 90 days is usually required
for permit approval.
The IEPA Land Pollution Division has regulatory authority for the dry
disposal of wastes. Disposal of the GR-SI fly ash in an off-site landfill
will require procurement of a supplemental permit by the landfill operator.
The permit application must identify the waste generator and disposal facility
operator, and must provide a detailed characterization of the waste.
5.2.3 Other Reauired Permits
All of the GR-SI equipment will be installed within the boundaries of
the plant; thus, zoning and land use issues do not apply. Construction
permits for installation of the equipment will be obtained from the state and
local authorities. In general, it is anticipated that demonstration of GR-SI
technologies can be conducted in an environmentally sound manner in complete
compliance with all applicable environmental regulations without the
imposition of extraordinary control measures.
5-4
/ / Ii
6. REFERENCES
American Gas Association. 1985. Natu al Gas Production Caoabilitv - 1986. Arlington, Virginia: American Gas AssociLtion.
Bade, Gerry, U.S. Fish and Wildlife Service, Rock Island Field Office. Telephone conversation with Susan Agrawal, Energy and Environmental Research Corporation, September 28, 1988.
Bhowmik, N.G., W.C. Bogner and W.P. Fitzpatrick. 1987. "Sedimentation of Lakes and Reservoirs in Illinois." In: Ragan, Robert N.,ed. Proceedinas of the 1987 National Conference on Hvdraulic Enaineerinq. New York: American Society of Civil Engineers.
Boynton, R.S. 1980. Chemistrv and Technoloav of Lime and Limestone. New York: Wiley.
Braun, E.L. 1950. Deciduous Forests of Eastern North America. New York:The Free Press.
Cameron, D. and J.A. Arnott. 1986. "Design and Testing of a Retrofit Dry Sorbent Injection System on a 300 MW Pulverized Fuel Boiler." Proceedinas, 1986 Joint Svmposium on Drv SO2 and Simultaneous Technoloaies. EPRI CS-4966, Vol. 2.
S02/NOx Control
Cima, G., IEPA. Personal communication. September 1987.
Dennis, P. IEPA. Personal communication. September 1987.
Electric Power Research Institute. 1988. Laboratorv Characterization of Advanced SO2 Control Bv-Products. CS-5783. Palo Alto, California: EPRI.
Feindel, R.G. and 0. Gass. 1986. "Demonstration of Front End Alkali Injection and Combustion Modification Techniques at Boundary Dam G.S. Unit 4 -Progress Report." Proceedinas. 1986 Joint Svmoosium on Drv SO2 and Simultaneous a2mx Control Technoloaies. EPRI CS-4966, Vol. 2.
Gartrell, F.E. 1973. "Full Scale Desulfurization of Stack Gas by Dry Limestone Injection: Volume I." EPA-650/2-73-Olga, (NTIS No. PB228447).
Greene, S.B., S.L. Chen, W.D. Clark, M.P. Heap, D. W. Pershing, and W.R. Seeker. 1985. "Bench Scale Process Evaluation of Reburning and Sorbent Injection for In-Furnace NO,/SD, Reduction." EPA-600/7-85-021.
Gutschick, K.A. 1987. Lime for Environmental Uses. Philadelphia, Pennsylvania: American Society for Testing and Materials (ASTM).
Hendriks, R.V., P.S. Nolan and M.L. Kunkle. 1986. "Wall-Fired LIMB Demonstration Design for Ohio Edison's Edgewater Unit 4." Proceedinas, 1986 Joint Svmoosium on Drv SO2 and Simultaneous S02/NO, Control Technoloaies. EPRI CS-4966, Vol. 2.
6-l
Illinois Environmental Protection Agency. 1985. Geoaraohic Desianations of IStatus
Klippel, W.E and Parmalee, P.W. 1979. "The varied fauna of Lake Springfield, Illinois: An Assessment After Two Decades." Nautilus 93 (4): 189-197.
Reese, J. and K. Durucz. 1985. "Sulfur Dioxide Emission Control by Furnace Injection of a Dry Sorbent." DOE/FC/10616-1965.
Refsnider, Ron, U.S. Fish and Wildlife Service, Great Lakes Regional Office. Telephone conversation with Susan Agrawal, Energy and Environmental Research Corporation, September 28, 1988.
Roseboom, D., et al. 1986. "Influences of Land Uses and Stream Modifications on Water Quality in the Streams of the Court Creek Watershed." Illinois State Water Survev Reoort. IL/ENR/RE/WR-86/16.
Stall, J.B. and M.T. Lee. 1980. "Reservoir Sedimentation and Its Causes in Illinois." Water Resources Bulletin. Vo1.16, No.5.
Takahashi, Y., et al. 1981. "Development of Mitsubishi 'MACT' In-Furnace NO, Removal Process." Mitsubishi Heavv Industries. Ltd. Technical Review. Vol. 18, No. 2.
U.S. Department of Commerce. 1983. Population Census.
U.S. Geological Survey. 1986. "Water Resources Data - Illinois 1986.” U.S. Geological Survey Water Data. Report IL-86-2.
Wendt, J.O.L., C.V. Sternling and M.A. Matovich. 1973. "Reduction of Sulfur Trioxide and Nitrogen Oxides by Secondary Fuel Injection." Fourteenth Svmposium (International) on Combustion. Pittsburgh, Pennsylvania: The Combustion Institute.
6-2
APPENDIX A FLOODPLAIN/WETLANDS ASSESSMENT
A.1 Project Description
The proposed project is a field evaluation of the effectiveness of
gas reburning-sorbent injection technologies in controlling NO, and SO2
emissions from a coal fired boiler equipped with a cyclone combustor. The
evaluation will be conducted at City Water Light and Power (CWLP) Lakeside
Station. Lakeside Station consists of two coal-fired steam generating
electrical units with a total net generating capacity of 66 MW,. The project
will be conducted in Unit 7, a 33 MW, cyclone fired boiler. Lakeside Station
and the adjacent Dallman Station occupy a 75 acre site on the northwest shore
of Lake Springfield in Sangamon County, Illinois. Coal combustion and flue
gas cleaning wastes are currently transported to an on-site waste disposal
area located immediately north of Lake Springfield. This disposal area
includes three ash ponds for wet disposal of fly ash and bottom ash from the
two stations, and three dry landfill cells for disposal of dewatered flue gas
desulfurization sludge from Dallman Station. The Federal Emergency Management
Agency flood zone map of the Lakeside Station area shown in Figure A-l
indicates that the power station itself is not within the floodplain, but that
the waste disposal area is within the 100 year floodplain, i.e. an area with a
one percent chance of being flooded in any one year. The natural gas pipeline
to be constructed during the project will be entirely within plant boundaries
and will not traverse the floodplain.
The U.S. Fish and Wildlife Service map shown in Figure A-2 displays
wetlands near Lakeside Station, and Table A-l describes the wetland
classification codes used on the wetlands map. The power station area does
not contain wetlands, but the ash pond and dry landfill cells contain wetland
areas. The ash pond contains wetlands having the classification codes L2USCh
and LlUBHh, which stand for lacustrine littoral unconsolidated shore seasonal
diked/impounded wetlands and lacustrine limnetic unconsolidated bottom
permanent diked/impounded wetlands, respectively. The dry landfill cells
contain wetlands having the classification code PUBGh, which stands for
wetlands. The Illinois Department of Conservation, which compiled the
wetlands map for the U.S. Fish and Wildlife Service, has indicated that the
ash pond and landfill wetlands are labelled as such solely because they
contain standing water, and not because they support aquatic life. The ponds
and landfill cells were excavated for the purpose of waste disposal, and did
not contain standing water or support aquatic life prior to excavation,
The project is intended to demonstrate that gas reburning-sorbent
injection (GR-SI) technologies can provide a cost effective approach for the
control of NO, and SD2 emissions from coal-fired boilers. GR-SI involves the
introduction of natural gas above the main heat release zone in the boiler to
reduce the formation of NO,. Downstream of this point, burnout air and
limestone based sorbent are injected into the flue gas stream and the sorbent
reacts with SO2 to form calcium sulfate. The calcium sulfate is subsequently
removed along with the fly ash by the plant particulate control equipment and
transported to a disposal location. During the GR-SI demonstration, the
calcium sulfate along with the fly ash will be transported to an off-site
landfill. Lakeside Station waste streams are currently sluiced to an on-site
ash pond for disposal. The goals of the GR-SI system are to reduce NO, and
SO2 emissions by 60 percent and 50 percent, respectively.
Project construction will involve retrofit to the existing power
plant. All construction will take place in the immediate vicinity of the
boiler except pipeline installation, which will involve on-site construction
of a 1400 foot natural gas pipeline. Once equipment has been installed, the
GR-SI demonstration will operate for a period of 12 months.
To demonstrate the potential for retrofitting existing coal-fired
power plants to reduce air emissions, it was necessary to select an
appropriate plant for the GR-SI demonstration. After analysis of the
alternatives, as described in Section A.3, Lakeside Station was selected.
Because power plants require large amounts of cooling water, many plants such
as Lakeside were constructed near bodies of water and consequently are located
near or within floodplains.
A-5
A.2 Floodplain/Wetlands Effects
Effects Resultina from Construction
Construction of the GR-SI equipment itself will involve internal
structure retrofit and will not impact floodplain or wetland values. The
natural gas pipeline will be constructed entirely within the boundaries of the
site and will not traverse any floodplains or wetlands.
Effects Resultina from Ooeration
The GR-SI equipment will occupy existing structures and will not
block any floodways or otherwise impact the floodplain. The underground
natural gas pipeline will not impact the floodplain or wetlands. The only
other aspect of the project that could potentially impact the floodplain or
wetlands is activity in the ash pond and dry landfill cells.
Gas reburning is not expected to change the properties of either the
fly ash or bottom ash. Sorbent injection will not affect bottom ash, but the
fly ash will be altered in that it will contain appreciable amounts of calcium
sulfate and unreacted sorbent.
All ash from Unit 7 is currently sluiced to the on-site ash pond.
Ash from other Lakeside and Dallman units is sluiced to the same area. In
addition, dewatered scrubber sludge from Dallman Station is transported by
truck 'to the dry landfill cells in the waste disposal area. At present
operating conditions, Lakeside Unit 7 generates approximately 136,400 ft3
(3.13 acre-ft) of fly ash and bottom ash per year, while the total annual
waste generation rate for the CWLP plant is approximately 1,510,650 ft3/yr
(34.68 acre-ft/yr) of fly ash and bottom ash (sluiced to ponds) and 1,620,OOO
ft3/yr (37.19 acre-ft/yr) of dewatered scrubber sludge. During the GR-SI
demonstration, fly ash from Unit 7 will be collected dry and transported off-
site for disposal in a permitted landfill. Bottom ash will continue to be
sluiced to the ash pond. Lakeside Unit 7 will produce approximately 181,500
A-6
ft3 (4.17 acre-ft) of sorbent-modified fly ash and 91,700 ft3 (2.11 acre-ft)
of bottom ash during the one year field evaluation.
The project has been designed to minimize potential harm within the
floodplain and wetlands by limiting the amount of construction. Pipeline
construction will not occur in floodplains or wetlands. GR-SI project
operation will have no effect on above-ground land features and will have no
long-term impacts on the floodplain or wetlands. No lives or property will be
disrupted. Therefore, the project is expected to have negligible short- and
long-term effects on floodplain and wetland values.
A.3 Alternatives
The goal of this clean coal technology project is to demonstrate the
effectiveness of GR-SI technology for controlling NO, and SO2 emissions from
three different types of coal-fired boilers that represent the existing boiler
population. The no action alternative, i.e. not demonstrating GR-SI, limits
the options for controlling emissions from existing boilers. Two technologies
are currently used for SO2 control in coal-fired power plants: wet limestone
flue gas desulfurization and spray dryers. Both of these require
significantly more space for installation and are more costly to implement
than GR-SI, and both produce waste streams that require disposal
considerations similar to those for GR-SI. Current technology for NOx
emissions control involves control of local fuel/air stoichiometry to minimize
NO, formation. This technology has limited effectiveness and may reduce
boiler efficiency and boiler life if improperly applied. These limitations
associated with existing emissions control technologies emphasize the need for
additional options, such as GR-SI.
Site selection was performed using MEGABASE, a commercially available
computerized database of all fossil fuel fired utility boilers east of the
Mississippi River. MEGABASE indicated that there were 67 operational coal
A-7
fired utility boilers in Illinois as of January, 1980. Only seven of these were cyclone fired boilers with net generating capacities below 100 MW, net.
These seven boilers included:
0 CWLP Lakeside Units 7 and 8
0 CWLP Dallman Units 31 and 32
0 Marion Station Units 1, 2 and 3
Analysis of CWLP Lakeside Station indicated that the plant was not within the
floodplain and that any activities within the floodplain would result in
negligible impact. Neither the Marion nor the Dallman units offered any
advantage with respect to floodplain issues. The Marion units were used as
alternate boilers for the cyclone fired GR-SI demonstration.
A-8
APPENDIX 8
DOCUMENTATION OF CONTACTS
This appendix contains source data supporting information in the
Lakeside EA. Records of conversations with the U.S. Fish and Wildlife Service verifying the presence of threatened and endangered species are reproduced.
The letter documenting the description CWLP provided regarding the Lakeside
coal pile runoff pond is included. Soil survey information supplied by the
Soil Conservation Service is also included.
8-1
nergy and 53 nvironmental esearch Corporation
DATE: 9 /26/8b
CONTACT REPORT
ORIGINATOR: 5x.w AGWLML
- CONTACT BY: / TELEPHONE MEETING OTHER:
NAME, TITLE AND ORGANIZATION i&h ~~l(C*,qfj FL&l mr'cc
U.5. Fish tit-yj lu\ildIik ADDRESS AND TELEPHONE NUMBER
PURPOSE OR SUBJECT (Give project number if appropriate)
Lakrs\hr EIL' - Sn!&&~~ abcut e&.v,ya~ spe&cz.
SUMMARY:
0 3 :. IriT<J.‘2i,,.:l in .> I I1 yi ',l<:,, :::, (..( 7 f,
- 717~ wp 4,ll h;Ec (i(’ t: f&J rj,, ‘Th 25c.
t-5 l~~~ljltclt +-lo,- tb .ylcc:,,s ,.,
Cpz!I”J, ,5,,‘,:-i’
I>, T/d,. prc jrcl
ACTION:
DISTRIEUTION:
B-2
3622 Lyckan Parkway. Suite 5006 l Durham.NC 27707 l (919) 489-li26
nergy and ‘F, nvironmental esearch Corporation
CONTACT REPORT
DATE: 9/zdt?8 ORIGINATOR: .susav\ Aqra LdGl
CONTACT 8Y: L TELEPHONE ' MEETING OTHER:
NAME, TITLE AND ORGANIZATION &-,.& L.&c;5 R+nal LmL
-i&r, R&Ider- tij-;. F&l, u.nd Ic;;,dl;k >C~‘IW
ADDRESS AN0 TELEPHONE NUMBER
(612) 725 - 3276
PURPOSE OR SUBJECT (Give project number if appropriate)
L&e<& EIV - I~r~L~m&;cr\ ohkci er&nyd y\rlnt species
The Lakeside Coal Pile Runoff Pond (LCPRP) is a pond dug out of native materials. The pond holds approximately 600,000 gallons. The pond level is controlled by a flexible discharge hose attached to an adjustable cable on a gib.
The pond drains three distinctive areas. Two of these areas will become or are, parking and road areas. The third area will remain a coal handling area contributing a small amount of coal to the pond. The runoff from these areas flow overground until it is collected via ditches or underground pipes. Please see the attached drawing.
8-5
October 13, 1987 Page -3-
The discharge from the pond is intermittent. Current procedure regarding the pond calls for a 24-48 hour settling time after a major precipitation event. After the solids have settled, the pond is drained and-sampled according to the-NPDES permit provisions.
Request 4b - Seasonal average runoff flow rate.
Response 4b:
The average flow for the last year has been .019 MGD with flow occurring in 5 months. The average flow of the 5 months was .046 MCD.
Request 4c - Quantity of coal carried off by runoff
Response 4c:
Unknown.
Request 4d - Flow rate of discharge water if separate settling pond is used
Response 4d:
The maximum daily amount of flow measured was .36 MGD. The unit discharge rate of the pond has been estimated to be 30,000 CPU.
Reauest 5 - Potential change in sluice water flor; rate. GR/SI is expected to significantly increase the amount of flyash produced. How much additional sluice water would be required if the amount of flyash increased by approximately 50X?
Response 5:
CWLP, not having had any prior experience with CR/S1 technology, believes this question would be better answered by EER technical/engineering personnel.
B-6
October 13. 1987 Page -4-
1 believe submittal of these data answers all of your questions. If, however, you need additional information, please do not hesitate to contact me at (217) 786-4052. ,_
Sincerely,
Environmental Coordinator
LS/ej
cc: Jim Rechner Tom Beep Tom Booker
8-7
CITY WATER, LIGHT 6 POWER CA& Project No: 3964
Run No. Date (19871 Start Time (approx.1 Stop Time (approx.1
3 5 June2 June 3 3:20 pm 10:55 am 5:50 pm 12:lO pm
Particulate Concentration gr/dscf 0.0121
r lb/hr 22.5 lb/MBtu* 0.0254
*As calculated by the heat input method )
5-a
322 10.3 7.1 12.2
0.0056 0.0030 9.8 5.3 0.0126 0.0065
316 10.2 7.6 11.6
I I
CWLP Power Plant Schematic ,
\, / 1 - Coal Area\ _
011 WI.. Crusher Hours
Dallman Coal Pile
Lake Springfield
Runoff Conveyance Legend
Underground
--B-m Ditch
Figure B-l Lakeside Coal Pile Runoff Pond
B-9
united states Depaflment of AQrkXItUre
Soil Consewatlcm Service
40 Adloff Lane, Suite #4 Springfield, Illinois 62703
September 29, 1987
Peter Maly EER Corporation 18 Mason It-vine, California 92718
Dear Peter:
As per our phone conversation today, I am enclosing the following:
1. Soil Survey of Sangamon Co. 2. Sangamon Co. Prime Farmland Map Units 3. Aerial Photo of the Power Plant (Omitted) 4. Photocopy of the location in our Plat Book (Redrawn Page B-18) 5. Composite of 4 Soil Survey Maps (Redrawn Page B-19)
(Because 4 maps come together, we went ahead and photocopied them in that manner for you.
I hope this information will be of some help to you.
Sincerely,
Dan Towery - District Conservationist
OT/cmk
Enclosure
B-10
Soil Survey of
Sangamon County, Illinois
United States Department of Agriculture Soil Conservation Service in cooperation with Illinois Agricultural Experiment Station
B-11
This soil survey is a publication of the National Cooperative Soil Survey, a joint effort of the United States Department .of Agriculture and other federal agencies, state agencies including the Agricultural Experiment Stations, and local .agencies. The Soil Conservation Service has leadership for the federal part of the National Cooperative Soil Survey. In line with Department of Agrtcul- ture policies. benefits of this program are available to all, regardless of race, color. national origin, sex. religion, marital status, or age.
Major fieldwork for this soil survey was performed in the period April 1968 through June 1976. Soil names and descriptions were approved in January 1977. Unless othenvke indicated, statements in this publication refer to condi- tions in the survey area in 1977. This survey was made cooperatively by the Soil Conservation Service and the Illinois Agricultural Experiment Station. It is part of the technical assistance furnished to the Sangamon County Soil and Water Conservation District. This survey was financed in part by the County Board of Sangamon County, Illinois.
Soil maps in this survey may be copied without permission. Enlargement of these maps. however, could cause misunderstanding of the detail of mapping. If enlarged, maps do not show the small areas of contrasting soils that could have been shown at a larger scale.
This soil survey is Illinois Agricultural Experiment Station Soil Report No. 111.
B-12
Index to map units ........................................................ Summary of tables.. ...................................................... Foreword.. ....................................................................... General nature of the area.. ..........................
Climate survey
.......................................................................... Physiography and History and
......................................................................... How thie survey was made.. ....................................... General roll ma
Descriptions for broad land use planning .......
0 P units.. ......................................... Broad land
map use considerations.. ................................
Sol1 maps for detailed planning ................................. Soil descriptions ..........................................................
Use and management of the soils.. .......................... Crops and pa%ture.. ..................................................... Woodland management and ............... Windbreaks
properties.. .............................................. and chemical properties.. ............................
Soil and water features.. ............................................. Engineering test data ..................................................
Classiflcatlon of the soils.. .......................................... Soll series and morphology.. ......................................
Alvin series ................................................................... Assumption series ....................................................... Broadwell series .......................................................... Camden series.. ........................................................... Cowden series ............................................................. Denny series ................................................................ Edinburg series ............................................................
Tama silt loam, 0 to 2 percent slopes Tama silt loam, 2 to 4 percent slopes Tama silt loam, 4 to 7 percent slopes, eroded
Radford silt loam
Huntsville silt loam
Sawmill silty clay loam
Cowden silt loam
Alvin fine sandy loam, 4 to 7 percent 5
Camden silt loam, 0 to 2 percent slopes Camden silt loam, 1 to 4 percent slopes
Shiloh silty clay loam
Elburn silt loam
Plan0 silt loam, 0 to 2 percent slopes Plan0 silt loam, 1 to 4 percent slopes
Sexton silt loam
Kendall silt loam
Hartsburg silty clay loam
Edinburg silty clay loam
Ipava silt loam
Denny silt loam
Virden silt loam and silty clay loam
Harpster silty clay loam
Sable silty clay loam
Ross loam
lopes
Assumption silt loam, 4 to 7 percent slopes
Fayette silt loam, 2 to 4 percent slopes
8-15
J A/ 284 Tice silty clay loam
.-. -y 451 Lawson silt loam
567C Elkhart silt loam, 4 to 7 percent slopes
684B Broadwell silt loam, 2 to 4 percent slopes 684C2 Broadwell silt loam, 4 to 7 percent slopes, eroded
685B Middletown silt loam, 1 to 4 percent slopes
L/ Evaluate locally. Qualifies as prime farmland if flooding is less frequent than once in two years during the growing season and the soil is drained.